
PLN geothermal and hydro attributes anchor Scope 2 buying
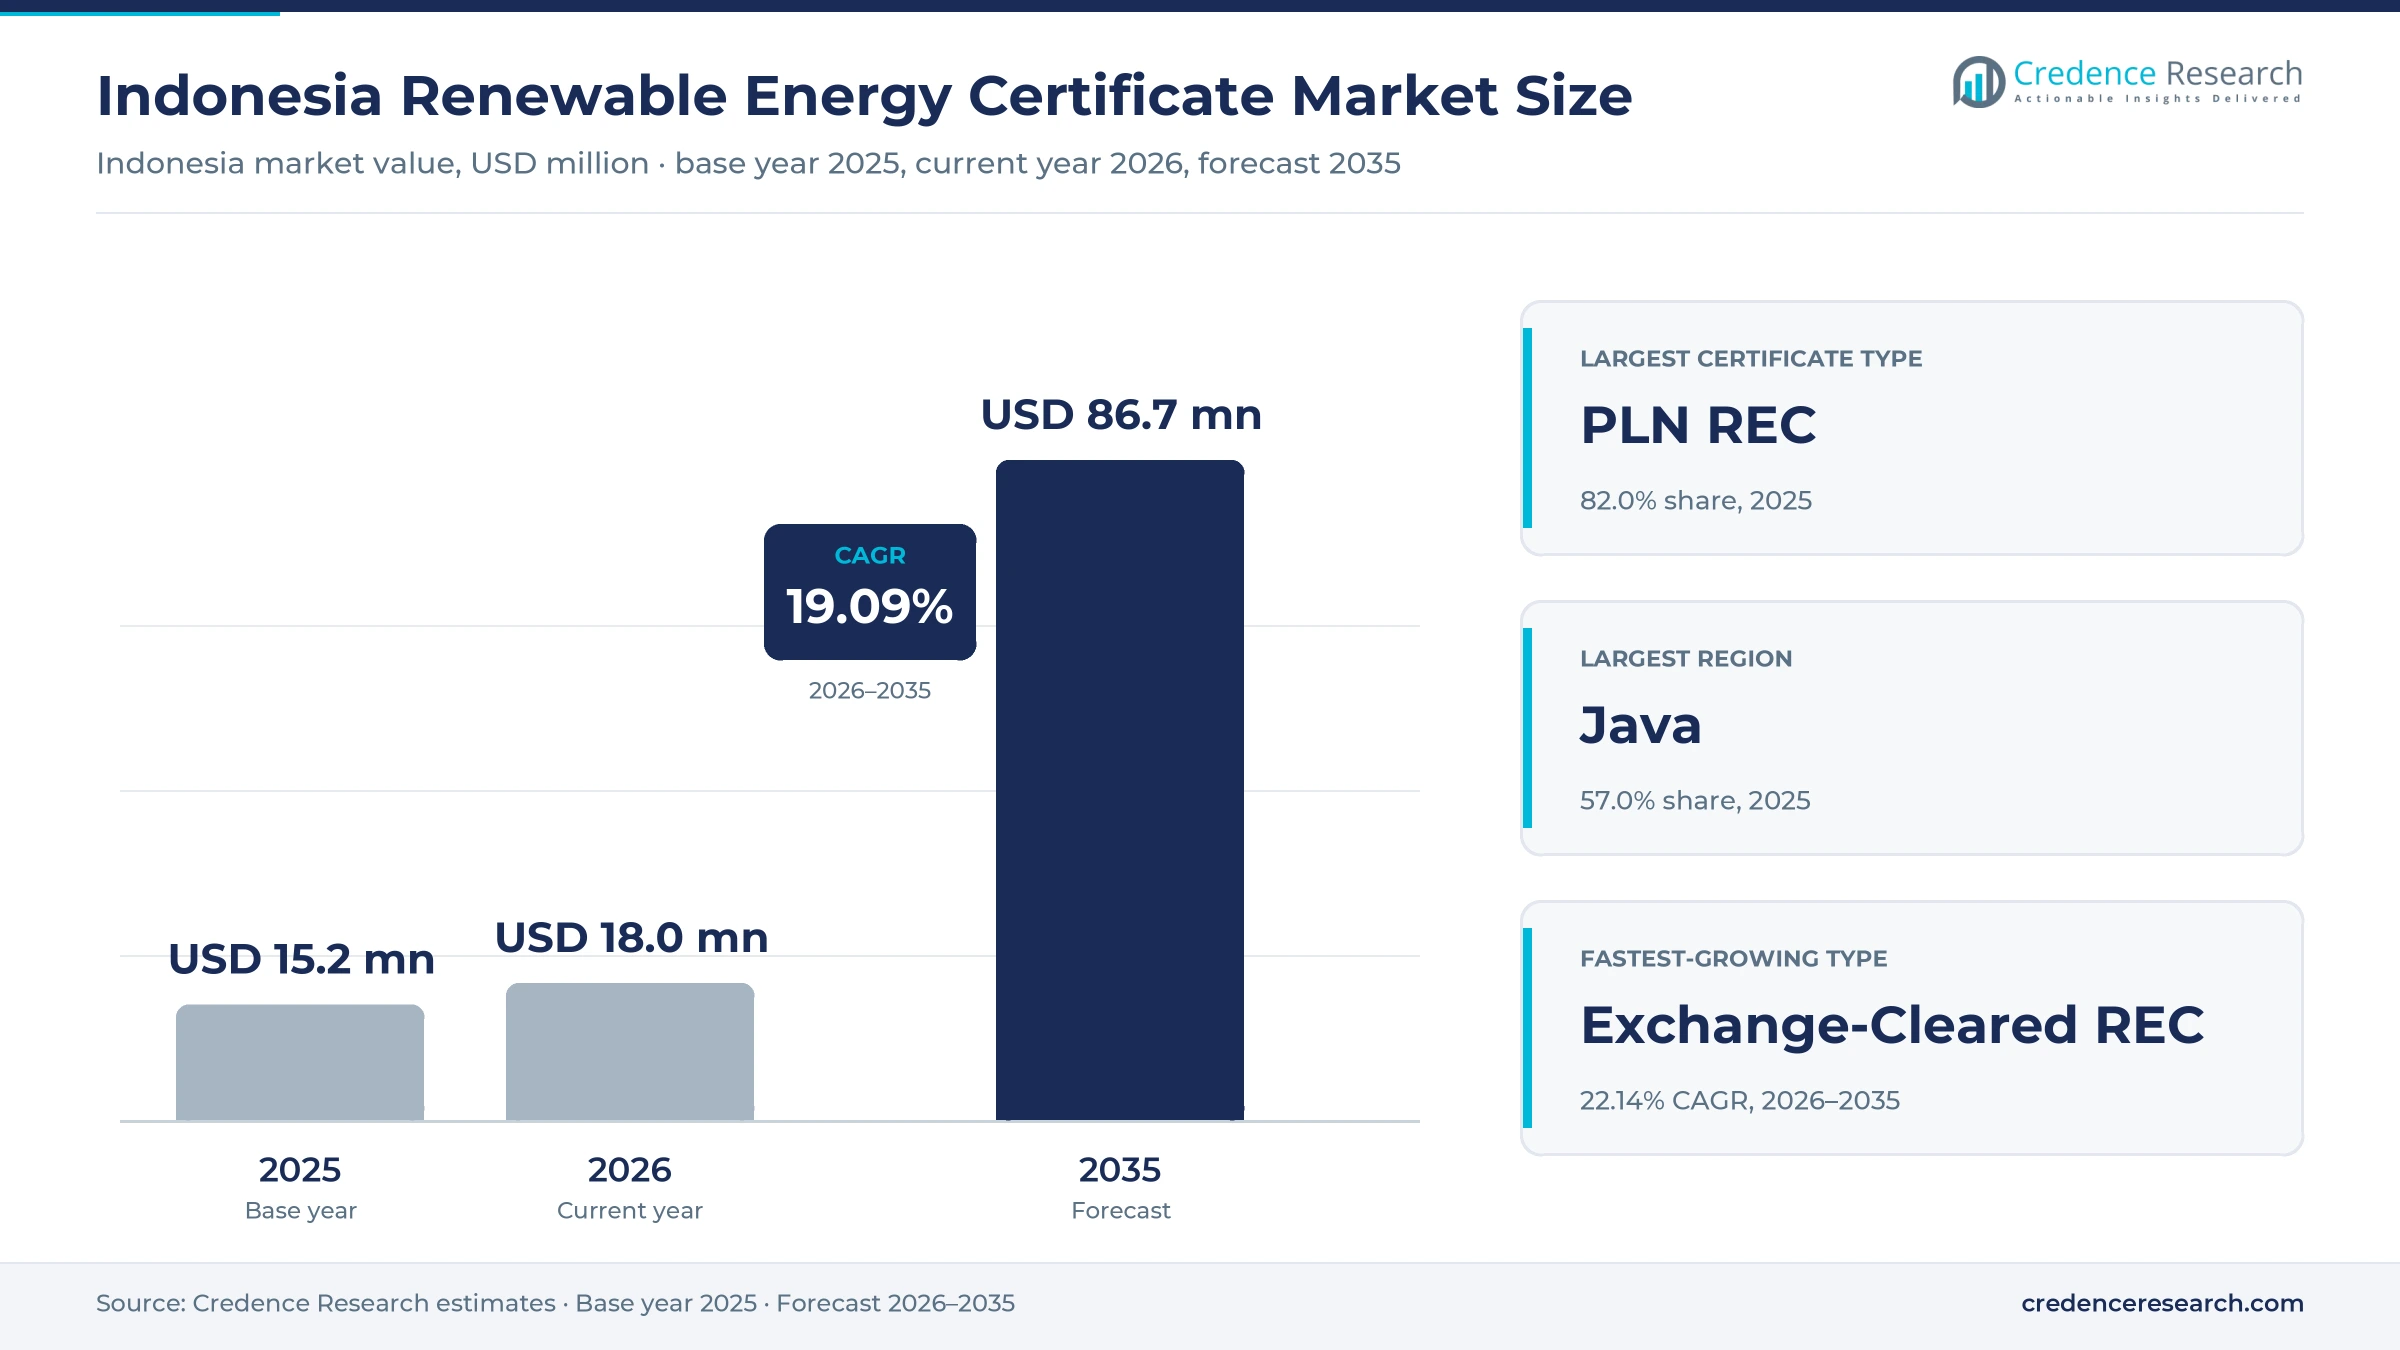
The Indonesia renewable energy certificate market was valued at USD 15.2 million in 2025 and is projected to increase from USD 18.0 million in 2026 to USD 86.7 million by 2035, registering a CAGR of 19.09% during 2026–2035. Demand comes from manufacturers, miners and smelters, data center operators, property owners and service firms that buy certificates to report renewable electricity under Scope 2 rules. Java held the largest regional share, 57.0% in 2025, because the island hosts most industrial load and most purchases are made on the Java grid. Sulawesi is the fastest-growing region at 20.15% a year, as nickel smelting and geothermal supply expand there. PLN sold 6.43 TWh of certificates in 2025, up 19.65% from 2024, through its Green Energy as a Service offer. Trading is also widening, because Indonesia Commodity and Derivatives Exchange opened a regulated certificate market in July 2025.
Which certificates, buyers and sales channels does the estimate cover?
The estimate measures the value of renewable electricity attribute certificates sold to buyers in Indonesia, where one certificate represents one MWh of renewable generation. It covers PLN certificates, I-REC(E) certificates issued for independent, captive and rooftop plants, and certificates cleared on a licensed exchange, valued at the prices that end users pay.
The estimate excludes electricity bills, power purchase agreement energy charges, carbon credits and emission reduction certificates. The value chain runs from geothermal, hydro, solar and bioenergy plants through issuers, registries, brokers and exchanges to industrial, digital and commercial buyers that redeem the certificates.
Indonesia Renewable Energy Certificate Market Insights
- The Indonesia renewable energy certificate market was valued at USD 15.2 million in 2025 and is projected to reach USD 86.7 million by 2035, registering a CAGR of 19.09% during 2026–2035.
- Java held a 57.0% share of 2025 value, because the island carries most industrial load and most certificate purchases are made on the Java grid.
- PLN certificates led with 82.0% of 2025 value, because the utility sells them directly to customers at a fixed list price.
- PLN customers buying green electricity rose to 7,354 in 2024 from 3,378 in 2023, a 117% increase, as exporters set renewable targets.
- Indonesia Commodity and Derivatives Exchange opened a regulated certificate market in July 2025, linking its platform to the Evident I-REC and APX TIGRs registries.
PLN RECs lead while exchange-cleared lots grow fastest
Why do PLN certificates dominate value?
Based on certificate type, the market is categorized into PLN REC, I-REC(E) and exchange-cleared REC. PLN REC led with 82.0% of 2025 value, because the state utility owns most registered supply and sells certificates on request through its customer service channels. Exchange-Cleared REC grows fastest at 22.14% a year, because licensed trading opened in July 2025 and exchange members now list lots from independent plants.
How do geothermal and hydropower split supply?
Based on energy source, the market is categorized into hydropower, geothermal, solar and bioenergy. Geothermal led with 48.0% of 2025 value, because PLN draws certificates from five high-output geothermal plants that run around the clock. Hydropower follows closely, because large reservoirs on Java supply much of the registered volume. Solar grows fastest at 21.82% a year, as floating and rooftop solar add eligible generation.
Why do manufacturers outspend smelters on certificates?
Based on end user, the market is categorized into manufacturing and industrial, mining and smelting, data centers and digital services, commercial real estate and retail, and financial and professional services. Manufacturing and Industrial led with 44.0% of 2025 value, because exporters must report supply chain emissions. Data Centers and Digital Services grow fastest at 21.18% a year, as hyperscale campuses open near Jakarta.
How do buyers procure certificates in Indonesia?
Based on procurement channel, the market is categorized into direct utility purchase, exchange-based trading, accredited participant or broker, and bundled green supply. Direct Utility Purchase led with 78.0% of 2025 value, because PLN customers buy through their existing electricity accounts and pay the published list price. Exchange-Based Trading grows fastest at 22.07% a year, as exchange members list certificate lots and buyers seek transparent auction prices.
| Segment Group | Leading Sub-segment | Share, 2025 | Fastest-growing Sub-segment | CAGR, 2026–2035 |
|---|---|---|---|---|
| By Certificate Type | PLN REC | 82.0% | Exchange-Cleared REC | 22.14% |
| By Energy Source | Geothermal | 48.0% | Solar | 21.82% |
| By End User | Manufacturing and Industrial | 44.0% | Data Centers and Digital Services | 21.18% |
| By Procurement Channel | Direct Utility Purchase | 78.0% | Exchange-Based Trading | 22.07% |
Request a Free Sample
Fill in your details and we'll send you a free sample report.
- Sample data tables & charts
- Research methodology
Scope 2 targets and new green plants lift REC demand
How does corporate Scope 2 decarbonization lift purchases?
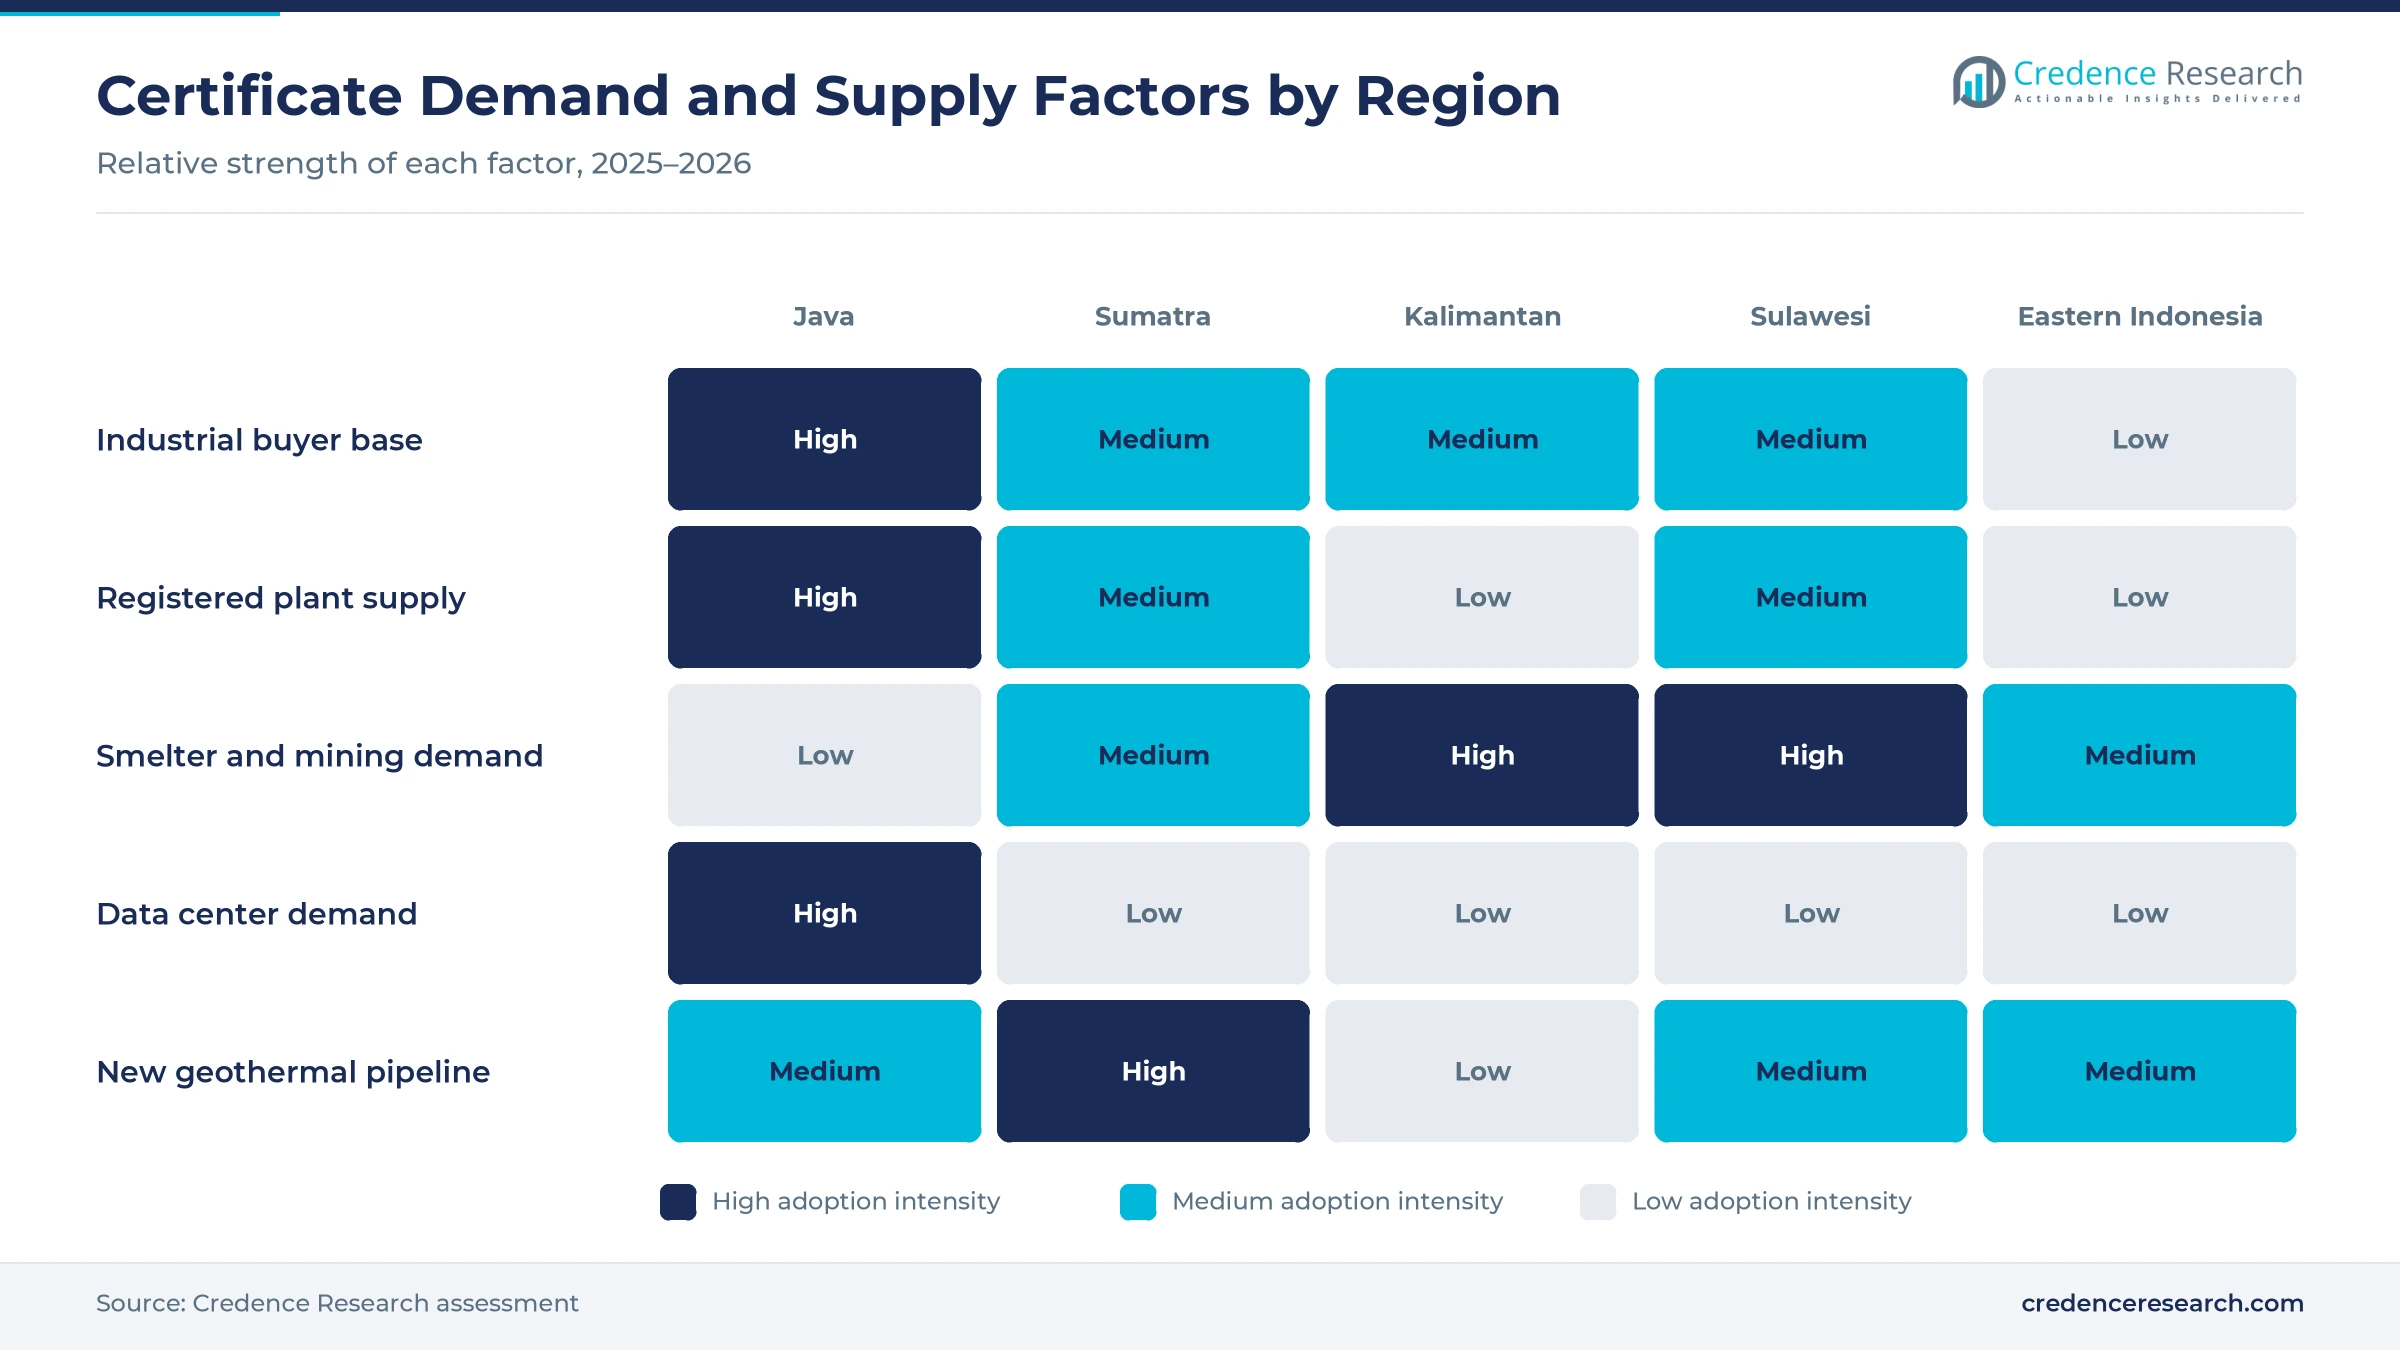
Multinational buyers and their Indonesian suppliers need proof of renewable electricity, which turns Scope 2 targets into certificate demand. Renewables supplied only 19% of the 348,977 GWh generated nationally in 2023, according to IRENA statistics, so the grid average remains carbon-heavy for reporting. PLN customers buying green electricity rose to 7,354 in 2024 from 3,378 in 2023, an increase of 117%. Named buyers include Nike, Hyundai Motor Manufacturing Indonesia, Ajinomoto Indonesia, Frisian Flag Indonesia and HM Sampoerna, which all supply export or brand-sensitive markets. As a result, manufacturing and industrial buyers held 44.0% of 2025 value, because certificate purchases let them report renewable power without changing their grid connection.
Why does expansion of eligible renewable supply matter?
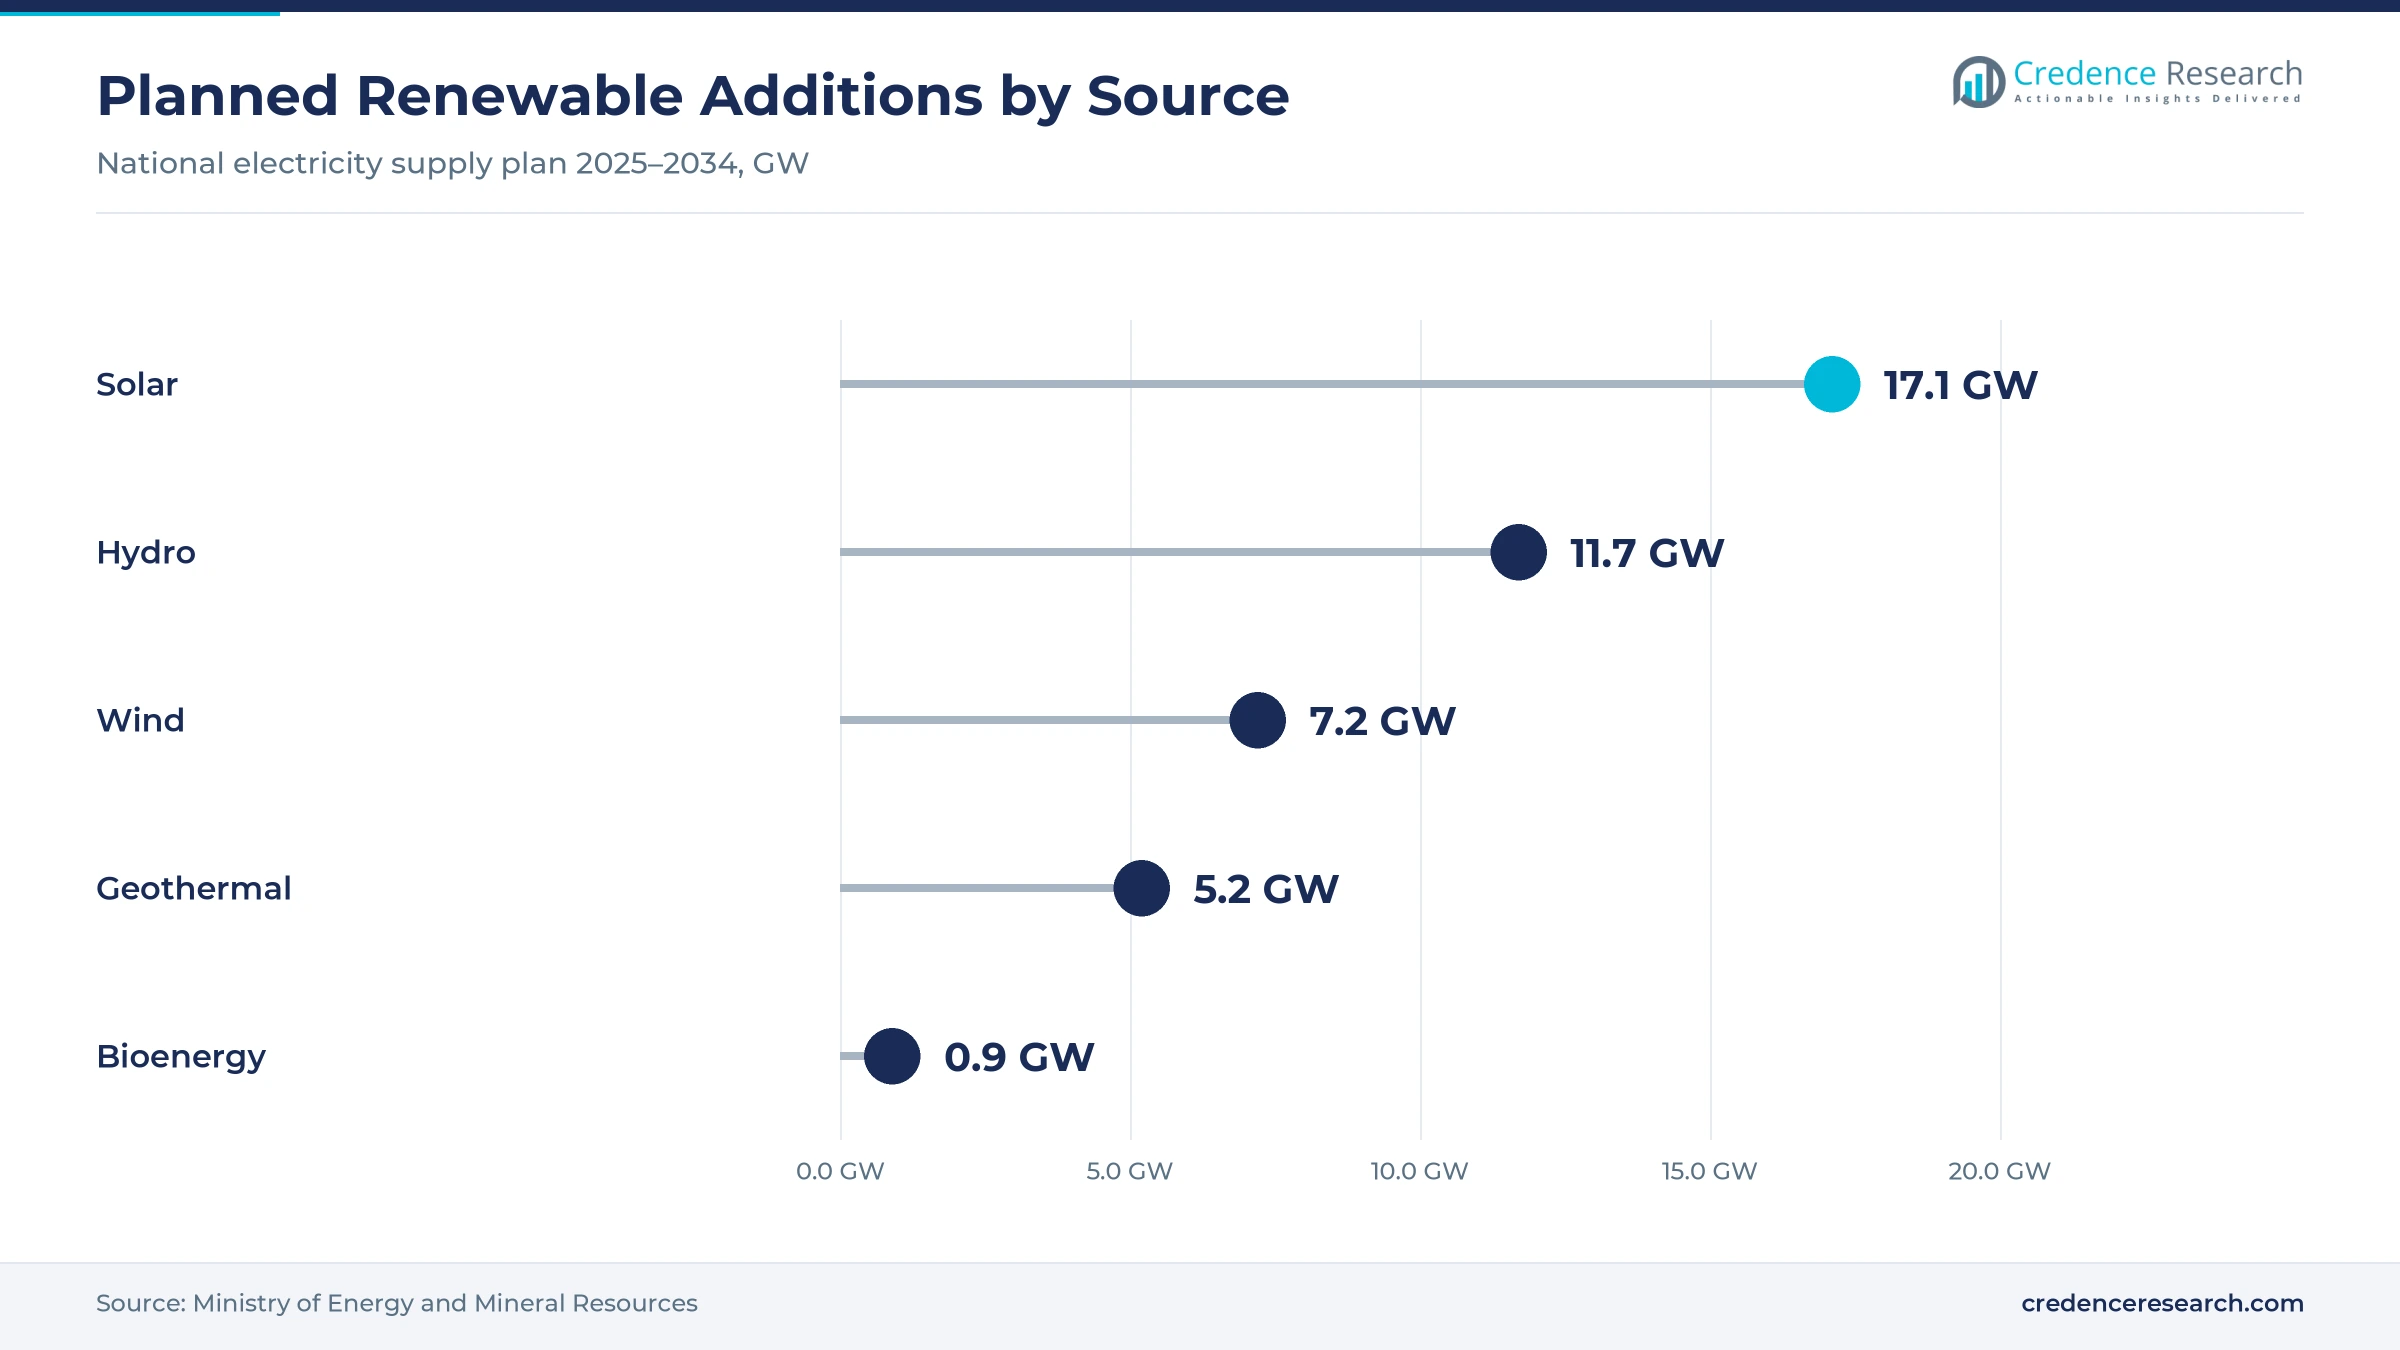
More registered plants mean more certificates for sale, which lets PLN meet rising orders without rationing. PLN supplied certificate customers from eight plants in early 2025 but from 12 plants by January 2026, adding the Ijen geothermal plant and the Cirata floating solar plant. The national plan for 2025 to 2034 adds 42.1 GW of renewable capacity, including 17.1 GW of solar and 11.7 GW of hydro, according to the Ministry of Energy and Mineral Resources. About 73% of total new capacity is planned with independent power producers, which widens I-REC(E) supply. In turn, solar grows fastest among energy sources at 21.82% a year, as utility and rooftop projects register output.
How do accessible utility pricing and tracking widen adoption?
A low, published price and a simple purchase process let smaller firms buy certificates alongside large industrial accounts. PLN prices one certificate, equal to 1,000 kWh of renewable electricity, at IDR 35,000, and customers can buy without changing their electricity infrastructure. Each certificate is tracked on the APX TIGRs registry in the United States, which supports claims under international reporting frameworks. Cumulative PLN sales reached 13.68 TWh by June 2025, up 14% from June 2024, according to PLN. As a result, direct utility purchase held 78.0% of 2025 value, because customers add certificates to their existing PLN service.
Why do mining and smelting buyers set the pace of volume?
Heavy industry buys certificates in very large blocks, which concentrates national volume in a small group of accounts. About 55% of PLN certificate sales in December 2025 came from its ten largest buyers, according to PLN figures reported by Kontan. Single buyers purchased from 93,966 MWh to 779,000 MWh, and the largest buyers came from mining, manufacturing, chemicals, pulp and paper and food processing. Named customers include PT Agincourt Resources, PT Smelting and PT Ceria Metalindo Prima, which supply metals to export markets. In turn, mining and smelting held a large share of 2025 value, while smelter regions such as Sulawesi and Kalimantan grow faster than Java.
Exchange trading and IPP attributes widen supply
How is the shift toward exchange trading changing price discovery?
Certificates are moving from fixed utility sales toward exchange auctions, which creates visible price signals for buyers and sellers. Indonesia Climate Exchange ran its first voluntary auction of 1,050 MWh from geothermal and micro hydro plants in August 2023, according to ICDX Group. The auction opened at IDR 35,000 and closed at IDR 38,000, a gain of 8.57%. Indonesia Commodity and Derivatives Exchange then opened a regulated certificate market in July 2025 after approval from the trade futures regulator, Bappebti. As a result, exchange-based trading grows fastest among channels at 22.07% a year, alongside wider carbon credit trading platforms.
Why is the rise of bundled green supply for data centers notable?
Hyperscale and colocation operators now pair long-term renewable supply with certificates, which creates bundled demand. Microsoft holds a 10-year contract with PLN for up to 200 MW of renewable electricity, including 100 MW of solar, reported in February 2026. BDx Indonesia signed a 30 MVA supply agreement with PLN in June 2025 for campuses in South Jakarta and Jatiluhur, where its CGK4 site is planned at 500 MW. Microsoft also launched its Indonesia Central cloud region in May 2025. In turn, data centers and digital services grow fastest among end users at 21.18% a year, as operators of each green data center need verified renewable claims.
Can independent and rooftop plants open new I-REC(E) supply?
Clear attribute rights let private generators issue certificates, which opens supply beyond the state utility. Ministerial Regulation No. 5 of 2025 states that environmental attribute rights follow applicable law or contracts such as power purchase agreements, according to the International Tracking Standard Foundation. The foundation then resumed I-REC(E) issuance for rooftop solar devices in May 2025, after a pause linked to the 2024 rooftop rule. The Green Certificate Company acts as the issuer for Indonesia. As a result, I-REC(E) certificates grow faster than PLN certificates, while independent producers gain a new revenue stream.
Is there room to grow through new geothermal capacity?
Geothermal plants run around the clock, which makes them attractive certificate sources for heavy industry. Medco Power Indonesia and Ormat began commercial operation of the first 35 MW at Ijen in East Java in February 2025, out of a planned 110 MW. Pertamina Geothermal Energy prepared its 55 MW Lumut Balai Unit 2 in South Sumatra in 2025, targeting 1.7 GW of capacity by 2034. Barito Renewables Energy secured a USD 300 million loan in July 2026 for the Suoh Sekincau and Hamiding projects. In turn, geothermal power should remain the largest certificate source, with 48.0% of 2025 value.
Credibility, registered capacity and rules set limits
How do credibility concerns affect buyer confidence?
Some sustainability teams question whether low-priced certificates from older hydro and geothermal plants drive new renewable capacity. Buyers with strict reporting rules feel this risk most, because their claims face audit and public scrutiny. As a result, some firms add long-term supply contracts or prefer certificates from newer plants. Issuers respond with registry tracking, plant disclosure and vintage information. Clear labeling of plant age should help buyers choose certificates that match their climate targets.
Why does limited registered capacity restrict supply?
Only a small share of installed renewable capacity is registered in certificate registries, so most renewable generation in the country cannot yet carry a certificate. Large buyers feel this most, because a few accounts take a large share of available volume each year. In turn, supply could tighten if purchases rise faster than registrations. PLN responds by adding plants such as Ijen and Cirata floating solar to its program. Wider registration of private plants would ease this constraint before 2030.
How does pending legislation create policy uncertainty?
The draft New and Renewable Energy Law includes renewable portfolio standards and certificate purchase obligations, but details depend on a later government regulation. Utilities, generators and buyers cannot yet plan around a compliance market, which slows long-term contracting. As a result, demand remains voluntary and tied to corporate targets for now. The industry responds by building exchange and registry links ahead of final rules. Clear obligations would add a durable compliance layer to demand.
Why do regional grid differences complicate purchases?
Most certificate supply and purchases sit on the Java grid, while many smelters operate on smaller island systems. Buyers in Sulawesi, Kalimantan and Eastern Indonesia may want certificates from plants on their own grid for stronger claims. In turn, local supply gaps can limit buyer choice outside Java. PLN responds by listing plants such as Lahendong and Bakaru for certificate sales. More regional plant registrations should match supply to growing island demand.
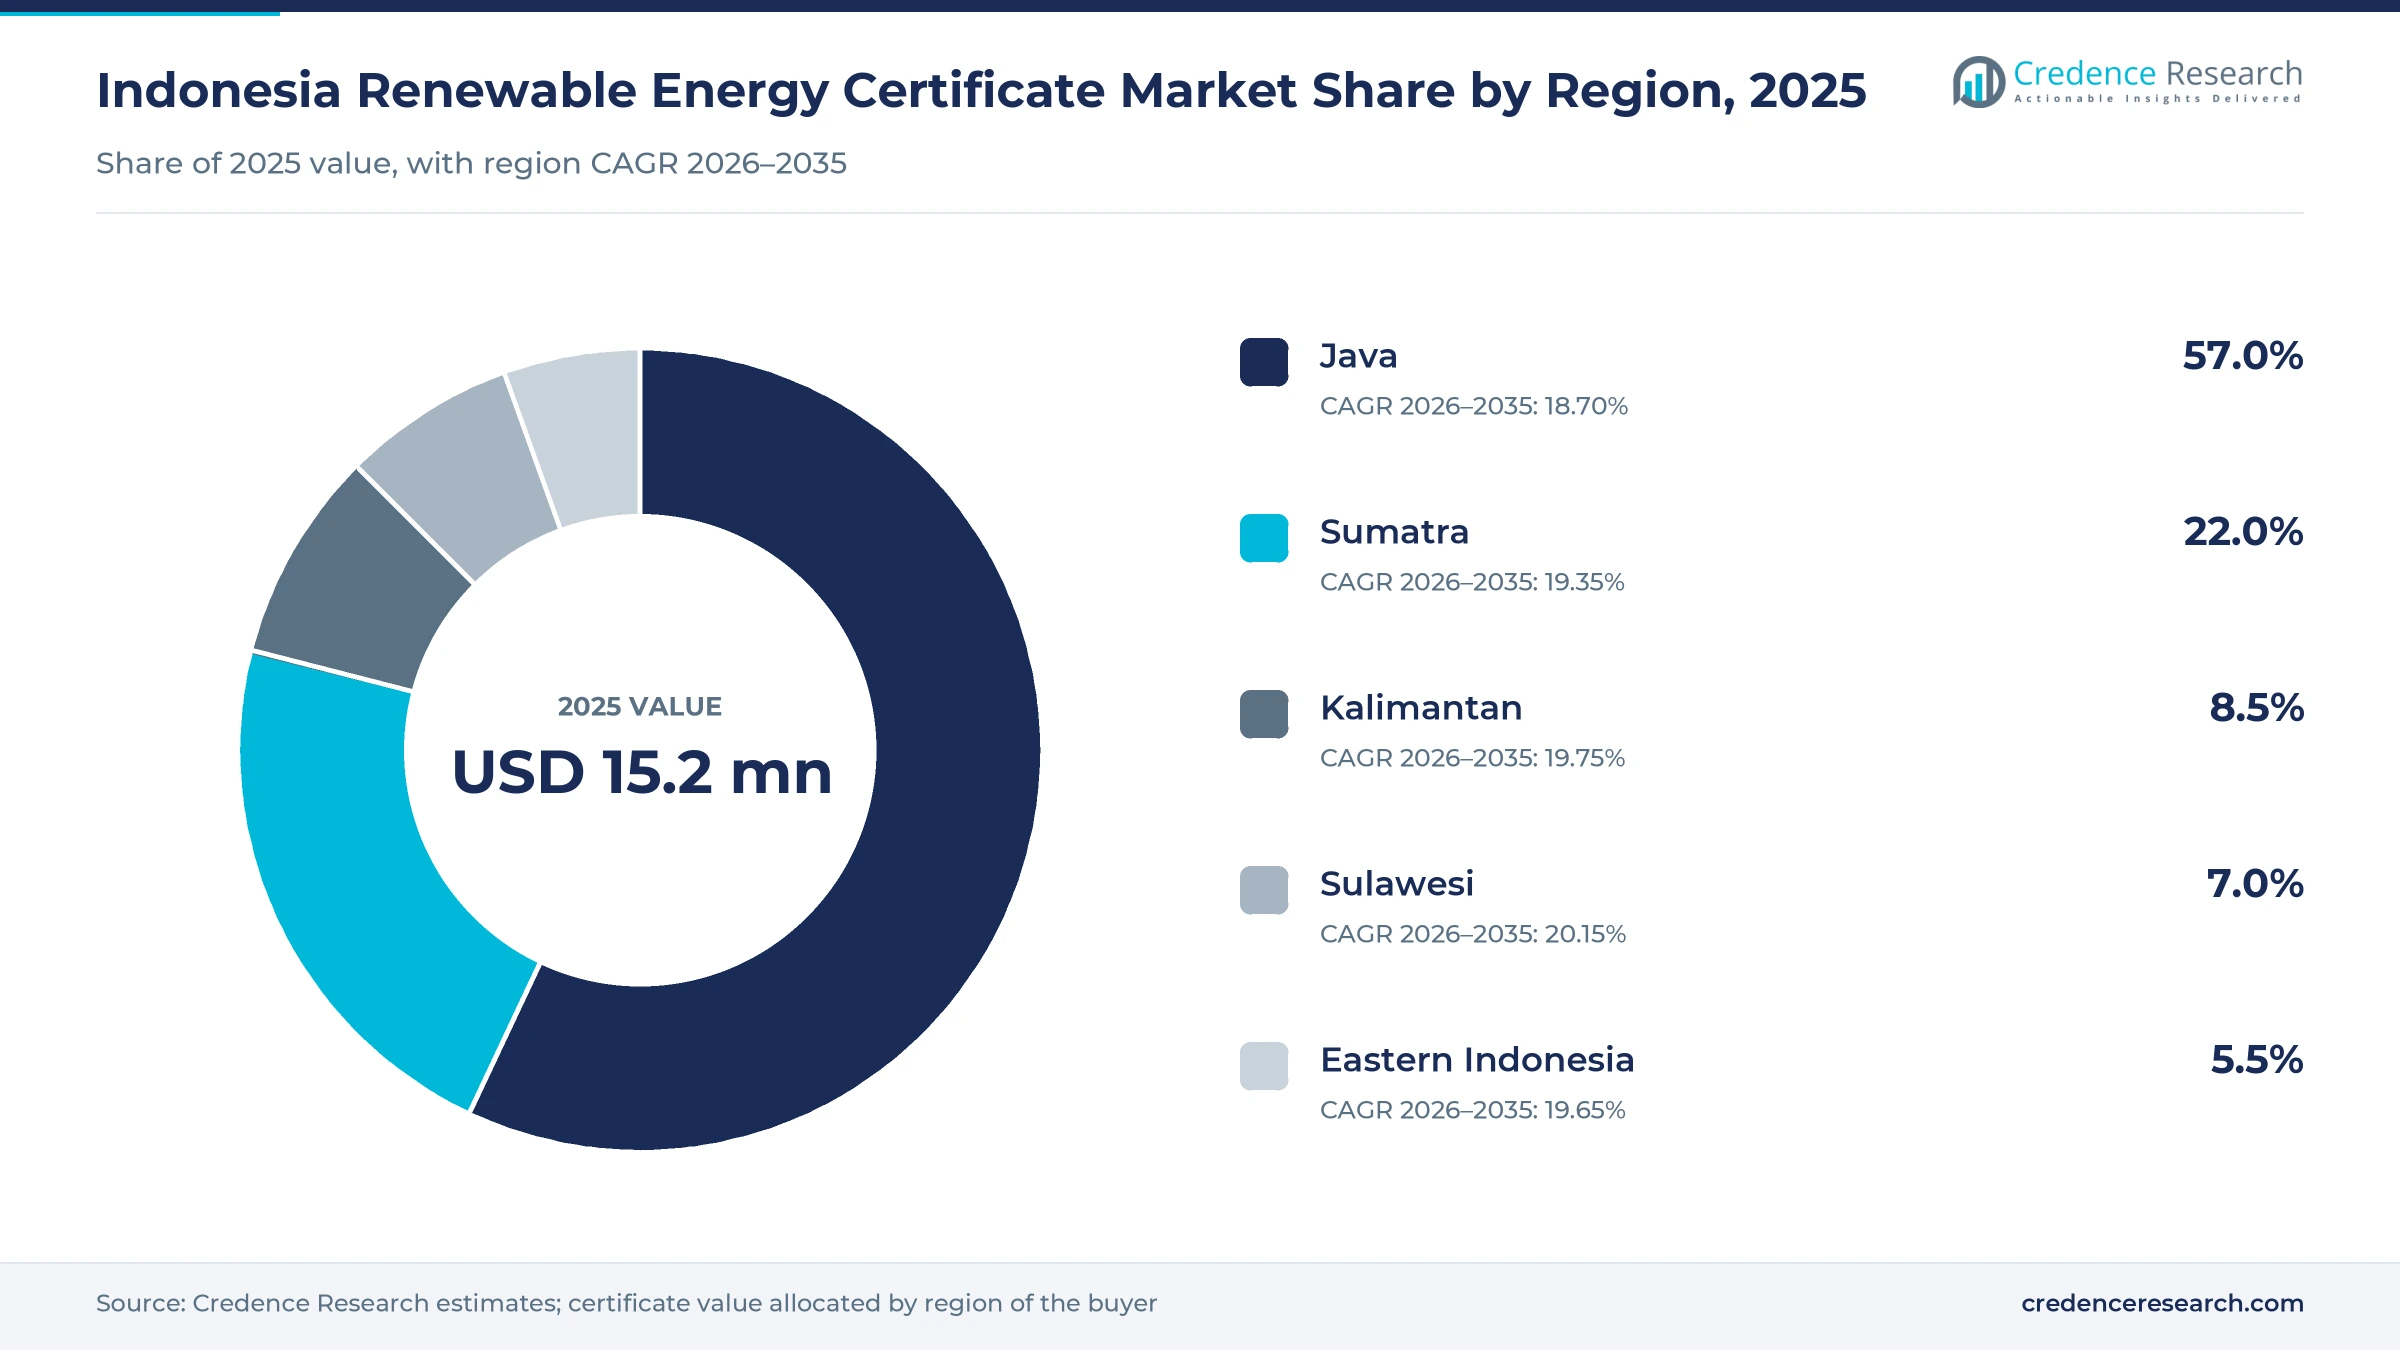
Java leads purchases while Sulawesi grows fastest
| Region | Value, 2025 (USD million) | Share, 2025 | CAGR, 2026–2035 |
|---|---|---|---|
| Java | 8.7 | 57.0% | 18.70% |
| Sumatra | 3.3 | 22.0% | 19.35% |
| Kalimantan | 1.3 | 8.5% | 19.75% |
| Sulawesi | 1.1 | 7.0% | 20.15% |
| Eastern Indonesia | 0.8 | 5.5% | 19.65% |
Why does Java hold the largest share of purchases?
Java held 57.0% of 2025 value and grows at 18.70% a year, because the island carries most industrial load and most certificate purchases are made on the Java grid. Supplying plants on the island include the Kamojang geothermal plant, the Saguling and Cirata hydro plants in West Java and the Ijen plant in East Java. The Cirata plant built with floating solar panels alone has 192 MWp of capacity and opened in November 2023. As a result, Java buyers can source certificates from local geothermal, hydro and solar generation.
How does Sumatra build on geothermal and hydro supply?
Sumatra held 22.0% of 2025 value and grows at 19.35% a year, because pulp, paper, plantation and manufacturing buyers sit close to geothermal supply. The Ulubelu geothermal plant in Lampung, rated at 110 MW, supplies PLN certificate customers. Arkora Hydro started its 5.4 MW Kukusan 2 run-of-river plant in Lampung in February 2026. In turn, Sumatra adds new eligible supply as Lumut Balai and Suoh Sekincau develop.
Why does Kalimantan matter for mining buyers?
Kalimantan held 8.5% of 2025 value and grows at 19.75% a year, because coal and mineral producers there face supply chain emission questions from buyers. PT Borneo Indobara bought 19,056 certificates through PLN in South and Central Kalimantan in 2023, one of the early mining purchases. As a result, mining accounts in the region buy large blocks of certificates to lower reported electricity emissions.
How does Sulawesi grow fastest among regions?
Sulawesi held 7.0% of 2025 value and grows fastest at 20.15% a year, because nickel smelters and processing plants are adding electricity demand. The Lahendong geothermal plant in North Sulawesi has six units totaling 120 MW and carries a certificate quota of 35,960 units. PLN certificate supply plants sit in both North and South Sulawesi. In turn, local supply supports island-specific claims for smelter buyers.
What drives demand in Eastern Indonesia?
Eastern Indonesia held 5.5% of 2025 value and grows at 19.65% a year, because mining, smelting and public buildings form a smaller but expanding demand base. PLN certificate supply plants are spread as far as Papua and East Nusa Tenggara, according to GoodStats data on the program. Barito Renewables Energy is also financing the Hamiding geothermal project in North Maluku. As a result, new geothermal supply should widen local certificate options after 2030.
PLN volumes, ICDX trading and new plants mark 2025
| Development | Status and market relevance |
|---|---|
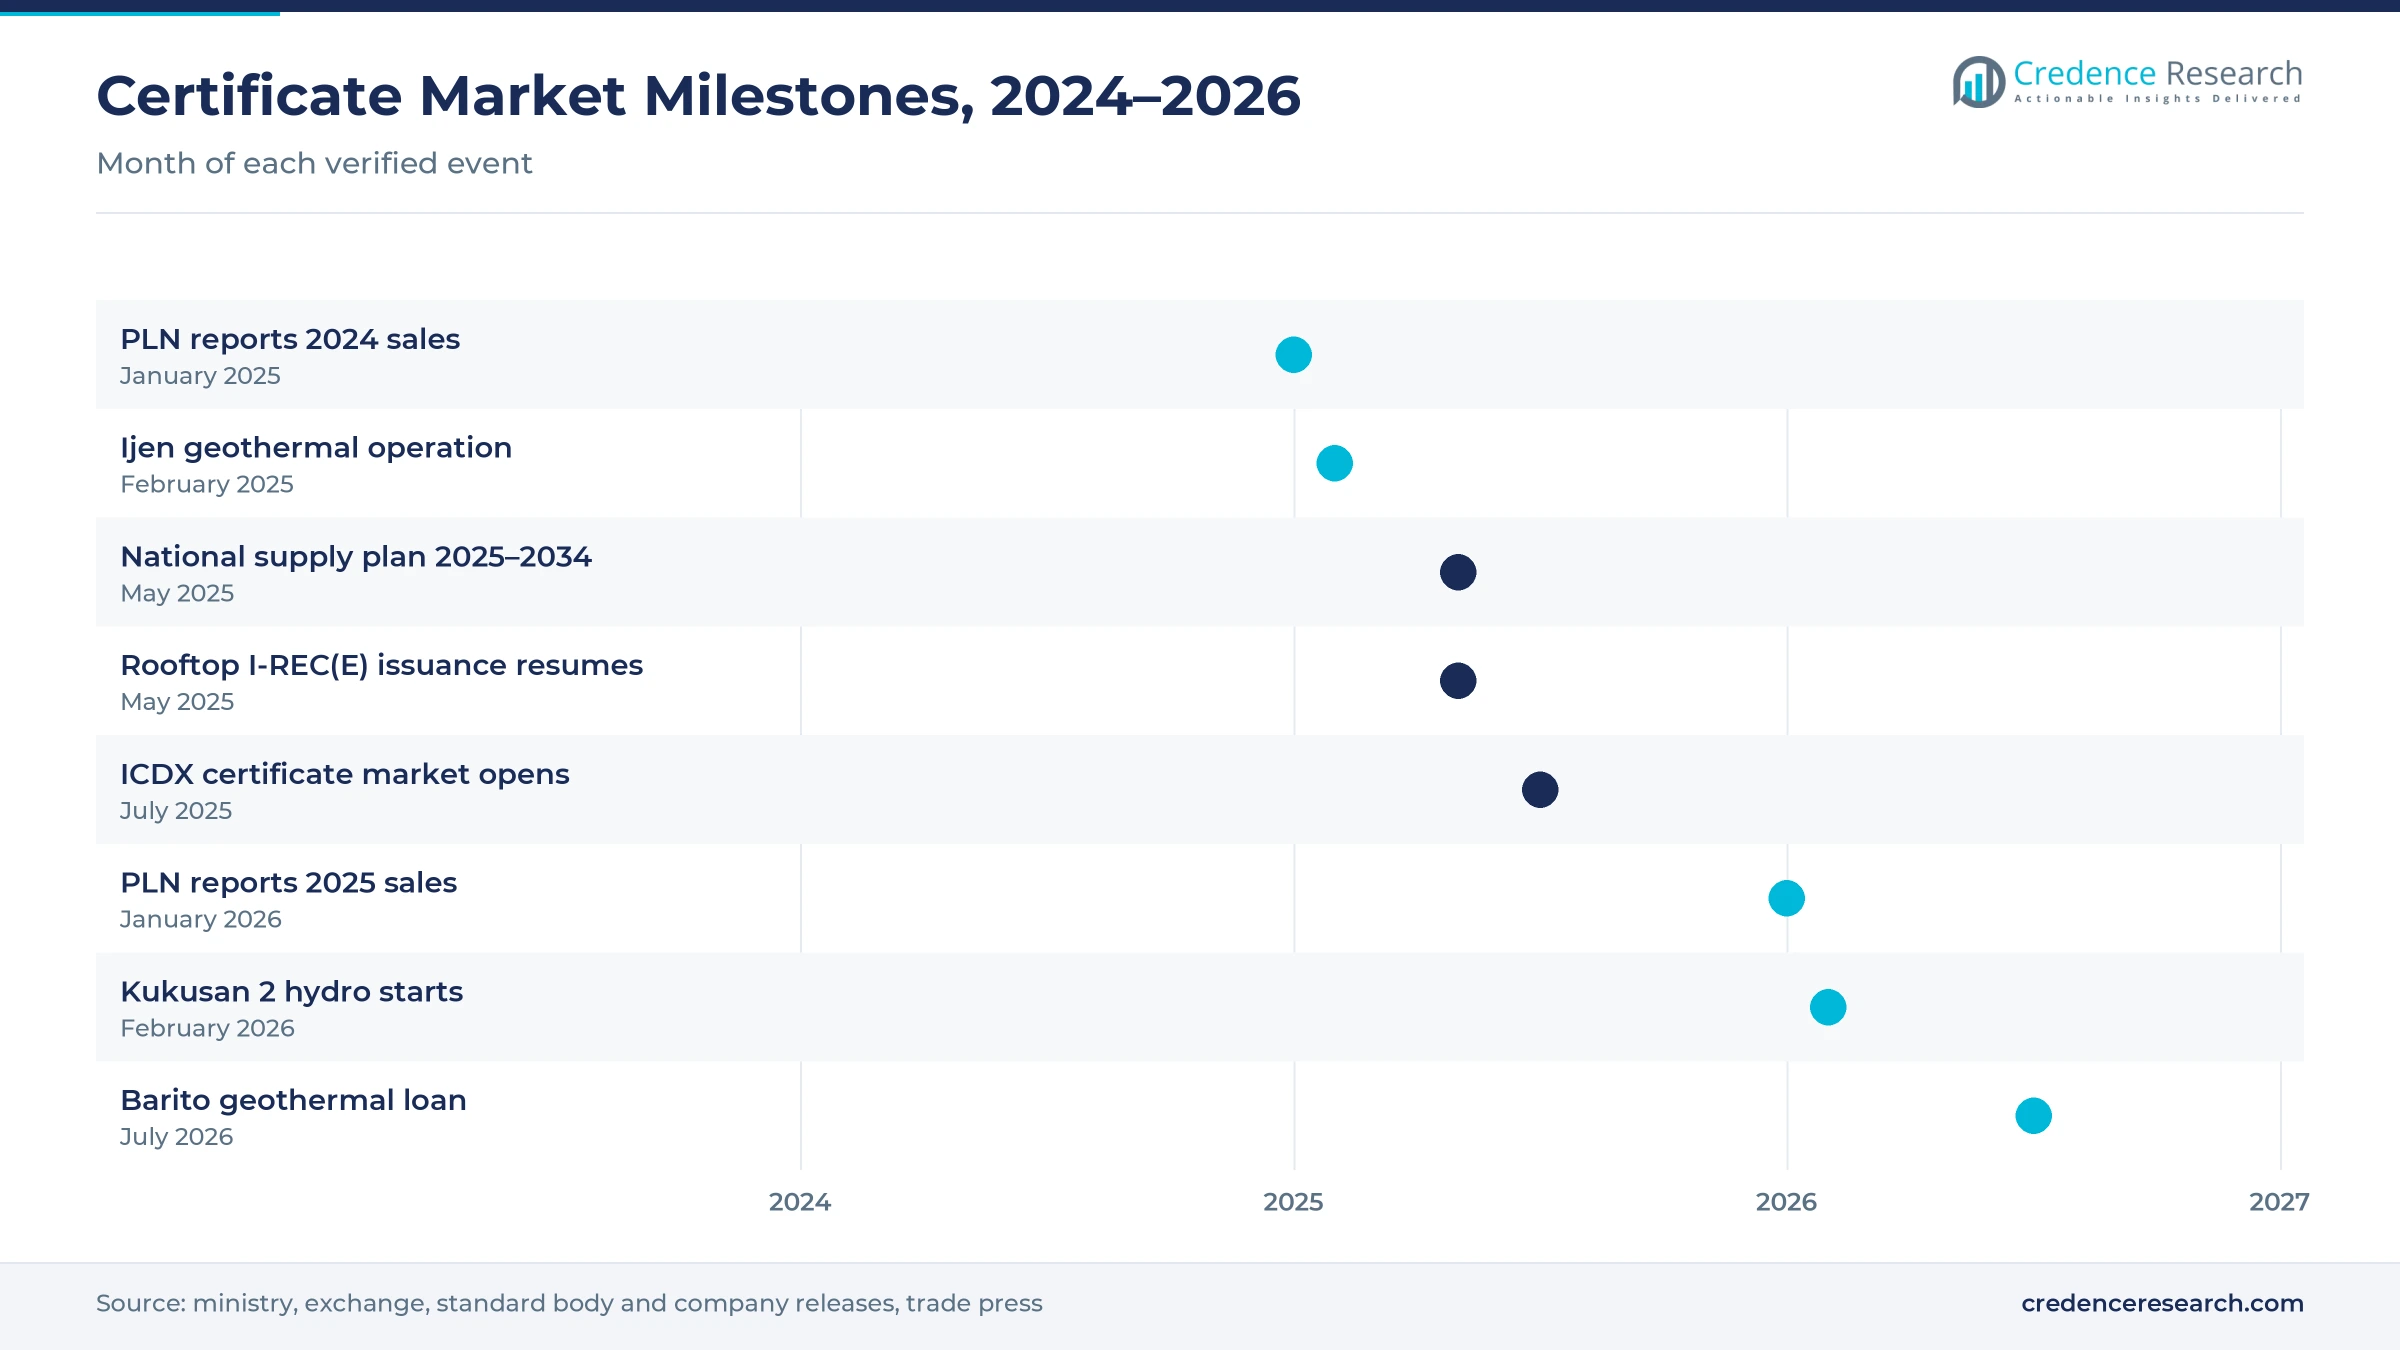
| In January 2025, PLN reported 5.38 TWh of certificate sales for 2024, up 52% from 2023. | Confirms rapid uptake by industrial and business customers |
| In February 2025, Medco Power Indonesia and Ormat began commercial operation of 35 MW at Ijen in East Java. | Ijen later joined the plants supplying PLN certificate customers |
| In May 2025, the International Tracking Standard Foundation resumed I-REC(E) issuance for rooftop solar after Ministerial Regulation No. 5 of 2025. | Clarifies attribute rights for private and rooftop generators |
| In July 2025, Indonesia Commodity and Derivatives Exchange opened a regulated certificate market in Jakarta. | Adds licensed exchange trading linked to two registries |
| In January 2026, PLN reported 6.43 TWh of certificate sales for 2025 from 12 renewable plants. | Shows continued growth led by mining and manufacturing buyers |
Registries and exchange links track each MWh
- APX TIGRs registration records PLN certificates from its geothermal, hydro and solar plants, which supports buyer claims under global reporting rules.
- The Evident I-REC registry holds I-REC(E) certificates issued for independent, captive and rooftop plants under the international standard.
- Exchange trading systems connect the ICDX platform to both registries, which allows auctions and transparent transfer of certificate lots.
- Issuer verification by the Green Certificate Company checks plant data and ownership before certificates are issued for Indonesia.
Need a Custom Version of This Report?
Tailor the scope, geography, or segments to your exact requirements.
- Custom geography or segment scope
- Direct access to our analyst team
PLN dominates supply as IPPs and exchanges enter
Competition centers on registered supply, price and the credibility of each certificate. PT PLN (Persero) dominates the market through its Green Energy as a Service offer, drawing on 12 renewable plants and a fixed list price. PLN Nusantara Power is the counterpart for the planned second phase at Cirata with Masdar. Independent producers such as Medco Power Indonesia, Pertamina Geothermal Energy, Barito Renewables Energy and Arkora Hydro add geothermal and hydro capacity that can carry certificates. Indonesia Commodity and Derivatives Exchange and its unit, Indonesia Climate Exchange, run trading, while the International Tracking Standard Foundation sets I-REC(E) rules. Because PLN certificates hold the largest share of 2025 value, PLN keeps the strongest position, while exchanges and private generators compete for buyers that want newer plants.
Companies profiled and their roles in this market
| Company | Type | Role in the market |
|---|---|---|
| PT PLN (Persero) | State utility and seller | Sells certificates from 12 renewable plants |
| PLN Nusantara Power | State generation unit | Counterpart for the planned Cirata second phase |
| Medco Power Indonesia | Independent producer | Operates Ijen geothermal with Ormat |
| Pertamina Geothermal Energy | Geothermal producer | Develops Lumut Balai Unit 2 in South Sumatra |
| Barito Renewables Energy | Geothermal producer | Finances Suoh Sekincau and Hamiding projects |
| Arkora Hydro | Run-of-river producer | Runs run-of-river plants including Kukusan 2 |
| Indonesia Commodity and Derivatives Exchange | Licensed commodity bourse | Operates the regulated certificate market |
| Indonesia Climate Exchange | Climate instrument bourse | Ran the first voluntary certificate auction |
| International Tracking Standard Foundation | Standard body | Sets I-REC(E) rules for Indonesia |
Credence Research view on Indonesian REC buying
Credence Research's view is that certificate spending in Indonesia will grow at close to 20% a year because exporters, miners and data center operators need renewable claims while the grid stays coal-heavy. PLN certificates keep the largest share, but exchange lots and I-REC(E) grow faster as private plants register. Sulawesi should grow fastest among regions as nickel smelters expand their electricity use. However, credibility questions and pending legislation may slow some purchases. Sellers with new plants and clear tracking should gain the most share.
PLN volumes and list prices anchor the model
The report uses 2025 as the base year on a calendar basis, and market values come from the Credence Research model. That model combines PLN certificate volumes, the published PLN list price, exchange auction prices, the national electricity supply plan, IRENA generation statistics and World Bank exchange rates. Segment splits and regional growth rates are Credence Research estimates, while regional shares follow the client-defined split. Sources used are ministry releases, international agency statistics, exchange and standard body releases, trade press and company releases, and no interviews or surveys were used.
Industrial buyers and new supply carry growth to 2035
Spending on these certificates is expected to reach USD 86.7 million by 2035, a 19.09% CAGR during 2026–2035, as industrial and digital buyers extend renewable claims. Growth should stay strong through 2030 as new geothermal, hydro and solar plants register and exchange trading deepens. After that, any compliance obligation under the renewable energy law would add a second layer of demand. Faster private registration would shift value toward I-REC(E) and exchange lots, while slower registration would keep PLN dominant. Exchange-based trading is expected to gain channel share through 2035.
Frequently Asked Questions
How big is the Indonesia renewable energy certificate market?
Which certificate type leads in Indonesia?
Which region leads the Indonesian market?
How much does a PLN certificate cost?
How many certificates did PLN sell in 2025?
Which end user grows fastest?
Who are the leading companies in Indonesia?
What are the main challenges for the market?
Table of Content
Chapter 1 Market Segmentation
- 1.1 Segmentation Framework
- 1.1.1 Product and Service Classification
- 1.1.2 Application and End-Use Classification
- 1.1.3 Technology and Solution Classification
- 1.1.4 Customer and Distribution Channel Classification
- 1.1.5 Geographic Segmentation
- 1.1.6 Market Segment Definitions and Boundaries
- 1.2 By Certificate Type
- 1.2.1 PLN REC
- 1.2.2 I-REC(E)
- 1.2.3 Exchange-Cleared REC
- 1.3 By Energy Source
- 1.3.1 Geothermal
- 1.3.2 Hydropower
- 1.3.3 Solar
- 1.3.4 Bioenergy
- 1.4 By End User
- 1.4.1 Manufacturing and Industrial
- 1.4.2 Mining and Smelting
- 1.4.3 Data Centers and Digital Services
- 1.4.4 Commercial Real Estate and Retail
- 1.4.5 Financial and Professional Services
- 1.5 By Procurement Channel
- 1.5.1 Direct Utility Purchase
- 1.5.2 Accredited Participant or Broker
- 1.5.3 Bundled Green Supply
- 1.5.4 Exchange-Based Trading
Chapter 2 Introduction
- 2.1 Report Objectives and Scope
- 2.2 Product Definition and Industry Terminology
- 2.3 Market Inclusions and Exclusions
- 2.4 Research Process
- 2.4.1 Primary Research and Expert Interviews
- 2.4.2 Secondary Research and Source Review
- 2.4.3 Top-Down and Bottom-Up Estimation
- 2.4.4 Data Triangulation and Verification
- 2.5 Market Size Measurement Basis
- 2.5.1 2025: USD 15.2 million → 2035: USD 86.7 million
- 2.6 Historical and Forecast Reference Periods
- 2.6.1 Historical Period: 2018-2025
- 2.6.2 Base Year: 2025
- 2.6.3 Forecast Period: 2025-2035
- 2.7 Research Assumptions and Limitations
Chapter 3 Executive Summary
- 3.1 Market Snapshot and Key Findings
- 3.2 Base-Year Market Size, 2025
- 3.3 Forecast Market Size, 2035
- 3.4 Revenue and Volume Growth Outlook
- 3.5 Key Demand and Supply Indicators
- 3.6 Leading Market Segments
- 3.7 Fastest-Growing Market Opportunities
- 3.8 Regional Performance Highlights
- 3.9 Technology and Industry Transformation
- 3.10 Competitive Landscape Summary
- 3.11 Analyst View and Strategic Implications
Chapter 4 Indonesia Renewable Energy Certificate Market Trends and Developments
- 4.1 Historical Industry Development, 2018-2025
- 4.2 Recent Market Trends and Developments
- 4.3 Demand and Customer Behavior Trends
- 4.4 Technology and Product Innovation
- 4.5 Artificial Intelligence, Automation and Digitalization
- 4.6 Local Manufacturing and Supply Chain Realignment
- 4.7 Industry Partnerships, Mergers and Acquisitions
- 4.8 Sustainability and Circular Economy Developments
- 4.9 Government and Private Sector Investment Trends
- 4.10 Emerging Business Models and Commercialization
- 4.11 Industry Developments and Announcements
Chapter 5 Indonesia Renewable Energy Certificate Market Production, Supply and Demand Analysis
- 5.1 Demand Trend and Consumption Analysis, 2018-2025
- 5.2 Demand Forecast, 2025-2035
- 5.3 Production and Output Trend, 2018-2025
- 5.4 Production and Output Forecast, 2025-2035
- 5.5 Installed Capacity and Capacity Utilization
- 5.6 Company-Wise Production Plants and Statistics
- 5.6.1 Installed Production Capacity
- 5.6.2 Actual Production
- 5.6.3 Planned Capacity and Expansion Targets
- 5.7 Supply Chain Structure and Procurement Trends
- 5.8 Supply-Demand Gap and Bottlenecks
- 5.9 Import Dependence and Sourcing Structure
- 5.10 Contract Manufacturing and Outsourcing
- 5.11 Regional Supply and Demand Concentration
Chapter 6 Indonesia Renewable Energy Certificate Market Pricing Analysis
- 6.1 Pricing Structure and Measurement
- 6.2 Historical Pricing Trends, 2018-2025
- 6.3 Pricing Outlook, 2025-2035
- 6.4 Average Selling Price and Unit Economics
- 6.5 Pricing by Product and Market Segment
- 6.6 Geographic Pricing Differences
- 6.7 Key Input, Energy, Labor and Logistics Costs
- 6.8 Contract Pricing and Purchasing Models
- 6.9 Pricing Sensitivity and Competitive Positioning
- 6.10 Price, Margin and Profitability Implications
Chapter 7 Indonesia Renewable Energy Certificate Market Dynamics
- 7.1 Market Growth Drivers
- 7.1.1 Demand-Side Drivers
- 7.1.2 Technology and Innovation Drivers
- 7.1.3 Infrastructure and Investment Drivers
- 7.1.4 Regulatory and Policy Drivers
- 7.2 Market Restraints
- 7.2.1 Cost and Affordability Constraints
- 7.2.2 Technology and Adoption Barriers
- 7.2.3 Supply Chain and Operational Constraints
- 7.3 Market Challenges
- 7.3.1 Competitive Pressure and Margin Erosion
- 7.3.2 Skills, Infrastructure and Implementation Gaps
- 7.4 Emerging Market Opportunities
- 7.5 Market Dynamics Impact and Time-Horizon Assessment
Chapter 8 Indonesia Renewable Energy Certificate Value Chain Analysis
- 8.1 Industry Value Chain Overview
- 8.2 Upstream Suppliers and Critical Inputs
- 8.3 Technology and Component Providers
- 8.4 Manufacturing or Service Delivery
- 8.5 Distribution, Channel Partners and Integrators
- 8.6 Downstream Applications and End Users
- 8.7 Value Addition and Profit Pools
- 8.8 Vertical Integration and Outsourcing
- 8.9 Supplier Concentration and Risk
- 8.10 Supply Chain Localization and Resilience
Chapter 9 Indonesia Renewable Energy Certificate Market Regulations and Policies
- 9.1 Relevant Laws, Standards and Compliance Frameworks
- 9.2 Product, Service, Safety and Quality Requirements
- 9.3 Government Policies, Incentives and Subsidies
- 9.4 Imports, Exports and Trade Barriers
- 9.5 Public Procurement and Local Content Requirements
- 9.6 Environmental and Sustainability Compliance
- 9.7 Upcoming Policy Changes and Market Implications
Chapter 10 Indonesia Renewable Energy Certificate Market Hotspots and Opportunities
- 10.1 Market Opportunity Mapping and Growth Hotspots
- 10.2 High-Growth Applications and Customer Groups
- 10.3 Underserved Markets and White-Space Opportunities
- 10.4 Emerging Technology and Product Opportunities
- 10.5 New Capacity and Investment Hotspots
- 10.6 Market Entry and Expansion Opportunities
- 10.7 Distribution and Partnership Opportunities
- 10.8 Near-Term and Long-Term Commercial Potential
- 10.9 Opportunity Attractiveness and Execution Risks
Chapter 11 Indonesia Renewable Energy Certificate Market Outlook, 2025-2035
- 11.1 Market Size and Analysis
- 11.1.1 Revenue (Market Measurement: 2025: USD 15.2 million → 2035: USD 86.7 million)
- 11.1.2 Market Volume and Quantity Sold
- 11.1.3 Historical Market Size, 2018-2025
- 11.1.4 Base-Year Market Size, 2025
- 11.2 Market Forecast, 2025-2035
- 11.2.1 Revenue Forecast to 2035
- 11.2.2 Volume Forecast to 2035
- 11.2.3 CAGR and Year-on-Year Growth
- 11.2.4 Incremental Revenue Opportunity
- 11.3 Forecast Assumptions and Scenario Analysis
- 11.3.1 Base-Case Forecast
- 11.3.2 Optimistic and Conservative Scenarios
- 11.3.3 Technology, Pricing and Policy Sensitivities
- 11.4 Market Attractiveness and Growth Outlook
Chapter 12 Indonesia Renewable Energy Certificate Market Segmentation and Outlook
- 12.1 Segmentation Summary and Market Shares, 2025
- 12.2 Largest and Fastest-Growing Segments
- 12.3 By Certificate Type - Market Size and Forecast, 2025-2035
- 12.3.1 Segment Definition and Scope
- 12.3.2 Historical Market Size, 2018-2025
- 12.3.3 Revenue Forecast, 2025-2035
- 12.3.4 Volume Forecast, 2025-2035
- 12.3.5 Base-Year Market Share, 2025
- 12.3.6 Segment CAGR and Growth Drivers
- 12.3.7 Subsegment Market Size and Forecast
- 12.3.7.1 PLN REC
- 12.3.7.2 I-REC(E)
- 12.3.7.3 Exchange-Cleared REC
- 12.3.8 Subsegment Pricing and Adoption Trends
- 12.3.9 Leading Suppliers and Competition
- 12.3.10 Regional Demand and Opportunities
- 12.4 By Energy Source - Market Size and Forecast, 2025-2035
- 12.4.1 Segment Definition and Scope
- 12.4.2 Historical Market Size, 2018-2025
- 12.4.3 Revenue Forecast, 2025-2035
- 12.4.4 Volume Forecast, 2025-2035
- 12.4.5 Base-Year Market Share, 2025
- 12.4.6 Segment CAGR and Growth Drivers
- 12.4.7 Subsegment Market Size and Forecast
- 12.4.7.1 Geothermal
- 12.4.7.2 Hydropower
- 12.4.7.3 Solar
- 12.4.7.4 Bioenergy
- 12.4.8 Subsegment Pricing and Adoption Trends
- 12.4.9 Leading Suppliers and Competition
- 12.4.10 Regional Demand and Opportunities
- 12.5 By End User - Market Size and Forecast, 2025-2035
- 12.5.1 Segment Definition and Scope
- 12.5.2 Historical Market Size, 2018-2025
- 12.5.3 Revenue Forecast, 2025-2035
- 12.5.4 Volume Forecast, 2025-2035
- 12.5.5 Base-Year Market Share, 2025
- 12.5.6 Segment CAGR and Growth Drivers
- 12.5.7 Subsegment Market Size and Forecast
- 12.5.7.1 Manufacturing and Industrial
- 12.5.7.2 Mining and Smelting
- 12.5.7.3 Data Centers and Digital Services
- 12.5.7.4 Commercial Real Estate and Retail
- 12.5.7.5 Financial and Professional Services
- 12.5.8 Subsegment Pricing and Adoption Trends
- 12.5.9 Leading Suppliers and Competition
- 12.5.10 Regional Demand and Opportunities
- 12.6 By Procurement Channel - Market Size and Forecast, 2025-2035
- 12.6.1 Segment Definition and Scope
- 12.6.2 Historical Market Size, 2018-2025
- 12.6.3 Revenue Forecast, 2025-2035
- 12.6.4 Volume Forecast, 2025-2035
- 12.6.5 Base-Year Market Share, 2025
- 12.6.6 Segment CAGR and Growth Drivers
- 12.6.7 Subsegment Market Size and Forecast
- 12.6.7.1 Direct Utility Purchase
- 12.6.7.2 Accredited Participant or Broker
- 12.6.7.3 Bundled Green Supply
- 12.6.7.4 Exchange-Based Trading
- 12.6.8 Subsegment Pricing and Adoption Trends
- 12.6.9 Leading Suppliers and Competition
- 12.6.10 Regional Demand and Opportunities
- 12.7 Segment Growth Comparison
- 12.8 Segment Attractiveness and Priority Matrix
Chapter 13 Indonesia Renewable Energy Certificate End-Use and Application Market Outlook
- 13.1 End-Use Industry and Customer Demand Structure
- 13.2 Leading Applications and Customer Groups
- 13.3 End-Use Market Size, Share and Forecast
- 13.4 Major End-Use Industry Deep Dives
- 13.4.1 Customer Requirements and Use Cases
- 13.4.2 Demand and Replacement Cycles
- 13.4.3 Technical and Regulatory Considerations
- 13.4.4 Purchasing and Procurement Models
- 13.4.5 Leading Vendors and Distribution Channels
- 13.4.6 Forecast and Commercial Opportunities
- 13.5 Emerging Applications and Cross-Segment Demand
- 13.6 End-Use Industry Investment Priorities
Chapter 14 Indonesia Renewable Energy Certificate Geographic Market Outlook, 2025-2035
- 14.1 Domestic Market Distribution and Demand Clusters
- 14.2 State- or Province-Wise Market Size and Forecast, 2025-2035
- 14.3 City and Metropolitan Market Outlook
- 14.4 Industrial, Manufacturing and Commercial Clusters
- 14.5 Geographic Concentration of Key End Users
- 14.6 Local Pricing and Purchasing Differences
- 14.7 Domestic Production Facilities and Capacity Map
- 14.8 Local Infrastructure and Project Pipeline
- 14.9 State-Level Policy and Incentive Differences
- 14.10 Subnational Investment Hotspots and Opportunities
- 14.11 Distribution and Logistics Networks
- 14.12 Domestic Competitive Footprint
Chapter 15 Indonesia Renewable Energy Certificate Technology, Innovation and Sustainability Outlook
- 15.1 Technology Landscape and Maturity
- 15.2 Product, Process and Service Innovation
- 15.3 AI, Automation and Digital Tools in the Industry
- 15.4 Technology Adoption and Performance Benchmarking
- 15.5 Innovation Pipeline and R&D Investment
- 15.6 Patent and Intellectual Property Trends
- 15.7 Energy Efficiency and Resource Management
- 15.8 Sustainability, Recycling and Circularity
- 15.9 Technology Roadmap, 2025-2035
- 15.10 Risks of Obsolescence and Technology Substitution
Chapter 16 Indonesia Renewable Energy Certificate Market Key Strategic Imperatives
- 16.1 Growth and Market Entry Priorities
- 16.2 High-Return Products and Segments
- 16.3 Pricing, Profitability and Cost Optimization
- 16.4 Technology Investment and Product Differentiation
- 16.5 Supply Chain Localization and Resilience
- 16.6 Distribution and Customer Acquisition
- 16.7 Partnership, Acquisition and Capacity Strategy
- 16.8 Regional Expansion Priorities
- 16.9 Short-, Medium- and Long-Term Actions
Chapter 17 Competition Outlook
- 17.1 Industry Competition Characteristics
- 17.2 Market Structure and Concentration
- 17.3 Market Share and Competitive Positioning, 2025
- 17.4 Company-Wise Revenue and Product Benchmarking
- 17.5 Production and Service Capacity Benchmarking
- 17.6 Technology, Pricing and Differentiation
- 17.7 Regional Footprint and Distribution Strength
- 17.8 Mergers, Acquisitions and Strategic Alliances
- 17.9 New Entrants and Competitive Threats
- 17.10 Porter's Five Forces and Industry Attractiveness
- 17.11 Competitive Outlook, 2025-2035
Chapter 18 Company Profiles
- 18.1 Company Coverage and Selection Criteria
- 18.2 PT PLN (Persero)
- 18.2.1 Business Description
- 18.2.2 Company Ownership and Geographic Presence
- 18.2.3 Product and Service Portfolio
- 18.2.4 Manufacturing and Operating Footprint
- 18.2.5 Production Capacity and Expansion Plans
- 18.2.6 Financial Performance and Investment
- 18.2.7 Market Share and Competitive Position
- 18.2.8 Technology and Innovation Capabilities
- 18.2.9 Strategic Alliances or Partnerships
- 18.2.10 Recent Developments
- 18.2.11 Growth Strategy and Outlook
- 18.3 PLN Nusantara Power
- 18.4 PLN Indonesia Power
- 18.5 Pertamina New & Renewable Energy
- 18.6 Barito Renewables Energy
- 18.7 Medco Power Indonesia
- 18.8 Supreme Energy
- 18.9 Arkora Hydro
- 18.10 Indonesia Climate Exchange
- 18.11 International Tracking Standard Foundation
- 18.12 Other Relevant Market Participants
Note: Every listed company is profiled on the structure shown under the first company. The company list is preliminary and may change based on research findings, market developments, data availability and client requirements.
Chapter 19 Disclaimer
- 19.1 Research and Forecast Disclaimer
- 19.2 Data Source and Estimation Limitations
Note: The depth of individual sections depends on data availability for this market. Volume, capacity, trade and other unit-based metrics are included where applicable.

