
Cans, pails and drums that carry the region's paint
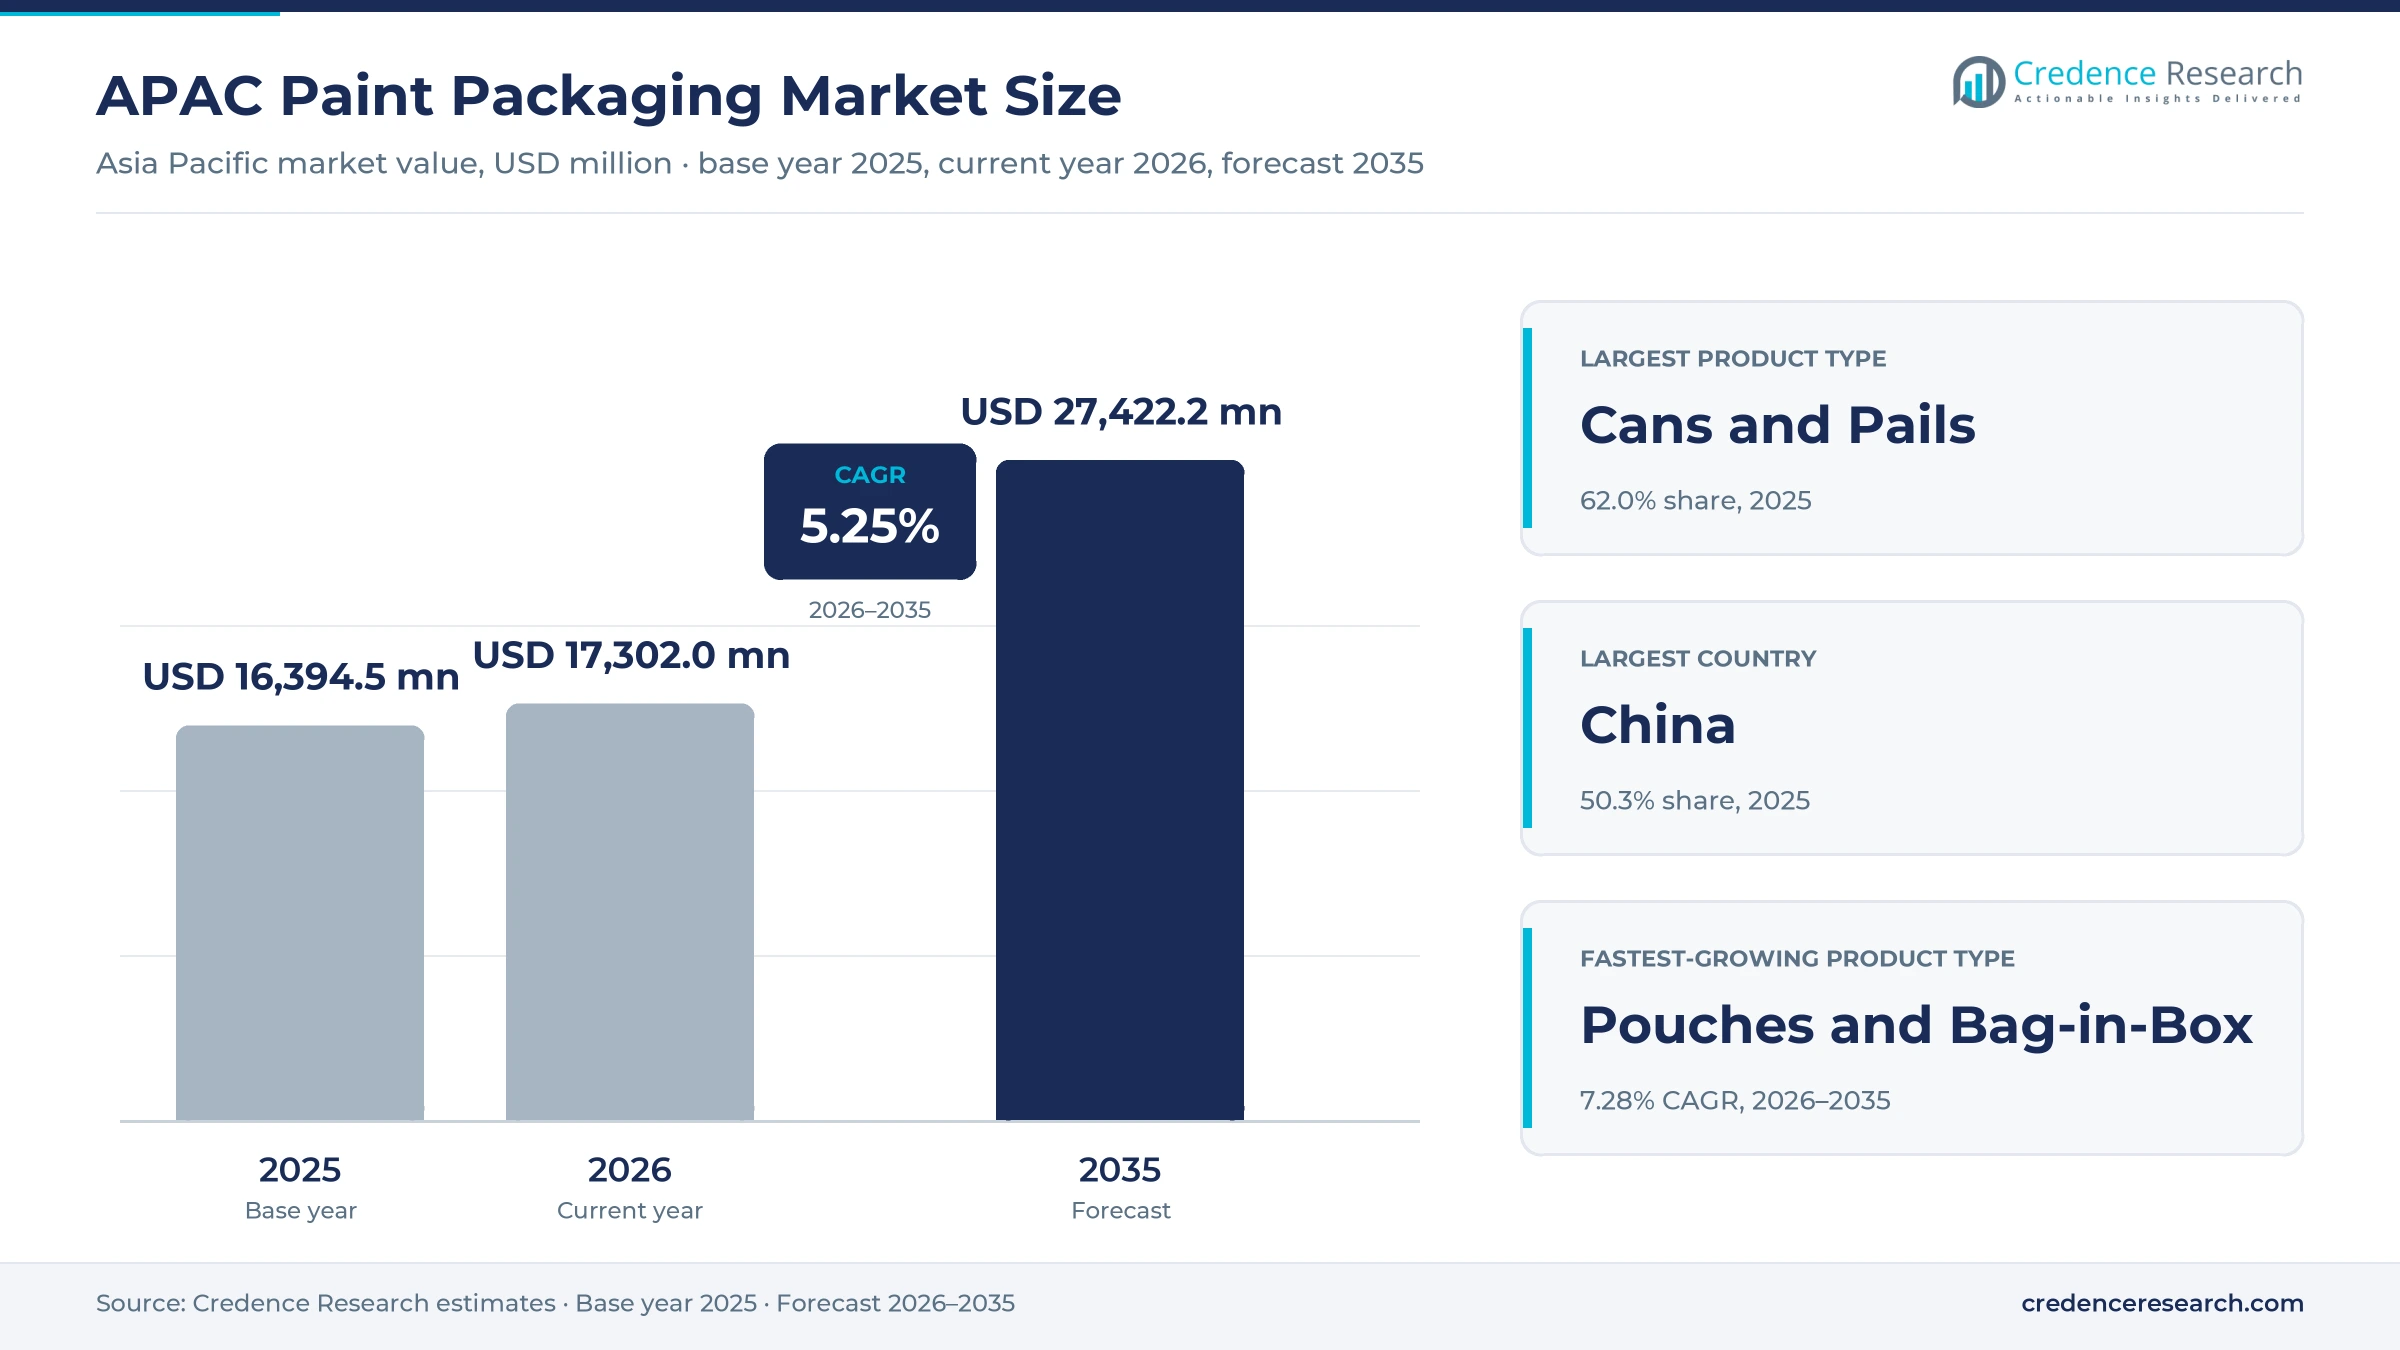
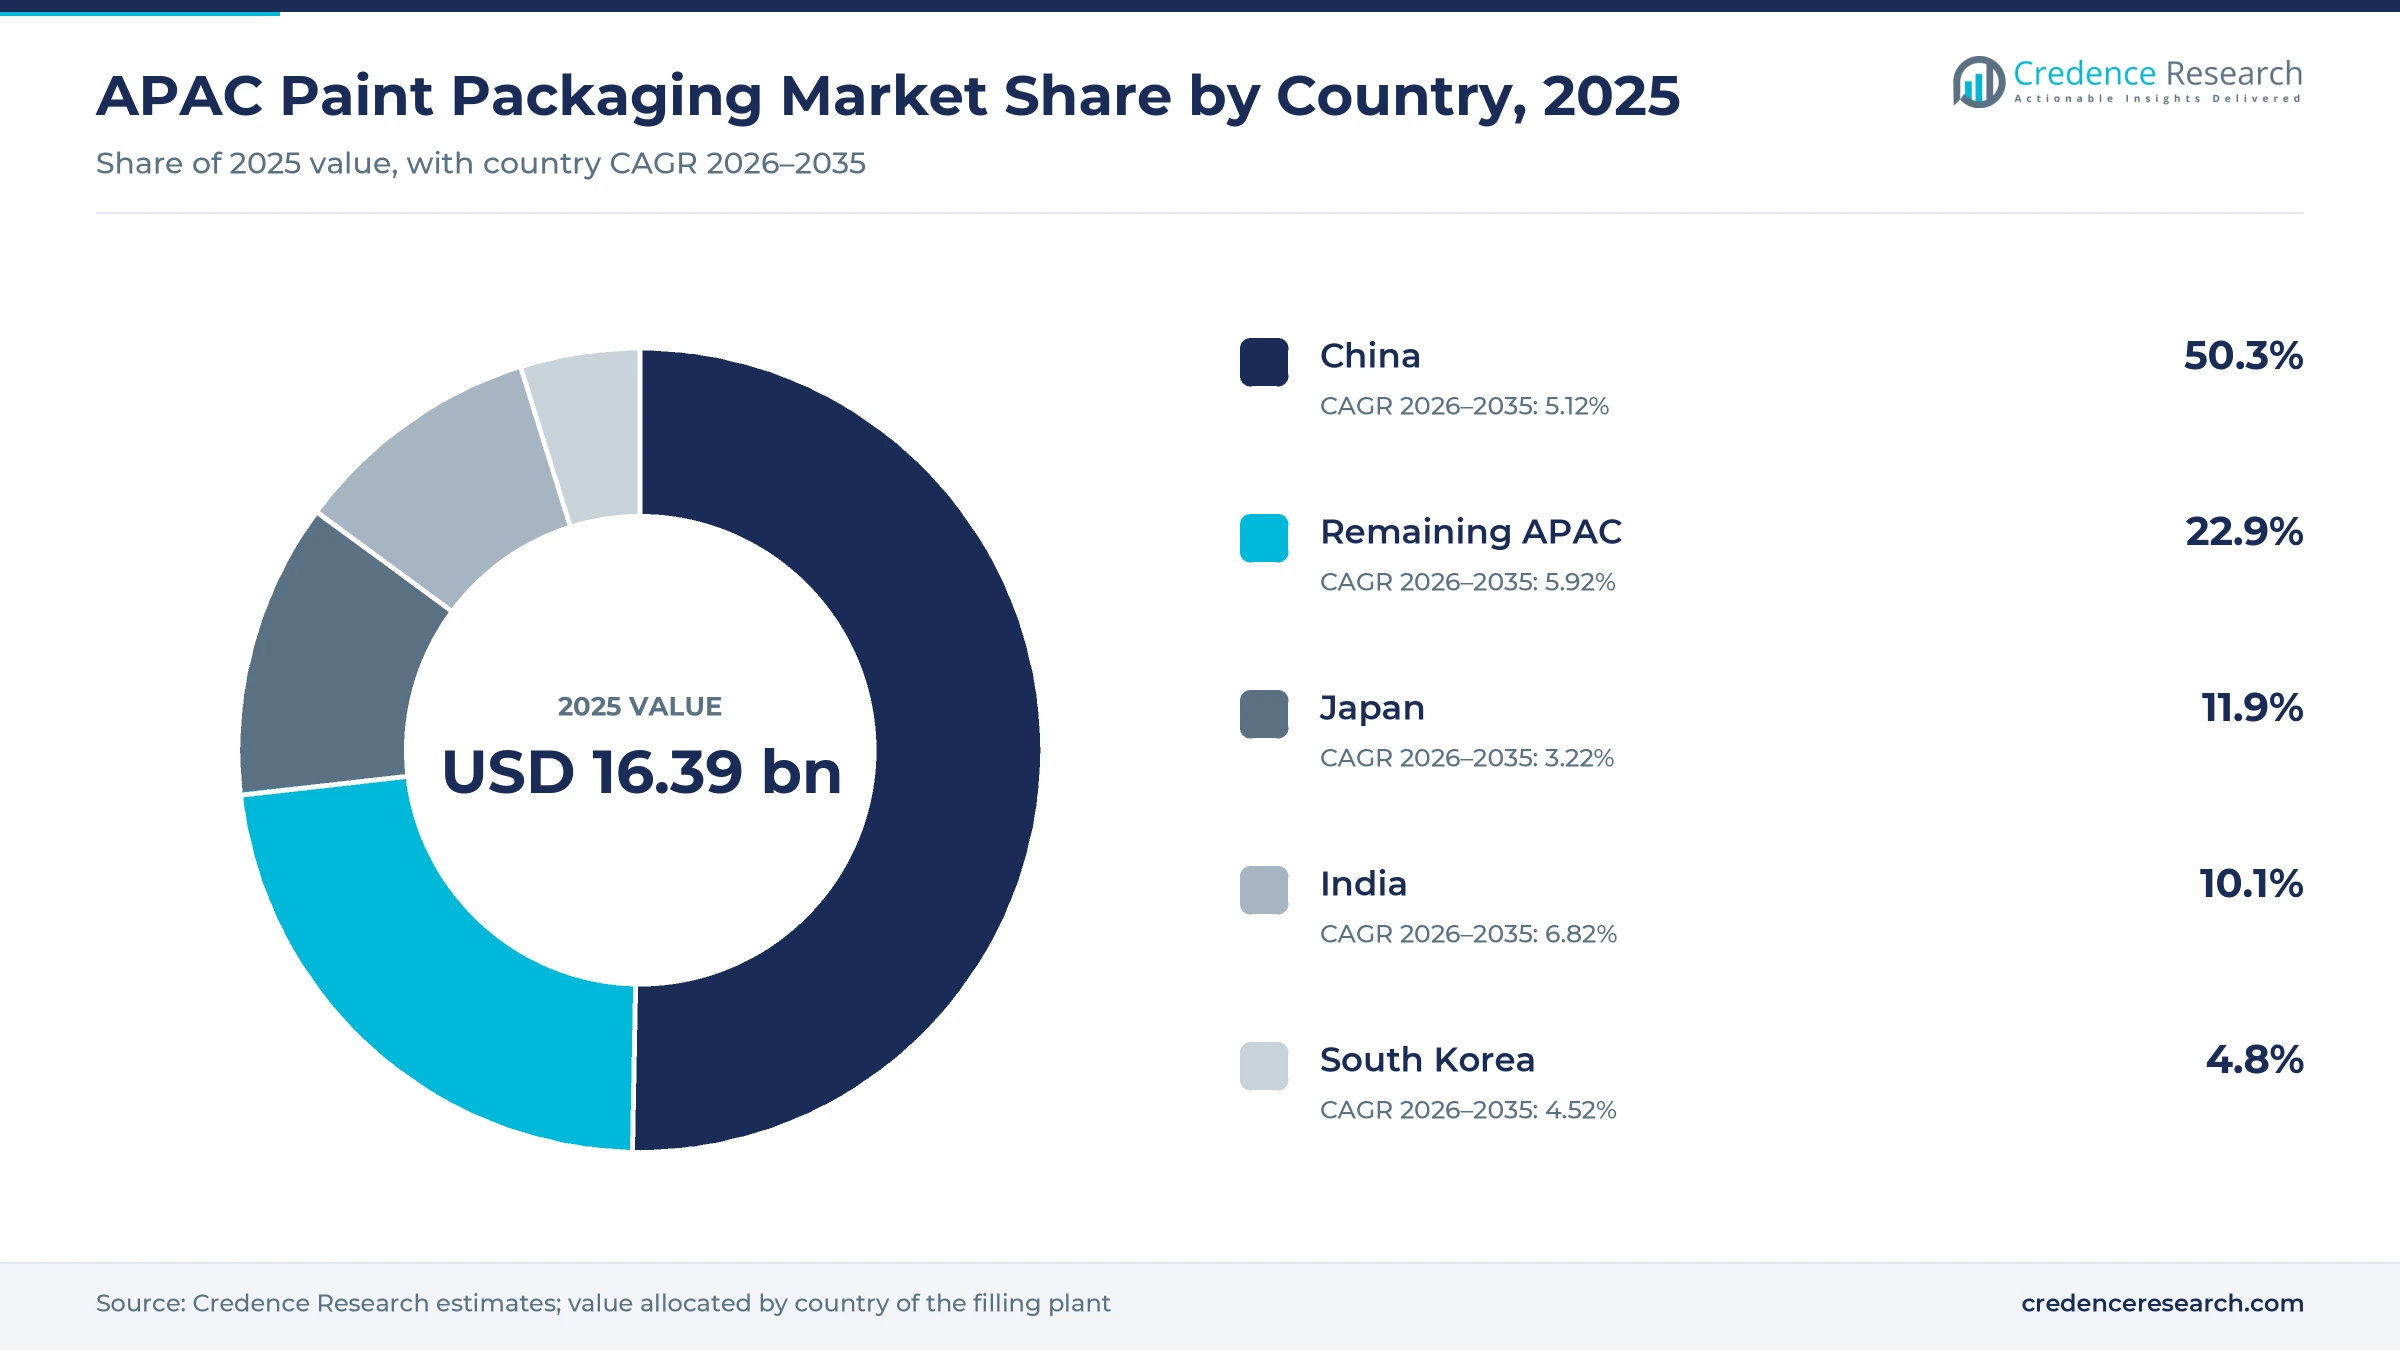
The APAC paint packaging market was valued at USD 16.39 billion in 2025 and is projected to increase from USD 17.30 billion in 2026 to USD 27.42 billion by 2035, registering a CAGR of 5.25% during 2026–2035. Demand comes from decorative paint brands that fill cans and pails for retail dealers, industrial coating makers that ship drums to car plants and shipyards, and aerosol fillers that serve touch-up and spray markets. China held the largest share, 50.3% in 2025, because it hosts the region's largest coatings industry and fills containers for building, vehicle and ship projects. India is the fastest-growing country at 6.82% a year, as new and established paint makers add plants. In December 2025, AkzoNobel completed the sale of Akzo Nobel India to the JSW Group, which placed another established paint business under a domestic owner.
Which paint containers does the regional estimate cover?
The estimate measures spending on containers used to fill and ship paints and coatings, including tinplate and plastic cans and pails, steel and plastic drums, pouches and bag-in-box packs, bottles and aerosol cans. It covers China, India, Japan, South Korea and the remaining Asia Pacific countries. Values are measured at the price paid by paint makers and fillers through direct supply contracts, packaging distributors and digital procurement platforms.
The estimate excludes the paint itself, shipping cartons, pallets and reusable bulk tanks owned by logistics firms. The value chain runs from steel, tinplate, resin and film suppliers through can makers, molders and drum makers to integrated paint brands, contract fillers and independent formulators that fill each pack before it reaches dealers, contractors and factories.
APAC Paint Packaging Market Insights
- The APAC paint packaging market was valued at USD 16.39 billion in 2025 and is projected to reach USD 27.42 billion by 2035, registering a CAGR of 5.25% during 2026–2035.
- China held a 50.3% share of 2025 regional value, because it hosts the largest coatings industry in Asia Pacific and the region's widest container supply base.
- Cans and pails led product demand with a 62.0% share of 2025 value, because most decorative paint reaches dealers in one-liter to 20-liter packs.
- Birla Opus reached 1,096 million liters a year of installed paint capacity in May 2025, which adds steady container orders across six Indian plant sites.
- Amendment 42-24 of the International Maritime Dangerous Goods Code entered into force on Jan. 1, 2026, which keeps certified drums and pails central to coating exports.
Cans and pails lead while refill pouches grow fastest
Why do cans and pails dominate container demand?
Based on product type, the market is categorized into cans and pails, drums, pouches and bag-in-box, bottles and aerosol cans. Cans and Pails led with a 62.0% share of 2025 value, because decorative paint is sold to dealers and painters in one-liter to 20-liter packs. Pouches and Bag-in-Box grow fastest at 7.28% a year, as brands test lighter refill packs for tints and touch-up products.
How fast are plastic containers replacing tinplate?
Based on material, the market is categorized into steel and tinplate, polyolefins, PET and aluminium and composite materials. Steel and Tinplate led with a 44.0% share of 2025 value, because drums, aerosol cans and many solvent-borne enamel tins still use steel. Polyolefins grow fastest at 6.10% a year, as water-based decorative paint moves into injection-molded pails that resist rust.
Which coatings use the most containers?
Based on application, the market is categorized into architectural paints, industrial coatings and specialty coatings. Architectural Paints led with a 58.0% share of 2025 value, because wall paint is the largest coating category by volume and is sold in small retail packs. Specialty Coatings grow fastest at 5.83% a year, as marine, protective and automotive refinish products need tested containers.
Why are contract fillers gaining container share?
Based on customer type, the market is categorized into integrated paint brands, contract paint fillers and independent paint formulators. Integrated Paint Brands led with a 64.0% share of 2025 value, because large brands buy printed packs under long supply contracts. Contract Paint Fillers grow fastest at 6.13% a year, as new entrants and private labels outsource filling instead of building plants.
| Segment Group | Leading Sub-segment | Share, 2025 | Fastest-growing Sub-segment | CAGR, 2026–2035 |
|---|---|---|---|---|
| By Product Type | Cans and Pails | 62.0% | Pouches and Bag-in-Box | 7.28% |
| By Material | Steel and Tinplate | 44.0% | Polyolefins | 6.10% |
| By Application | Architectural Paints | 58.0% | Specialty Coatings | 5.83% |
| By Customer Type | Integrated Paint Brands | 64.0% | Contract Paint Fillers | 6.13% |
Request a Free Sample
Fill in your details and we'll send you a free sample report.
- Sample data tables & charts
- Research methodology
Plant expansion and brand protection lift pack demand
Paint-plant expansion pulls container suppliers close
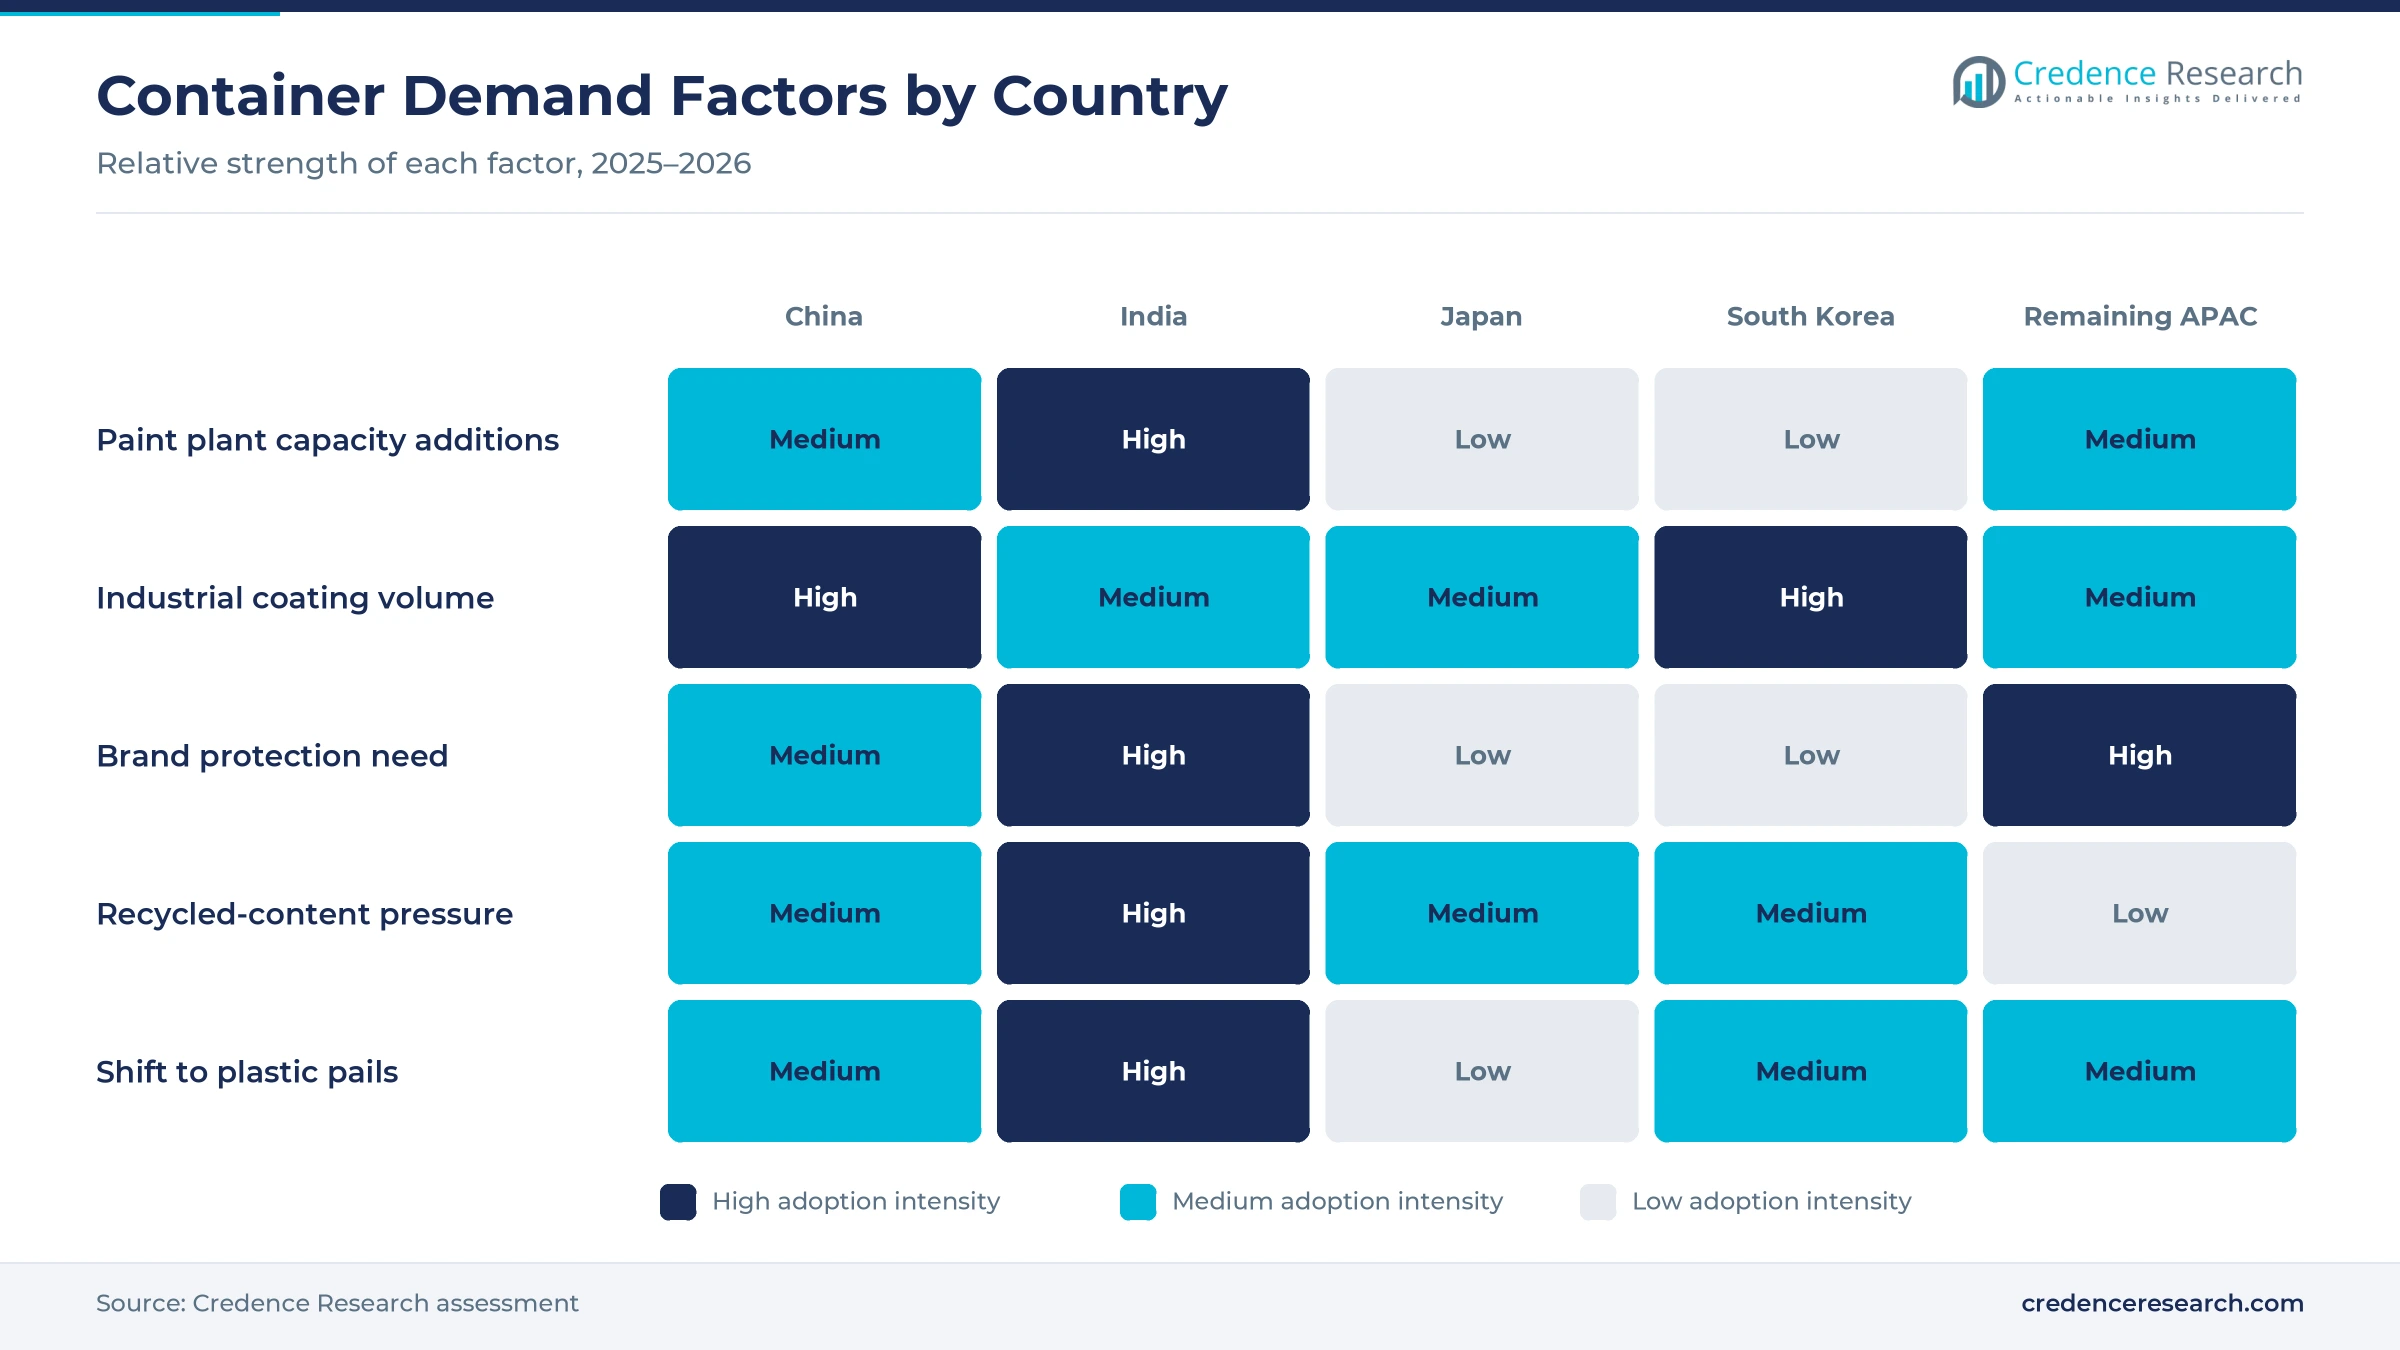
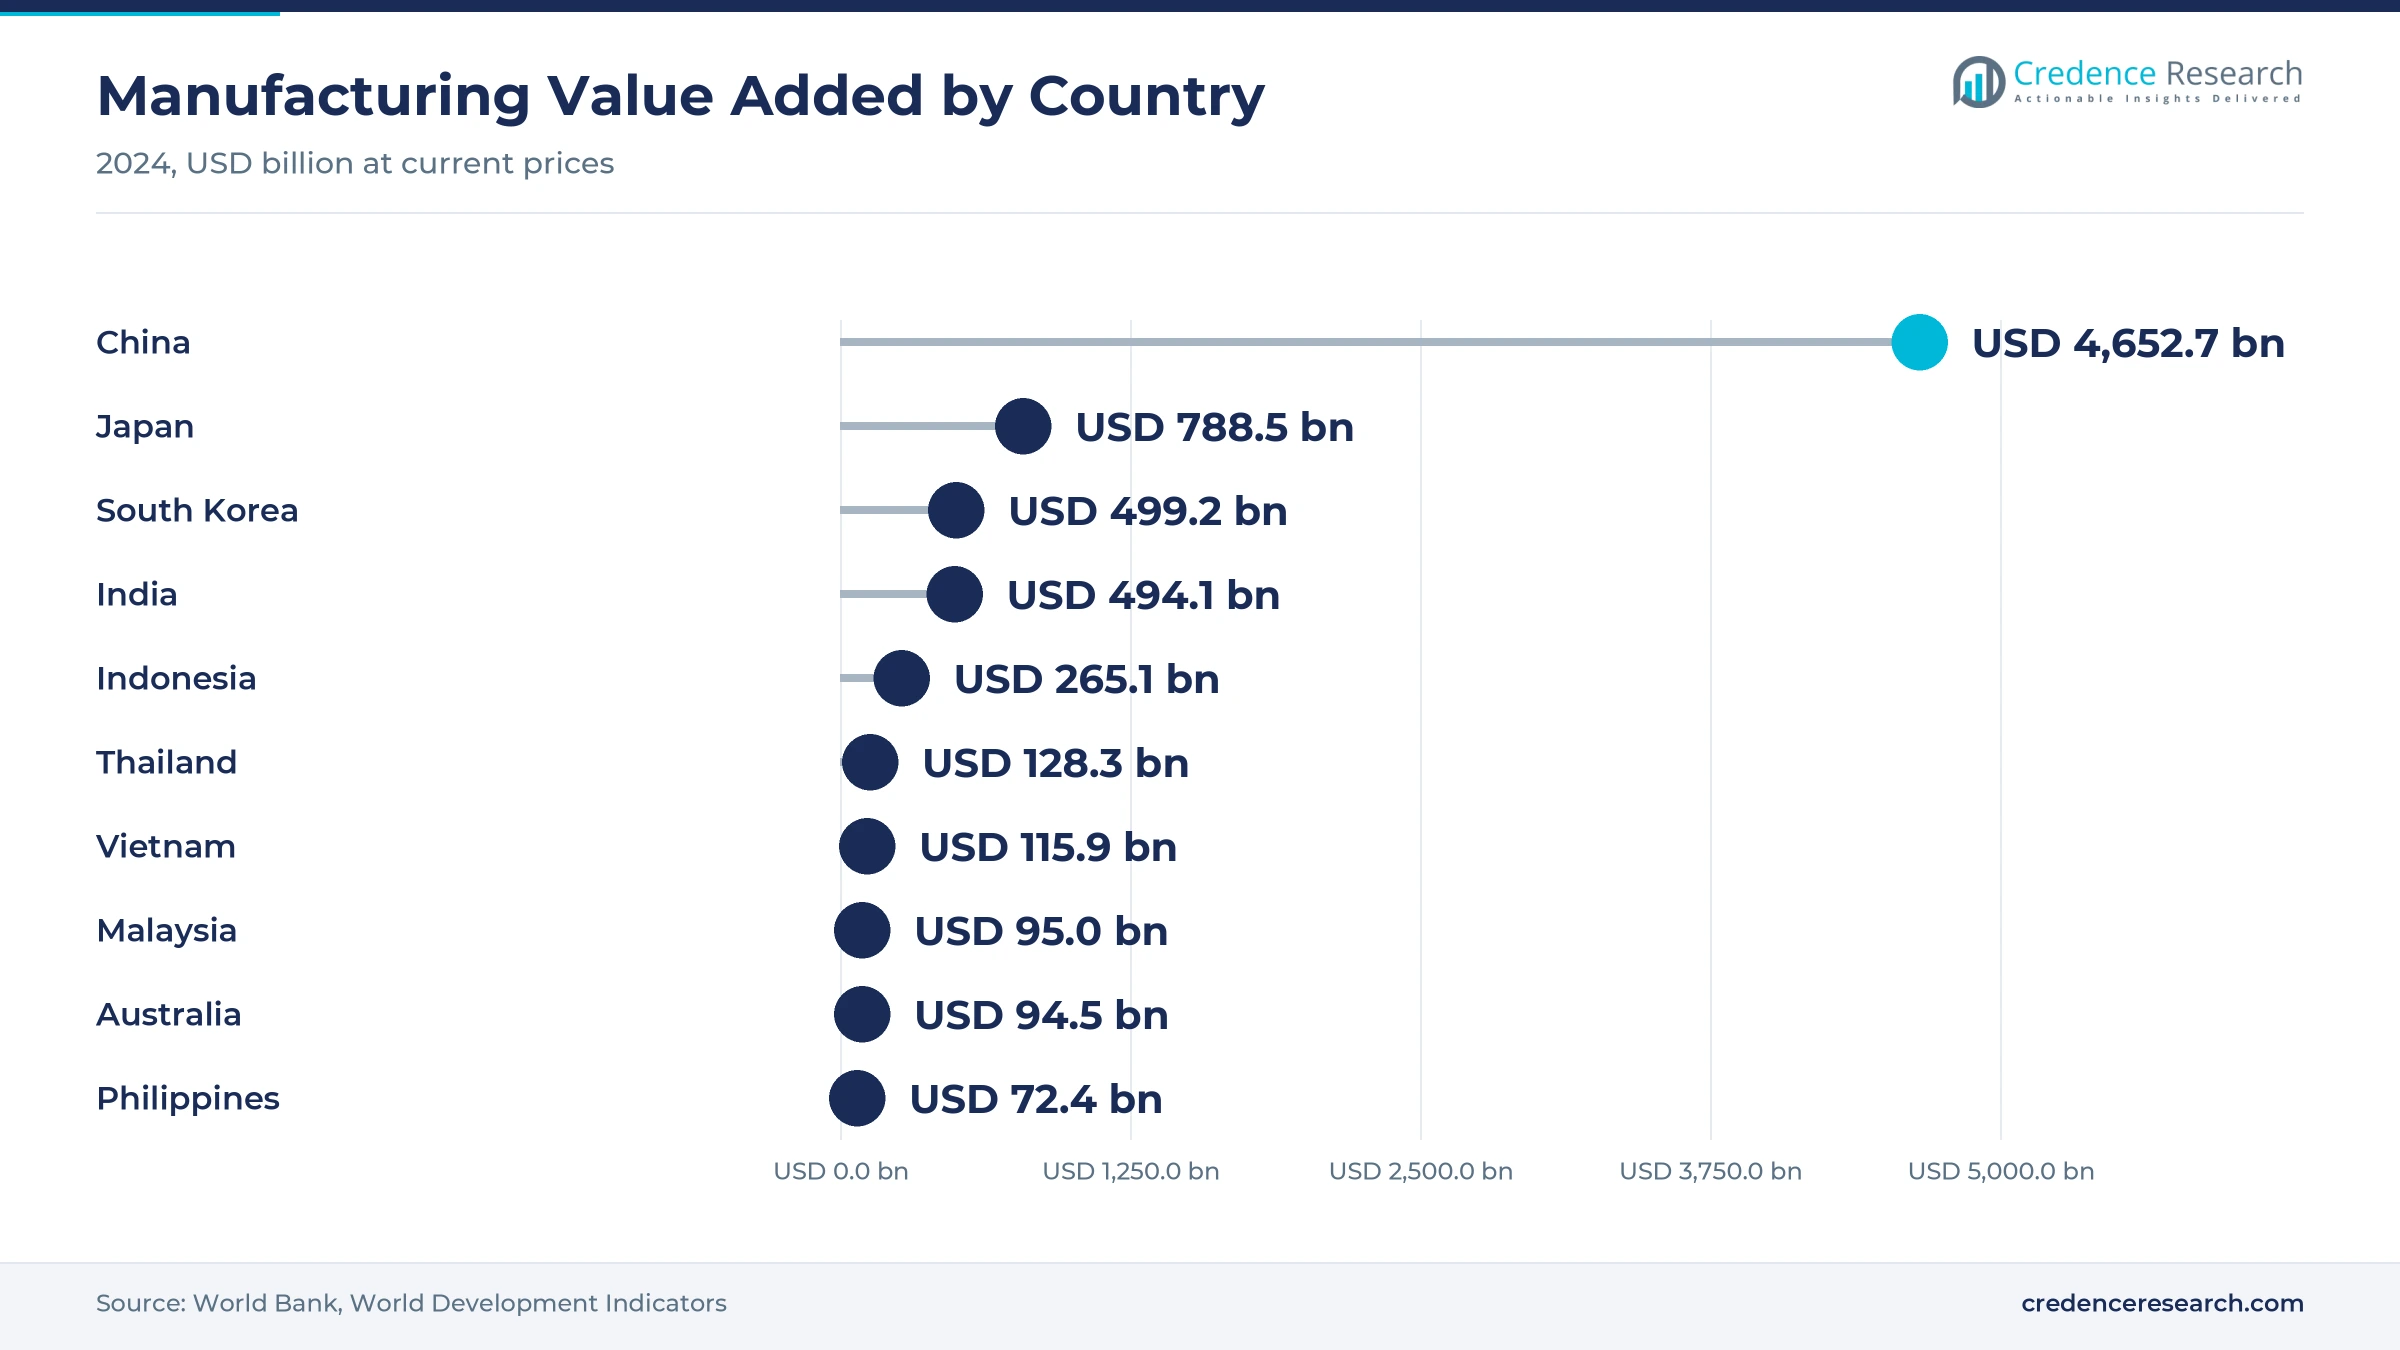
Paint makers across the region are adding plant capacity, and each new plant draws container suppliers into nearby sites to cut freight on bulky empty pails. Birla Opus reached 1,096 million liters a year of installed capacity in May 2025, out of a planned 1,332 million liters, with plants at Panipat, Ludhiana, Cheyyar, Chamarajnagar, Mysore and Mahad, according to a PTI report carried by The Week. Asian Paints doubled its Mysuru plant to 600,000 kiloliters a year in July 2024, The Machine Maker reported. Mold-Tek Packaging disclosed a letter of award from the Grasim paints division in November 2022 and planned a co-located facility at Cheyyar near Chennai. As a result, cans and pails hold 62.0% of 2025 value.
Decorated, tamper-proof packs protect paint brands
Paint brands use the container as a shelf display and as a guard against copying, which raises the value of each pail beyond its plastic or steel content. Mold-Tek Packaging is known for introducing in-mold labeling at scale in India and supplies decorative, tamper-proof packs to Asian Paints, Berger Paints and Kansai Nerolac, Plastemart reported in February 2026. Counterfeiting shows why this matters, because police in Da Nang seized more than five metric tons of fake Jotun-branded paint and wall putty in February 2026. The suspects had refilled genuine empty Jotun cans and attached fake traceability labels, Tuoi Tre News reported. Consequently, integrated paint brands hold 64.0% of 2025 value and specify printed, sealed packs.
Industrial coatings need certified drums and pails
Industrial coatings are often flammable and move in large lots, so buyers need certified drums, pails and bulk containers that hold product safely through transport. Amendment 42-24 of the International Maritime Dangerous Goods Code entered into force on Jan. 1, 2026, according to a Hong Kong Marine Department notice dated Dec. 2, 2024. China consumed about 520,000 tons of automotive coatings in 2025, up 13.1% from 2024, Coatings World reported in August 2026. South Korean shipyards won just over 10 million compensated gross tons of new orders in the first 11 months of 2025, a 22% share, The Maritime Executive reported. As a result, steel and plastic drums remain the standard format for coating plants that supply shipyards and car factories.
China's low-VOC shift reshapes container demand
China's coatings base gives the region its scale, and stricter limits on solvents are changing what those coatings are packed in. China produced 35.34 million metric tons of coatings in 2024, and environmentally friendly coatings made up more than 60% of domestic use, China Daily reported from the 2025 China International Coatings Summit. Mandatory national limits for architectural wall, woodware, vehicle and industrial protective coatings took effect on Dec. 1, 2020. Water-based paints need lined tinplate or plastic containers that resist corrosion, which shifts orders away from plain steel. Nippon Paint began building a China headquarters in Pudong in late 2024 that includes a construction material packaging base, the Pudong government reported. As a result, coated tinplate and plastic pails gain orders from Chinese wall paint makers.
Plastic pails and recycled content reshape packs
Shift from tinplate toward polyolefin pails
Paint makers in India and Southeast Asia are moving many decorative packs from tinplate to injection-molded polyolefin pails, because plastic resists rust from water-based paint and carries printed labels well. Hitech Corporation makes injection-molded paint pails at plants located near major client sites, Plastemart reported in February 2026. Mitsu Chem Plast runs four plants in Maharashtra with more than 36,000 metric tons a year of capacity and announced a further 600 metric tons a year in September 2026, The Machine Maker reported. Metal formats keep a role, since lever-lid tinplate containers still suit solvent-borne enamels and small retail tins. As a result, polyolefins grow fastest among materials at 6.10% a year.
Rise of recycled content rules for rigid plastic packs
Recycled-content rules are rising in India, and they apply directly to the plastic pails and buckets that hold decorative paint. India's Plastic Waste Management Rules set a 30% recycled-content obligation for rigid plastic packaging from 2025-26, rising by 10 percentage points a year to 60% in 2028-29, Packaging Gateway reported in April 2026. Producers can carry unmet 2025-26 obligations forward for up to three years, although they must clear at least one-third of the shortfall each year. The Association of PET Recyclers Bharat puts recycling capacity at about 300,000 metric tons, the same report noted. As a result, pail makers are qualifying recycled polypropylene and HDPE grades with Indian paint brands before each annual step.
Opportunity in Southeast Asian bulk coating containers
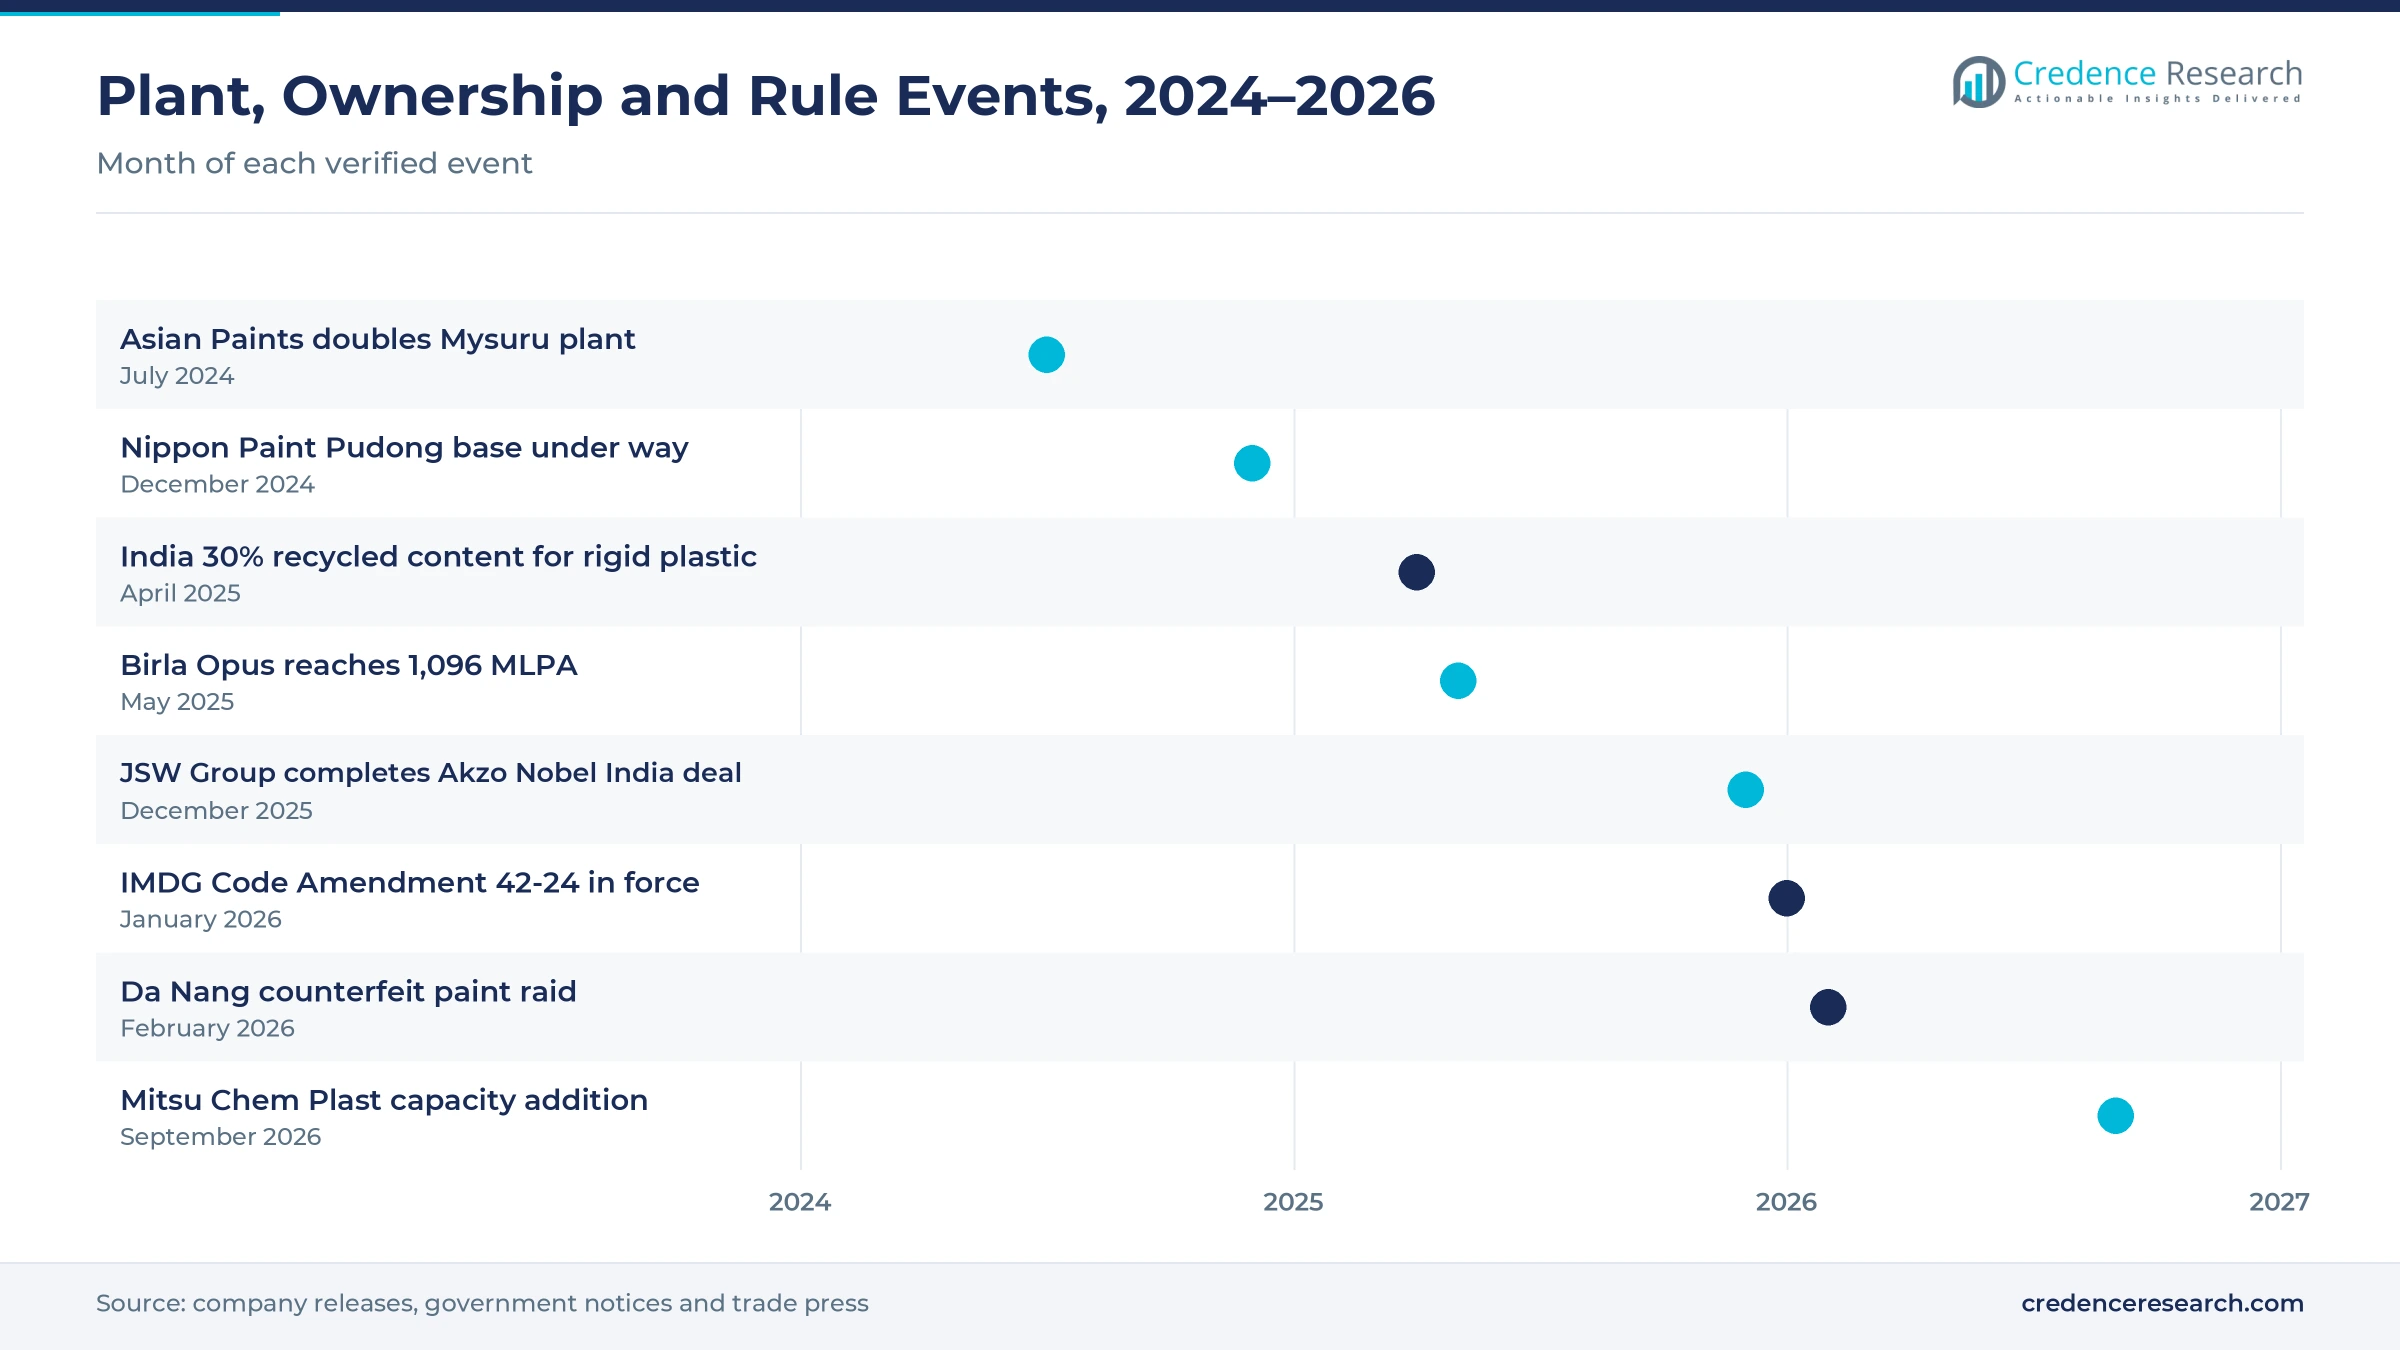
Southeast Asia offers an opening for drum and bulk container suppliers, because manufacturing output there is growing and local coating plants need certified packs. Vietnam's manufacturing value added rose to about USD 115.9 billion in 2024 from USD 104.6 billion in 2023, according to the World Bank. Time Technoplast makes drums, jerry cans, pails and IBCs in Thailand, Taiwan, Indonesia, Vietnam and Malaysia, its June 2025 results release states. Greif runs drum plants in Singapore, Malaysia and Vietnam and imports intermediate bulk containers from China for the subregion. Consequently, Remaining APAC grows at 5.92% a year, faster than the regional average.
Opening for pouch and bag-in-box refill packs
Flexible refill formats offer an opening, because they use less material per liter than rigid pails and suit tinting and touch-up products. Can-One, the Malaysian packaging group, states that its Canzo unit makes bag-in-box and flexible packaging alongside plastic jerry cans. Refill packs also suit tinting machines at dealer counters, because a dealer can dose colorant into a small pouch instead of opening a full pail. India's recycled-content obligation for rigid plastic packaging started at 30% in 2025-26, which also pushes brands to test lighter formats. Global coatings output reached 48.9 billion liters in 2024, China Daily reported, so even a small shift of retail volume into refill packs is meaningful. As a result, pouches and bag-in-box packs grow fastest among product types at 7.28% a year.
Metal costs, recycling rules and fakes test suppliers
Steel and tinplate costs squeeze can makers
Tinplate and cold-rolled steel prices follow iron ore, coking coal and tin, so can and drum makers carry sharp swings in their largest input cost. As a result, makers with fixed-price supply contracts lose margin when coil prices rise before contracts reset. Smaller paint brands then switch to plastic pails, which cuts metal volumes further. Can makers respond with price escalation clauses, thinner gauges and lined cans that justify a premium for water-based paint.
Recycled-content targets raise pail costs
India's rising recycled-content targets for rigid plastic packaging force pail makers to buy recycled polypropylene and HDPE that is scarcer and less consistent than virgin resin. Consequently, molders must test color, odor and drop strength again before paint brands accept the new grades. Costs rise during the transition, and small molders struggle to secure audited recyclate. Suppliers respond with long recyclate contracts, darker pail colors and labels that hide visual variation.
Refilled genuine containers aid counterfeiters
Counterfeiters collect genuine empty paint cans and pails, refill them with cheap product and resell them through small dealers. Because the outer pack looks real, painters and homeowners cannot easily tell the difference, which harms brand trust and dealer margins. The February 2026 Da Nang case involved thousands of empty containers and fake labels. Brands and container makers respond with in-mold labels, tamper-evident lids, scannable codes and buy-back schemes for used packs.
Flat paint volumes in mature markets cap orders
Paint volumes in mature markets are no longer growing, so container makers there compete for a fixed pool of orders. Japan's paint output barely changed in 2025, which limits new demand for cans and pails. As a result, suppliers face price pressure and idle lines, while customers ask for smaller lots and more designs. Makers respond by consolidating plants, exporting to faster markets and selling higher-value aerosol and specialty packs.
China leads while India grows fastest in the region
| Country | Value, 2025 (USD billion) | Share, 2025 | CAGR, 2026–2035 |
|---|---|---|---|
| China | 8.25 | 50.3% | 5.12% |
| Remaining APAC | 3.75 | 22.9% | 5.92% |
| Japan | 1.95 | 11.9% | 3.22% |
| India | 1.66 | 10.1% | 6.82% |
| South Korea | 0.79 | 4.8% | 4.52% |
China anchors regional container volumes
China held 50.3% of 2025 value and grows at 5.12% a year, close to the regional pace, because its coatings industry is already the largest in Asia Pacific. Main business revenue of China's coatings industry rose 1.56% to 408.9 billion yuan in 2024, which reflects steady rather than rapid volume growth. China's manufacturing value added reached about USD 4.65 trillion in 2024, supporting demand for industrial coating drums. Environmentally friendly coatings already account for most domestic use, which shifts orders toward lined tinplate and plastic pails.
Remaining APAC adds demand through Southeast Asia
Remaining APAC held 22.9% of 2025 value and grows at 5.92% a year, led by Indonesia, Thailand, Vietnam, Malaysia and Australia. Indonesia's manufacturing value added was about USD 265.1 billion in 2024, the largest in Southeast Asia. Time Technoplast and Greif both run drum plants in the subregion, while Can-One makes tin cans in Malaysia and Indonesia. Counterfeit cases such as the 2026 Jotun raid in Da Nang push brands toward sealed and traceable packs.
Japan relies on mature steel and aerosol formats
Japan held 11.9% of 2025 value and grows at 3.22% a year, the slowest pace in the region, because paint output has leveled off. Japan produced 1,422,390 tons of paint in 2025, according to the Japan Paint Manufacturers Association. JFE Container, based in Hyogo Prefecture, makes steel drums and pails for industrial buyers in Japan. Demand for Japanese aerosol cans in spray paint and touch-up products supports container value despite flat bulk volumes.
India grows fastest on new paint capacity
India held 10.1% of 2025 value and grows at 6.82% a year, the fastest pace in the region, because new paint plants are still opening. Birla Opus held more than 21% of organized decorative paint capacity in India by May 2025, while Asian Paints had more than 1,850 million liters a year. Mold-Tek Packaging and Hitech Corporation supply plastic pails from plants near paint makers, Mitsu Chem Plast makes pail containers in Maharashtra, and Time Technoplast supplies drums and IBCs from five sites run by its TPL Plastech unit.
South Korea depends on marine and industrial coatings
South Korea held 4.8% of 2025 value and grows at 4.52% a year, below the regional pace, because decorative paint demand is mature. Manufacturing value added reached about USD 499.2 billion in 2024, which sustains demand for industrial coatings used by car, electronics and steel plants. Shipyard order books add marine coating volume, which is shipped to yards in drums and certified pails.
Plant additions, takeovers and shipping rules
| Development | Status and market relevance |
|---|---|
| In September 2026, Mitsu Chem Plast announced a further 600 metric tons a year of manufacturing capacity, taking its fiscal 2027 additions to 6,700 metric tons a year. | Adds plastic container capacity in India |
| In February 2026, police in Da Nang seized more than five metric tons of counterfeit Jotun-branded paint and putty packed in refilled genuine cans. | Shows why brands demand tamper-evident and traceable packs |
| In January 2026, Amendment 42-24 of the International Maritime Dangerous Goods Code entered into force for sea shipments. | Keeps certified drums and pails central to coating exports |
| In December 2025, AkzoNobel completed the sale of Akzo Nobel India to the JSW Group. | Consolidates another Indian paint business under a domestic owner |
| In May 2025, Birla Opus reached 1,096 million liters a year of installed paint capacity across its Indian plants. | Lifts container orders near new plant sites |
Decoration, linings and certified bulk packs
- Injection-molded pails with in-mold labels carry decoration fused into the pail wall, which resists scuffing in dealer stores and makes copying harder for counterfeiters.
- Lined tinplate cans protect water-based paint from rust while keeping the stiffness of steel for stacking, tinting machines and long road journeys.
- UN-certified drums and IBCs carry tested drop, stacking and leakproof ratings for flammable coatings shipped by sea, road and rail across the region.
- Tamper-evident lids and seals show whether a container was opened before sale, which helps dealers and painters spot refilled or diluted packs.
Need a Custom Version of This Report?
Tailor the scope, geography, or segments to your exact requirements.
- Custom geography or segment scope
- Direct access to our analyst team
Local converters and global drum makers compete
Competition splits between local plastic molders that serve decorative paint brands and steel or bulk container makers that serve industrial coating plants. Mold-Tek Packaging supplies in-mold labeled pails to Asian Paints, Berger Paints and Kansai Nerolac from plants near Indian paint hubs. Hitech Corporation and Mitsu Chem Plast also make plastic pails in India. Time Technoplast makes drums, jerry cans, pails and IBCs in India and five other Asian countries. Mauser Packaging Solutions works in India through the Time Mauser joint venture, which opened a steel drum plant at Jambusar in 2017. Greif makes steel, plastic and composite drums in Singapore, Malaysia and Vietnam, while JFE Container supplies steel drums and pails in Japan. Buyers weigh price, plant distance, decoration quality and certification when they choose a supplier.
Companies profiled and their roles in this market
| Company | Type | Role in the market |
|---|---|---|
| Mold-Tek Packaging | Rigid plastic converter | In-mold labeled paint pails for Asian Paints, Berger Paints and Kansai Nerolac |
| Hitech Corporation | Rigid plastic converter | Injection-molded paint pails from plants near client sites in India |
| Mitsu Chem Plast | Plastic packaging maker | Pail containers and caps from four plants in Maharashtra |
| Time Technoplast | Industrial packaging maker | Drums, jerry cans, pails and IBCs in India and five Asian countries |
| Mauser Packaging Solutions | Steel drum maker | Time Mauser joint venture drum plants at Pen and Jambusar, India |
| Greif | Industrial packaging maker | Steel, plastic and composite drums from Singapore, Malaysia and Vietnam |
| JFE Container | Steel container maker | Steel drums and pails, based in Hyogo Prefecture, Japan |
Credence Research view on regional paint containers
Credence Research's view is that regional paint containers are moving from plain steel toward decorated plastic pails for decorative paint, while industrial coatings keep certified steel and plastic drums. India will grow fastest, because new paint plants keep opening and suppliers co-locate beside them. China stays the volume base, although its growth tracks the regional pace. Japan and South Korea remain mature, so suppliers there depend on aerosol, marine and specialty packs. Suppliers that pair in-mold decoration, recycled resin and tamper-evident lids should gain share as recycling rules and counterfeit pressure rise.
How the regional paint container estimate was built
The report uses 2025 as the base year and forecasts values to 2035 in USD million from the Credence Research market model. Country, product type, material, application and customer type splits are Credence Research estimates based on coatings output, manufacturing statistics, paint plant capacity, company product information and trade press. Sources include the World Bank, the Japan Paint Manufacturers Association, the Hong Kong Marine Department, China Daily, company releases and trade publications. No interviews or surveys were conducted for this edition of the regional report.
Plant capacity and safer packs carry growth to 2035
The APAC paint packaging market is projected to grow from USD 17.30 billion in 2026 to USD 27.42 billion by 2035, a 5.25% CAGR during 2026–2035, as paint plant additions, industrial coating output and brand protection needs keep container demand rising. Growth should be strongest in India while new capacity fills up and suppliers build plants beside paint makers. Later in the period, recycled-content rules and refill formats should shift value toward recycled pails, pouches and decorated packs. Faster construction would raise this outlook, while weak housing demand or sharp metal price swings would lower it.
Frequently Asked Questions
How big is the APAC paint packaging market?
Which product type leads regional demand?
Which country leads the regional market?
Why are plastic pails gaining share?
How do shipping rules affect paint containers?
Why does brand protection matter for paint containers?
Who are the leading companies in the region?
What are the main challenges for container suppliers?
Table of Content
Chapter 1 Market Segmentation
- 1.1 Segmentation Framework
- 1.1.1 Product and Service Classification
- 1.1.2 Application and End-Use Classification
- 1.1.3 Technology and Solution Classification
- 1.1.4 Customer and Distribution Channel Classification
- 1.1.5 Geographic Segmentation
- 1.1.6 Market Segment Definitions and Boundaries
- 1.2 By Product Type
- 1.2.1 Cans and Pails
- 1.2.2 Drums
- 1.2.3 Pouches and Bag-in-Box
- 1.2.4 Bottles
- 1.2.5 Aerosol Cans
- 1.3 By Material
- 1.3.1 Steel and Tinplate
- 1.3.2 Polyolefins
- 1.3.3 PET
- 1.3.4 Aluminium and Composite Materials
- 1.4 By Application
- 1.4.1 Architectural Paints
- 1.4.2 Industrial Coatings
- 1.4.3 Specialty Coatings
- 1.5 By Customer Type
- 1.5.1 Integrated Paint Brands
- 1.5.2 Contract Paint Fillers
- 1.5.3 Independent Paint Formulators
- 1.6 By Country
- 1.6.1 China
- 1.6.2 India
- 1.6.3 Japan
- 1.6.4 South Korea
- 1.6.5 Remaining APAC
Chapter 2 Introduction
- 2.1 Report Objectives and Scope
- 2.2 Product Definition and Industry Terminology
- 2.3 Market Inclusions and Exclusions
- 2.4 Research Process
- 2.4.1 Primary Research and Expert Interviews
- 2.4.2 Secondary Research and Source Review
- 2.4.3 Top-Down and Bottom-Up Estimation
- 2.4.4 Data Triangulation and Verification
- 2.5 Market Size Measurement Basis
- 2.5.1 2025: USD 16.39 billion → 2035: USD 27.42 billion
- 2.6 Historical and Forecast Reference Periods
- 2.6.1 Historical Period: 2018-2025
- 2.6.2 Base Year: 2025
- 2.6.3 Forecast Period: 2025-2035
- 2.7 Research Assumptions and Limitations
Chapter 3 Executive Summary
- 3.1 Market Snapshot and Key Findings
- 3.2 Base-Year Market Size, 2025
- 3.3 Forecast Market Size, 2035
- 3.4 Revenue and Volume Growth Outlook
- 3.5 Key Demand and Supply Indicators
- 3.6 Leading Market Segments
- 3.7 Fastest-Growing Market Opportunities
- 3.8 Regional Performance Highlights
- 3.9 Technology and Industry Transformation
- 3.10 Competitive Landscape Summary
- 3.11 Analyst View and Strategic Implications
Chapter 4 APAC Paint Packaging Market Trends and Developments
- 4.1 Historical Industry Development, 2018-2025
- 4.2 Recent Market Trends and Developments
- 4.3 Demand and Customer Behavior Trends
- 4.4 Technology and Product Innovation
- 4.5 Artificial Intelligence, Automation and Digitalization
- 4.6 Local Manufacturing and Supply Chain Realignment
- 4.7 Industry Partnerships, Mergers and Acquisitions
- 4.8 Sustainability and Circular Economy Developments
- 4.9 Government and Private Sector Investment Trends
- 4.10 Emerging Business Models and Commercialization
- 4.11 Industry Developments and Announcements
Chapter 5 APAC Paint Packaging Market Production, Supply and Demand Analysis
- 5.1 Demand Trend and Consumption Analysis, 2018-2025
- 5.2 Demand Forecast, 2025-2035
- 5.3 Production and Output Trend, 2018-2025
- 5.4 Production and Output Forecast, 2025-2035
- 5.5 Installed Capacity and Capacity Utilization
- 5.6 Company-Wise Production Plants and Statistics
- 5.6.1 Installed Production Capacity
- 5.6.2 Actual Production
- 5.6.3 Planned Capacity and Expansion Targets
- 5.7 Supply Chain Structure and Procurement Trends
- 5.8 Supply-Demand Gap and Bottlenecks
- 5.9 Import Dependence and Sourcing Structure
- 5.10 Contract Manufacturing and Outsourcing
- 5.11 Regional Supply and Demand Concentration
Chapter 6 APAC Paint Packaging Market Pricing Analysis
- 6.1 Pricing Structure and Measurement
- 6.2 Historical Pricing Trends, 2018-2025
- 6.3 Pricing Outlook, 2025-2035
- 6.4 Average Selling Price and Unit Economics
- 6.5 Pricing by Product and Market Segment
- 6.6 Geographic Pricing Differences
- 6.7 Key Input, Energy, Labor and Logistics Costs
- 6.8 Contract Pricing and Purchasing Models
- 6.9 Pricing Sensitivity and Competitive Positioning
- 6.10 Price, Margin and Profitability Implications
Chapter 7 APAC Paint Packaging Market Dynamics
- 7.1 Market Growth Drivers
- 7.1.1 Demand-Side Drivers
- 7.1.2 Technology and Innovation Drivers
- 7.1.3 Infrastructure and Investment Drivers
- 7.1.4 Regulatory and Policy Drivers
- 7.2 Market Restraints
- 7.2.1 Cost and Affordability Constraints
- 7.2.2 Technology and Adoption Barriers
- 7.2.3 Supply Chain and Operational Constraints
- 7.3 Market Challenges
- 7.3.1 Competitive Pressure and Margin Erosion
- 7.3.2 Skills, Infrastructure and Implementation Gaps
- 7.4 Emerging Market Opportunities
- 7.5 Market Dynamics Impact and Time-Horizon Assessment
Chapter 8 APAC Paint Packaging Value Chain Analysis
- 8.1 Industry Value Chain Overview
- 8.2 Upstream Suppliers and Critical Inputs
- 8.3 Technology and Component Providers
- 8.4 Manufacturing or Service Delivery
- 8.5 Distribution, Channel Partners and Integrators
- 8.6 Downstream Applications and End Users
- 8.7 Value Addition and Profit Pools
- 8.8 Vertical Integration and Outsourcing
- 8.9 Supplier Concentration and Risk
- 8.10 Supply Chain Localization and Resilience
Chapter 9 APAC Paint Packaging Market Regulations and Policies
- 9.1 Relevant Laws, Standards and Compliance Frameworks
- 9.2 Product, Service, Safety and Quality Requirements
- 9.3 Government Policies, Incentives and Subsidies
- 9.4 Imports, Exports and Trade Barriers
- 9.5 Public Procurement and Local Content Requirements
- 9.6 Environmental and Sustainability Compliance
- 9.7 Upcoming Policy Changes and Market Implications
Chapter 10 APAC Paint Packaging Market Hotspots and Opportunities
- 10.1 Market Opportunity Mapping and Growth Hotspots
- 10.2 High-Growth Applications and Customer Groups
- 10.3 Underserved Markets and White-Space Opportunities
- 10.4 Emerging Technology and Product Opportunities
- 10.5 New Capacity and Investment Hotspots
- 10.6 Market Entry and Expansion Opportunities
- 10.7 Distribution and Partnership Opportunities
- 10.8 Near-Term and Long-Term Commercial Potential
- 10.9 Opportunity Attractiveness and Execution Risks
Chapter 11 APAC Paint Packaging Market Outlook, 2025-2035
- 11.1 Market Size and Analysis
- 11.1.1 Revenue (Market Measurement: 2025: USD 16.39 billion → 2035: USD 27.42 billion)
- 11.1.2 Market Volume and Quantity Sold
- 11.1.3 Historical Market Size, 2018-2025
- 11.1.4 Base-Year Market Size, 2025
- 11.2 Market Forecast, 2025-2035
- 11.2.1 Revenue Forecast to 2035
- 11.2.2 Volume Forecast to 2035
- 11.2.3 CAGR and Year-on-Year Growth
- 11.2.4 Incremental Revenue Opportunity
- 11.3 Forecast Assumptions and Scenario Analysis
- 11.3.1 Base-Case Forecast
- 11.3.2 Optimistic and Conservative Scenarios
- 11.3.3 Technology, Pricing and Policy Sensitivities
- 11.4 Market Attractiveness and Growth Outlook
Chapter 12 APAC Paint Packaging Market Segmentation and Outlook
- 12.1 Segmentation Summary and Market Shares, 2025
- 12.2 Largest and Fastest-Growing Segments
- 12.3 By Product Type - Market Size and Forecast, 2025-2035
- 12.3.1 Segment Definition and Scope
- 12.3.2 Historical Market Size, 2018-2025
- 12.3.3 Revenue Forecast, 2025-2035
- 12.3.4 Volume Forecast, 2025-2035
- 12.3.5 Base-Year Market Share, 2025
- 12.3.6 Segment CAGR and Growth Drivers
- 12.3.7 Subsegment Market Size and Forecast
- 12.3.7.1 Cans and Pails
- 12.3.7.2 Drums
- 12.3.7.3 Pouches and Bag-in-Box
- 12.3.7.4 Bottles
- 12.3.7.5 Aerosol Cans
- 12.3.8 Subsegment Pricing and Adoption Trends
- 12.3.9 Leading Suppliers and Competition
- 12.3.10 Regional Demand and Opportunities
- 12.4 By Material - Market Size and Forecast, 2025-2035
- 12.4.1 Segment Definition and Scope
- 12.4.2 Historical Market Size, 2018-2025
- 12.4.3 Revenue Forecast, 2025-2035
- 12.4.4 Volume Forecast, 2025-2035
- 12.4.5 Base-Year Market Share, 2025
- 12.4.6 Segment CAGR and Growth Drivers
- 12.4.7 Subsegment Market Size and Forecast
- 12.4.7.1 Steel and Tinplate
- 12.4.7.2 Polyolefins
- 12.4.7.3 PET
- 12.4.7.4 Aluminium and Composite Materials
- 12.4.8 Subsegment Pricing and Adoption Trends
- 12.4.9 Leading Suppliers and Competition
- 12.4.10 Regional Demand and Opportunities
- 12.5 By Application - Market Size and Forecast, 2025-2035
- 12.5.1 Segment Definition and Scope
- 12.5.2 Historical Market Size, 2018-2025
- 12.5.3 Revenue Forecast, 2025-2035
- 12.5.4 Volume Forecast, 2025-2035
- 12.5.5 Base-Year Market Share, 2025
- 12.5.6 Segment CAGR and Growth Drivers
- 12.5.7 Subsegment Market Size and Forecast
- 12.5.7.1 Architectural Paints
- 12.5.7.2 Industrial Coatings
- 12.5.7.3 Specialty Coatings
- 12.5.8 Subsegment Pricing and Adoption Trends
- 12.5.9 Leading Suppliers and Competition
- 12.5.10 Regional Demand and Opportunities
- 12.6 By Customer Type - Market Size and Forecast, 2025-2035
- 12.6.1 Segment Definition and Scope
- 12.6.2 Historical Market Size, 2018-2025
- 12.6.3 Revenue Forecast, 2025-2035
- 12.6.4 Volume Forecast, 2025-2035
- 12.6.5 Base-Year Market Share, 2025
- 12.6.6 Segment CAGR and Growth Drivers
- 12.6.7 Subsegment Market Size and Forecast
- 12.6.7.1 Integrated Paint Brands
- 12.6.7.2 Contract Paint Fillers
- 12.6.7.3 Independent Paint Formulators
- 12.6.8 Subsegment Pricing and Adoption Trends
- 12.6.9 Leading Suppliers and Competition
- 12.6.10 Regional Demand and Opportunities
- 12.7 By Country - Market Size and Forecast, 2025-2035
- 12.7.1 Segment Definition and Scope
- 12.7.2 Historical Market Size, 2018-2025
- 12.7.3 Revenue Forecast, 2025-2035
- 12.7.4 Volume Forecast, 2025-2035
- 12.7.5 Base-Year Market Share, 2025
- 12.7.6 Segment CAGR and Growth Drivers
- 12.7.7 Subsegment Market Size and Forecast
- 12.7.7.1 China
- 12.7.7.2 India
- 12.7.7.3 Japan
- 12.7.7.4 South Korea
- 12.7.7.5 Remaining APAC
- 12.7.8 Subsegment Pricing and Adoption Trends
- 12.7.9 Leading Suppliers and Competition
- 12.7.10 Regional Demand and Opportunities
- 12.8 Segment Growth Comparison
- 12.9 Segment Attractiveness and Priority Matrix
Chapter 13 APAC Paint Packaging End-Use and Application Market Outlook
- 13.1 End-Use Industry and Customer Demand Structure
- 13.2 Leading Applications and Customer Groups
- 13.3 End-Use Market Size, Share and Forecast
- 13.4 Major End-Use Industry Deep Dives
- 13.4.1 Customer Requirements and Use Cases
- 13.4.2 Demand and Replacement Cycles
- 13.4.3 Technical and Regulatory Considerations
- 13.4.4 Purchasing and Procurement Models
- 13.4.5 Leading Vendors and Distribution Channels
- 13.4.6 Forecast and Commercial Opportunities
- 13.5 Emerging Applications and Cross-Segment Demand
- 13.6 End-Use Industry Investment Priorities
Chapter 14 APAC Paint Packaging Geographic Market Outlook, 2025-2035
- 14.1 Regional Market Size and Country-Level Shares, 2025
- 14.2 Country Market Size Comparison, 2025
- 14.3 Country Market Forecasts, 2025-2035
- 14.4 Subregional Industrial and Demand Clusters
- 14.5 Intra-Regional Pricing and Cost Differences
- 14.6 Cross-Border Trade and Supply Networks
- 14.7 Regional Supply and Demand Balances
- 14.8 Country Opportunity Comparison and Prioritization
Note: Every listed country is covered on the structure shown under the first country.
Chapter 15 APAC Paint Packaging Technology, Innovation and Sustainability Outlook
- 15.1 Technology Landscape and Maturity
- 15.2 Product, Process and Service Innovation
- 15.3 AI, Automation and Digital Tools in the Industry
- 15.4 Technology Adoption and Performance Benchmarking
- 15.5 Innovation Pipeline and R&D Investment
- 15.6 Patent and Intellectual Property Trends
- 15.7 Energy Efficiency and Resource Management
- 15.8 Sustainability, Recycling and Circularity
- 15.9 Technology Roadmap, 2025-2035
- 15.10 Risks of Obsolescence and Technology Substitution
Chapter 16 APAC Paint Packaging Market Key Strategic Imperatives
- 16.1 Growth and Market Entry Priorities
- 16.2 High-Return Products and Segments
- 16.3 Pricing, Profitability and Cost Optimization
- 16.4 Technology Investment and Product Differentiation
- 16.5 Supply Chain Localization and Resilience
- 16.6 Distribution and Customer Acquisition
- 16.7 Partnership, Acquisition and Capacity Strategy
- 16.8 Regional Expansion Priorities
- 16.9 Short-, Medium- and Long-Term Actions
Chapter 17 Competition Outlook
- 17.1 Industry Competition Characteristics
- 17.2 Market Structure and Concentration
- 17.3 Market Share and Competitive Positioning, 2025
- 17.4 Company-Wise Revenue and Product Benchmarking
- 17.5 Production and Service Capacity Benchmarking
- 17.6 Technology, Pricing and Differentiation
- 17.7 Regional Footprint and Distribution Strength
- 17.8 Mergers, Acquisitions and Strategic Alliances
- 17.9 New Entrants and Competitive Threats
- 17.10 Porter's Five Forces and Industry Attractiveness
- 17.11 Competitive Outlook, 2025-2035
Chapter 18 Company Profiles
- 18.1 Company Coverage and Selection Criteria
- 18.2 Greif
- 18.2.1 Business Description
- 18.2.2 Company Ownership and Geographic Presence
- 18.2.3 Product and Service Portfolio
- 18.2.4 Manufacturing and Operating Footprint
- 18.2.5 Production Capacity and Expansion Plans
- 18.2.6 Financial Performance and Investment
- 18.2.7 Market Share and Competitive Position
- 18.2.8 Technology and Innovation Capabilities
- 18.2.9 Strategic Alliances or Partnerships
- 18.2.10 Recent Developments
- 18.2.11 Growth Strategy and Outlook
- 18.3 Mauser Packaging Solutions
- 18.4 JFE Container
- 18.5 Kian Joo Can Factory
- 18.6 Time Technoplast
- 18.7 Mold-Tek Packaging
- 18.8 Hitech Corporation
- 18.9 Mitsu Chem Plast
- 18.10 Parekhplast India
- 18.11 Sun Packaging
- 18.12 Other Relevant Market Participants
Note: Every listed company is profiled on the structure shown under the first company. The company list is preliminary and may change based on research findings, market developments, data availability and client requirements.
Chapter 19 Disclaimer
- 19.1 Research and Forecast Disclaimer
- 19.2 Data Source and Estimation Limitations
Note: The depth of individual sections depends on data availability for this market. Volume, capacity, trade and other unit-based metrics are included where applicable.

