
Can lines and line renewals keep packaging plants investing
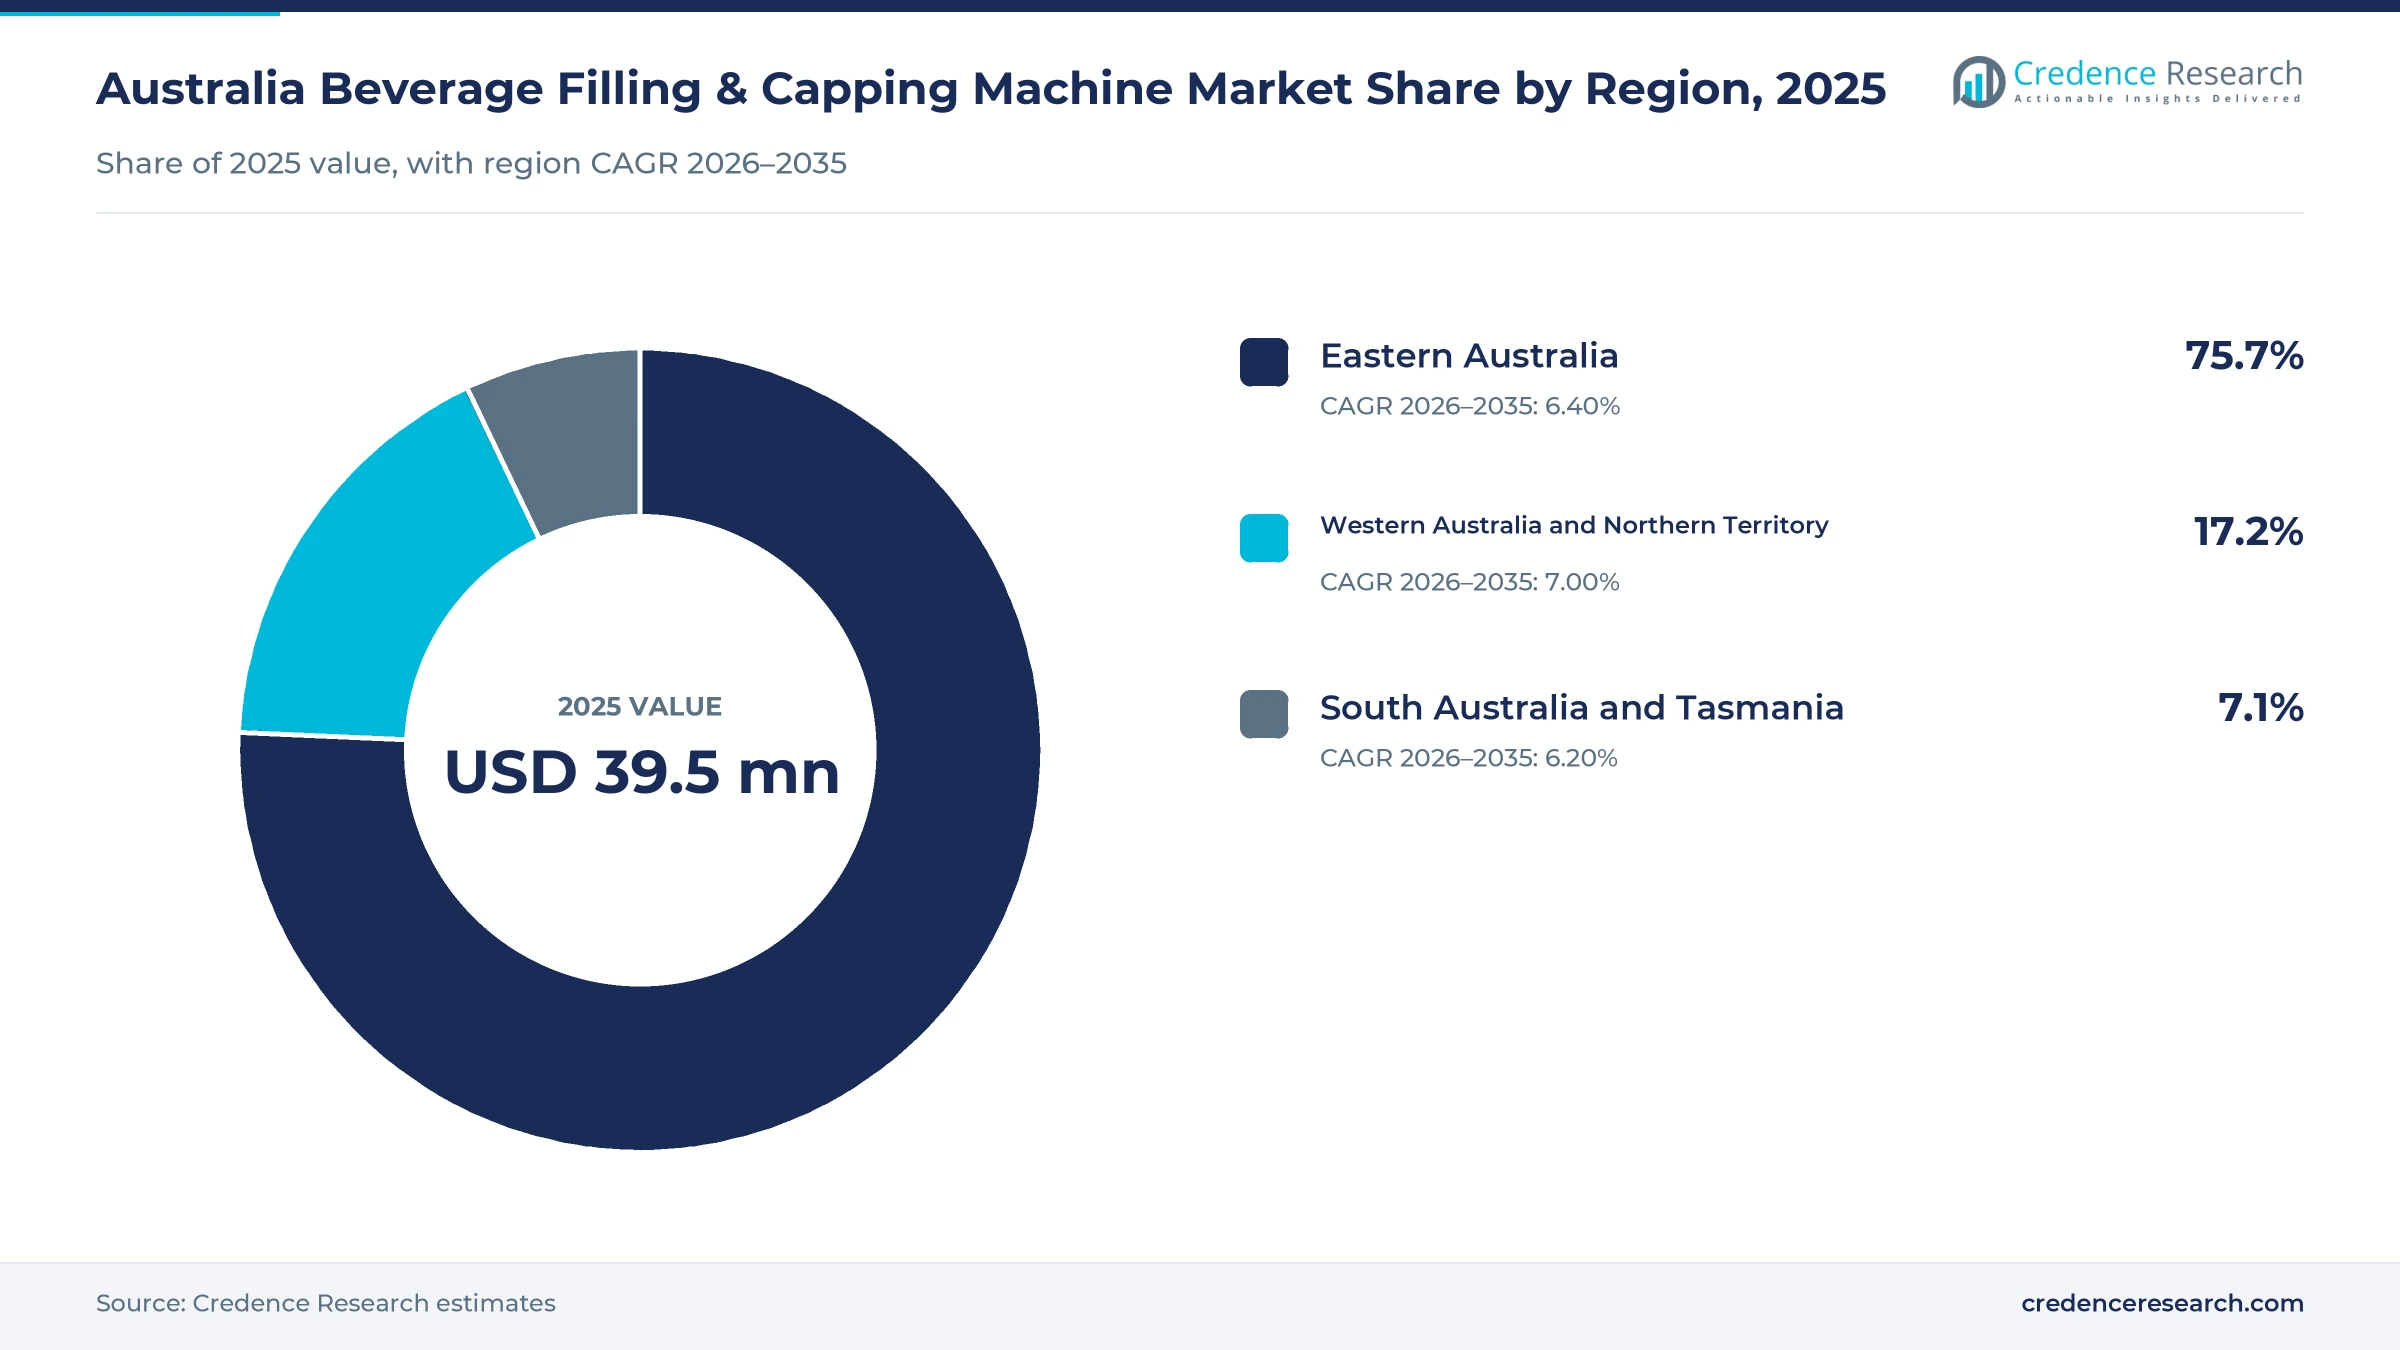
The Australia beverage filling and capping machine market was valued at USD 39.5 million in 2025 and is projected to increase from USD 48.0 million in 2026 to USD 84.5 million by 2035, registering a CAGR of 6.49% during 2026–2035. Demand comes from brewers, soft drink bottlers, wineries, distillers, juice processors and contract packers that buy fillers, cappers and combined lines to raise output and change formats. Eastern Australia held the largest regional share, 75.7% in 2025, because Queensland, New South Wales and Victoria host the largest breweries and soft drink plants. Western Australia and the Northern Territory form the fastest-growing region at 7.00% a year, as population growth lifts local drink production. In turn, can formats keep gaining share, and one large brewer opened a new can line at its Queensland brewery in May 2025.
Which drink packaging machines are counted in Australia?
The estimate measures spending in Australia on standalone fillers, standalone cappers and integrated filling and closing systems used for beer, ready-to-drink products, wine, spirits, water, soft drinks, juice and other sensitive drinks. It covers bottle, can, keg and bulk lines sold through direct OEM sales, distributors and system integrators, including manual, semi-automatic and fully automatic machines. Values are stated in USD million at current prices and exclude goods and services tax.
The estimate excludes blow molders, labelers, case packers, palletizers and conveyors sold as separate machines, along with spare parts and service contracts. The value chain runs from European, Asian and local machine builders through Australian subsidiaries, agents and integrators to breweries, wineries, bottlers and contract packers.
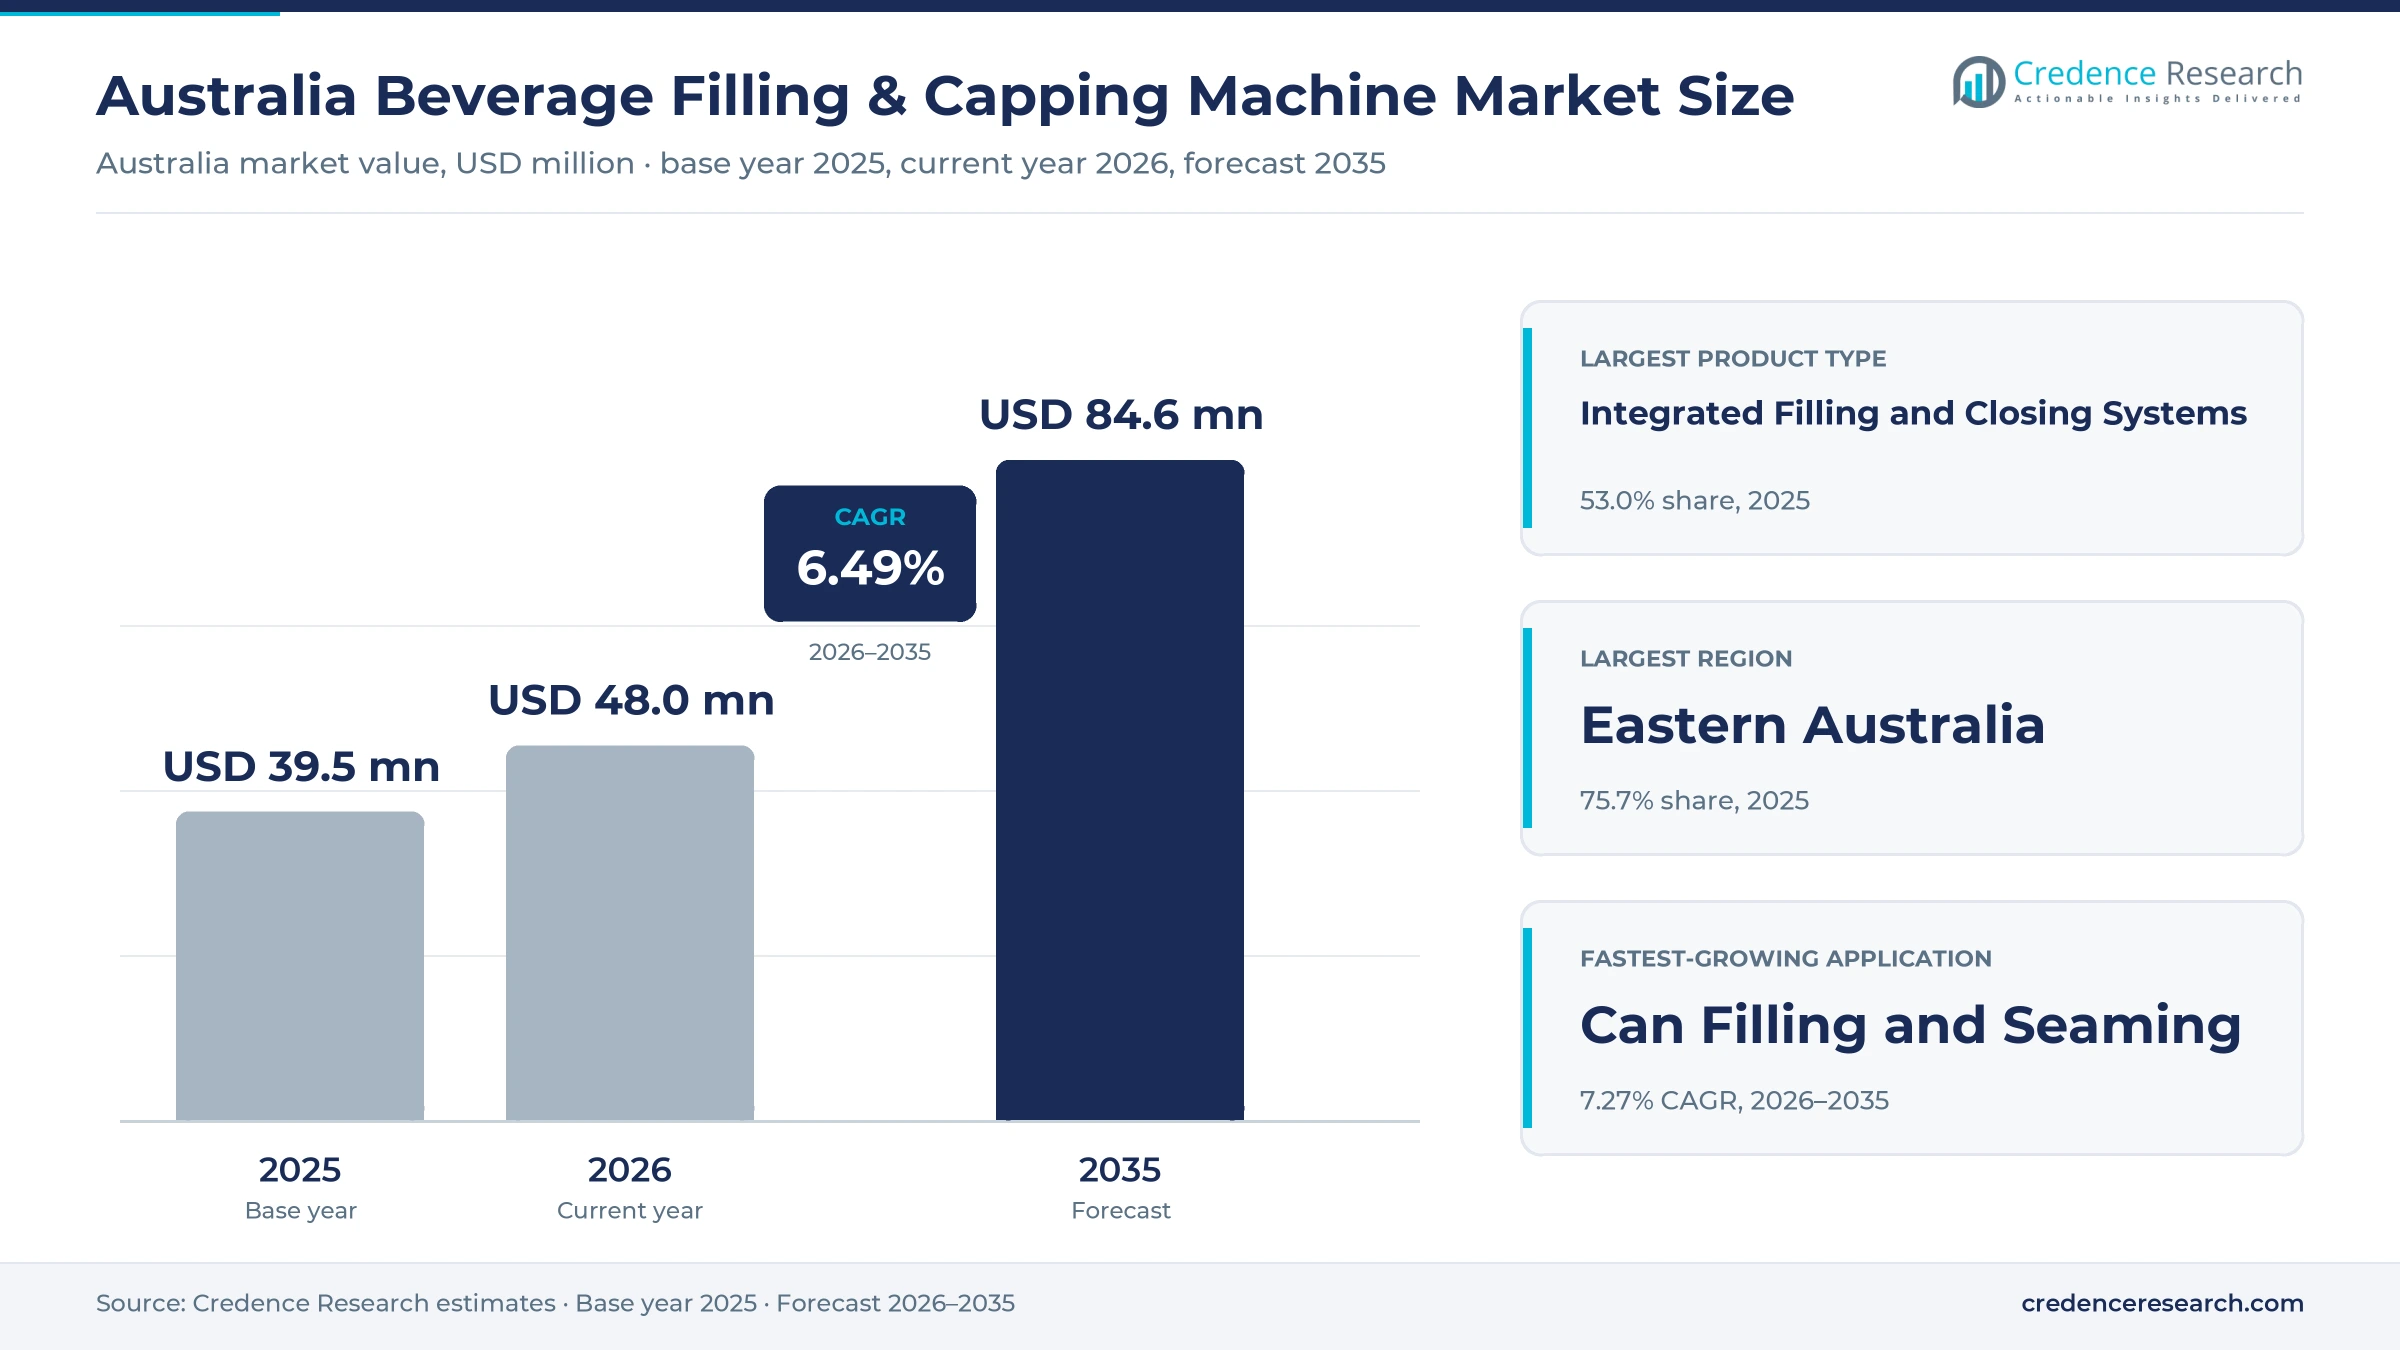
Australia Beverage Filling & Capping Machine Market Insights
- The Australia beverage filling and capping machine market was valued at USD 39.5 million in 2025 and is projected to reach USD 84.5 million by 2035, at a 6.49% CAGR during 2026–2035.
- Eastern Australia held 75.7% of 2025 value, because Queensland, New South Wales and Victoria host the largest breweries and soft drink plants.
- Integrated filling and closing systems led product types with 53.0% of 2025 value, as producers prefer monoblock lines that save floor space.
- In May 2025, a large brewer opened a new can line at its Yatala brewery in Queensland, able to make up to 400 million cans a year.
- Can filling and seaming grows fastest at 7.27% a year during 2026–2035, as cans overtake glass bottles in packaged beer sales.
Integrated systems lead while can lines grow fastest
Why do integrated systems lead machine spending?
Based on product type, the market is categorized into standalone fillers, standalone cappers and integrated filling and closing systems. Integrated Filling and Closing Systems led with 53.0% of 2025 value, because monoblock lines combine rinsing, filling and closing in less floor space with fewer transfer points. Integrated Filling and Closing Systems also grow fastest at 6.82% a year, as breweries and bottlers replace older separate machines.
Which drink makers buy the most packaging lines?
Based on end-use industry, the market is categorized into beer and RTD beverages, wine and spirits, water and carbonated soft drinks, and juice and sensitive beverages. Beer and RTD Beverages led with 37.0% of 2025 value, because brewers and RTD makers run high-speed can and bottle lines. Juice and Sensitive Beverages grows fastest at 7.05% a year, as aseptic and warm-fill lines spread.
How do can lines change application demand?
Based on application, the market is categorized into bottle filling and closing, can filling and seaming, and keg and bulk filling. Bottle Filling and Closing led with 47.0% of 2025 value, because wine, water, juice and spirits still ship mainly in glass and PET bottles. Can Filling and Seaming grows fastest at 7.27% a year, as cans overtake bottles in packaged beer.
Why do fully automatic systems dominate?
Based on technology, the market is categorized into manual systems, semi-automatic systems and fully automatic systems. Fully Automatic Systems led with 69.0% of 2025 value, because large brewers and bottlers need thousands of containers a minute with little labor. Fully Automatic Systems also grow fastest at 6.66% a year, as craft producers move from manual fillers to compact automatic lines.
| Segment Group | Leading Sub-segment | Share, 2025 | Fastest-growing Sub-segment | CAGR, 2026–2035 |
|---|---|---|---|---|
| By Product Type | Integrated Filling and Closing Systems | 53.0% | Integrated Filling and Closing Systems | 6.82% |
| By End-Use Industry | Beer and RTD Beverages | 37.0% | Juice and Sensitive Beverages | 7.05% |
| By Application | Bottle Filling and Closing | 47.0% | Can Filling and Seaming | 7.27% |
| By Technology | Fully Automatic Systems | 69.0% | Fully Automatic Systems | 6.66% |
Request a Free Sample
Fill in your details and we'll send you a free sample report.
- Sample data tables & charts
- Research methodology
Format shifts, automation and hygiene lift line spending
How does flexible format investment lift line spending?
Flexible format investment lifts line spending, because drink makers must switch between cans, glass and PET as buyers change habits. Cans made up 52% of one large brewer's packaged beer sales, up from 46% five years earlier, according to the brewer. That company opened a new can line at Yatala on May 2, 2025, able to make more than two million cans every 24 hours. A craft brewer near the Blue Mountains also installed a canning line in 2022 rated at 6,000 cans an hour and expandable to 15,000. As a result, can filling and seaming grows fastest among applications at 7.27% a year in the Australia beverage filling and capping machine market.
Why does automation and throughput renewal drive orders?
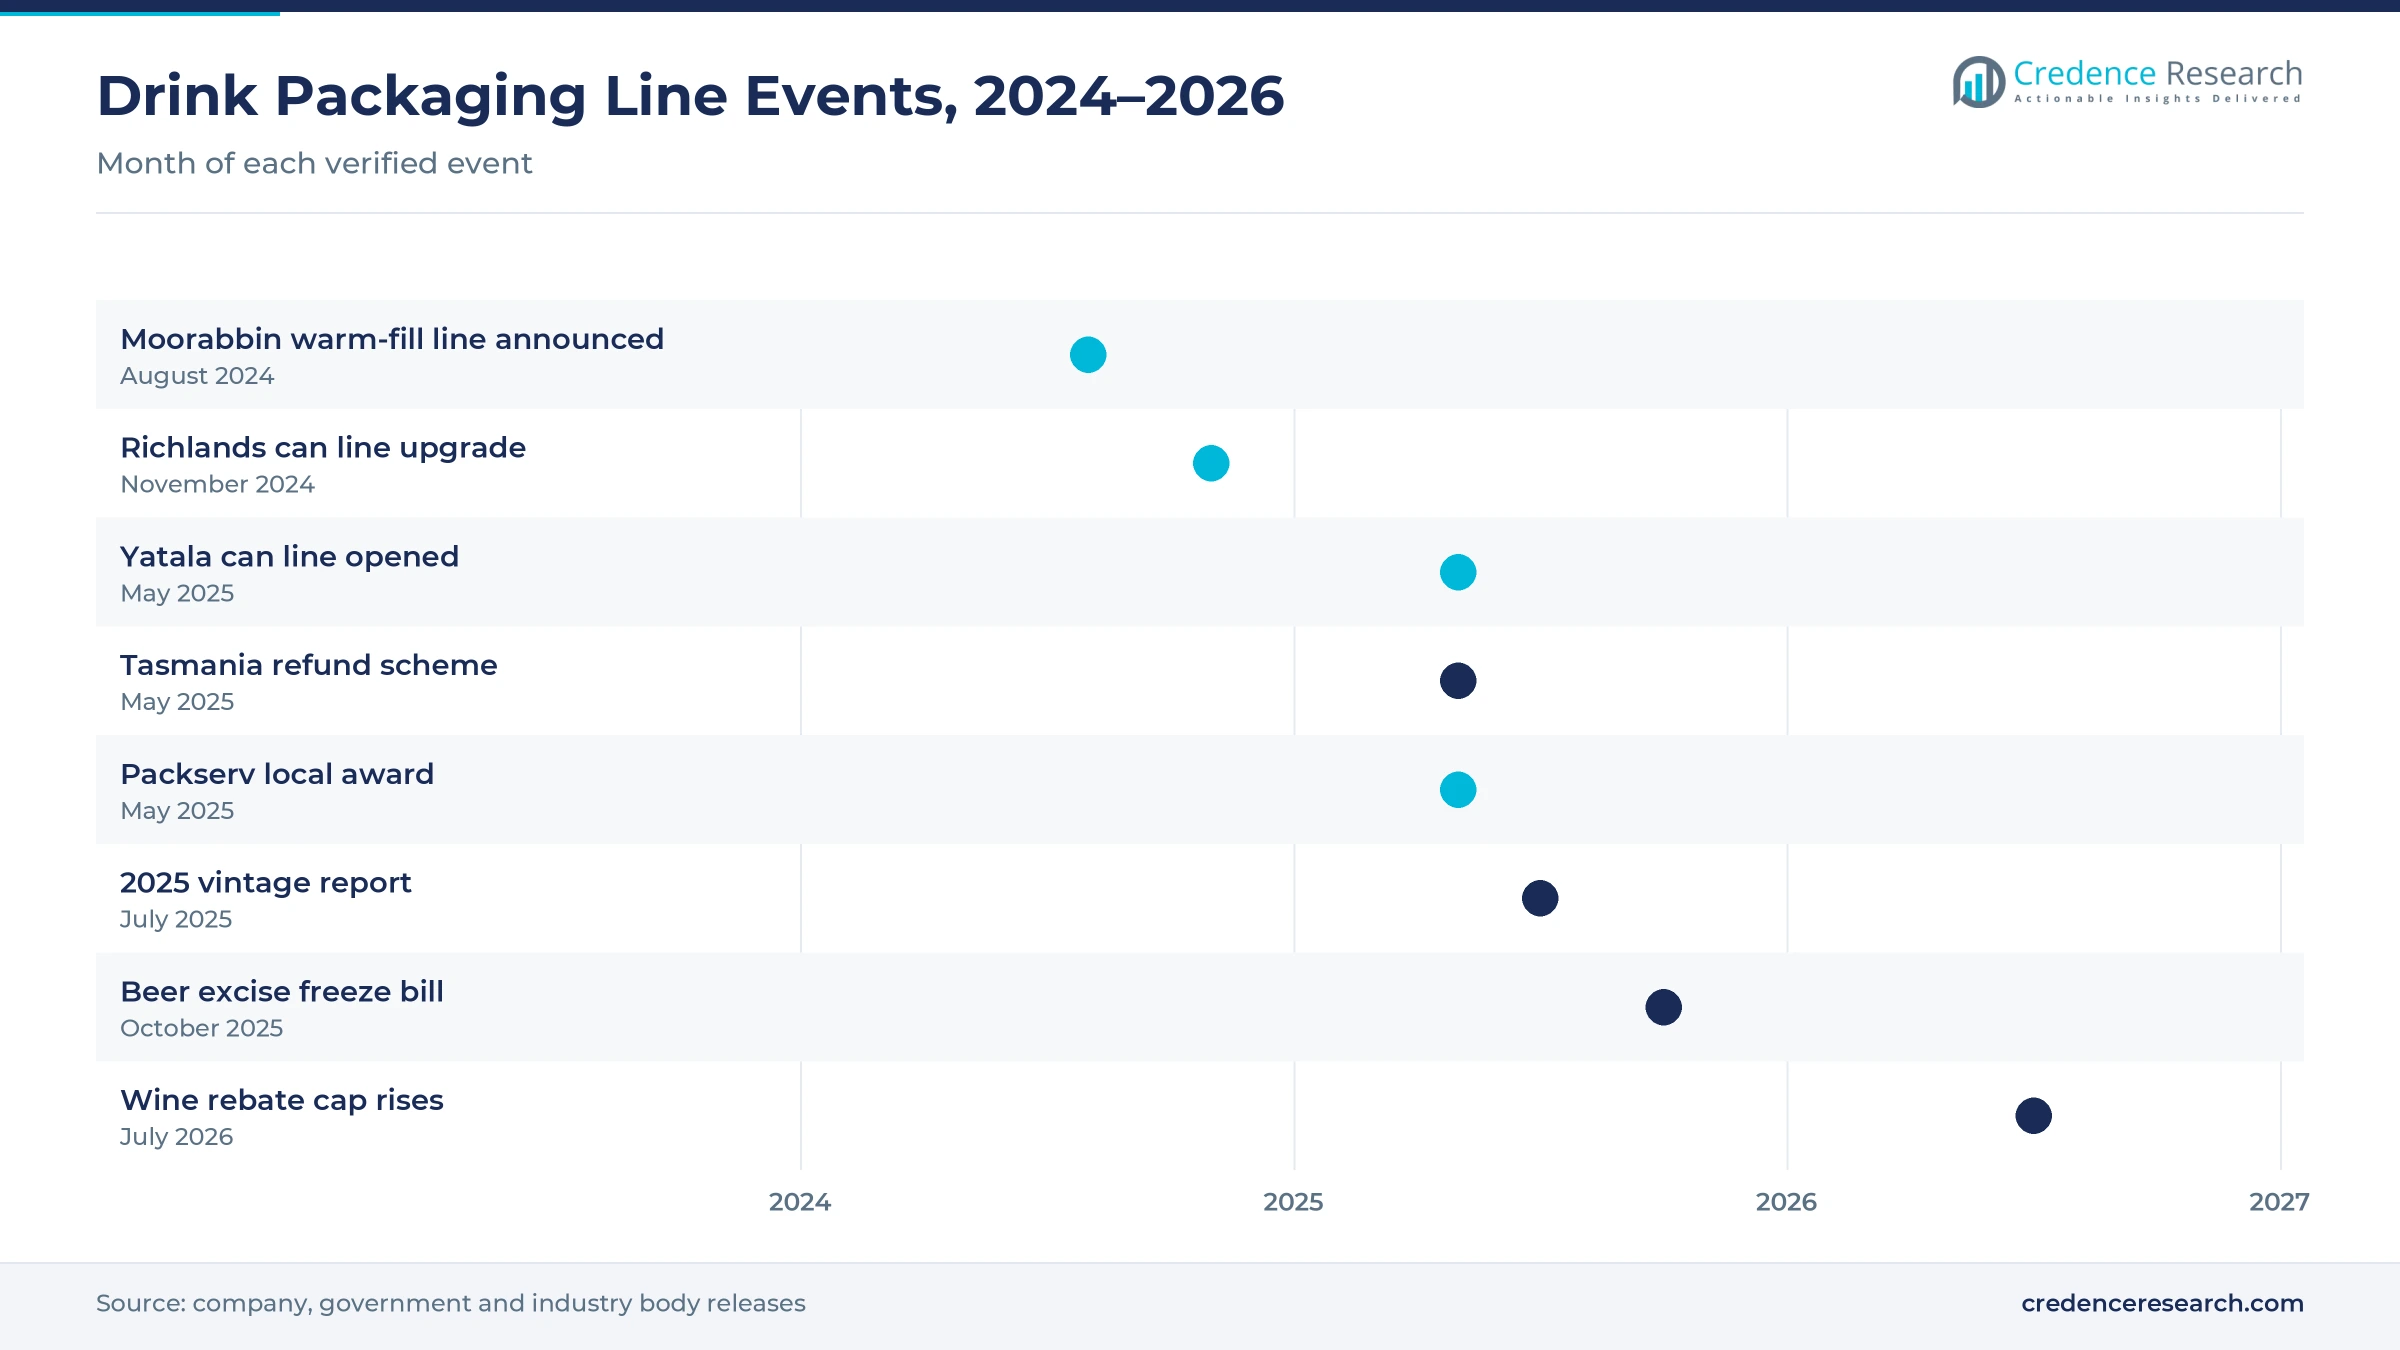
Automation and throughput renewal drive orders, because older lines waste energy, labor and product at high speeds. On Nov. 1, 2024, a major soft drink bottler completed a AUD 22.2 million can line upgrade at Richlands with capacity of up to 2,000 cans a minute, according to an industry report. The same company committed a further AUD 75 million to a new can line for energy drinks, due in mid-2025. Bundaberg Brewed Drinks also installed an in-house line rated at 15,000 cans an hour in 2020. Consequently, fully automatic systems hold 69.0% of 2025 value, and plants replace separate machines with canning equipment that runs faster.
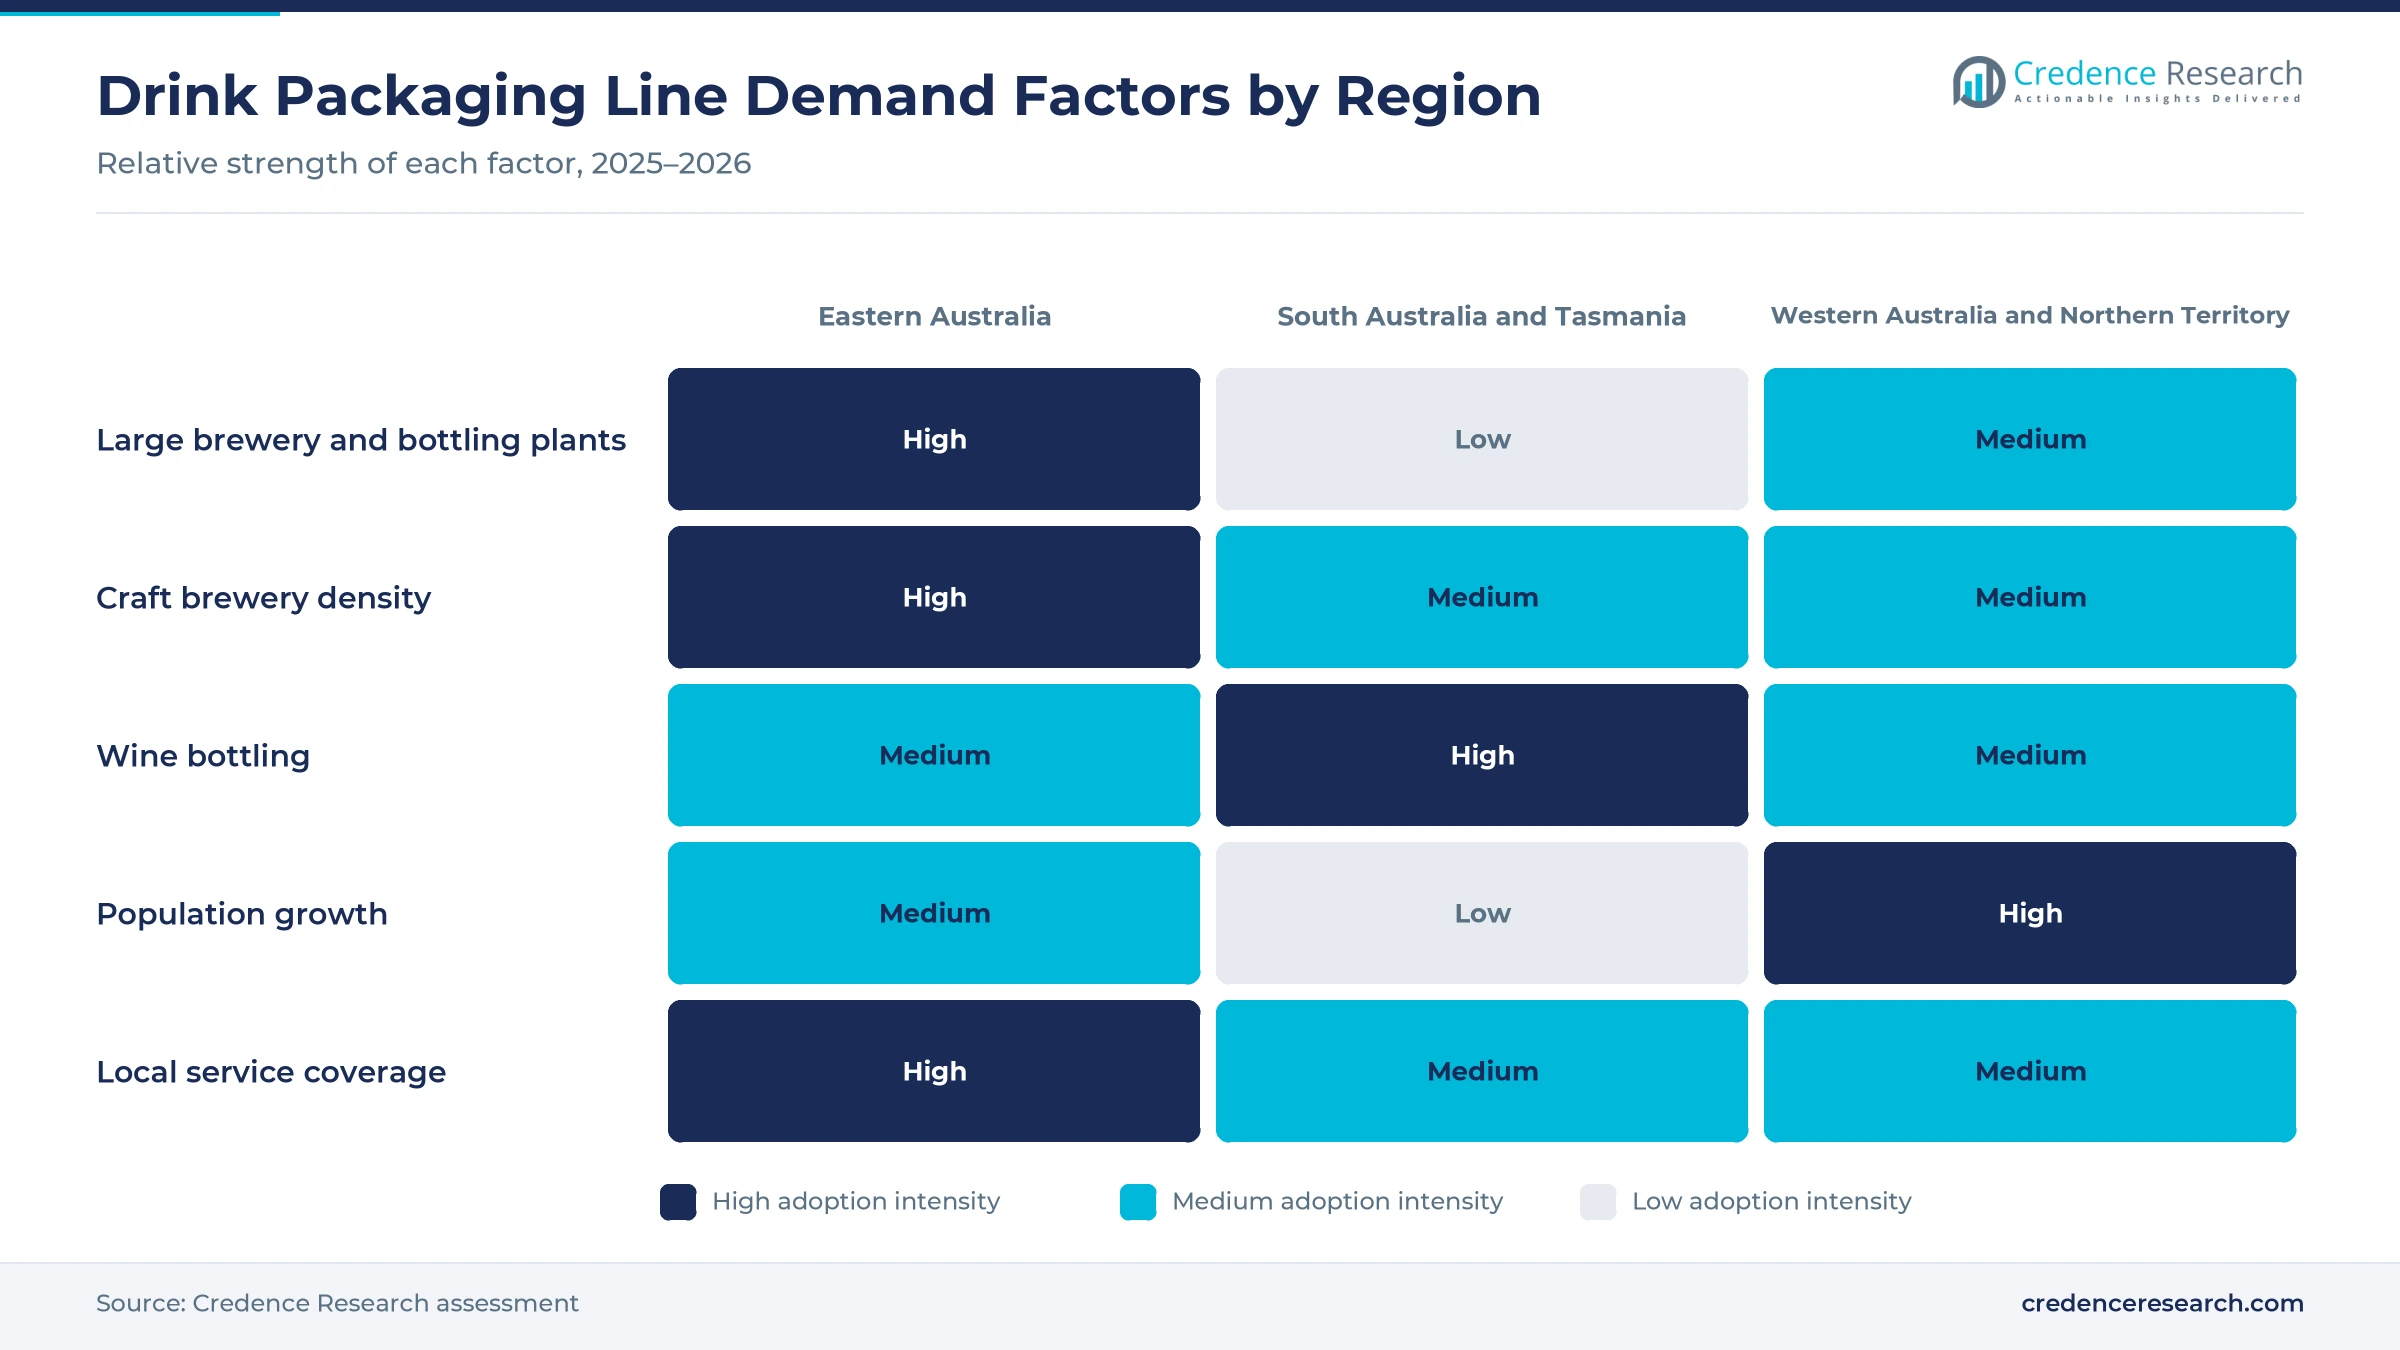
How do hygienic filling requirements shape equipment choice?
Hygienic filling requirements shape equipment choice, because juice, dairy-based drinks and other sensitive products spoil quickly without clean, closed filling. Food, beverages and tobacco made up 25.7% of manufacturing value added in 2024, up from 22.9% in 2023, according to World Bank data. A soft drink bottler also announced a AUD 105.5 million warm-fill line at its Moorabbin plant in Victoria in August 2024. In addition, an aseptic equipment supplier completed remote clean-in-place maintenance and format changes on a juice maker's aseptic PET line, taking two days per format. As a result, juice and sensitive beverages grow fastest among end uses at 7.05% a year.
Why does excise relief support brewery reinvestment?
Excise relief supports brewery reinvestment, because lower tax bills leave brewers and distillers more cash for packaging upgrades. Legislation introduced on Oct. 8, 2025, freezes draught beer excise indexation for two years from August 2025, according to the federal Treasury. The excise remission cap for brewers and distillers also rises from AUD 350,000 to AUD 400,000 a year for eligible alcohol makers. The wine producer rebate cap rises to AUD 400,000 from July 1, 2026, which supports small wineries. Consequently, beer and RTD beverages lead end uses with 37.0% of 2025 value, as craft beer producers buy compact automatic lines.
Cans, room-temperature fills and local builders gain ground
How is the rise of cans changing line design?
The rise of cans is changing line design, because cans are lighter, chill faster and suit ready-to-drink products. Cans passed bottles to reach 52% of one large brewer's packaged beer sales in 2025, and its new Yatala line can make up to 400 million cans a year. A soft drink bottler also renovated a can line in 2024 that fills up to 2,000 cans a minute. In addition, Tasmania launched its container refund scheme on May 1, 2025, paying 10 cents for eligible cans and bottles. As a result, can filling and seaming gains share in new projects, and demand for aluminum cans rises with seamer capacity across the eastern states.
Why is the shift to room-temperature filling rising?
The shift to room-temperature filling is rising, because carbonated drinks no longer need chilled product before filling on modern lines. A renovated can line at Richlands fills at room temperature, which the bottler expects to cut energy use by about 23% compared with the previous line. The same line runs Coca-Cola Zero Sugar, Sprite and Mount Franklin Lightly Sparkling in several formats. The bottler runs nine manufacturing facilities and 11 warehouses nationally, so savings repeat across many sites. A craft canning line installed in 2022 also handles beer and other carbonated drinks in different can sizes on one volumetric filler. Consequently, plants that renew lines cut cooling loads, and integrated filling and closing systems hold 53.0% of 2025 value as buyers favor energy-efficient monoblocks.
Can wine and spirits bottling open new demand?
Wine and spirits bottling opens new demand, because larger vintages and small distilleries need flexible bottle lines. The 2025 national winegrape crush reached 1.57 million metric tons, up 11% on 2024, according to the national wine authority. The crush was valued at AUD 1.13 billion, up 14%, and South Australia held 48% of the national crush. Tasmania also recorded a record crush for the second year in a row, which adds bottling needs for small producers on the island. In turn, wineries and distillers invest in semi-automatic and compact automatic fillers, and suppliers of alcoholic drink packaging gain from steady bottle demand.
Is there room to grow with locally built machines?
Locally built machines offer a clear opening, because Australian producers want short lead times and fast service. Packserv, based in Marrickville in Sydney, won the local manufacturing award at The Hive Awards 2025, announced on May 9, 2025. The company designs and builds high-speed fillers and says it built the country's first high-speed filler using Industry 4.0 technology. KHS Pacific also supplies filling and packaging systems from Tullamarine in Victoria, while Krones has run its own operations in the region since Aug. 1, 2016. As a result, direct OEM and local builders win more renewal projects as integrated systems grow at 6.82% a year.
High capital costs, skills gaps and import lead times
How do high capital costs delay line upgrades?
High capital costs delay line upgrades, because a complete can or bottle line can cost tens of millions of dollars for large plants. Smaller brewers and wineries often cannot fund new equipment without loans or leases. As a result, many keep older fillers running longer and accept higher waste and downtime. Suppliers respond with used-equipment programs, modular lines and staged upgrades that spread spending across several budget years.
Why do skills gaps limit automation benefits?
Skills gaps limit automation benefits, because high-speed fillers and cappers need trained technicians for changeovers, cleaning and fault finding. Regional wineries and breweries often struggle to hire and keep these technicians. Consequently, machines run below rated speed or stop for longer when faults occur. Suppliers address this with remote support, operator training and service contracts, which shorten downtime but add to the total cost of ownership.
How do import lead times affect projects?
Import lead times affect projects, because most high-speed fillers and cappers are built in Europe or Asia and shipped to Australia. Long production queues and shipping delays can push installation back by many months. In turn, producers may miss seasonal peaks such as summer beer demand or vintage bottling. Buyers manage this risk by ordering early, using local integrators and keeping critical spare parts in stock.
Will format churn strand older equipment?
Format churn can strand older equipment, because shifts from glass to cans or between can sizes make some machines obsolete. Producers that bought bottle-only lines a few years ago now face new investment for cans. As a result, some equipment is sold early at a discount or left idle. Buyers reduce this risk by choosing flexible monoblocks that handle several container types with quick changeover parts.
Eastern states lead as the west adds demand fastest
| Region | Value, 2025 (USD million) | Share, 2025 | CAGR, 2026–2035 |
|---|---|---|---|
| Eastern Australia | 29.9 | 75.7% | 6.40% |
| Western Australia and Northern Territory | 6.8 | 17.2% | 7.00% |
| South Australia and Tasmania | 2.8 | 7.1% | 6.20% |
Why does Eastern Australia lead line spending?
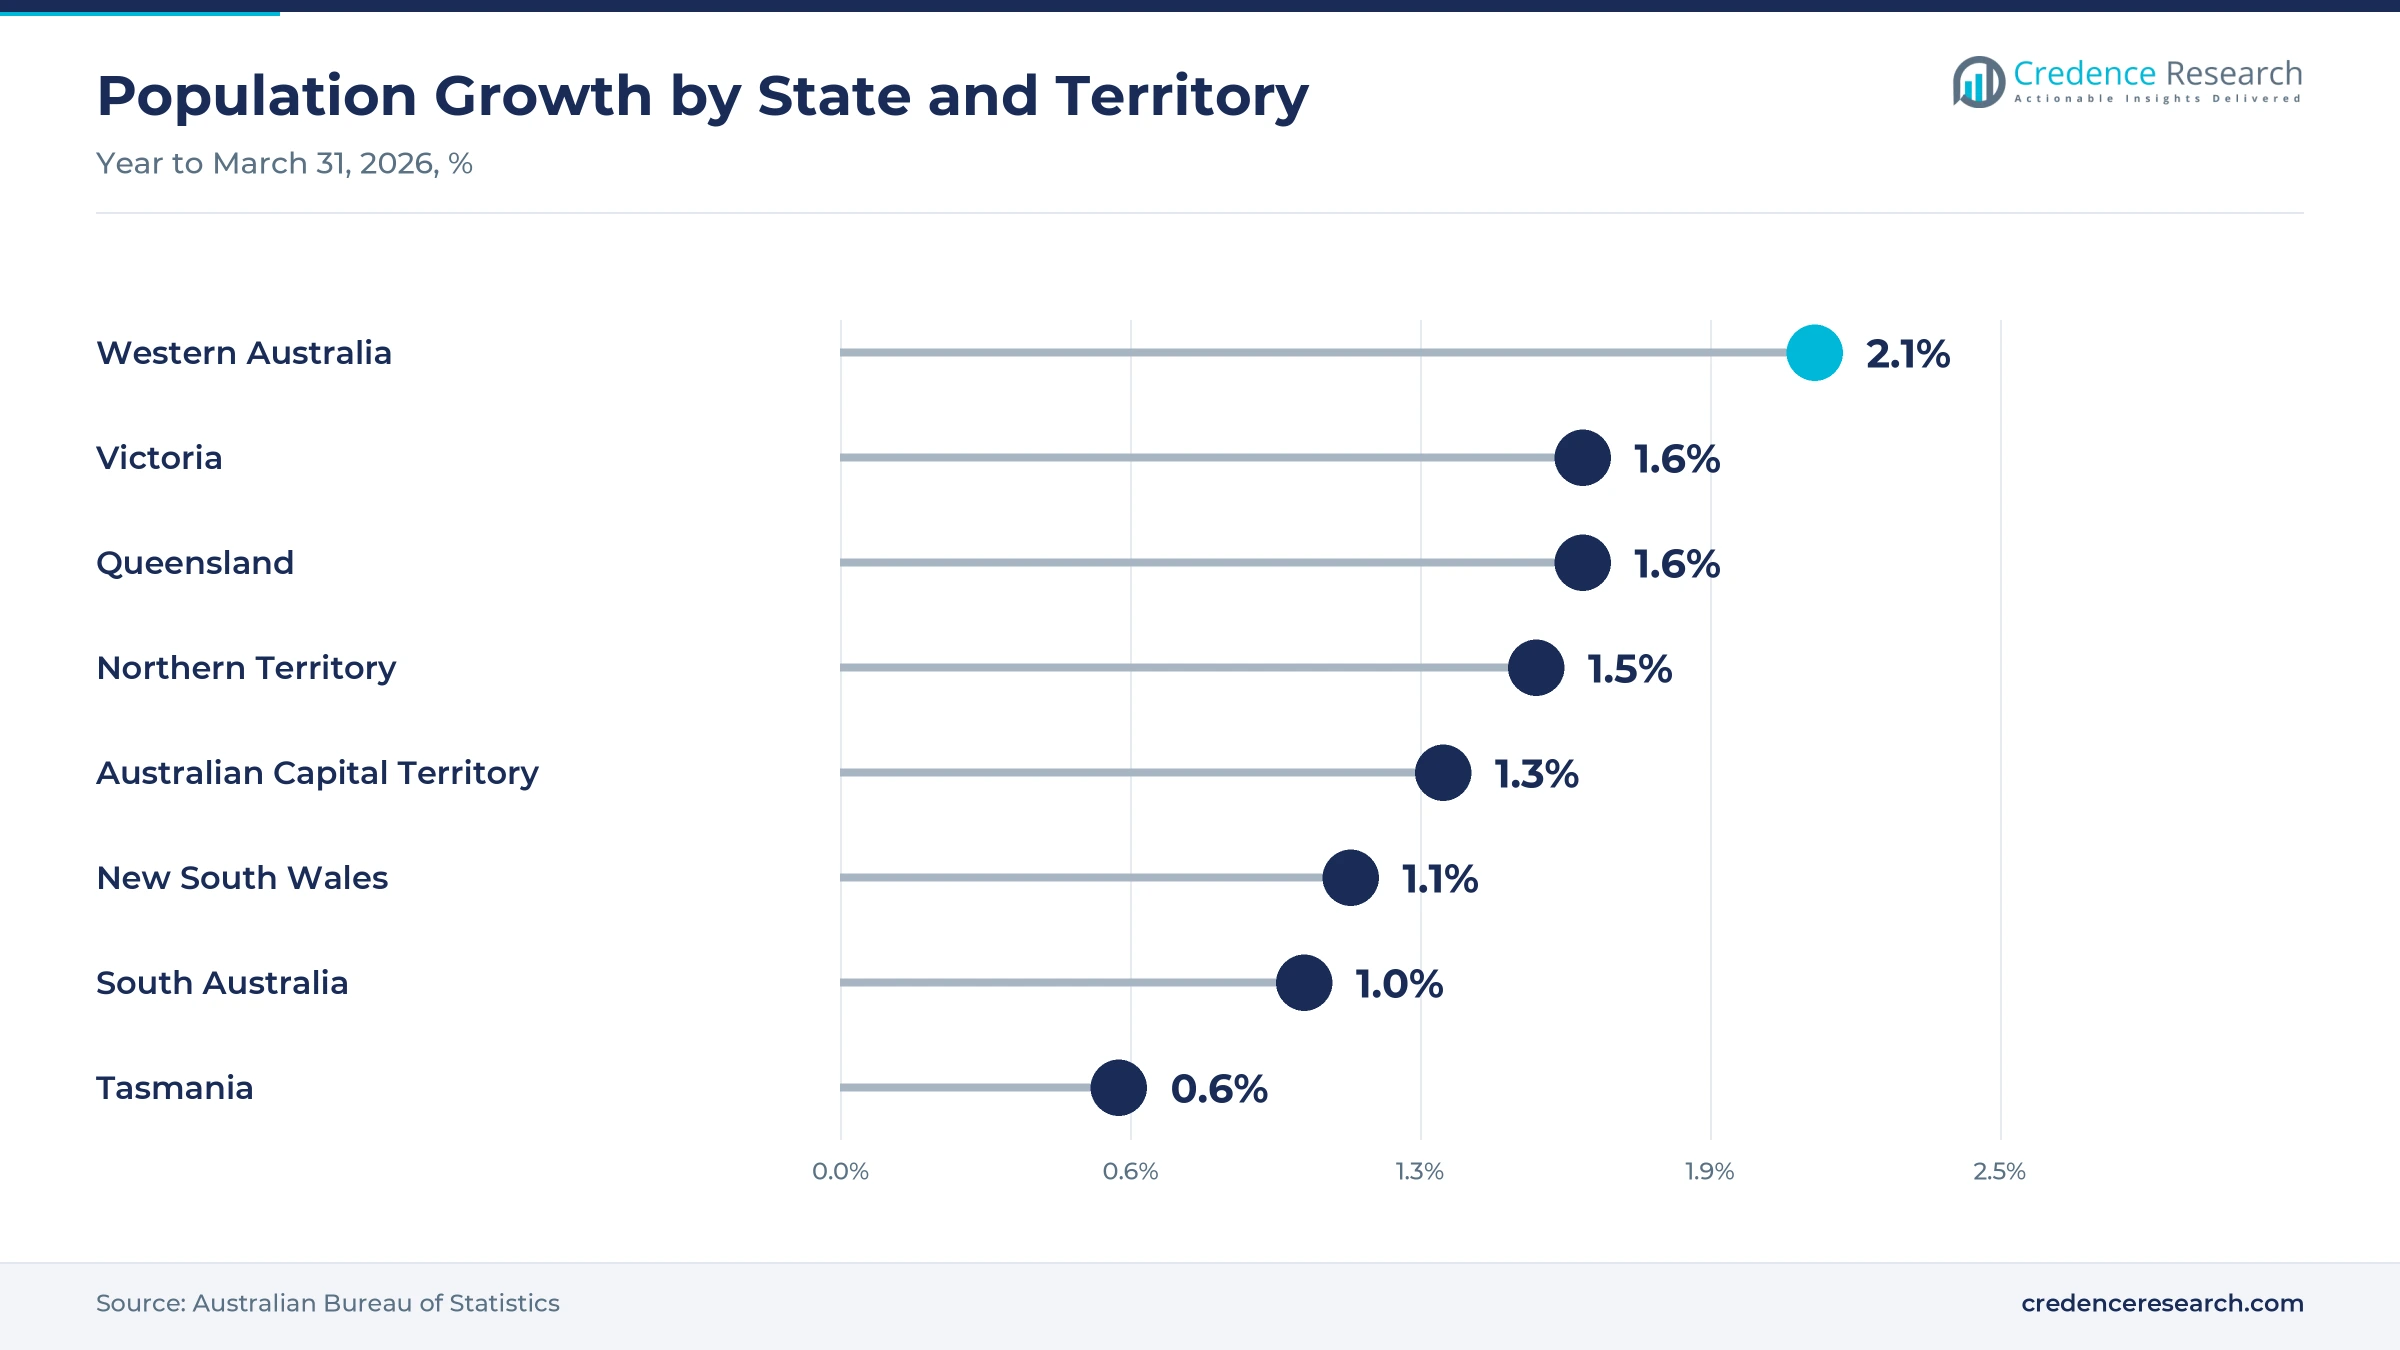
Eastern Australia held a 75.7% share of 2025 value and grows at 6.40% a year. The zone hosts the Yatala brewery, the Richlands and Moorabbin soft drink plants and many craft breweries around Sydney, Melbourne and Brisbane. Victoria and Queensland each grew 1.6% in population in the year to March 2026, while New South Wales grew 1.1%. As a result, the eastern states keep most high-speed can and bottle line orders through 2035.
How do South Australia and Tasmania add bottling demand?
South Australia and Tasmania held a 7.1% share of 2025 value and grow at 6.20% a year. South Australia held 48% of the 2025 national winegrape crush, while Tasmania recorded a record crush for the second year in a row. A Port Adelaide craft brewery also runs a canning line rated at 250 cans a minute. Consequently, wine bottling and craft canning drive most demand in this zone.
Why is the west the fastest-growing zone?
Western Australia and the Northern Territory held a 17.2% share of 2025 value and grow fastest at 7.00% a year. Western Australia grew 2.1% in population in the year to March 2026, the fastest of any state, and the Northern Territory grew 1.5%. In turn, local breweries, water bottlers and soft drink plants add capacity to serve Perth and regional towns.
Brewery and soft drink line investments from 2024 to 2026
| Development | Status and market relevance |
|---|---|
| In August 2024, Coca-Cola Europacific Partners announced a AUD 105.5 million warm-fill line at its Moorabbin plant in Victoria. | Adds hygienic filling capacity |
| In November 2024, Coca-Cola Europacific Partners completed a AUD 22.2 million can line upgrade at Richlands with capacity of up to 2,000 cans a minute. | Room-temperature filling cuts energy use |
| In May 2025, Asahi Beverages opened a new can line at its Yatala brewery in Queensland, its largest Australian brewery. | Up to 400 million cans a year |
| In May 2025, Tasmania launched its Recycle Rewards container refund scheme with a 10-cent refund per eligible container. | Covers cans, glass and PET bottles |
| In October 2025, the federal government introduced legislation to freeze draught beer excise indexation for two years. | Supports brewery reinvestment |
Monoblocks, servo cappers and remote service reshape lines
- Monoblock rinser, filler and closer units combine three steps in one frame, which saves floor space and reduces transfer points where contamination or damage can occur.
- Room-temperature carbonated filling removes the need to chill product before filling, which cuts energy use and lets plants run without large cooling systems.
- Servo-driven cappers and seamers set torque and seam settings electronically, which speeds changeovers between bottle sizes, closure types and can formats.
- Remote access and video assistance let suppliers tune recipes, guide maintenance and change formats from overseas, which shortens downtime for regional plants.
Need a Custom Version of This Report?
Tailor the scope, geography, or segments to your exact requirements.
- Custom geography or segment scope
- Direct access to our analyst team
Global OEMs and local builders compete on speed and service
Competition combines global machine builders with Australian subsidiaries, local machine makers and distributors that represent overseas brands. Krones has run its own operations in Australia and New Zealand since Aug. 1, 2016, after ending a 49-year agency arrangement with JL Lennard, and its compact can fillers serve craft breweries and soft drink makers. KHS Pacific supplies filling and packaging systems from Tullamarine and is an associate member of the national beverages council. Sidel supports aseptic PET lines for juice makers with remote format changes and maintenance. Packserv builds high-speed fillers in Marrickville, while JL Lennard distributes liquid and volumetric fillers from overseas makers. Companies compete on line speed, format flexibility, hygiene design, energy use, lead time and local service. Larger suppliers also offer complete lines with conveyors and inspection, which helps them win major brewery and bottling projects.
Companies profiled and their roles in this market
| Company | Type | Role in the market |
|---|---|---|
| Krones Pacific | Global OEM subsidiary | Direct operations in Australia and New Zealand since August 2016 |
| KHS Pacific | Global OEM subsidiary | Filling and packaging systems from Tullamarine, Victoria |
| Sidel | Global OEM | Remote format conversion and aseptic line maintenance for a juice maker |
| Packserv | Local machine builder | High-speed fillers built in Marrickville; Hive Awards 2025 winner |
| JL Lennard | Distributor | Liquid and volumetric fillers from overseas makers since 1879 |
Credence Research view on drink packaging line demand
Credence Research's view is that Australian spending on drink filling and closing equipment will grow steadily through 2035, as brewers, bottlers and wineries add can capacity and renew older lines. Integrated systems should keep the largest share, while can filling grows fastest as cans overtake bottles. Fully automatic lines will dominate large plants, although craft producers keep buying compact machines. However, high capital costs and long import lead times will reward suppliers that offer local service, flexible formats and staged upgrades.
How the drink packaging line estimate was built
The report uses 2025 as the base year, with values in USD million at current prices. Market values come from the Credence Research model, which combines drink production, line replacement cycles, import flows and equipment price tiers. Regional shares follow the client zone split, and segment splits by product type, end-use industry, application and technology are Credence Research estimates. Sources used are official statistics, government releases, industry body data, company statements and news reports, and no interviews or surveys were used.
Can capacity and line renewals shape demand to 2035
The market is expected to reach USD 84.5 million by 2035, a 6.49% CAGR during 2026–2035, as can capacity and line renewals keep demand rising. Growth should be strongest in can filling and seaming, juice and sensitive drinks, and Western Australia and the Northern Territory, while Eastern Australia keeps the largest share. Excise relief and new refund schemes will support brewery and bottler investment after 2026. In contrast, weak alcohol sales or higher interest rates could delay large projects and push buyers toward used equipment.
Frequently Asked Questions
How big is the Australia beverage filling and capping machine market?
Which region leads drink packaging line demand?
Which region grows fastest?
Which product type holds the largest share?
Why are cans lifting equipment demand?
Which end use grows fastest?
Who are the leading companies in this market?
What are the main risks to growth?
Table of Content
Chapter 1 Market Segmentation
- 1.1 Segmentation Framework
- 1.1.1 Product and Service Classification
- 1.1.2 Application and End-Use Classification
- 1.1.3 Technology and Solution Classification
- 1.1.4 Customer and Distribution Channel Classification
- 1.1.5 Geographic Segmentation
- 1.1.6 Market Segment Definitions and Boundaries
- 1.2 By Product Type
- 1.2.1 Standalone Fillers
- 1.2.2 Standalone Cappers
- 1.2.3 Integrated Filling and Closing Systems
- 1.3 By End-Use Industry
- 1.3.1 Beer and RTD Beverages
- 1.3.2 Wine and Spirits
- 1.3.3 Water and Carbonated Soft Drinks
- 1.3.4 Juice and Sensitive Beverages
- 1.4 By Application
- 1.4.1 Bottle Filling and Closing
- 1.4.2 Can Filling and Seaming
- 1.4.3 Keg and Bulk Filling
- 1.5 By Technology
- 1.5.1 Manual Systems
- 1.5.2 Semi-Automatic Systems
- 1.5.3 Fully Automatic Systems
Chapter 2 Introduction
- 2.1 Report Objectives and Scope
- 2.2 Product Definition and Industry Terminology
- 2.3 Market Inclusions and Exclusions
- 2.4 Research Process
- 2.4.1 Primary Research and Expert Interviews
- 2.4.2 Secondary Research and Source Review
- 2.4.3 Top-Down and Bottom-Up Estimation
- 2.4.4 Data Triangulation and Verification
- 2.5 Market Size Measurement Basis
- 2.5.1 2025: USD 39.5 million → 2035: USD 84.5 million
- 2.6 Historical and Forecast Reference Periods
- 2.6.1 Historical Period: 2018-2025
- 2.6.2 Base Year: 2025
- 2.6.3 Forecast Period: 2025-2035
- 2.7 Research Assumptions and Limitations
Chapter 3 Executive Summary
- 3.1 Market Snapshot and Key Findings
- 3.2 Base-Year Market Size, 2025
- 3.3 Forecast Market Size, 2035
- 3.4 Revenue and Volume Growth Outlook
- 3.5 Key Demand and Supply Indicators
- 3.6 Leading Market Segments
- 3.7 Fastest-Growing Market Opportunities
- 3.8 Regional Performance Highlights
- 3.9 Technology and Industry Transformation
- 3.10 Competitive Landscape Summary
- 3.11 Analyst View and Strategic Implications
Chapter 4 Australia Beverage Filling & Capping Machine Market Trends and Developments
- 4.1 Historical Industry Development, 2018-2025
- 4.2 Recent Market Trends and Developments
- 4.3 Demand and Customer Behavior Trends
- 4.4 Technology and Product Innovation
- 4.5 Artificial Intelligence, Automation and Digitalization
- 4.6 Local Manufacturing and Supply Chain Realignment
- 4.7 Industry Partnerships, Mergers and Acquisitions
- 4.8 Sustainability and Circular Economy Developments
- 4.9 Government and Private Sector Investment Trends
- 4.10 Emerging Business Models and Commercialization
- 4.11 Industry Developments and Announcements
Chapter 5 Australia Beverage Filling & Capping Machine Market Production, Supply and Demand Analysis
- 5.1 Demand Trend and Consumption Analysis, 2018-2025
- 5.2 Demand Forecast, 2025-2035
- 5.3 Production and Output Trend, 2018-2025
- 5.4 Production and Output Forecast, 2025-2035
- 5.5 Installed Capacity and Capacity Utilization
- 5.6 Company-Wise Production Plants and Statistics
- 5.6.1 Installed Production Capacity
- 5.6.2 Actual Production
- 5.6.3 Planned Capacity and Expansion Targets
- 5.7 Supply Chain Structure and Procurement Trends
- 5.8 Supply-Demand Gap and Bottlenecks
- 5.9 Import Dependence and Sourcing Structure
- 5.10 Contract Manufacturing and Outsourcing
- 5.11 Regional Supply and Demand Concentration
Chapter 6 Australia Beverage Filling & Capping Machine Market Pricing Analysis
- 6.1 Pricing Structure and Measurement
- 6.2 Historical Pricing Trends, 2018-2025
- 6.3 Pricing Outlook, 2025-2035
- 6.4 Average Selling Price and Unit Economics
- 6.5 Pricing by Product and Market Segment
- 6.6 Geographic Pricing Differences
- 6.7 Key Input, Energy, Labor and Logistics Costs
- 6.8 Contract Pricing and Purchasing Models
- 6.9 Pricing Sensitivity and Competitive Positioning
- 6.10 Price, Margin and Profitability Implications
Chapter 7 Australia Beverage Filling & Capping Machine Market Dynamics
- 7.1 Market Growth Drivers
- 7.1.1 Demand-Side Drivers
- 7.1.2 Technology and Innovation Drivers
- 7.1.3 Infrastructure and Investment Drivers
- 7.1.4 Regulatory and Policy Drivers
- 7.2 Market Restraints
- 7.2.1 Cost and Affordability Constraints
- 7.2.2 Technology and Adoption Barriers
- 7.2.3 Supply Chain and Operational Constraints
- 7.3 Market Challenges
- 7.3.1 Competitive Pressure and Margin Erosion
- 7.3.2 Skills, Infrastructure and Implementation Gaps
- 7.4 Emerging Market Opportunities
- 7.5 Market Dynamics Impact and Time-Horizon Assessment
Chapter 8 Australia Beverage Filling & Capping Machine Value Chain Analysis
- 8.1 Industry Value Chain Overview
- 8.2 Upstream Suppliers and Critical Inputs
- 8.3 Technology and Component Providers
- 8.4 Manufacturing or Service Delivery
- 8.5 Distribution, Channel Partners and Integrators
- 8.6 Downstream Applications and End Users
- 8.7 Value Addition and Profit Pools
- 8.8 Vertical Integration and Outsourcing
- 8.9 Supplier Concentration and Risk
- 8.10 Supply Chain Localization and Resilience
Chapter 9 Australia Beverage Filling & Capping Machine Market Regulations and Policies
- 9.1 Relevant Laws, Standards and Compliance Frameworks
- 9.2 Product, Service, Safety and Quality Requirements
- 9.3 Government Policies, Incentives and Subsidies
- 9.4 Imports, Exports and Trade Barriers
- 9.5 Public Procurement and Local Content Requirements
- 9.6 Environmental and Sustainability Compliance
- 9.7 Upcoming Policy Changes and Market Implications
Chapter 10 Australia Beverage Filling & Capping Machine Market Hotspots and Opportunities
- 10.1 Market Opportunity Mapping and Growth Hotspots
- 10.2 High-Growth Applications and Customer Groups
- 10.3 Underserved Markets and White-Space Opportunities
- 10.4 Emerging Technology and Product Opportunities
- 10.5 New Capacity and Investment Hotspots
- 10.6 Market Entry and Expansion Opportunities
- 10.7 Distribution and Partnership Opportunities
- 10.8 Near-Term and Long-Term Commercial Potential
- 10.9 Opportunity Attractiveness and Execution Risks
Chapter 11 Australia Beverage Filling & Capping Machine Market Outlook, 2025-2035
- 11.1 Market Size and Analysis
- 11.1.1 Revenue (Market Measurement: 2025: USD 39.5 million → 2035: USD 84.5 million)
- 11.1.2 Market Volume and Quantity Sold
- 11.1.3 Historical Market Size, 2018-2025
- 11.1.4 Base-Year Market Size, 2025
- 11.2 Market Forecast, 2025-2035
- 11.2.1 Revenue Forecast to 2035
- 11.2.2 Volume Forecast to 2035
- 11.2.3 CAGR and Year-on-Year Growth
- 11.2.4 Incremental Revenue Opportunity
- 11.3 Forecast Assumptions and Scenario Analysis
- 11.3.1 Base-Case Forecast
- 11.3.2 Optimistic and Conservative Scenarios
- 11.3.3 Technology, Pricing and Policy Sensitivities
- 11.4 Market Attractiveness and Growth Outlook
Chapter 12 Australia Beverage Filling & Capping Machine Market Segmentation and Outlook
- 12.1 Segmentation Summary and Market Shares, 2025
- 12.2 Largest and Fastest-Growing Segments
- 12.3 By Product Type - Market Size and Forecast, 2025-2035
- 12.3.1 Segment Definition and Scope
- 12.3.2 Historical Market Size, 2018-2025
- 12.3.3 Revenue Forecast, 2025-2035
- 12.3.4 Volume Forecast, 2025-2035
- 12.3.5 Base-Year Market Share, 2025
- 12.3.6 Segment CAGR and Growth Drivers
- 12.3.7 Subsegment Market Size and Forecast
- 12.3.7.1 Standalone Fillers
- 12.3.7.2 Standalone Cappers
- 12.3.7.3 Integrated Filling and Closing Systems
- 12.3.8 Subsegment Pricing and Adoption Trends
- 12.3.9 Leading Suppliers and Competition
- 12.3.10 Regional Demand and Opportunities
- 12.4 By End-Use Industry - Market Size and Forecast, 2025-2035
- 12.4.1 Segment Definition and Scope
- 12.4.2 Historical Market Size, 2018-2025
- 12.4.3 Revenue Forecast, 2025-2035
- 12.4.4 Volume Forecast, 2025-2035
- 12.4.5 Base-Year Market Share, 2025
- 12.4.6 Segment CAGR and Growth Drivers
- 12.4.7 Subsegment Market Size and Forecast
- 12.4.7.1 Beer and RTD Beverages
- 12.4.7.2 Wine and Spirits
- 12.4.7.3 Water and Carbonated Soft Drinks
- 12.4.7.4 Juice and Sensitive Beverages
- 12.4.8 Subsegment Pricing and Adoption Trends
- 12.4.9 Leading Suppliers and Competition
- 12.4.10 Regional Demand and Opportunities
- 12.5 By Application - Market Size and Forecast, 2025-2035
- 12.5.1 Segment Definition and Scope
- 12.5.2 Historical Market Size, 2018-2025
- 12.5.3 Revenue Forecast, 2025-2035
- 12.5.4 Volume Forecast, 2025-2035
- 12.5.5 Base-Year Market Share, 2025
- 12.5.6 Segment CAGR and Growth Drivers
- 12.5.7 Subsegment Market Size and Forecast
- 12.5.7.1 Bottle Filling and Closing
- 12.5.7.2 Can Filling and Seaming
- 12.5.7.3 Keg and Bulk Filling
- 12.5.8 Subsegment Pricing and Adoption Trends
- 12.5.9 Leading Suppliers and Competition
- 12.5.10 Regional Demand and Opportunities
- 12.6 By Technology - Market Size and Forecast, 2025-2035
- 12.6.1 Segment Definition and Scope
- 12.6.2 Historical Market Size, 2018-2025
- 12.6.3 Revenue Forecast, 2025-2035
- 12.6.4 Volume Forecast, 2025-2035
- 12.6.5 Base-Year Market Share, 2025
- 12.6.6 Segment CAGR and Growth Drivers
- 12.6.7 Subsegment Market Size and Forecast
- 12.6.7.1 Manual Systems
- 12.6.7.2 Semi-Automatic Systems
- 12.6.7.3 Fully Automatic Systems
- 12.6.8 Subsegment Pricing and Adoption Trends
- 12.6.9 Leading Suppliers and Competition
- 12.6.10 Regional Demand and Opportunities
- 12.7 Segment Growth Comparison
- 12.8 Segment Attractiveness and Priority Matrix
Chapter 13 Australia Beverage Filling & Capping Machine End-Use and Application Market Outlook
- 13.1 End-Use Industry and Customer Demand Structure
- 13.2 Leading Applications and Customer Groups
- 13.3 End-Use Market Size, Share and Forecast
- 13.4 Major End-Use Industry Deep Dives
- 13.4.1 Customer Requirements and Use Cases
- 13.4.2 Demand and Replacement Cycles
- 13.4.3 Technical and Regulatory Considerations
- 13.4.4 Purchasing and Procurement Models
- 13.4.5 Leading Vendors and Distribution Channels
- 13.4.6 Forecast and Commercial Opportunities
- 13.5 Emerging Applications and Cross-Segment Demand
- 13.6 End-Use Industry Investment Priorities
Chapter 14 Australia Beverage Filling & Capping Machine Geographic Market Outlook, 2025-2035
- 14.1 Domestic Market Distribution and Demand Clusters
- 14.2 State- or Province-Wise Market Size and Forecast, 2025-2035
- 14.3 City and Metropolitan Market Outlook
- 14.4 Industrial, Manufacturing and Commercial Clusters
- 14.5 Geographic Concentration of Key End Users
- 14.6 Local Pricing and Purchasing Differences
- 14.7 Domestic Production Facilities and Capacity Map
- 14.8 Local Infrastructure and Project Pipeline
- 14.9 State-Level Policy and Incentive Differences
- 14.10 Subnational Investment Hotspots and Opportunities
- 14.11 Distribution and Logistics Networks
- 14.12 Domestic Competitive Footprint
Chapter 15 Australia Beverage Filling & Capping Machine Technology, Innovation and Sustainability Outlook
- 15.1 Technology Landscape and Maturity
- 15.2 Product, Process and Service Innovation
- 15.3 AI, Automation and Digital Tools in the Industry
- 15.4 Technology Adoption and Performance Benchmarking
- 15.5 Innovation Pipeline and R&D Investment
- 15.6 Patent and Intellectual Property Trends
- 15.7 Energy Efficiency and Resource Management
- 15.8 Sustainability, Recycling and Circularity
- 15.9 Technology Roadmap, 2025-2035
- 15.10 Risks of Obsolescence and Technology Substitution
Chapter 16 Australia Beverage Filling & Capping Machine Market Key Strategic Imperatives
- 16.1 Growth and Market Entry Priorities
- 16.2 High-Return Products and Segments
- 16.3 Pricing, Profitability and Cost Optimization
- 16.4 Technology Investment and Product Differentiation
- 16.5 Supply Chain Localization and Resilience
- 16.6 Distribution and Customer Acquisition
- 16.7 Partnership, Acquisition and Capacity Strategy
- 16.8 Regional Expansion Priorities
- 16.9 Short-, Medium- and Long-Term Actions
Chapter 17 Competition Outlook
- 17.1 Industry Competition Characteristics
- 17.2 Market Structure and Concentration
- 17.3 Market Share and Competitive Positioning, 2025
- 17.4 Company-Wise Revenue and Product Benchmarking
- 17.5 Production and Service Capacity Benchmarking
- 17.6 Technology, Pricing and Differentiation
- 17.7 Regional Footprint and Distribution Strength
- 17.8 Mergers, Acquisitions and Strategic Alliances
- 17.9 New Entrants and Competitive Threats
- 17.10 Porter's Five Forces and Industry Attractiveness
- 17.11 Competitive Outlook, 2025-2035
Chapter 18 Company Profiles
- 18.1 Company Coverage and Selection Criteria
- 18.2 Krones Pacific
- 18.2.1 Business Description
- 18.2.2 Company Ownership and Geographic Presence
- 18.2.3 Product and Service Portfolio
- 18.2.4 Manufacturing and Operating Footprint
- 18.2.5 Production Capacity and Expansion Plans
- 18.2.6 Financial Performance and Investment
- 18.2.7 Market Share and Competitive Position
- 18.2.8 Technology and Innovation Capabilities
- 18.2.9 Strategic Alliances or Partnerships
- 18.2.10 Recent Developments
- 18.2.11 Growth Strategy and Outlook
- 18.3 Sidel
- 18.4 KHS Pacific
- 18.5 GEA Australia
- 18.6 Icon Equipment International
- 18.7 Packserv
- 18.8 JL Lennard
- 18.9 Process Evolution
- 18.10 Ekam Global
- 18.11 Ernest Fleming Machinery & Equipment
- 18.12 Other Relevant Market Participants
Note: Every listed company is profiled on the structure shown under the first company. The company list is preliminary and may change based on research findings, market developments, data availability and client requirements.
Chapter 19 Disclaimer
- 19.1 Research and Forecast Disclaimer
- 19.2 Data Source and Estimation Limitations
Note: The depth of individual sections depends on data availability for this market. Volume, capacity, trade and other unit-based metrics are included where applicable.

