
Sterile drug, vaccine and device output set packaging demand
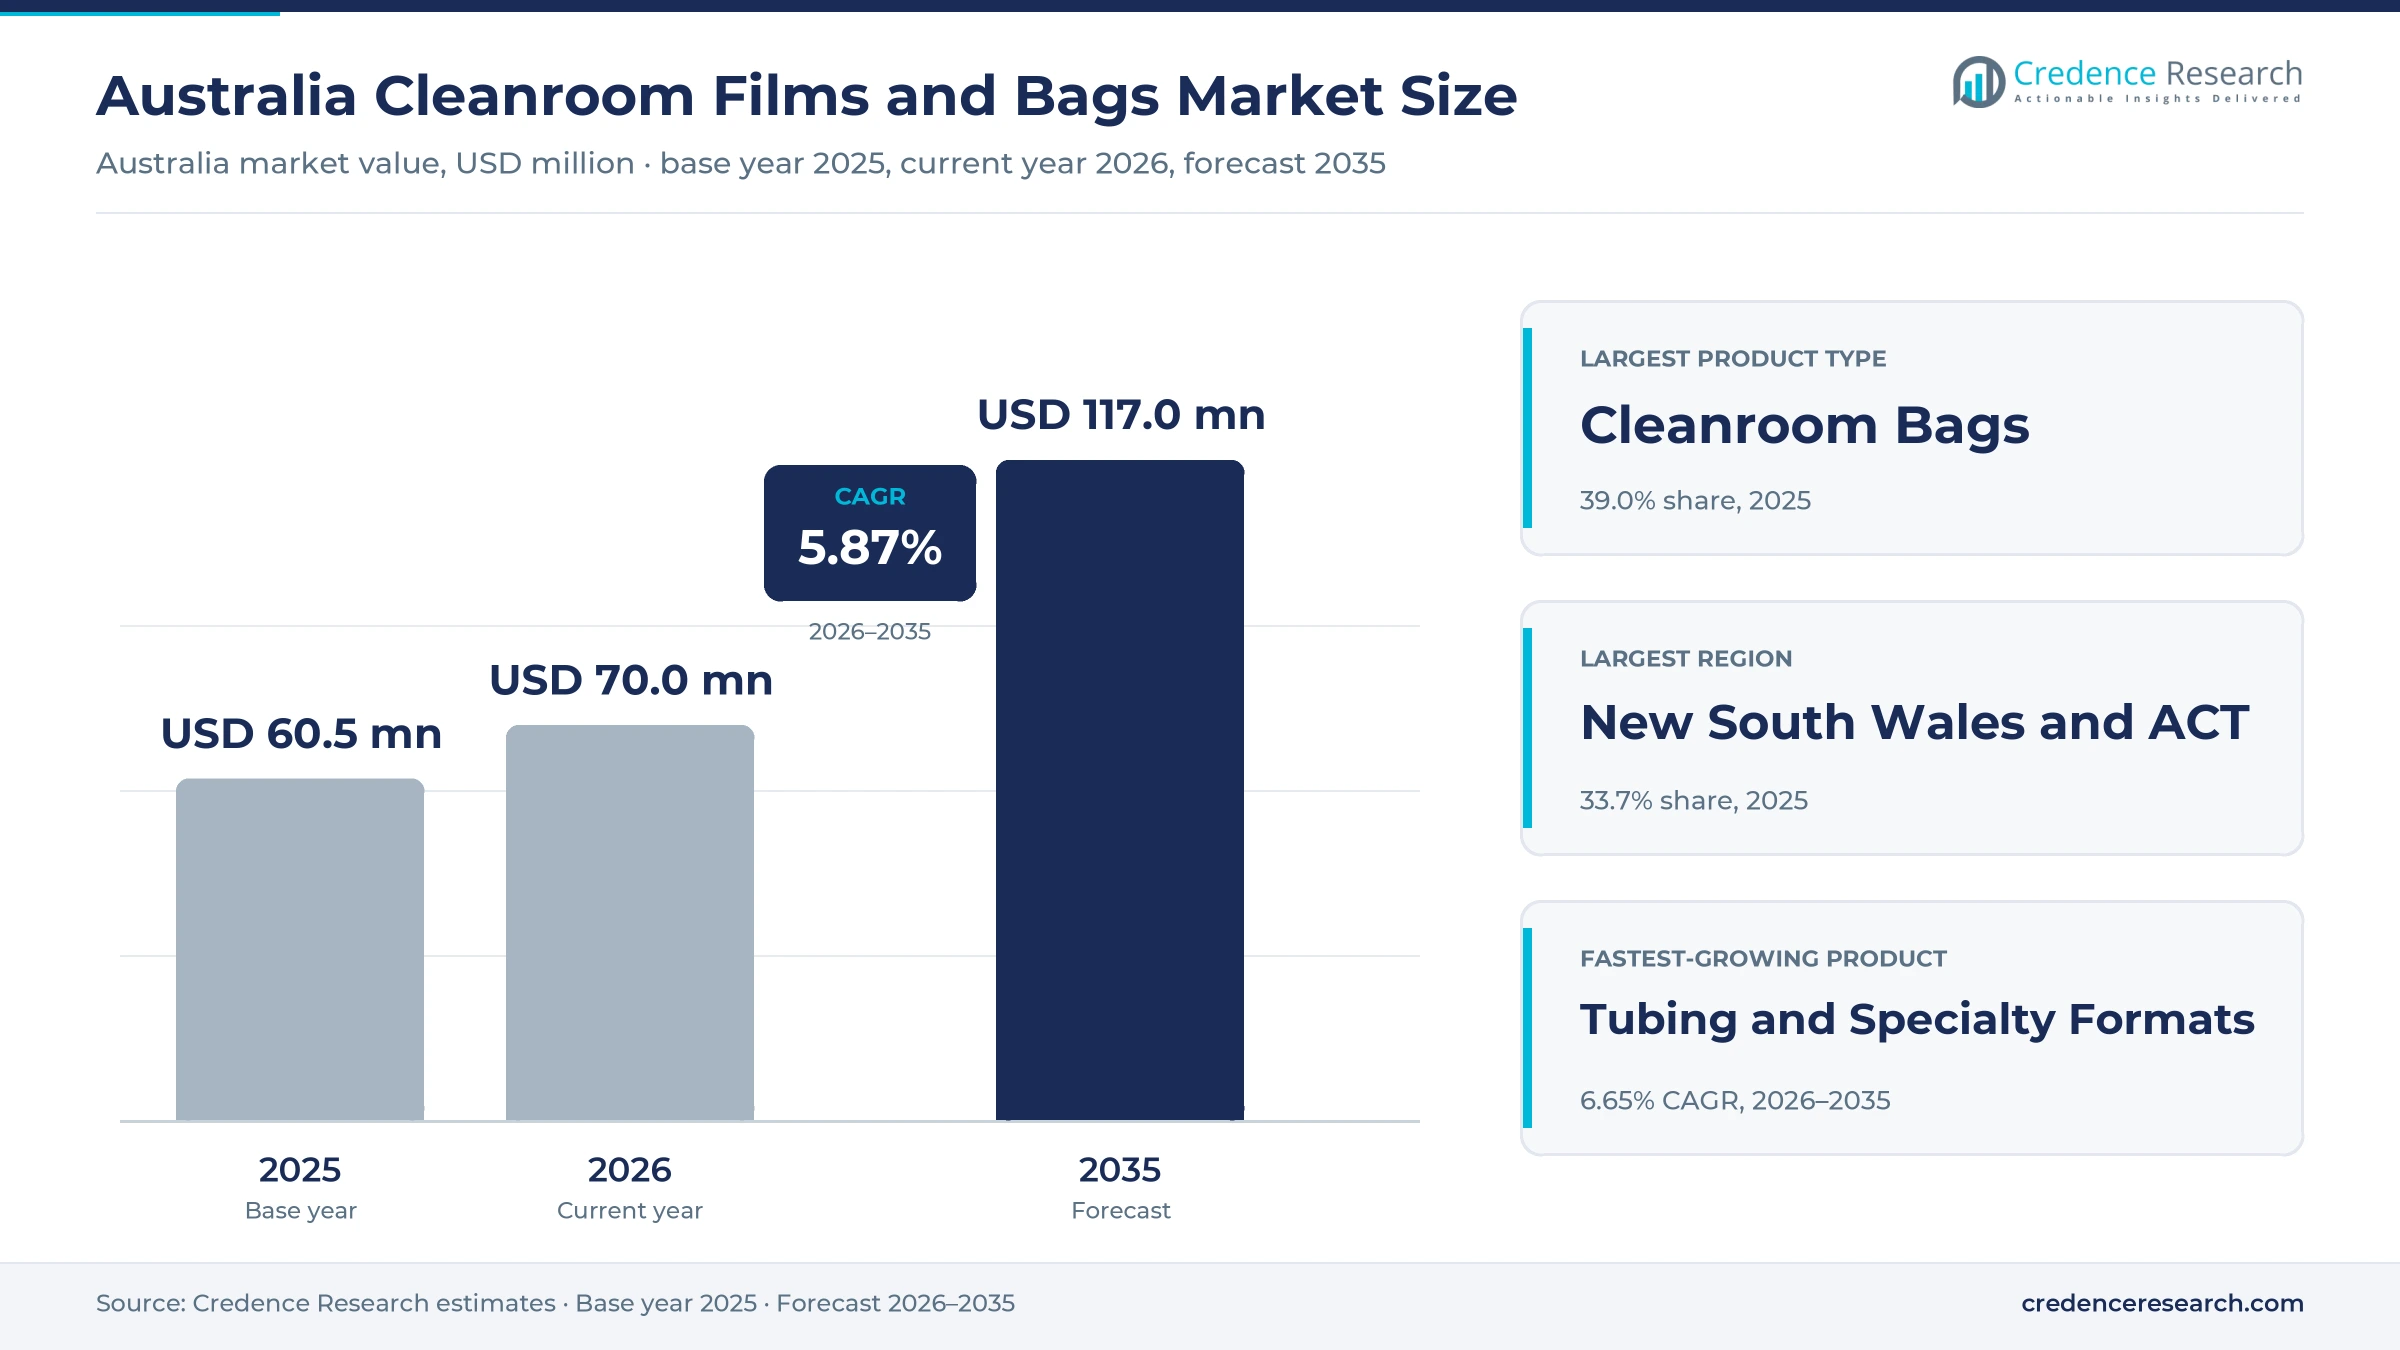
The Australia cleanroom films and bags market was valued at USD 60.5 million in 2025 and is projected to increase from USD 70.0 million in 2026 to USD 117.0 million by 2035, registering a CAGR of 5.87% during 2026–2035. Demand comes from medicine makers, vaccine plants, device manufacturers, research laboratories and electronics users that need low-particle bags, films, pouches and tubing to protect sterile and sensitive products. New South Wales and the Australian Capital Territory held the largest regional share, 33.7% in 2025, because Sydney hosts many drug, device and research sites. Queensland is the fastest-growing region at 6.25% a year, as Brisbane adds single-use biologics and quantum computing work. At the same time, the move to the latest international good manufacturing practice guide in September 2025 has pushed sterile producers to tighten contamination control across every material that enters clean areas.
Which contamination-controlled packaging formats does the estimate cover?
The estimate measures the value of bags, films and wraps, pouches, tubing and specialty formats that are made or converted under controlled conditions and sold to buyers in Australia. It counts double-bagged liners, autoclave and gamma-ready pouches, protective wraps and process bags used in drug, biologics, device, research, electronics and hospital settings.
The estimate excludes general retail and food packaging, rigid containers, glass vials and the value of bioreactors or filling machines that use these materials. The value chain runs from resin suppliers and global extruders through converters and distributors to the producers, laboratories and hospitals that pass materials into clean areas.
Australia Cleanroom Films and Bags Market Insights
- The Australia cleanroom films and bags market was valued at USD 60.5 million in 2025 and is projected to reach USD 117.0 million by 2035, registering a CAGR of 5.87% during 2026–2035.
- New South Wales and the Australian Capital Territory held a 33.7% share of 2025 value, because Sydney combines drug, device and research production.
- Cleanroom bags led with a 39.0% share of 2025 value, because producers line, transfer and store sterile components and process liquids in them every day.
- The PIC/S Guide to GMP version 17 has applied to Australian medicine makers since Sept. 1, 2025, with its sterile annex bringing the most significant changes.
- Tubing and specialty formats grow fastest at 6.65% a year during 2026–2035, as single-use biologics and advanced therapy plants add custom assemblies.
Bags lead while tubing and specialty formats grow fastest
Why do bags hold the largest product value?
Based on product type, the market is categorized into cleanroom bags, cleanroom films and wraps, cleanroom pouches and tubing and specialty formats. Cleanroom Bags led with a 39.0% share of 2025 value, because sterile sites use them to line bins, move components and hold process liquids. Tubing and Specialty Formats grow fastest at 6.65% a year, as single-use plants order more connected assemblies for transfer and sampling.
How do medicine and biologics makers anchor demand?
Based on end-use industry, the market is categorized into pharmaceuticals and biologics, medical devices, biotechnology and life sciences R&D, semiconductor and electronics, aerospace and controlled-environment applications, and hospital. Pharmaceuticals and Biologics led with a 40.0% share of 2025 value, because sterile injectables, vaccines and plasma products need the cleanest materials. Biotechnology and Life Sciences R&D grows fastest at 6.69% a year, as RNA and cell therapy groups move toward clinical supply.
Which uses drive the most purchasing?
Based on application, the market is categorized into sterile packaging, process containment, storage and transportation, and surface protection. Sterile Packaging led with a 38.0% share of 2025 value, because devices, stoppers and components must stay sterile until they reach the clean area. Process Containment grows fastest at 6.56% a year, as buffer, media and harvest steps move from steel tanks into disposable systems.
Which film structures gain ground fastest?
Based on technology, the market is categorized into monolayer films, coextruded multilayer films and laminated barrier films. Monolayer Films led with a 46.0% share of 2025 value, because polyethylene liners and wraps cover most routine clean area tasks at low cost. Coextruded Multilayer Films grow fastest at 6.46% a year, as bioprocess users need stronger, cleaner contact layers with gas barriers.
| Segment Group | Leading Sub-segment | Share, 2025 | Fastest-growing Sub-segment | CAGR, 2026–2035 |
|---|---|---|---|---|
| By Product Type | Cleanroom Bags | 39.0% | Tubing and Specialty Formats | 6.65% |
| By End-Use Industry | Pharmaceuticals and Biologics | 40.0% | Biotechnology and Life Sciences R&D | 6.69% |
| By Application | Sterile Packaging | 38.0% | Process Containment | 6.56% |
| By Technology | Monolayer Films | 46.0% | Coextruded Multilayer Films | 6.46% |
Request a Free Sample
Fill in your details and we'll send you a free sample report.
- Sample data tables & charts
- Research methodology
GMP rules, vaccine plants and single-use processing lift use
How does sterile manufacturing qualification lift spending?
Australian sterile producers now face tighter rules on every material that crosses into graded rooms, which favors certified clean packaging. The PIC/S Guide to GMP version 17 has applied to Australian makers of medicines, active ingredients and sunscreens since Sept. 1, 2025, according to the Therapeutic Goods Administration. The regulator names the sterile annex update as the most significant change in that version of the guide. It also granted a six-month transition for some sterile changes, which pushed contamination control reviews into early 2026. Those reviews cover how components are wrapped, transferred and decontaminated before use. As a result, pharmaceuticals and biologics hold 40.0% of 2025 value, because producers prefer double-bagged, validated materials that simplify transfer into graded rooms.
Why does domestic vaccine production expand demand?
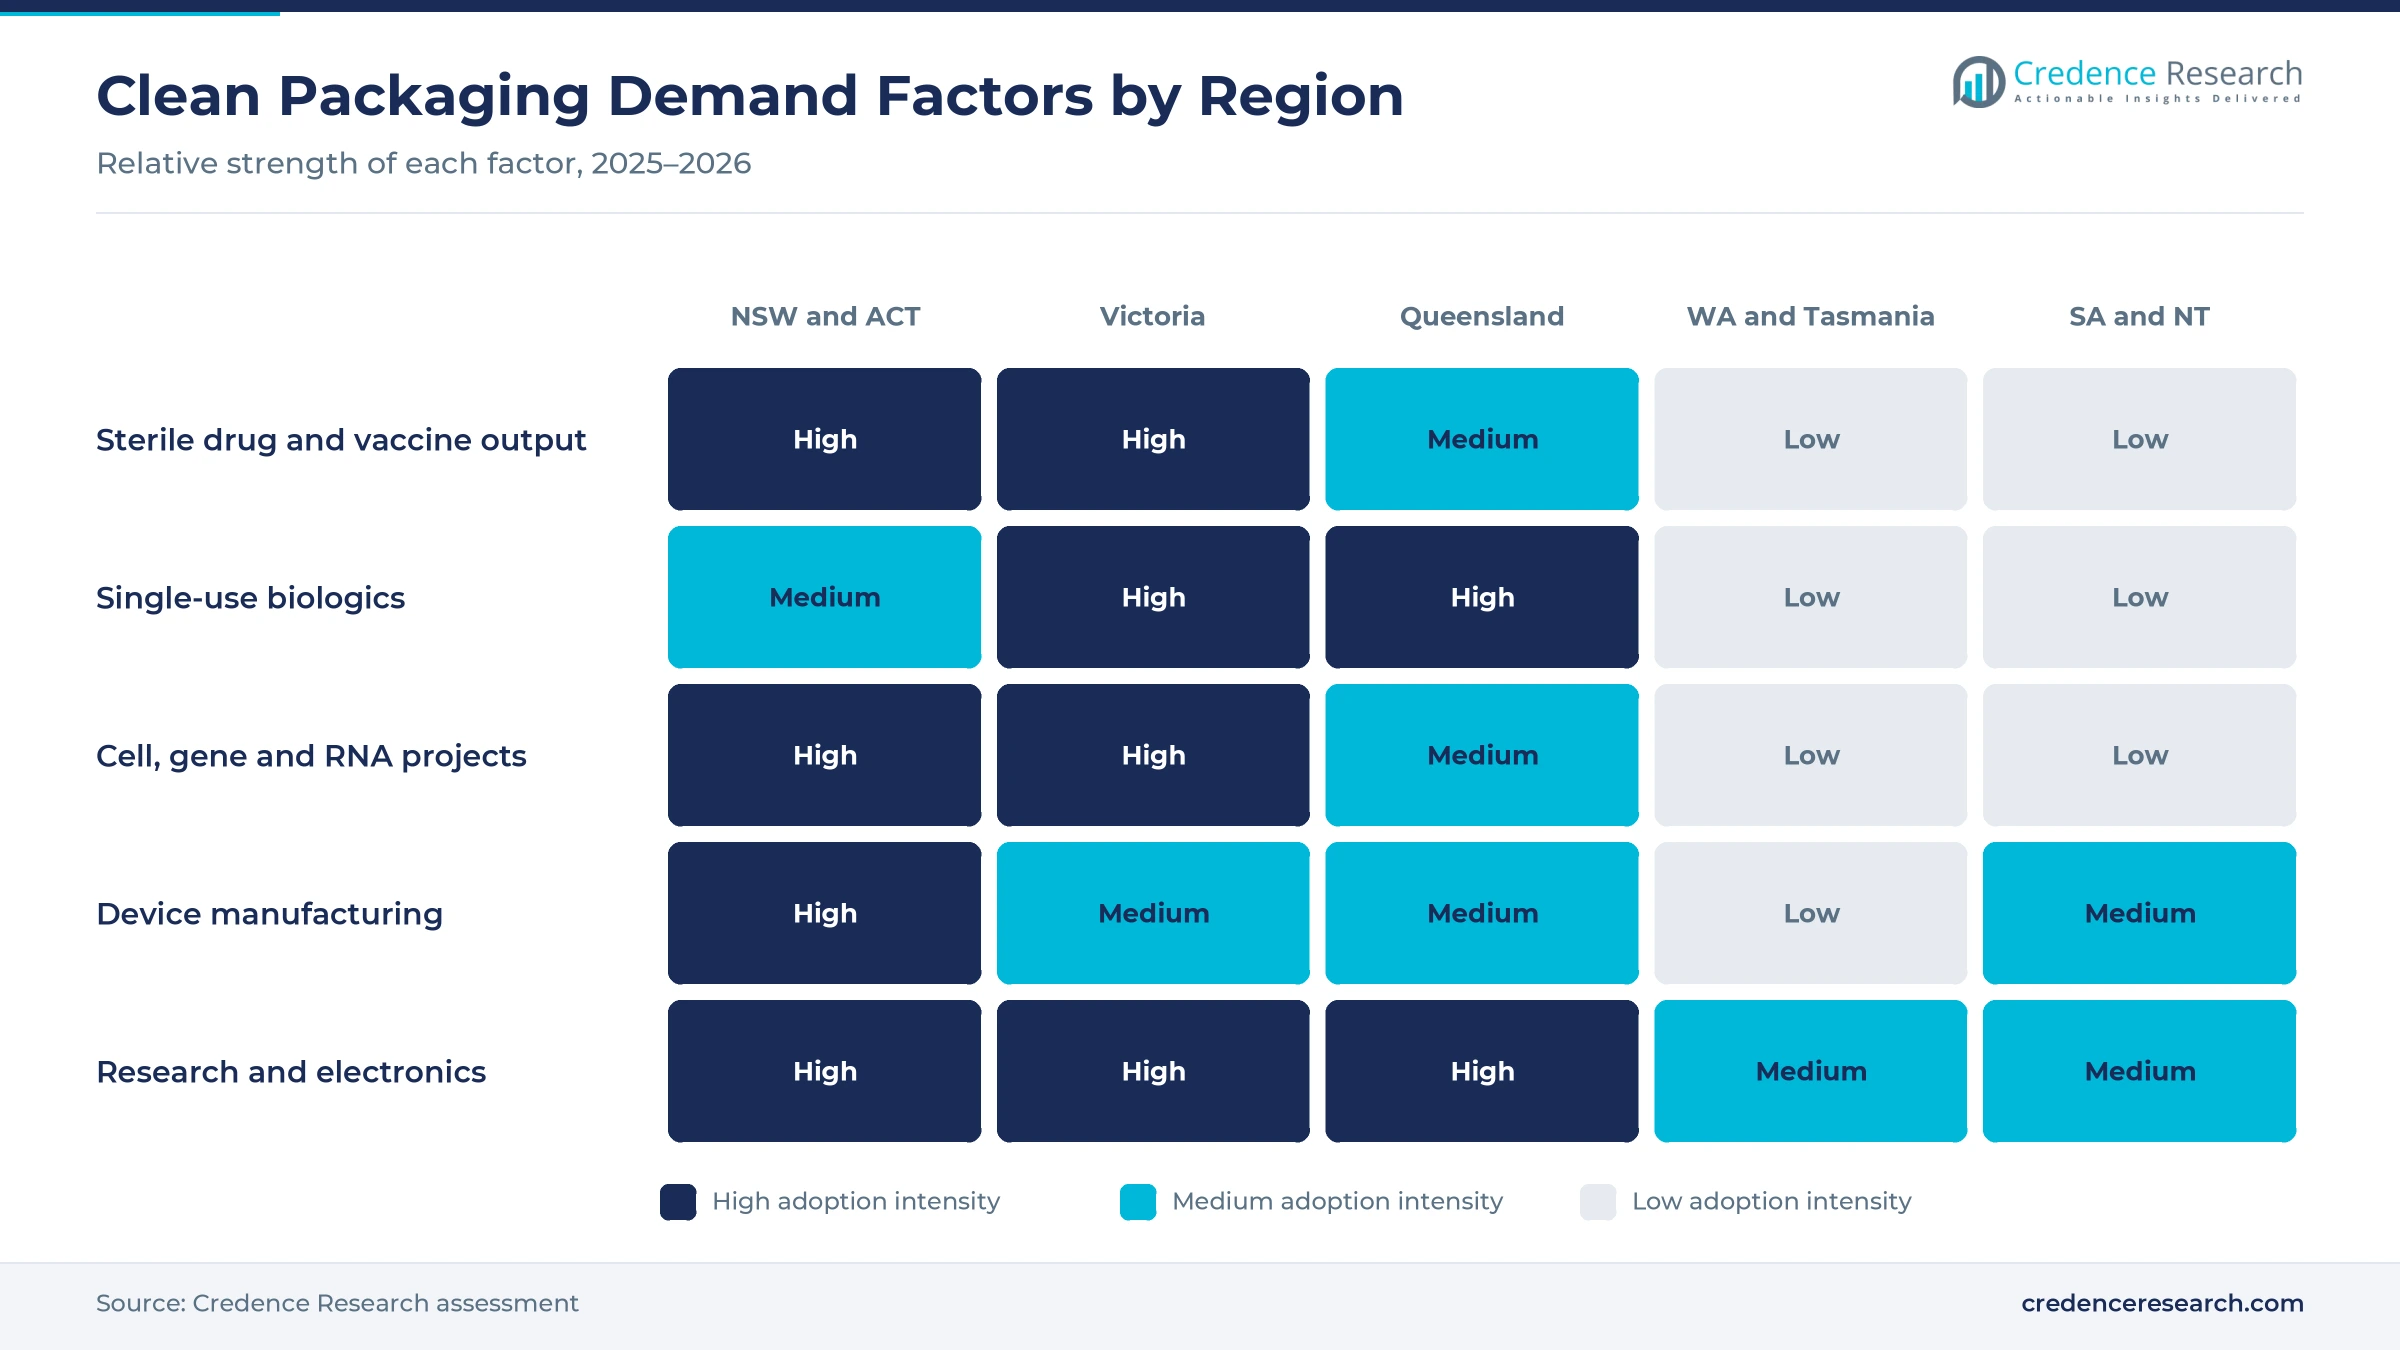
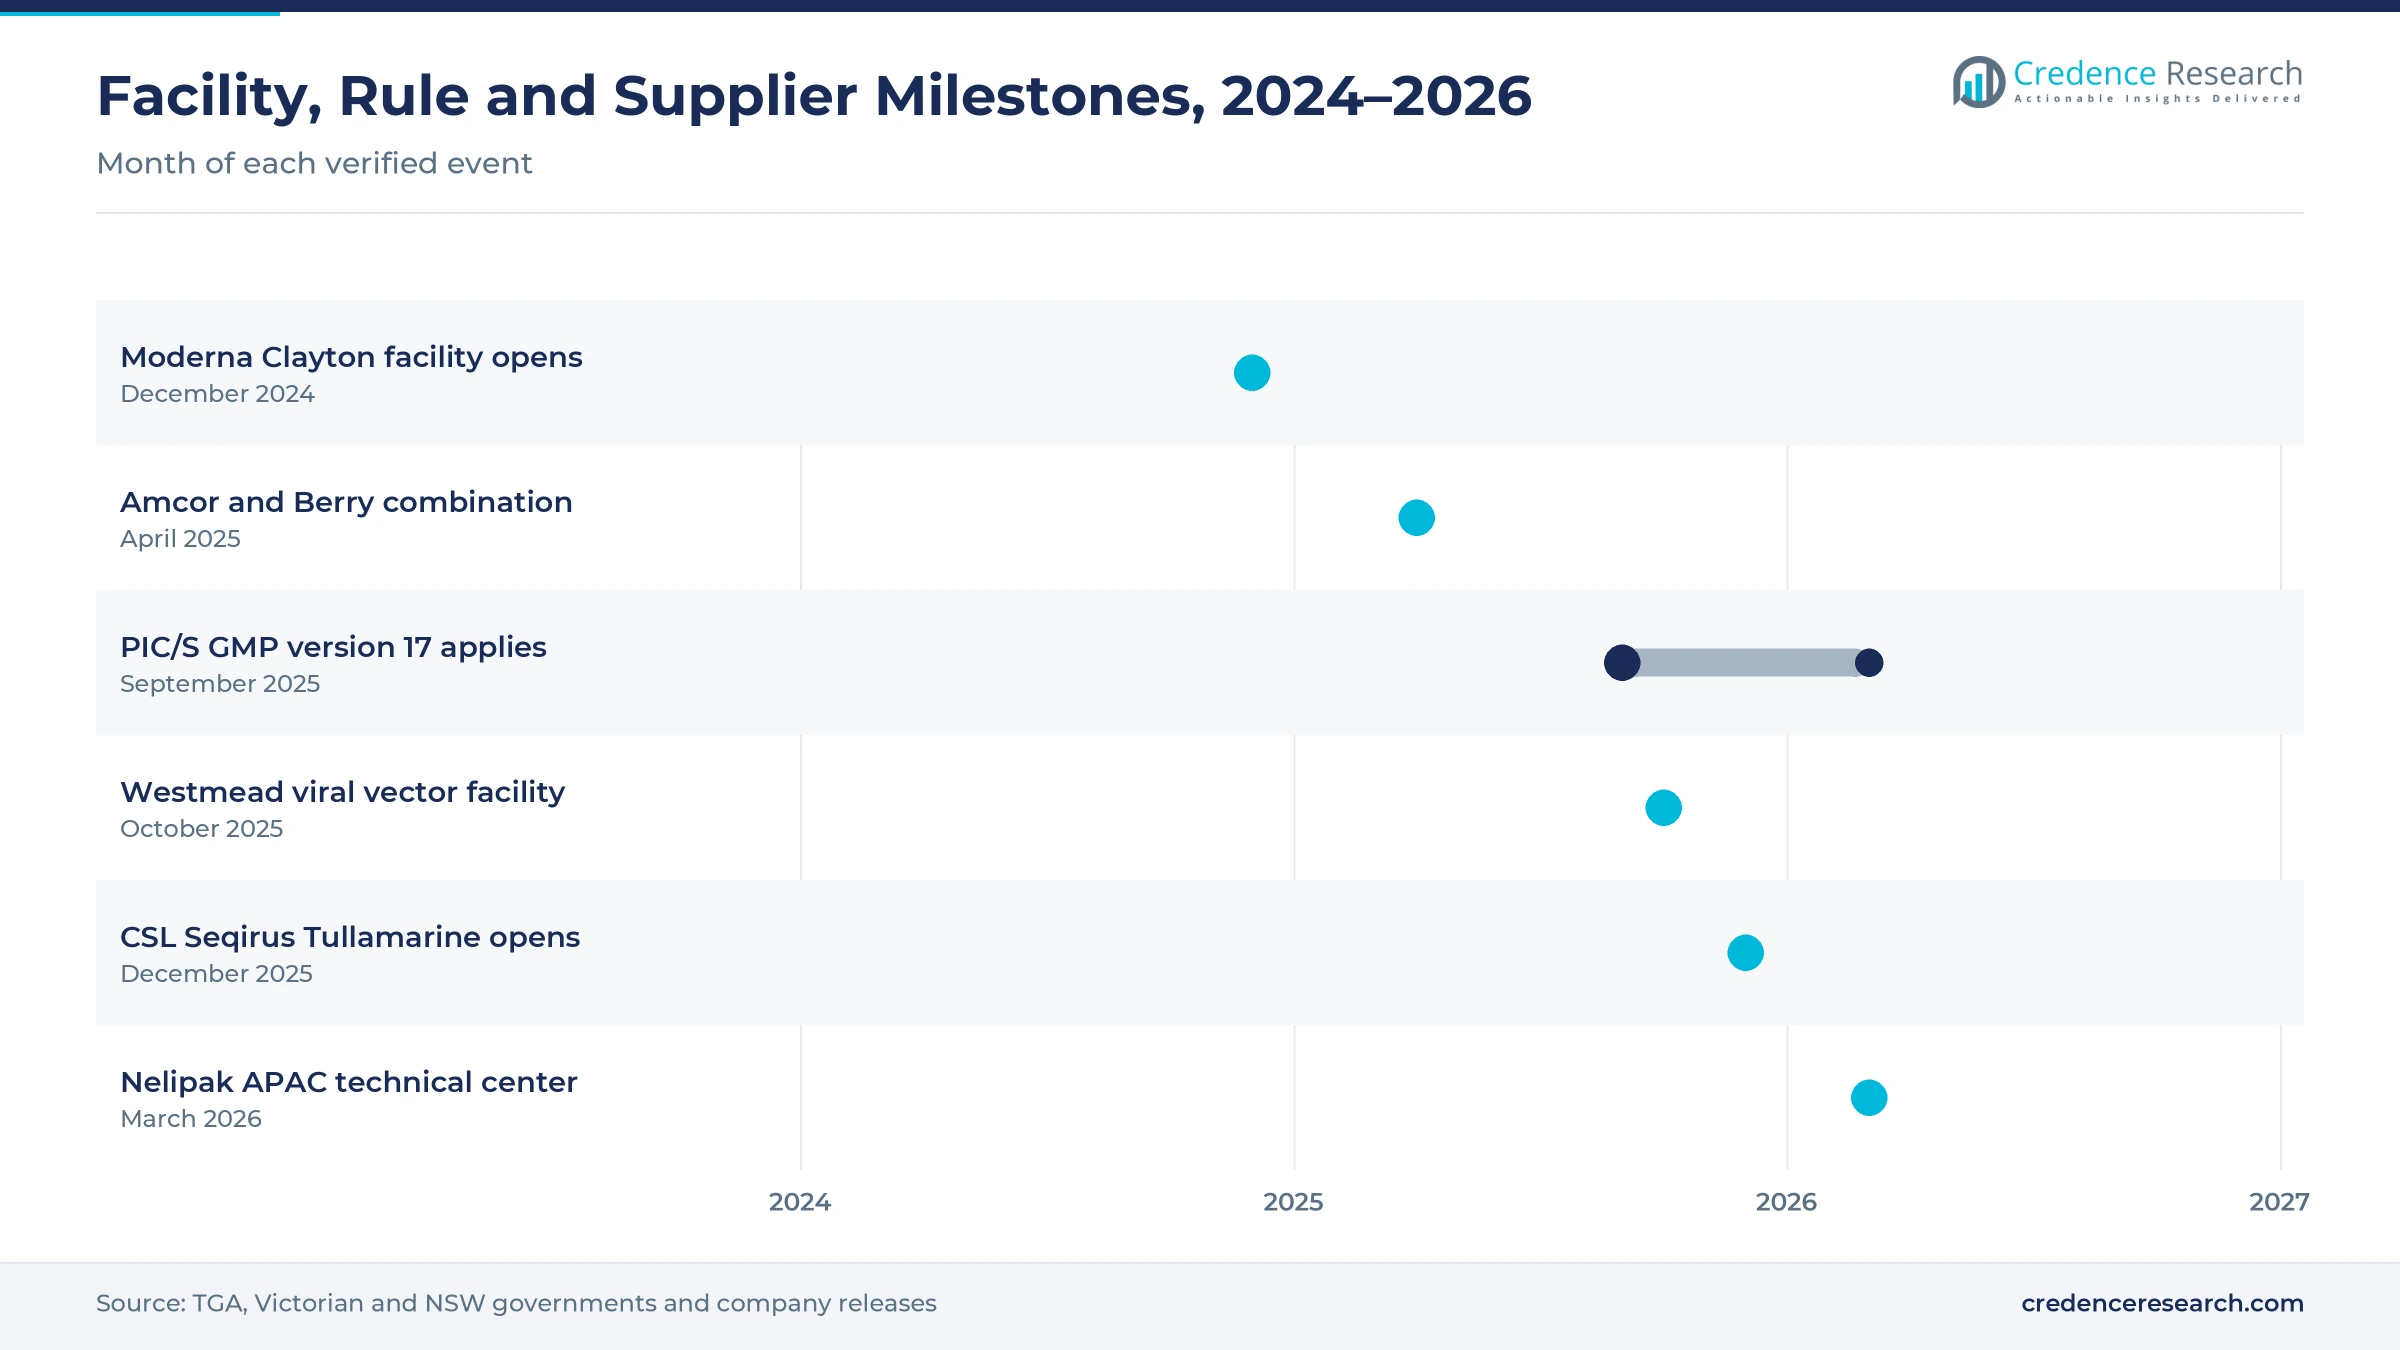
Each new vaccine plant buys liners, bags and wraps for components, media and finished product handling, so onshore capacity adds steady volume. Moderna opened its Clayton facility in Victoria on Dec. 4, 2024, with capacity for up to 100 million doses a year, according to the Victorian Premier. The Victorian Government says the site received its full GMP license from the regulator in August 2025 and packs finished product onsite. CSL Seqirus then opened an A$1 billion cell-based influenza vaccine plant at Tullamarine in December 2025, with 28,400 square meters across three buildings. In turn, Victoria grows at 6.15% a year, above the national rate, as these plants scale routine production.
How does flexible bioprocess handling widen use?
Single-use plants replace steel tanks with sterile bags, film chambers and tubing sets, which turns each batch into recurring material demand. Thermo Fisher Scientific runs a Brisbane biologics site whose upstream bioreactors are fully single-use, with fed-batch scales from 250 to 2,000 liters, according to its Brisbane site profile. Sartorius supplies Flexsafe bags from 20 milliliters to 3,000 liters, built on a polyethylene film called S80 with a total thickness of 400 micrometers. Both Sartorius Australia and Sartorius Stedim Australia operate as local subsidiaries, which shortens support for these users. As a result, process containment grows at 6.56% a year, the fastest application, as more media, buffer and harvest steps adopt disposable bioprocessing systems.
Why do cell, gene and RNA facilities add new buyers?
Small-batch therapies rely almost entirely on closed, disposable material paths, so every new advanced therapy site becomes a regular buyer. The Viral Vector Manufacturing Facility at Westmead in Sydney launched in October 2025 with A$134.5 million from the NSW Government and clinical runs of up to 500 liters. Peter MacCallum Cancer Centre in Melbourne opened 1,700 square meters of new lab and clean space in July 2023, lifting capacity to 2,000 patient doses a year. The NSW Government also funded an A$96 million RNA pilot facility at Macquarie University that is expected to operate in 2026. In turn, biotechnology and life sciences R&D grows at 6.69% a year, the fastest end-use industry during 2026–2035.
Multilayer films, regional design support and recycling
How is the shift to coextruded multilayer films changing supply?
Bioprocess and device users now ask for cleaner contact layers with added strength and gas barriers, which favors coextruded structures over simple liners. TekniPlex Healthcare announced a multilayer blown film line at Puurs in Belgium in January 2024, and its existing monolayer lines sit inside ISO Class 7 cleanrooms. Sartorius builds its newer Flexsafe bags on a single multilayer polyethylene film, which helps users qualify one material across many bag sizes. Amcor completed its all-stock combination with Berry Global on April 30, 2025, according to its filing with U.S. regulators, which widens its consumer and healthcare film range. As a result, coextruded multilayer films grow at 6.46% a year, the fastest technology during 2026–2035.
Why is the rise of regional design support notable?
Australian device makers increasingly need packaging that is validated quickly for local and export markets, and suppliers are moving design teams closer to them. Nelipak opened a technical development center in Singapore in March 2026 that serves customers in Southeast Asia, India, Australia and New Zealand. The center combines flexible and rigid sterile barrier work, prototyping and support for ISO 11607 compliance in one location. That closer support shortens changes to materials, sterilization methods and line extensions, which often stall device launches. In turn, sterile packaging holds 38.0% of 2025 value, and buyers favor suppliers that can test sterile barrier systems within the region.
Can quantum and microfabrication work open new demand?
Quantum and microfabrication labs need very low particle wraps, bags and protective films for wafers, optics and delicate parts. The Australian and Queensland governments committed a combined A$940 million to PsiQuantum in April 2024 to build a photonic quantum computer in Brisbane. The Australian National Fabrication Facility runs eight nodes across 21 institutions and helped 2,745 clients in 2022, which shows a broad base of clean research users. Many of these labs buy surface protection films and antistatic bags in small, frequent orders. As a result, semiconductor and electronics demand grows faster than the national rate, with Queensland gaining most from the new quantum program.
Is there an opening in recyclable clean packaging?
Packaging rules now ask suppliers to cut plastic waste without weakening sterility, which creates room for simpler single-polymer formats. The federal environment department opened consultation on national packaging reform on Sept. 27, 2024, with options that include mandatory requirements and recycled content, according to Packaging Gateway. The 2025 National Packaging Targets set a goal of 70% of plastic packaging recycled or composted and an average of 50% recycled content. Hospitals and laboratories also produce large volumes of clean polyethylene film that could suit separate collection. In turn, suppliers of single-polymer monolayer films and bags can win buyers that want simpler recovery streams once clean area use ends.
Import reliance, validation work and plastic rules weigh
How does import reliance affect lead times?
Most clean-extruded films, bioprocess bags and sterile pouches used in Australia are made overseas, which exposes buyers to long supply chains. As a result, freight delays and currency swings can hold up validation batches and raise costs for producers. Buyers respond by holding safety stock and by qualifying a second supplier for critical bag and liner formats. This risk favors suppliers that keep local stock and technical teams.
Why does change control slow material switches?
Any new film, bag or pouch that touches product needs extractables data, integrity testing and regulatory paperwork before routine use. In turn, producers often keep older materials for years even when better options exist. Suppliers respond by offering validation packages and standard film platforms across many sizes. This approach shortens reviews, yet it still ties buyers to a small group of qualified vendors.
How do plastic waste rules pressure clean packaging?
Most clean packaging is used once and then discarded as clinical or general waste, which draws attention from waste regulators. As a result, hospitals and producers face rising disposal costs and scrutiny from packaging regulators. Suppliers respond with single-polymer structures and take-back trials, which can ease recovery once contamination risk is managed. Progress stays slow while sterility and safety remain the first priority for buyers.
Why does a small user base limit local converting?
Australia has fewer large sterile plants than the United States, Europe or East Asia, which weakens the case for local clean converting. In turn, global extruders rarely place clean film lines in the country, and local converters serve mostly short, custom runs. Buyers respond by grouping orders through distributors and by standardizing formats across sites. This structure keeps prices higher than in larger markets for many specialty formats.
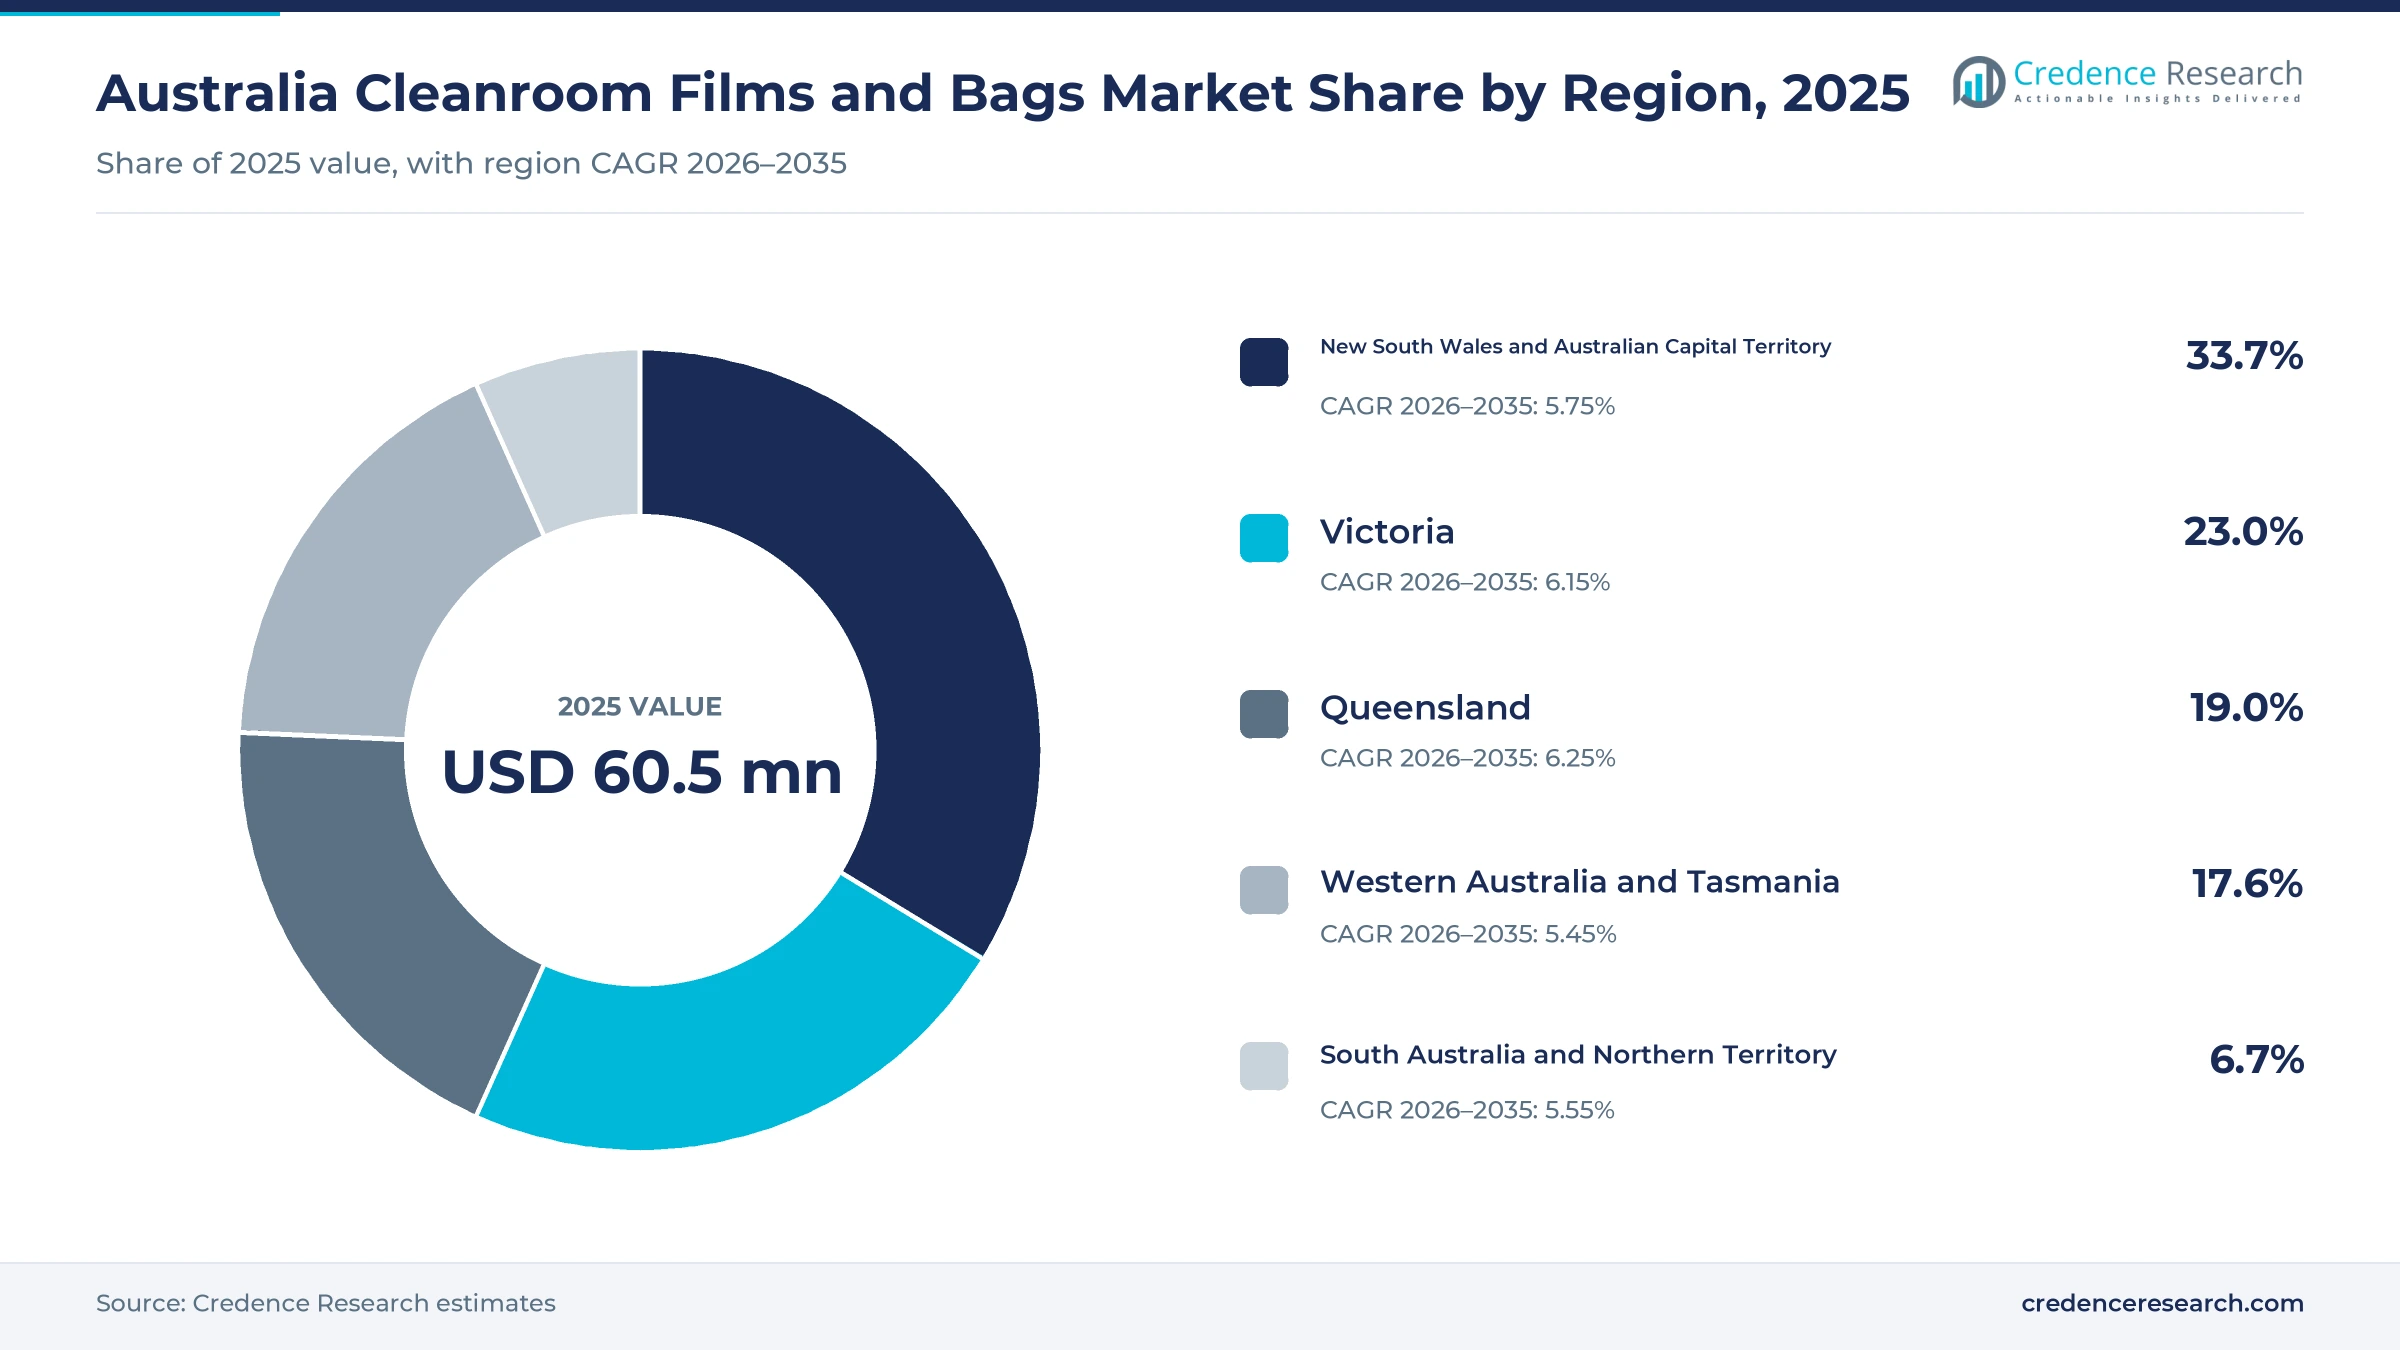
New South Wales leads while Queensland grows fastest
| Region | Value, 2025 (USD million) | Share, 2025 | CAGR, 2026–2035 |
|---|---|---|---|
| New South Wales and Australian Capital Territory | 20.4 | 33.7% | 5.75% |
| Victoria | 13.9 | 23.0% | 6.15% |
| Queensland | 11.5 | 19.0% | 6.25% |
| Western Australia and Tasmania | 10.6 | 17.6% | 5.45% |
| South Australia and Northern Territory | 4.1 | 6.7% | 5.55% |
Why do New South Wales and the ACT hold the top share?
New South Wales and the Australian Capital Territory held a 33.7% share of 2025 value and grow at 5.75% a year, because Sydney hosts drug, device, research and hospital buyers. The Viral Vector Manufacturing Facility at Westmead began clinical and commercial vector work in October 2025. The planned RNA pilot facility at Macquarie University adds another sterile buyer from 2026. As a result, this zone buys the largest volume of sterile pouches, liners and research bags.
How does Victoria support vaccine-led demand?
Victoria held a 23.0% share of 2025 value and grows at 6.15% a year, because Melbourne combines vaccine, plasma and cell therapy production. CSL opened a plasma fractionation facility at Broadmeadows in December 2022 with capacity for up to 9.2 million plasma-equivalent liters a year. Moderna and CSL Seqirus added large vaccine plants at Clayton and Tullamarine in 2024 and 2025. In turn, Victoria buys large volumes of process bags, liners and wraps for its growing base of controlled-environment facilities.
Why is Queensland growing fastest?
Queensland held a 19.0% share of 2025 value and grows fastest at 6.25% a year, because Brisbane combines single-use biologics production with new quantum computing work. Thermo Fisher Scientific runs a commercial and clinical biologics site in Brisbane with fully single-use upstream bioreactors. PsiQuantum also plans its photonic quantum computer in the city with shared federal and state funding. As a result, Queensland adds demand for bioprocess bags and protective films at a faster pace.
How do Western Australia and Tasmania contribute?
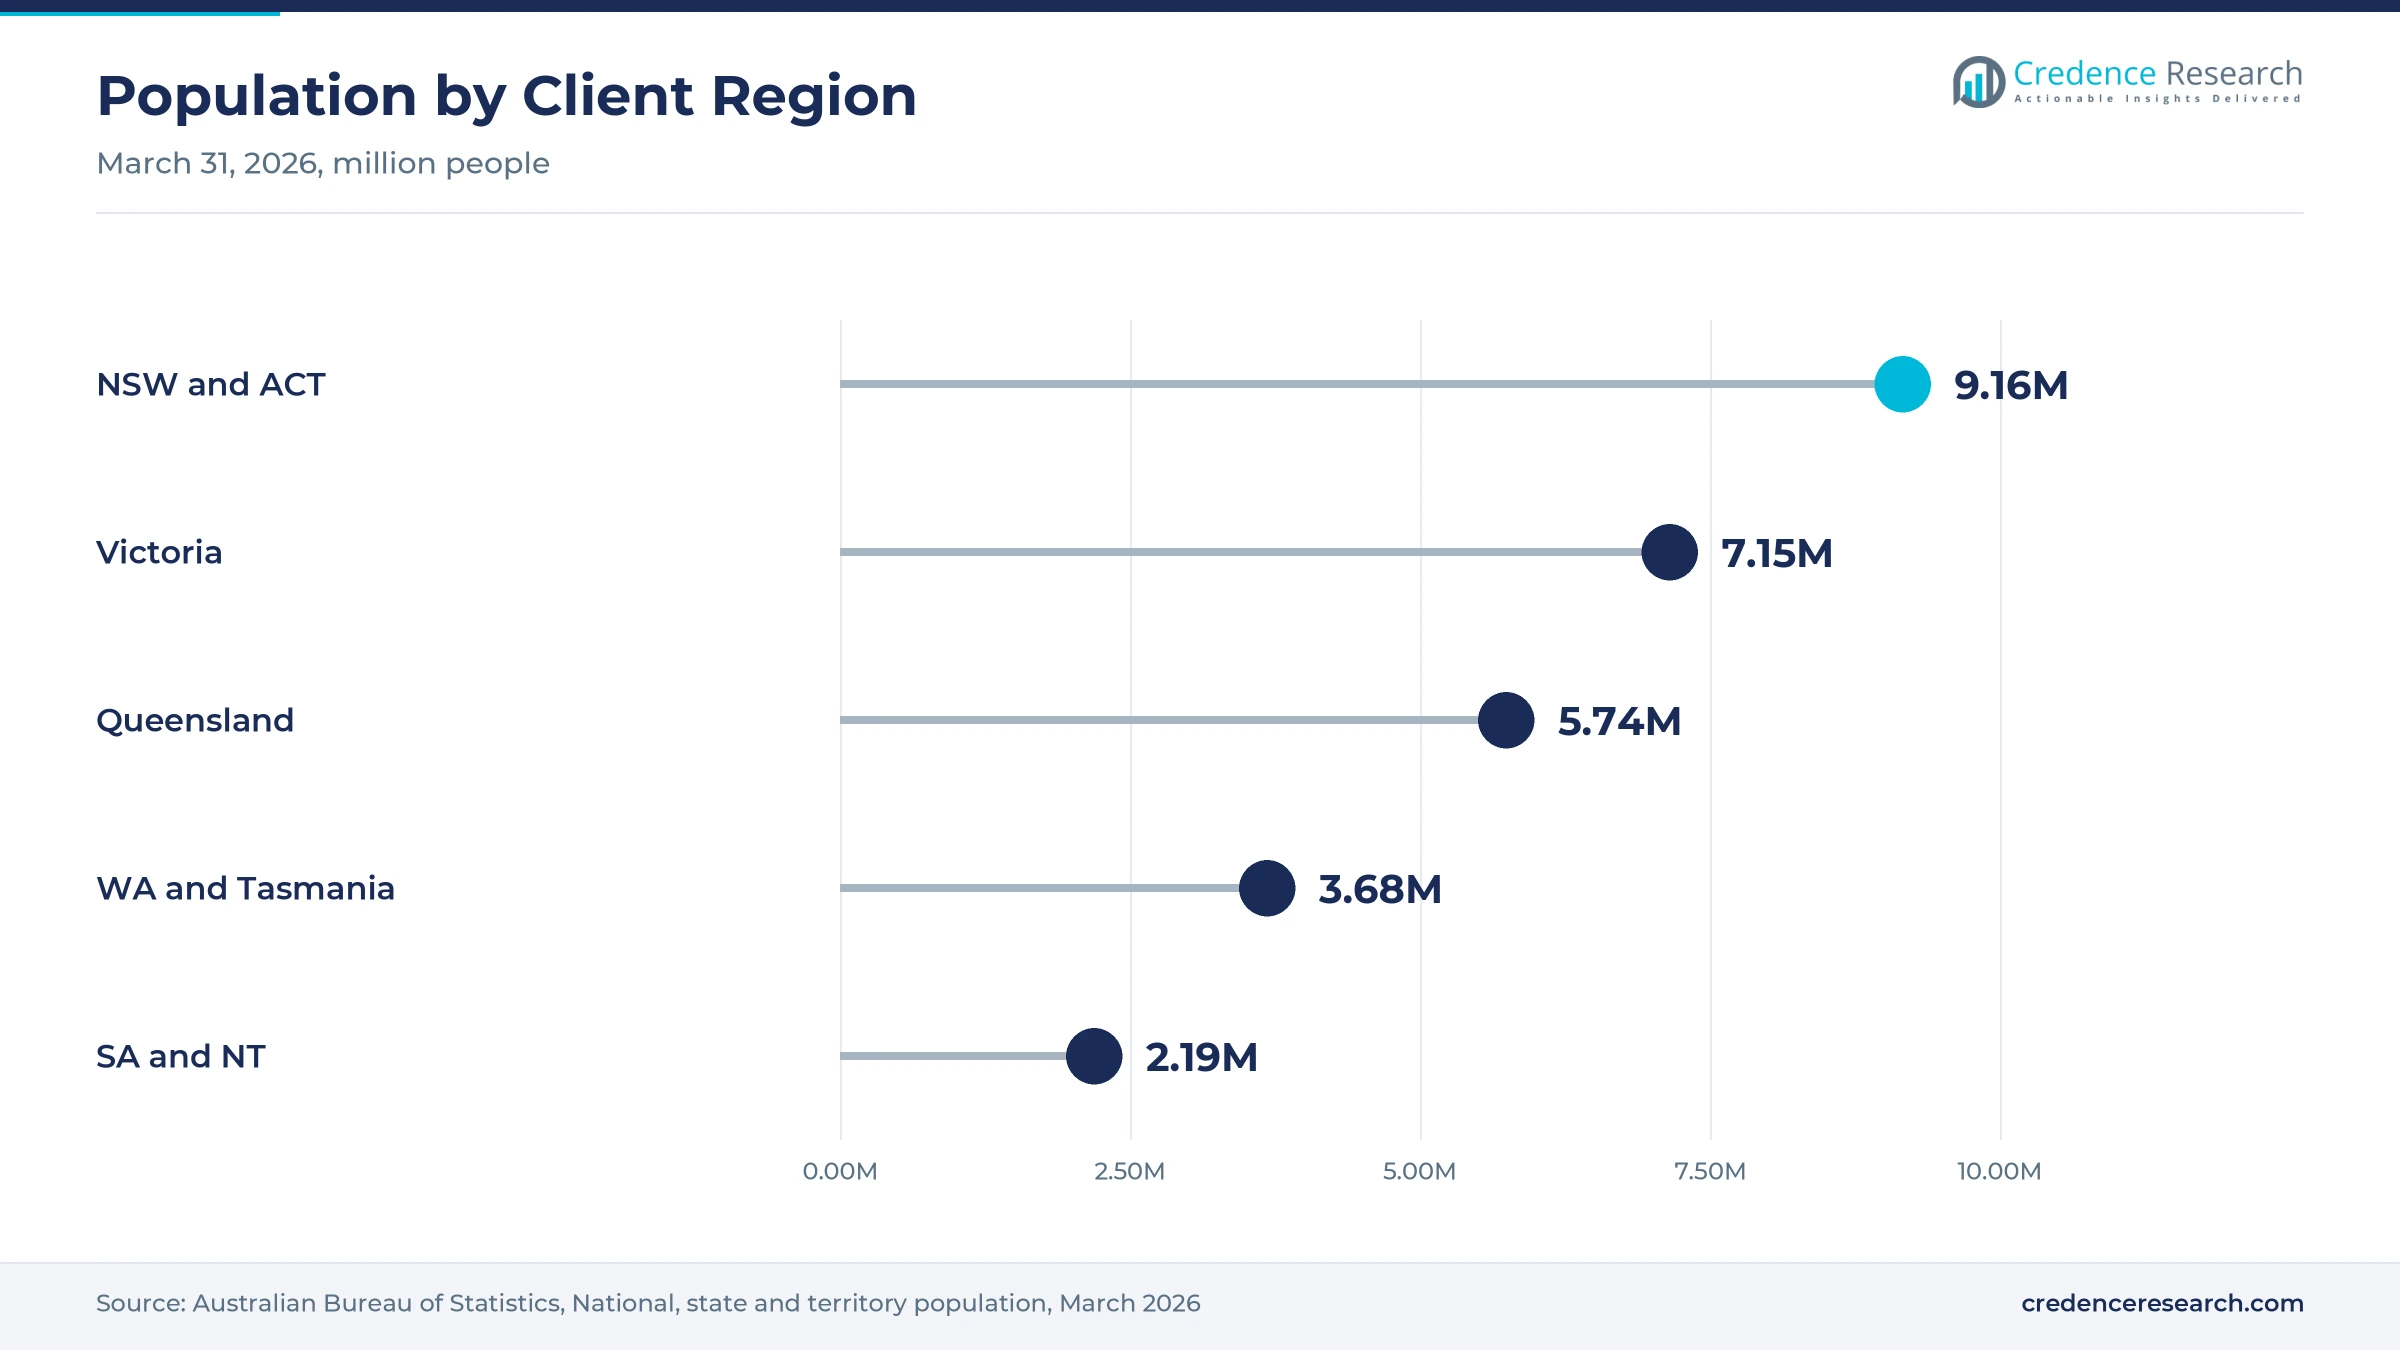
Western Australia and Tasmania held a 17.6% share of 2025 value and grow at 5.45% a year, because hospitals, research groups and resource laboratories form most of the buyer base. Western Australia recorded the fastest population growth of any state in the year to March 2026, at 2.1%. That growth supports hospital and pathology demand for sterile pouches and wraps. In turn, this zone buys mainly standard formats through scientific supply distributors.
What shapes demand in South Australia and the Northern Territory?
South Australia and the Northern Territory held a 6.7% share of 2025 value and grow at 5.55% a year, because Adelaide research and hospital sites account for most purchasing. South Australia had 1.92 million residents and the Northern Territory had 0.27 million at March 31, 2026. Hospital procurement drives most of the remaining spend on sterile pouches. As a result, this zone relies on distributors rather than direct manufacturer contracts.
Vaccine plant openings, GMP rules and supplier moves
| Development | Status and market relevance |
|---|---|
| In December 2024, Moderna opened its mRNA vaccine facility at Clayton in Victoria. | Adds a large sterile buyer with onsite packing of finished product |
| In September 2025, the PIC/S Guide to GMP version 17 began to apply to Australian medicine makers. | Brings the most significant sterile manufacturing changes in the guide |
| In October 2025, the Viral Vector Manufacturing Facility launched at Westmead in Sydney. | Adds clinical and commercial vector production with single-batch runs up to 500 liters |
| In December 2025, CSL Seqirus opened its cell-based influenza vaccine plant at Tullamarine. | Adds year-round sterile production of flu vaccines, antivenoms and Q fever vaccine |
| In March 2026, Nelipak opened a technical development center in Singapore serving Australia. | Brings sterile barrier design and prototyping closer to Australian device makers |
Coextrusion, clean converting and sterilization set quality
- Coextruded multilayer films combine a clean contact layer with strength and barrier layers, which suits bioprocess bags that hold media and drug substance.
- Clean extrusion and converting produce films and bags inside classified rooms, which limits particles and bioburden before materials reach users.
- Gamma and steam-ready formats let producers sterilize bags, pouches and wraps before use, which simplifies transfer into the highest grade zones.
- Integrity and extractables testing confirms that seals hold and that films do not release harmful substances, which supports change control and regulator review.
Need a Custom Version of This Report?
Tailor the scope, geography, or segments to your exact requirements.
- Custom geography or segment scope
- Direct access to our analyst team
Converters and bioprocess suppliers compete on validation
Competition combines global converters of sterile and clean films with bioprocess suppliers that sell bags as part of complete single-use systems. Amcor, listed on the Australian Securities Exchange, supplies consumer and healthcare packaging and widened its range through the Berry Global combination in April 2025. Sartorius operates Sartorius Australia and Sartorius Stedim Australia as local companies and sells Flexsafe storage and shipping bags. Thermo Fisher Scientific runs a Brisbane biologics site built around single-use bioreactors. Nelipak supports Australian device makers from its Singapore technical center. Many buyers also run contract drug production lines that qualify several suppliers for each format. Suppliers compete on validation data, clean manufacturing, local stock and the speed of custom design.
Which suppliers serve Australian clean packaging buyers?
| Company | Type | Role in the market |
|---|---|---|
| Amcor | Packaging converter | ASX-listed supplier of consumer and healthcare packaging |
| Sartorius | Bioprocess supplier | Runs two Australian subsidiaries and sells Flexsafe bags |
| Thermo Fisher Scientific | Bioprocess supplier and producer | Runs a Brisbane biologics site with single-use bioreactors |
| Nelipak | Sterile barrier packaging maker | Supports Australian customers from a Singapore technical center |
Credence Research view on clean packaging demand
Credence Research's view is that Australian demand for contamination-controlled packaging will grow steadily because vaccine plants, biologics sites and advanced therapy groups keep adding sterile output. Bags remain the largest product type, while tubing and specialty formats grow fastest as single-use assemblies spread. Queensland and Victoria gain most from new facilities, while New South Wales keeps the largest buyer base. Suppliers that combine validated multilayer films, local stock and quick custom design should gain the most share by 2035, and recyclable formats offer a second path.
How the national clean packaging estimate was built
The report uses 2025 as the base year on a calendar basis, and market values come from the Credence Research model. That model combines regulator guidance, government project releases, official population statistics, company filings and company product pages. Segment splits and regional growth rates are Credence Research estimates, while regional shares follow the client split. Sources used are regulator pages, government releases, company filings, trade media and company websites, and no interviews or surveys were used.
Biologics, advanced therapies and devices drive growth
The Australia cleanroom films and bags market is expected to reach USD 117.0 million by 2035, a 5.87% CAGR during 2026–2035, as vaccine, biologics, device and research users keep adding sterile and clean output. Growth should be strongest in tubing and specialty formats, process containment and Queensland, because these areas gain most from single-use processing and new facilities. Import reliance, change control and plastic waste rules could slow some switches, while local stock and recyclable single-polymer designs should ease adoption for many buyers.
Frequently Asked Questions
How big is the Australia cleanroom films and bags market?
Which product type leads contamination-controlled packaging spending?
Which region leads the market?
How do GMP rules affect demand for clean packaging?
How do vaccine plants support demand?
Why do single-use systems matter for this market?
Who are the leading companies serving Australian buyers?
What are the main challenges for buyers?
Table of Content
Chapter 1 Market Segmentation
- 1.1 Segmentation Framework
- 1.1.1 Product and Service Classification
- 1.1.2 Application and End-Use Classification
- 1.1.3 Technology and Solution Classification
- 1.1.4 Customer and Distribution Channel Classification
- 1.1.5 Geographic Segmentation
- 1.1.6 Market Segment Definitions and Boundaries
- 1.2 By Product Type
- 1.2.1 Cleanroom Bags
- 1.2.2 Cleanroom Films and Wraps
- 1.2.3 Cleanroom Pouches
- 1.2.4 Tubing and Specialty Formats
- 1.3 By End-Use Industry
- 1.3.1 Pharmaceuticals and Biologics
- 1.3.2 Medical Devices
- 1.3.3 Biotechnology and Life Sciences R&D
- 1.3.4 Semiconductor and Electronics
- 1.3.5 Hospital
- 1.3.6 Aerospace and Controlled-Environment Applications
- 1.4 By Application
- 1.4.1 Sterile Packaging
- 1.4.2 Process Containment
- 1.4.3 Storage and Transportation
- 1.4.4 Surface Protection
- 1.5 By Technology
- 1.5.1 Monolayer Films
- 1.5.2 Coextruded Multilayer Films
- 1.5.3 Laminated Barrier Films
Chapter 2 Introduction
- 2.1 Report Objectives and Scope
- 2.2 Product Definition and Industry Terminology
- 2.3 Market Inclusions and Exclusions
- 2.4 Research Process
- 2.4.1 Primary Research and Expert Interviews
- 2.4.2 Secondary Research and Source Review
- 2.4.3 Top-Down and Bottom-Up Estimation
- 2.4.4 Data Triangulation and Verification
- 2.5 Market Size Measurement Basis
- 2.5.1 2025: USD 60.5 million → 2035: USD 117.0 million
- 2.6 Historical and Forecast Reference Periods
- 2.6.1 Historical Period: 2018-2025
- 2.6.2 Base Year: 2025
- 2.6.3 Forecast Period: 2025-2035
- 2.7 Research Assumptions and Limitations
Chapter 3 Executive Summary
- 3.1 Market Snapshot and Key Findings
- 3.2 Base-Year Market Size, 2025
- 3.3 Forecast Market Size, 2035
- 3.4 Revenue and Volume Growth Outlook
- 3.5 Key Demand and Supply Indicators
- 3.6 Leading Market Segments
- 3.7 Fastest-Growing Market Opportunities
- 3.8 Regional Performance Highlights
- 3.9 Technology and Industry Transformation
- 3.10 Competitive Landscape Summary
- 3.11 Analyst View and Strategic Implications
Chapter 4 Australia Cleanroom Films and Bags Market Trends and Developments
- 4.1 Historical Industry Development, 2018-2025
- 4.2 Recent Market Trends and Developments
- 4.3 Demand and Customer Behavior Trends
- 4.4 Technology and Product Innovation
- 4.5 Artificial Intelligence, Automation and Digitalization
- 4.6 Local Manufacturing and Supply Chain Realignment
- 4.7 Industry Partnerships, Mergers and Acquisitions
- 4.8 Sustainability and Circular Economy Developments
- 4.9 Government and Private Sector Investment Trends
- 4.10 Emerging Business Models and Commercialization
- 4.11 Industry Developments and Announcements
Chapter 5 Australia Cleanroom Films and Bags Market Production, Supply and Demand Analysis
- 5.1 Demand Trend and Consumption Analysis, 2018-2025
- 5.2 Demand Forecast, 2025-2035
- 5.3 Production and Output Trend, 2018-2025
- 5.4 Production and Output Forecast, 2025-2035
- 5.5 Installed Capacity and Capacity Utilization
- 5.6 Company-Wise Production Plants and Statistics
- 5.6.1 Installed Production Capacity
- 5.6.2 Actual Production
- 5.6.3 Planned Capacity and Expansion Targets
- 5.7 Supply Chain Structure and Procurement Trends
- 5.8 Supply-Demand Gap and Bottlenecks
- 5.9 Import Dependence and Sourcing Structure
- 5.10 Contract Manufacturing and Outsourcing
- 5.11 Regional Supply and Demand Concentration
Chapter 6 Australia Cleanroom Films and Bags Market Pricing Analysis
- 6.1 Pricing Structure and Measurement
- 6.2 Historical Pricing Trends, 2018-2025
- 6.3 Pricing Outlook, 2025-2035
- 6.4 Average Selling Price and Unit Economics
- 6.5 Pricing by Product and Market Segment
- 6.6 Geographic Pricing Differences
- 6.7 Key Input, Energy, Labor and Logistics Costs
- 6.8 Contract Pricing and Purchasing Models
- 6.9 Pricing Sensitivity and Competitive Positioning
- 6.10 Price, Margin and Profitability Implications
Chapter 7 Australia Cleanroom Films and Bags Market Dynamics
- 7.1 Market Growth Drivers
- 7.1.1 Demand-Side Drivers
- 7.1.2 Technology and Innovation Drivers
- 7.1.3 Infrastructure and Investment Drivers
- 7.1.4 Regulatory and Policy Drivers
- 7.2 Market Restraints
- 7.2.1 Cost and Affordability Constraints
- 7.2.2 Technology and Adoption Barriers
- 7.2.3 Supply Chain and Operational Constraints
- 7.3 Market Challenges
- 7.3.1 Competitive Pressure and Margin Erosion
- 7.3.2 Skills, Infrastructure and Implementation Gaps
- 7.4 Emerging Market Opportunities
- 7.5 Market Dynamics Impact and Time-Horizon Assessment
Chapter 8 Australia Cleanroom Films and Bags Value Chain Analysis
- 8.1 Industry Value Chain Overview
- 8.2 Upstream Suppliers and Critical Inputs
- 8.3 Technology and Component Providers
- 8.4 Manufacturing or Service Delivery
- 8.5 Distribution, Channel Partners and Integrators
- 8.6 Downstream Applications and End Users
- 8.7 Value Addition and Profit Pools
- 8.8 Vertical Integration and Outsourcing
- 8.9 Supplier Concentration and Risk
- 8.10 Supply Chain Localization and Resilience
Chapter 9 Australia Cleanroom Films and Bags Market Regulations and Policies
- 9.1 Relevant Laws, Standards and Compliance Frameworks
- 9.2 Product, Service, Safety and Quality Requirements
- 9.3 Government Policies, Incentives and Subsidies
- 9.4 Imports, Exports and Trade Barriers
- 9.5 Public Procurement and Local Content Requirements
- 9.6 Environmental and Sustainability Compliance
- 9.7 Upcoming Policy Changes and Market Implications
Chapter 10 Australia Cleanroom Films and Bags Market Hotspots and Opportunities
- 10.1 Market Opportunity Mapping and Growth Hotspots
- 10.2 High-Growth Applications and Customer Groups
- 10.3 Underserved Markets and White-Space Opportunities
- 10.4 Emerging Technology and Product Opportunities
- 10.5 New Capacity and Investment Hotspots
- 10.6 Market Entry and Expansion Opportunities
- 10.7 Distribution and Partnership Opportunities
- 10.8 Near-Term and Long-Term Commercial Potential
- 10.9 Opportunity Attractiveness and Execution Risks
Chapter 11 Australia Cleanroom Films and Bags Market Outlook, 2025-2035
- 11.1 Market Size and Analysis
- 11.1.1 Revenue (Market Measurement: 2025: USD 60.5 million → 2035: USD 117.0 million)
- 11.1.2 Market Volume and Quantity Sold
- 11.1.3 Historical Market Size, 2018-2025
- 11.1.4 Base-Year Market Size, 2025
- 11.2 Market Forecast, 2025-2035
- 11.2.1 Revenue Forecast to 2035
- 11.2.2 Volume Forecast to 2035
- 11.2.3 CAGR and Year-on-Year Growth
- 11.2.4 Incremental Revenue Opportunity
- 11.3 Forecast Assumptions and Scenario Analysis
- 11.3.1 Base-Case Forecast
- 11.3.2 Optimistic and Conservative Scenarios
- 11.3.3 Technology, Pricing and Policy Sensitivities
- 11.4 Market Attractiveness and Growth Outlook
Chapter 12 Australia Cleanroom Films and Bags Market Segmentation and Outlook
- 12.1 Segmentation Summary and Market Shares, 2025
- 12.2 Largest and Fastest-Growing Segments
- 12.3 By Product Type - Market Size and Forecast, 2025-2035
- 12.3.1 Segment Definition and Scope
- 12.3.2 Historical Market Size, 2018-2025
- 12.3.3 Revenue Forecast, 2025-2035
- 12.3.4 Volume Forecast, 2025-2035
- 12.3.5 Base-Year Market Share, 2025
- 12.3.6 Segment CAGR and Growth Drivers
- 12.3.7 Subsegment Market Size and Forecast
- 12.3.7.1 Cleanroom Bags
- 12.3.7.2 Cleanroom Films and Wraps
- 12.3.7.3 Cleanroom Pouches
- 12.3.7.4 Tubing and Specialty Formats
- 12.3.8 Subsegment Pricing and Adoption Trends
- 12.3.9 Leading Suppliers and Competition
- 12.3.10 Regional Demand and Opportunities
- 12.4 By End-Use Industry - Market Size and Forecast, 2025-2035
- 12.4.1 Segment Definition and Scope
- 12.4.2 Historical Market Size, 2018-2025
- 12.4.3 Revenue Forecast, 2025-2035
- 12.4.4 Volume Forecast, 2025-2035
- 12.4.5 Base-Year Market Share, 2025
- 12.4.6 Segment CAGR and Growth Drivers
- 12.4.7 Subsegment Market Size and Forecast
- 12.4.7.1 Pharmaceuticals and Biologics
- 12.4.7.2 Medical Devices
- 12.4.7.3 Biotechnology and Life Sciences R&D
- 12.4.7.4 Semiconductor and Electronics
- 12.4.7.5 Hospital
- 12.4.7.6 Aerospace and Controlled-Environment Applications
- 12.4.8 Subsegment Pricing and Adoption Trends
- 12.4.9 Leading Suppliers and Competition
- 12.4.10 Regional Demand and Opportunities
- 12.5 By Application - Market Size and Forecast, 2025-2035
- 12.5.1 Segment Definition and Scope
- 12.5.2 Historical Market Size, 2018-2025
- 12.5.3 Revenue Forecast, 2025-2035
- 12.5.4 Volume Forecast, 2025-2035
- 12.5.5 Base-Year Market Share, 2025
- 12.5.6 Segment CAGR and Growth Drivers
- 12.5.7 Subsegment Market Size and Forecast
- 12.5.7.1 Sterile Packaging
- 12.5.7.2 Process Containment
- 12.5.7.3 Storage and Transportation
- 12.5.7.4 Surface Protection
- 12.5.8 Subsegment Pricing and Adoption Trends
- 12.5.9 Leading Suppliers and Competition
- 12.5.10 Regional Demand and Opportunities
- 12.6 By Technology - Market Size and Forecast, 2025-2035
- 12.6.1 Segment Definition and Scope
- 12.6.2 Historical Market Size, 2018-2025
- 12.6.3 Revenue Forecast, 2025-2035
- 12.6.4 Volume Forecast, 2025-2035
- 12.6.5 Base-Year Market Share, 2025
- 12.6.6 Segment CAGR and Growth Drivers
- 12.6.7 Subsegment Market Size and Forecast
- 12.6.7.1 Monolayer Films
- 12.6.7.2 Coextruded Multilayer Films
- 12.6.7.3 Laminated Barrier Films
- 12.6.8 Subsegment Pricing and Adoption Trends
- 12.6.9 Leading Suppliers and Competition
- 12.6.10 Regional Demand and Opportunities
- 12.7 Segment Growth Comparison
- 12.8 Segment Attractiveness and Priority Matrix
Chapter 13 Australia Cleanroom Films and Bags End-Use and Application Market Outlook
- 13.1 End-Use Industry and Customer Demand Structure
- 13.2 Leading Applications and Customer Groups
- 13.3 End-Use Market Size, Share and Forecast
- 13.4 Major End-Use Industry Deep Dives
- 13.4.1 Customer Requirements and Use Cases
- 13.4.2 Demand and Replacement Cycles
- 13.4.3 Technical and Regulatory Considerations
- 13.4.4 Purchasing and Procurement Models
- 13.4.5 Leading Vendors and Distribution Channels
- 13.4.6 Forecast and Commercial Opportunities
- 13.5 Emerging Applications and Cross-Segment Demand
- 13.6 End-Use Industry Investment Priorities
Chapter 14 Australia Cleanroom Films and Bags Geographic Market Outlook, 2025-2035
- 14.1 Domestic Market Distribution and Demand Clusters
- 14.2 State- or Province-Wise Market Size and Forecast, 2025-2035
- 14.3 City and Metropolitan Market Outlook
- 14.4 Industrial, Manufacturing and Commercial Clusters
- 14.5 Geographic Concentration of Key End Users
- 14.6 Local Pricing and Purchasing Differences
- 14.7 Domestic Production Facilities and Capacity Map
- 14.8 Local Infrastructure and Project Pipeline
- 14.9 State-Level Policy and Incentive Differences
- 14.10 Subnational Investment Hotspots and Opportunities
- 14.11 Distribution and Logistics Networks
- 14.12 Domestic Competitive Footprint
Chapter 15 Australia Cleanroom Films and Bags Technology, Innovation and Sustainability Outlook
- 15.1 Technology Landscape and Maturity
- 15.2 Product, Process and Service Innovation
- 15.3 AI, Automation and Digital Tools in the Industry
- 15.4 Technology Adoption and Performance Benchmarking
- 15.5 Innovation Pipeline and R&D Investment
- 15.6 Patent and Intellectual Property Trends
- 15.7 Energy Efficiency and Resource Management
- 15.8 Sustainability, Recycling and Circularity
- 15.9 Technology Roadmap, 2025-2035
- 15.10 Risks of Obsolescence and Technology Substitution
Chapter 16 Australia Cleanroom Films and Bags Market Key Strategic Imperatives
- 16.1 Growth and Market Entry Priorities
- 16.2 High-Return Products and Segments
- 16.3 Pricing, Profitability and Cost Optimization
- 16.4 Technology Investment and Product Differentiation
- 16.5 Supply Chain Localization and Resilience
- 16.6 Distribution and Customer Acquisition
- 16.7 Partnership, Acquisition and Capacity Strategy
- 16.8 Regional Expansion Priorities
- 16.9 Short-, Medium- and Long-Term Actions
Chapter 17 Competition Outlook
- 17.1 Industry Competition Characteristics
- 17.2 Market Structure and Concentration
- 17.3 Market Share and Competitive Positioning, 2025
- 17.4 Company-Wise Revenue and Product Benchmarking
- 17.5 Production and Service Capacity Benchmarking
- 17.6 Technology, Pricing and Differentiation
- 17.7 Regional Footprint and Distribution Strength
- 17.8 Mergers, Acquisitions and Strategic Alliances
- 17.9 New Entrants and Competitive Threats
- 17.10 Porter's Five Forces and Industry Attractiveness
- 17.11 Competitive Outlook, 2025-2035
Chapter 18 Company Profiles
- 18.1 Company Coverage and Selection Criteria
- 18.2 Amcor
- 18.2.1 Business Description
- 18.2.2 Company Ownership and Geographic Presence
- 18.2.3 Product and Service Portfolio
- 18.2.4 Manufacturing and Operating Footprint
- 18.2.5 Production Capacity and Expansion Plans
- 18.2.6 Financial Performance and Investment
- 18.2.7 Market Share and Competitive Position
- 18.2.8 Technology and Innovation Capabilities
- 18.2.9 Strategic Alliances or Partnerships
- 18.2.10 Recent Developments
- 18.2.11 Growth Strategy and Outlook
- 18.3 TekniPlex
- 18.4 Nelipak
- 18.5 Thermo Fisher Scientific
- 18.6 Sartorius
- 18.7 Other Relevant Market Participants
Note: Every listed company is profiled on the structure shown under the first company. The company list is preliminary and may change based on research findings, market developments, data availability and client requirements.
Chapter 19 Disclaimer
- 19.1 Research and Forecast Disclaimer
- 19.2 Data Source and Estimation Limitations
Note: The depth of individual sections depends on data availability for this market. Volume, capacity, trade and other unit-based metrics are included where applicable.

