
Bagging, wrapping and pouch lines for regional packers
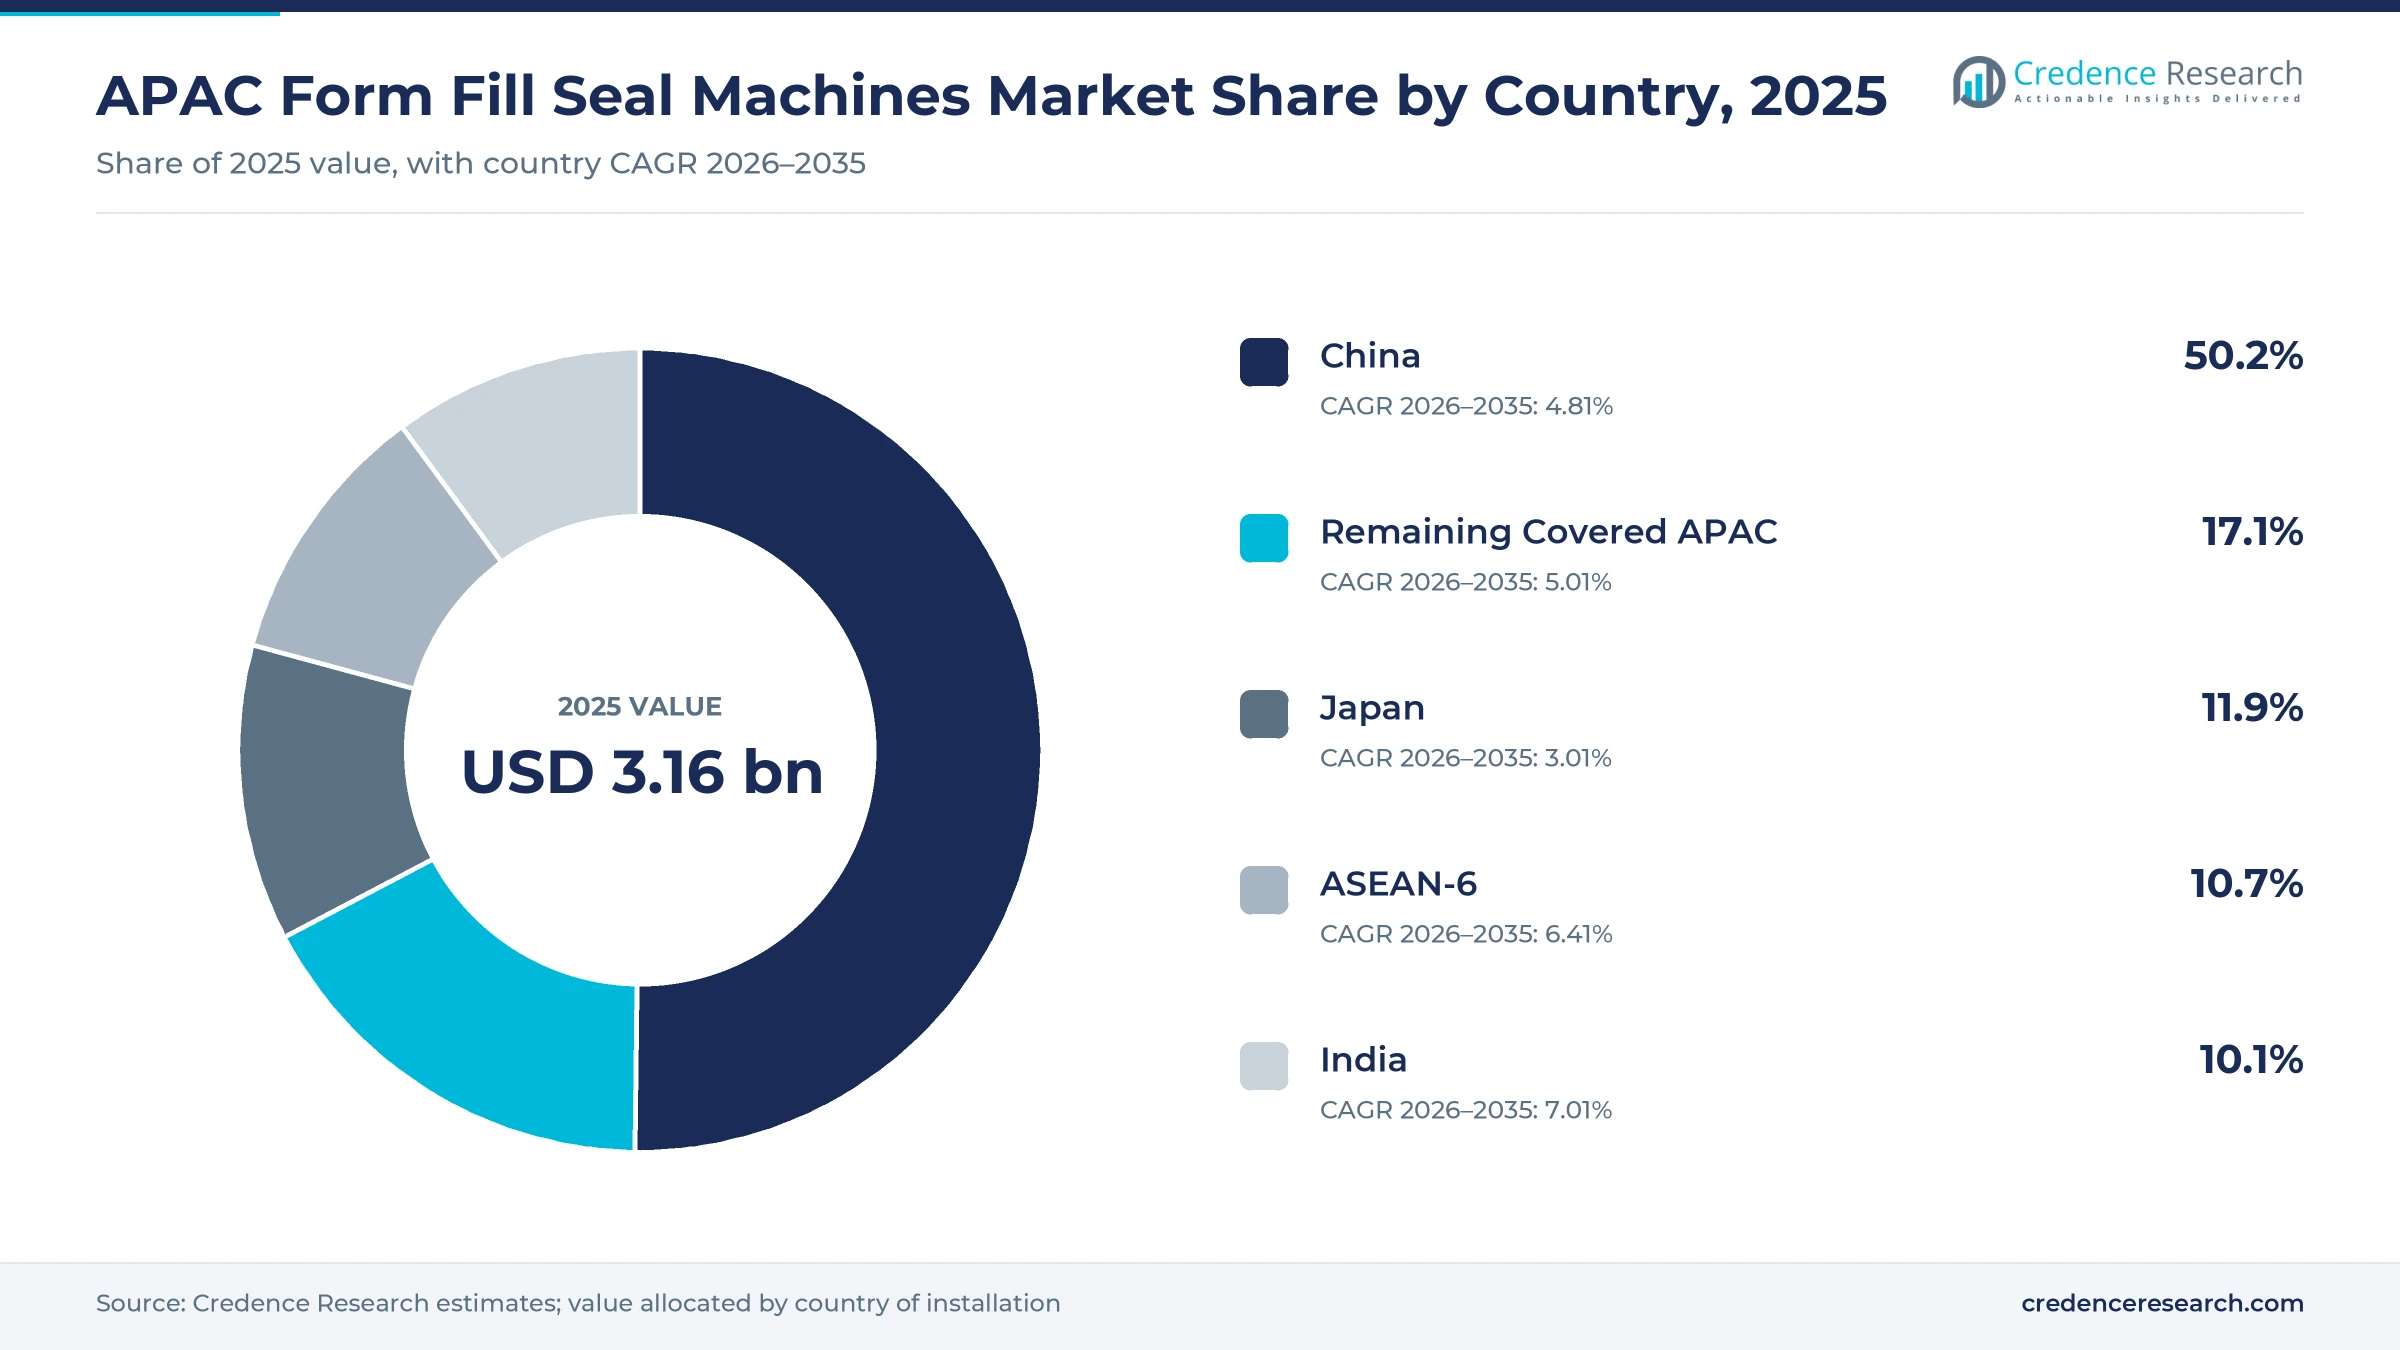
The APAC form fill seal machines market was valued at USD 3.16 billion in 2025 and is projected to increase from USD 3.33 billion in 2026 to USD 5.19 billion by 2035, registering a CAGR of 5.07% during 2026–2035. Demand comes from snack, dairy, spice and staple food packers, pharmaceutical makers filling sachets and stick packs, and personal care, agrochemical and feed producers that bag powders, granules and liquids. China held the largest country share, 50.2% in 2025, because it combines the largest food processing base with domestic and global machine builders that supply complete lines. India is the fastest-growing country at 7.01% a year, as incentive-backed food plants, packaged snacks and pharmaceutical exports add new packing capacity. India also raised recycled-content targets for flexible and multilayer plastic packaging in 2026, which pushes packers toward machines with tighter sealing control for thinner and mono-material films.
Which form fill seal equipment does the regional estimate cover?
The estimate measures spending on new form fill seal machines installed across China, India, Japan, the ASEAN-6 countries and the remaining covered Asia Pacific markets. It covers vertical, horizontal and rotary machines that form a pack from film or pre-cut material, dose the product and seal it in one cycle, together with integrated weighers and dosing units sold with the machine. Values are measured at the price paid by the buyer through direct OEM sales, authorized distributors or system integrators.
The estimate excludes used machines, spare parts and change parts sold separately, packaging film and standalone cartoners, case packers and palletizers bought apart from a line. The value chain runs from drive, sensor and sealing-jaw suppliers through machine builders and integrators to multisite brand owners, independent product manufacturers and contract packers that run the lines.
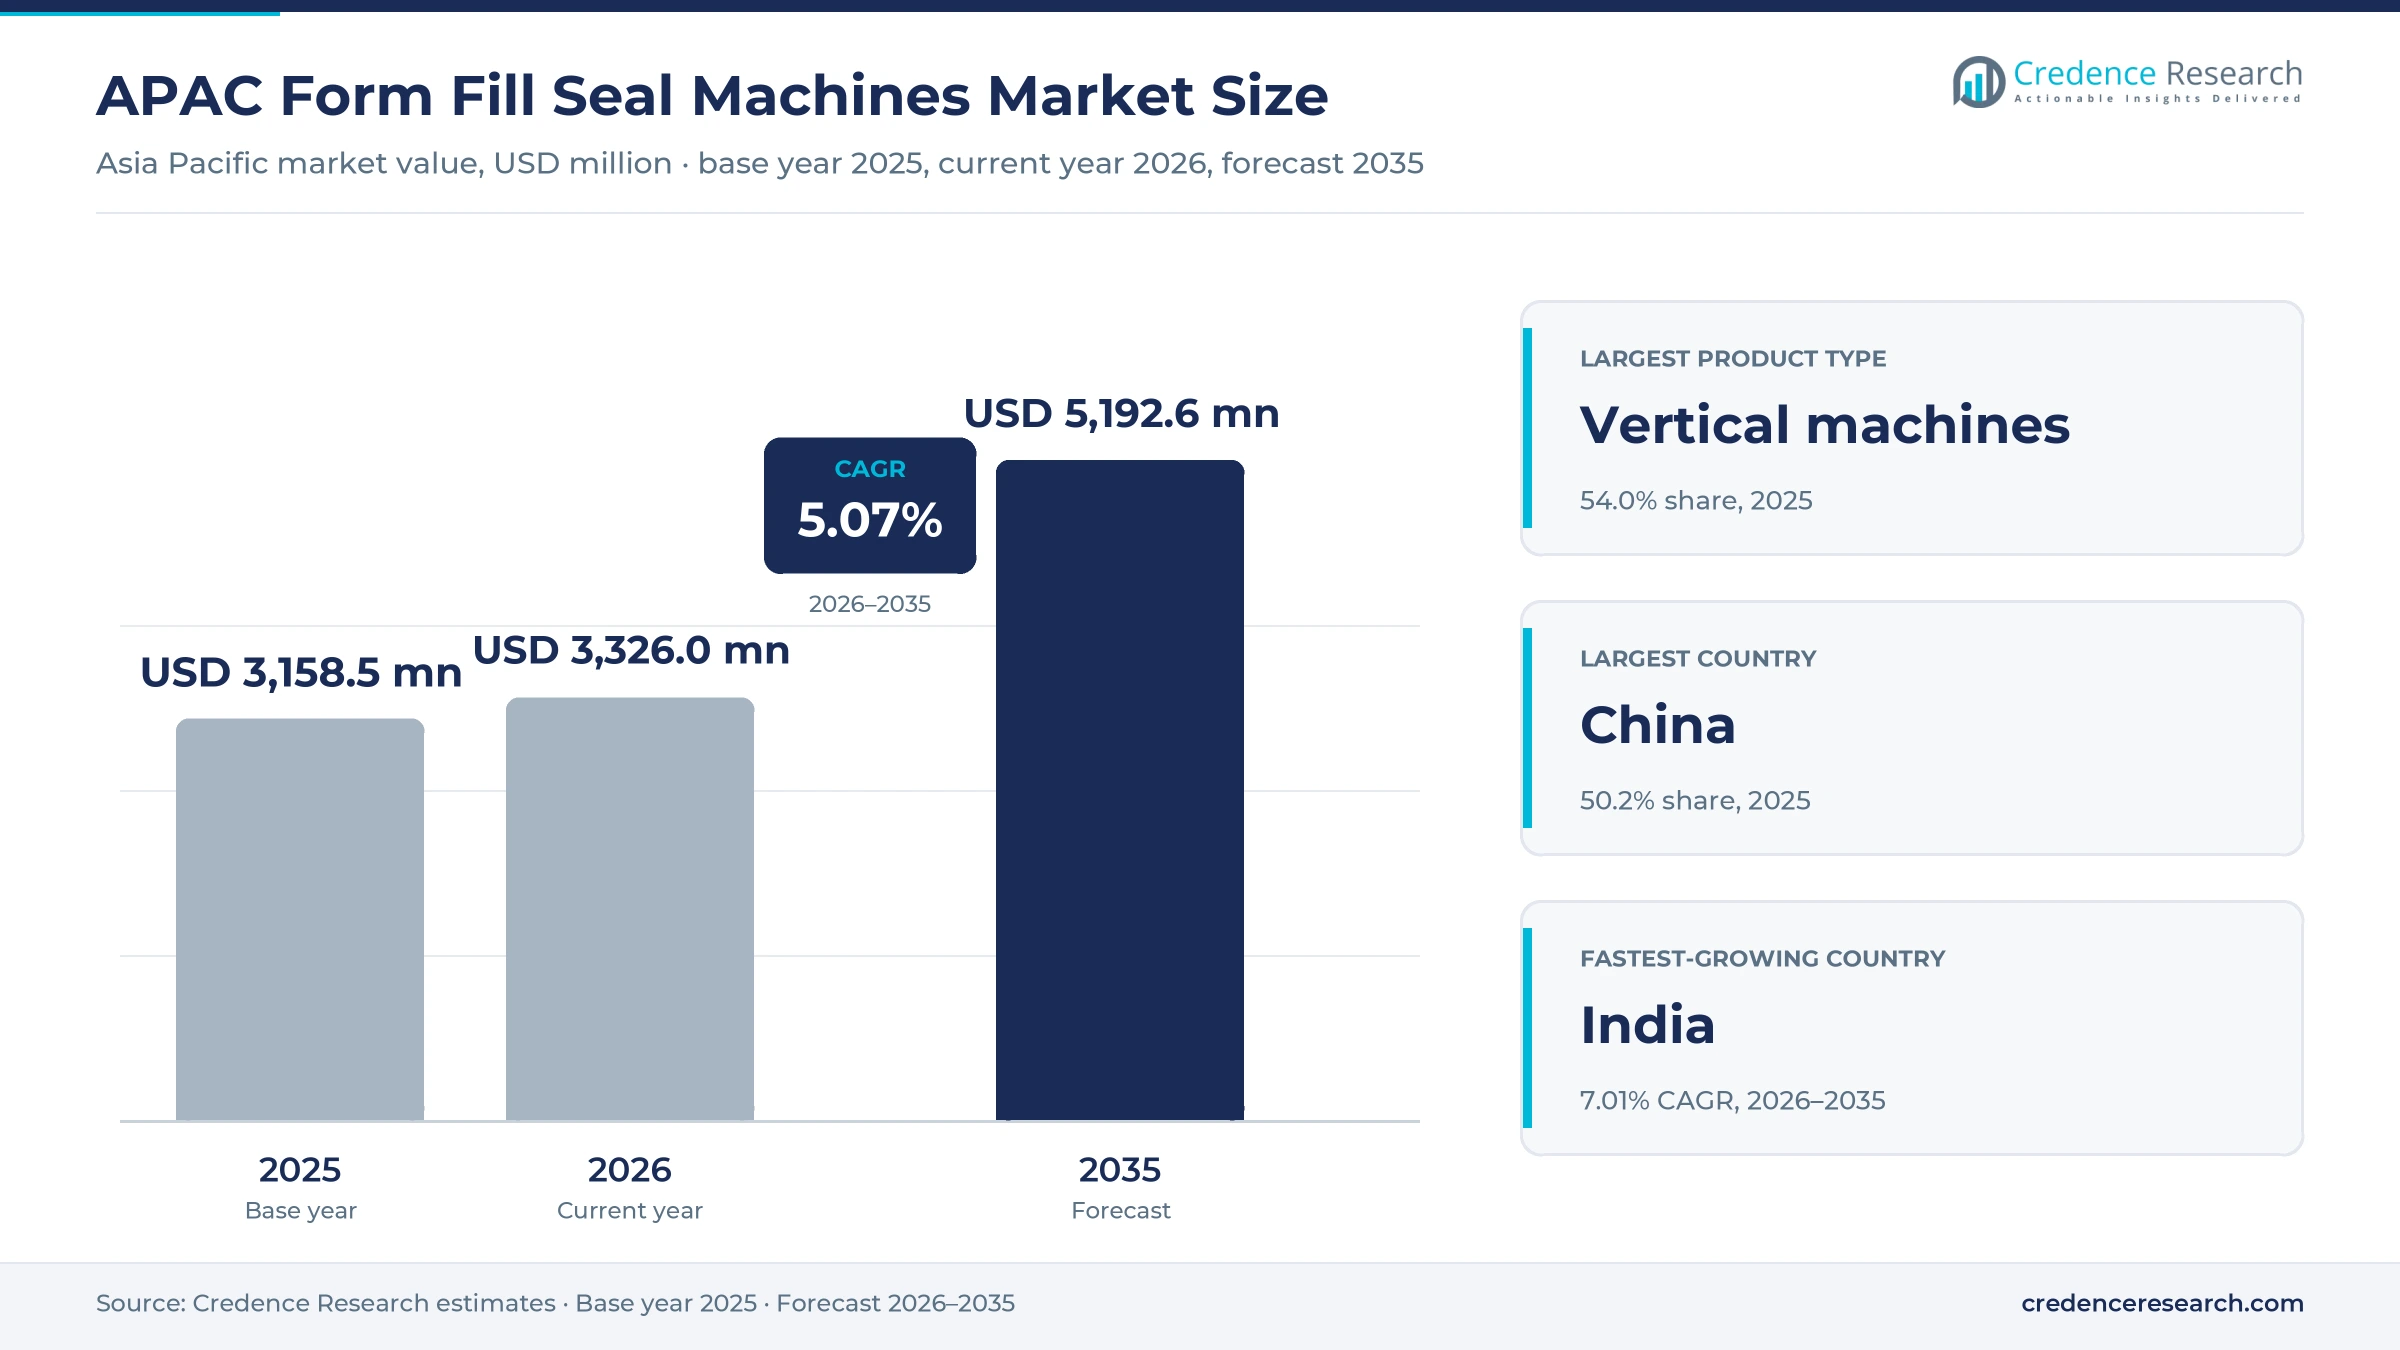
APAC Form Fill Seal Machines Market Insights
- The APAC form fill seal machines market was valued at USD 3.16 billion in 2025 and is projected to reach USD 5.19 billion by 2035, registering a CAGR of 5.07% during 2026–2035.
- China held a 50.2% share of 2025 value, because it has the region's largest food, daily chemical and pharmaceutical packing base.
- Vertical form fill seal machines led product demand with a 54.0% share of 2025 value, because snacks, staples and powders are bagged on vertical lines.
- India raised recycled-content targets for flexible plastic packaging to 20% after 2027, which requires machines that seal thinner recyclable films reliably.
- Duravant launched Duravant Thailand at ProPak Asia 2025 in Bangkok to give regional packers local technicians and spare parts.
Vertical baggers lead while rotary machines grow fastest
Why do vertical baggers lead product demand?
Based on product type, the market is categorized into vertical form fill seal, horizontal form fill seal and rotary form fill seal machines. Vertical Form Fill Seal machines led with 54.0% of 2025 value, because chips, rice, sugar, spices and detergent powders are bagged on vertical lines. Rotary Form Fill Seal machines grow fastest at 5.94% a year, as brand owners move to stand-up and zipper pouches for premium foods.
How does food processing shape end-use demand?
Based on end-use industry, the market is categorized into food and beverage, pharmaceuticals, personal care and cosmetics, agrochemicals and animal feed, and industrial consumables. Food and Beverage led with 58.0% of 2025 value, because snacks, dairy and staples need the most packing lines. Pharmaceuticals grow fastest at 5.83% a year, as unit-dose sachets and stick packs gain ground.
Why do powders and granules dominate applications?
Based on application, the market is categorized into powder and granule packing, liquid and paste packing, and discrete product wrapping. Powder and Granule Packing led with 52.0% of 2025 value, because flour, milk powder, spices, seeds and fertilizers are sold in bags and sachets. Liquid and Paste Packing grows fastest at 5.55% a year, as sauces, oral liquids and shampoos move into small pouches.
How fast are connected servo systems spreading?
Based on technology, the market is categorized into mechanical drive systems, servo systems without connectivity and connected servo systems. Servo Systems without Connectivity led with 46.0% of 2025 value, because most new lines already use servo film transport and jaws. Connected Servo Systems grow fastest at 7.51% a year, as multisite owners want remote monitoring, recipe control and data on downtime.
| Segment Group | Leading Sub-segment | Share, 2025 | Fastest-growing Sub-segment | CAGR, 2026–2035 |
|---|---|---|---|---|
| By Product Type | Vertical Form Fill Seal | 54.0% | Rotary Form Fill Seal | 5.94% |
| By End-Use Industry | Food and Beverage | 58.0% | Pharmaceuticals | 5.83% |
| By Application | Powder and Granule Packing | 52.0% | Liquid and Paste Packing | 5.55% |
| By Technology | Servo Systems without Connectivity | 46.0% | Connected Servo Systems | 7.51% |
Request a Free Sample
Fill in your details and we'll send you a free sample report.
- Sample data tables & charts
- Research methodology
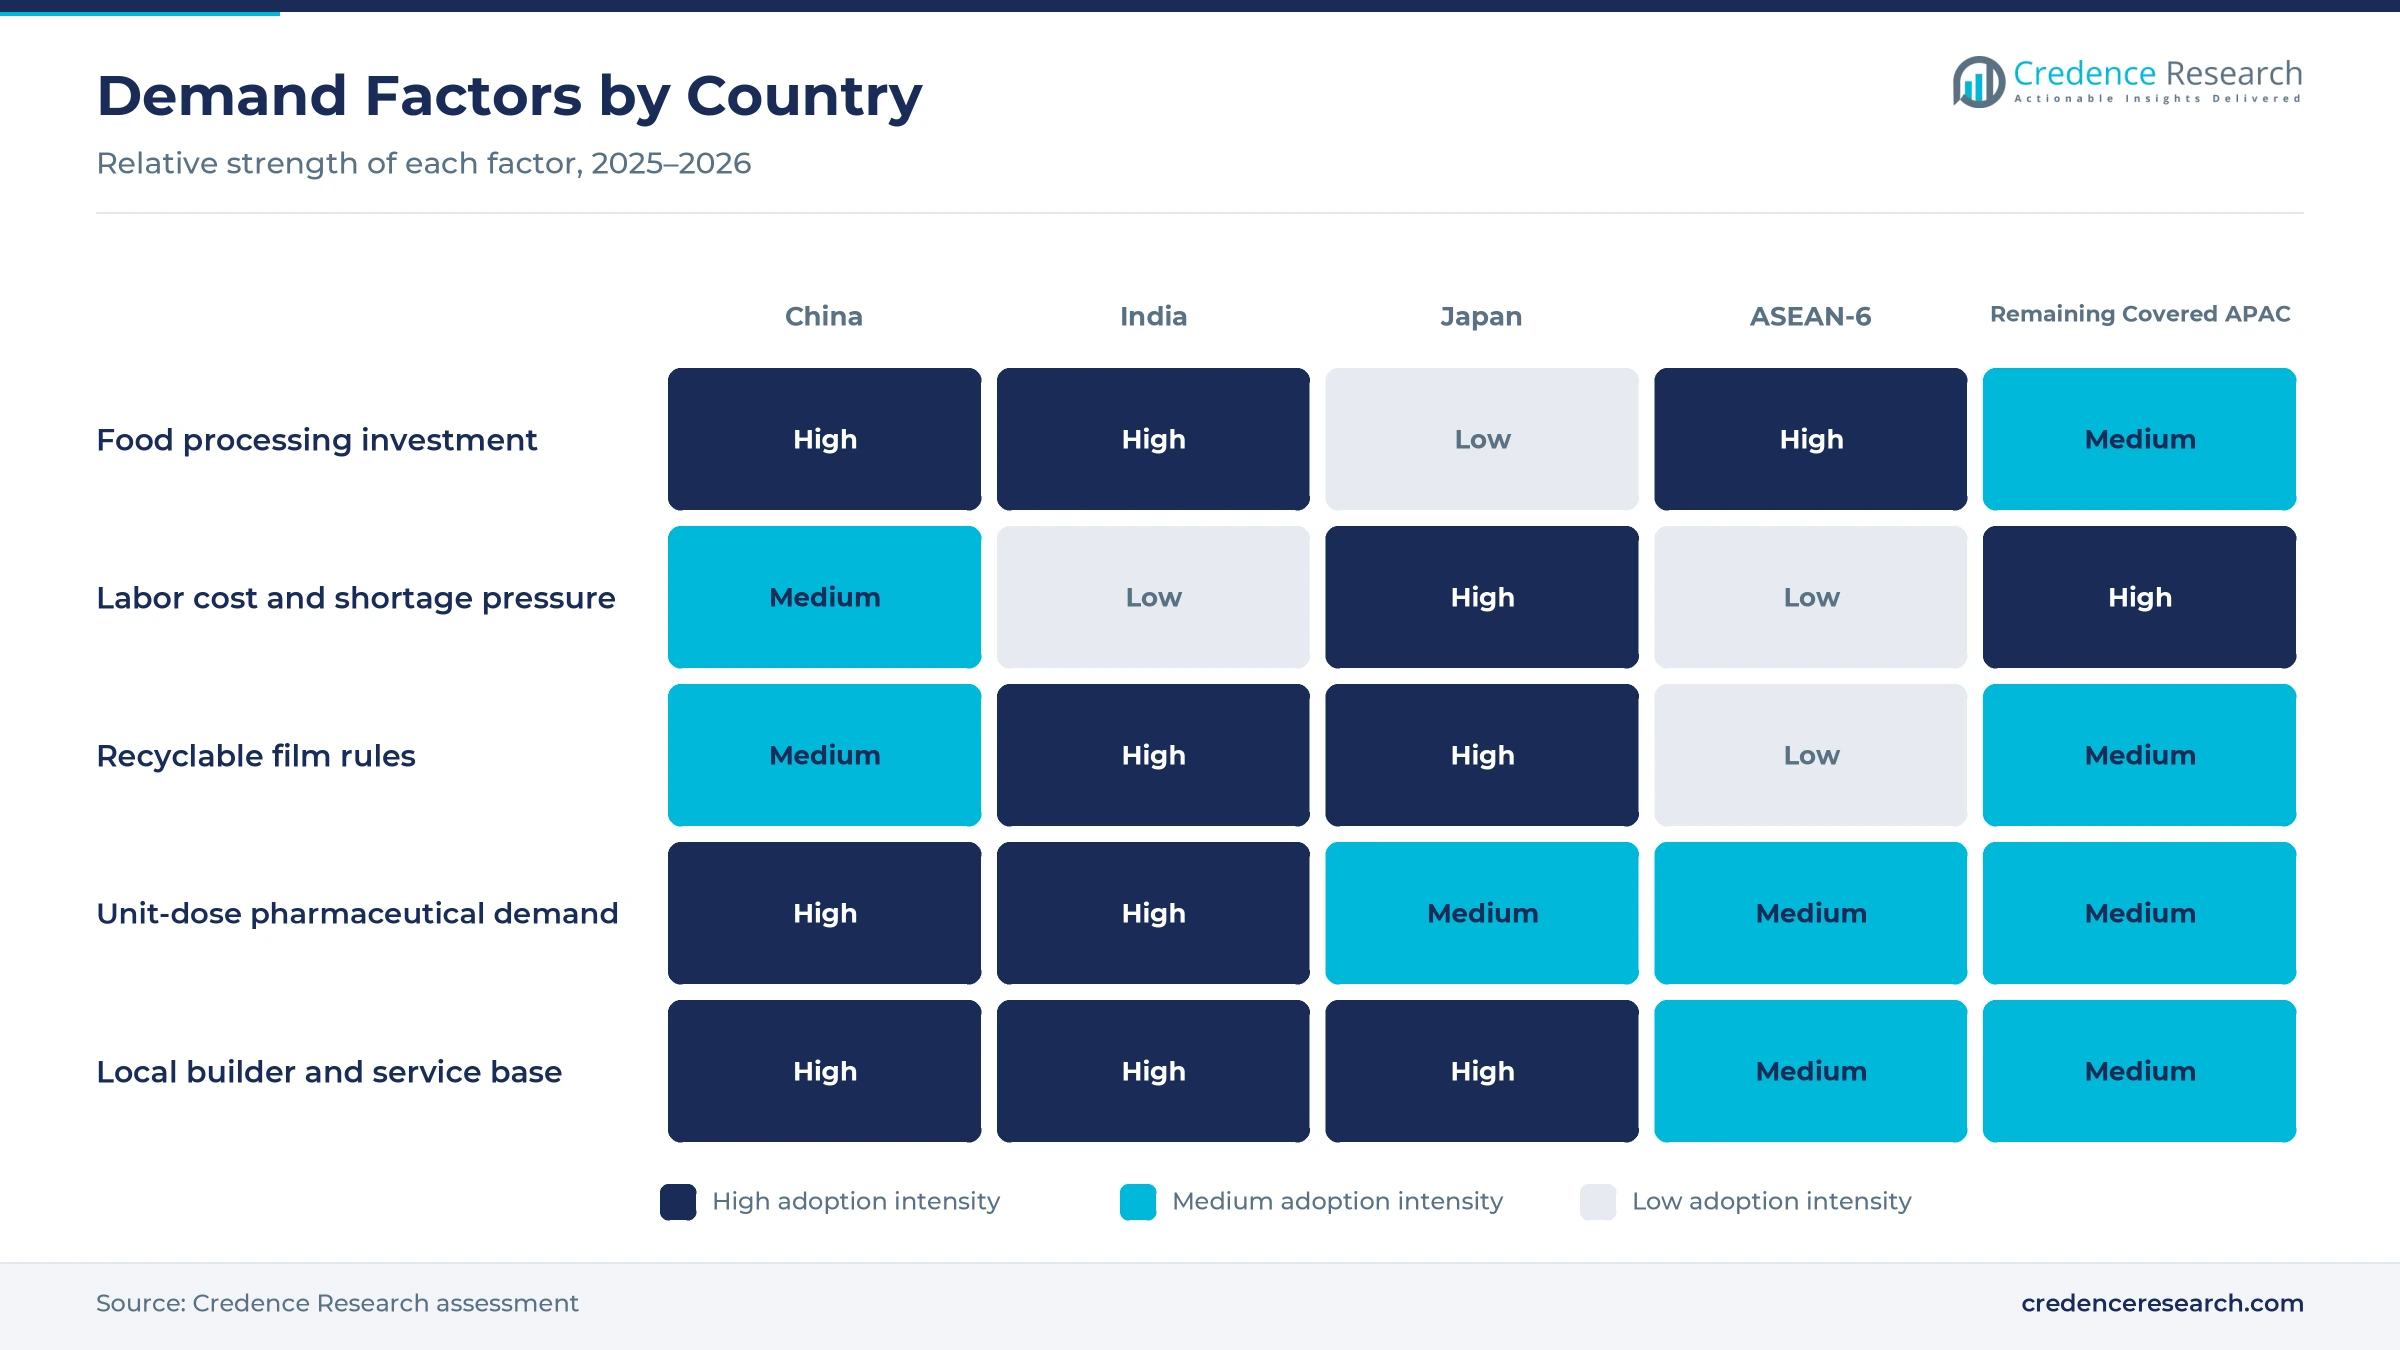
Food plants, labor gaps and film rules drive orders
Food processing capacity additions lift packing orders
New food processing capacity across the region creates direct demand for bagging and wrapping lines, because every new plant needs primary packing at the end of the line. India's production linked incentive scheme for food processing had 168 approved applicants with cumulative investment of about INR 9,207 crore and about 3.5 million metric tons a year of new processing and preservation capacity by Dec. 31, 2025, according to a ministerial reply reported by Outlook Business. In China, value added in processing of agricultural and sideline products rose 5.6% in 2025, according to the National Bureau of Statistics of China. Indonesia's food and beverage industry attracted IDR 22.63 trillion of investment in the first quarter of 2025, Vice Minister of Industry Faisol Riza said. As a result, food and beverage held 58.0% of 2025 value.
Labor shortages push packers toward faster servo lines
Tight labor markets push packers toward faster, more automated lines that need fewer operators on each shift. Japan's seasonally adjusted ratio of active job openings to applicants stood at 1.19 in December 2025, according to the Ministry of Health, Labour and Welfare, which means factories compete for scarce line staff. China produced about 773,000 industrial robots in 2025, up 28.0%, which shows how quickly regional plants are automating. Builders respond with faster machines, and Syntegon's SVL 2310 vertical bagger, shown at Anuga FoodTec India 2025, runs up to 110 bags of potato chips a minute, or 220 in its twin version, FoodTechBiz reported. Consequently, connected servo systems grow fastest among technologies at 7.51% a year.
Recyclable film rules require new sealing capability
The move from multilayer laminates to recyclable and mono-material films changes sealing windows, film handling and jaw design, which drives retrofits and replacement of older machines. India's amended Plastic Waste Management Rules set recycled content for flexible plastic packaging at 10% for 2025 to 2027 and 20% after that, while multilayer packaging rises from 5% to 10%, as reported by Packaging Insights. China's revised express delivery regulation, effective June 1, 2025, calls for greener, reduced and reusable packaging, according to China Daily. China also handled 174.5 billion express deliveries in 2024, up 21%, which multiplies the volume of flexible packaging that must change. Because of these rules, buyers prefer servo sealing that holds tight temperature and pressure tolerances on thinner films.
Unit-dose pharmaceutical packs widen sachet demand
Pharmaceutical and nutraceutical makers add sachet and stick pack lines, because unit-dose formats suit powders, granules and oral liquids. India's pharmaceutical exports exceeded USD 30 billion in fiscal 2024-25, up more than 9% from nearly USD 27.5 billion a year earlier, according to News on AIR. Mespack showed a pharmaceutical turnkey system at ProPak Asia 2025 in Bangkok with an MSPH vertical machine rated up to 840 stick packs a minute and a multilane system rated up to 2,400 sachets a minute, according to Packaging News. Nichrome India also launched its Wing 120 vertical machine for 5 to 10 gram stick sachets of tea and coffee premixes in April 2025. As a result, pharmaceuticals grow fastest among end uses at 5.83% a year.
Robotic line integration and local snack plants emerge
Shift toward robotic end-of-line integration
Builders now sell the form fill seal machine as the first step of an automated line rather than as a standalone unit. Coesia took a minority stake in robotic packaging maker PWR in July 2024, extending its portfolio to full lines built on robotics and vision systems, according to Packaging South Asia. TNA Solutions launched its ropac 5 vertical bagger with an integrated case packer system in October 2024, as reported by the same publisher. Syntegon's plant in Verna, Goa, also designs and builds vertical machines, horizontal wrappers and secondary packaging equipment under one roof. As a result, buyers increasingly order the bagger, end-of-line packaging machinery and line controls from one supplier.
Rise of decentralized snack plants in India
Indian snack makers are spreading production across more, smaller plants, which multiplies the number of packing lines each brand needs. TNA's India regional sales manager said snack makers build localized production and packaging sites roughly every 500 to 750 km to cut logistics costs, according to Packaging South Asia. Syntegon targeted mass-market potato chips and namkeens at Anuga FoodTec India 2025, which shows where volume is moving. Government support adds to this spread, because the Pradhan Mantri Kisan Sampada Yojana had 41 sanctioned mega food parks, 25 of them operational, and 302 operational cold chain projects by Jan. 31, 2026. Consequently, India remains the fastest-growing country in the regional market.
Opportunity in Southeast Asian food export processing
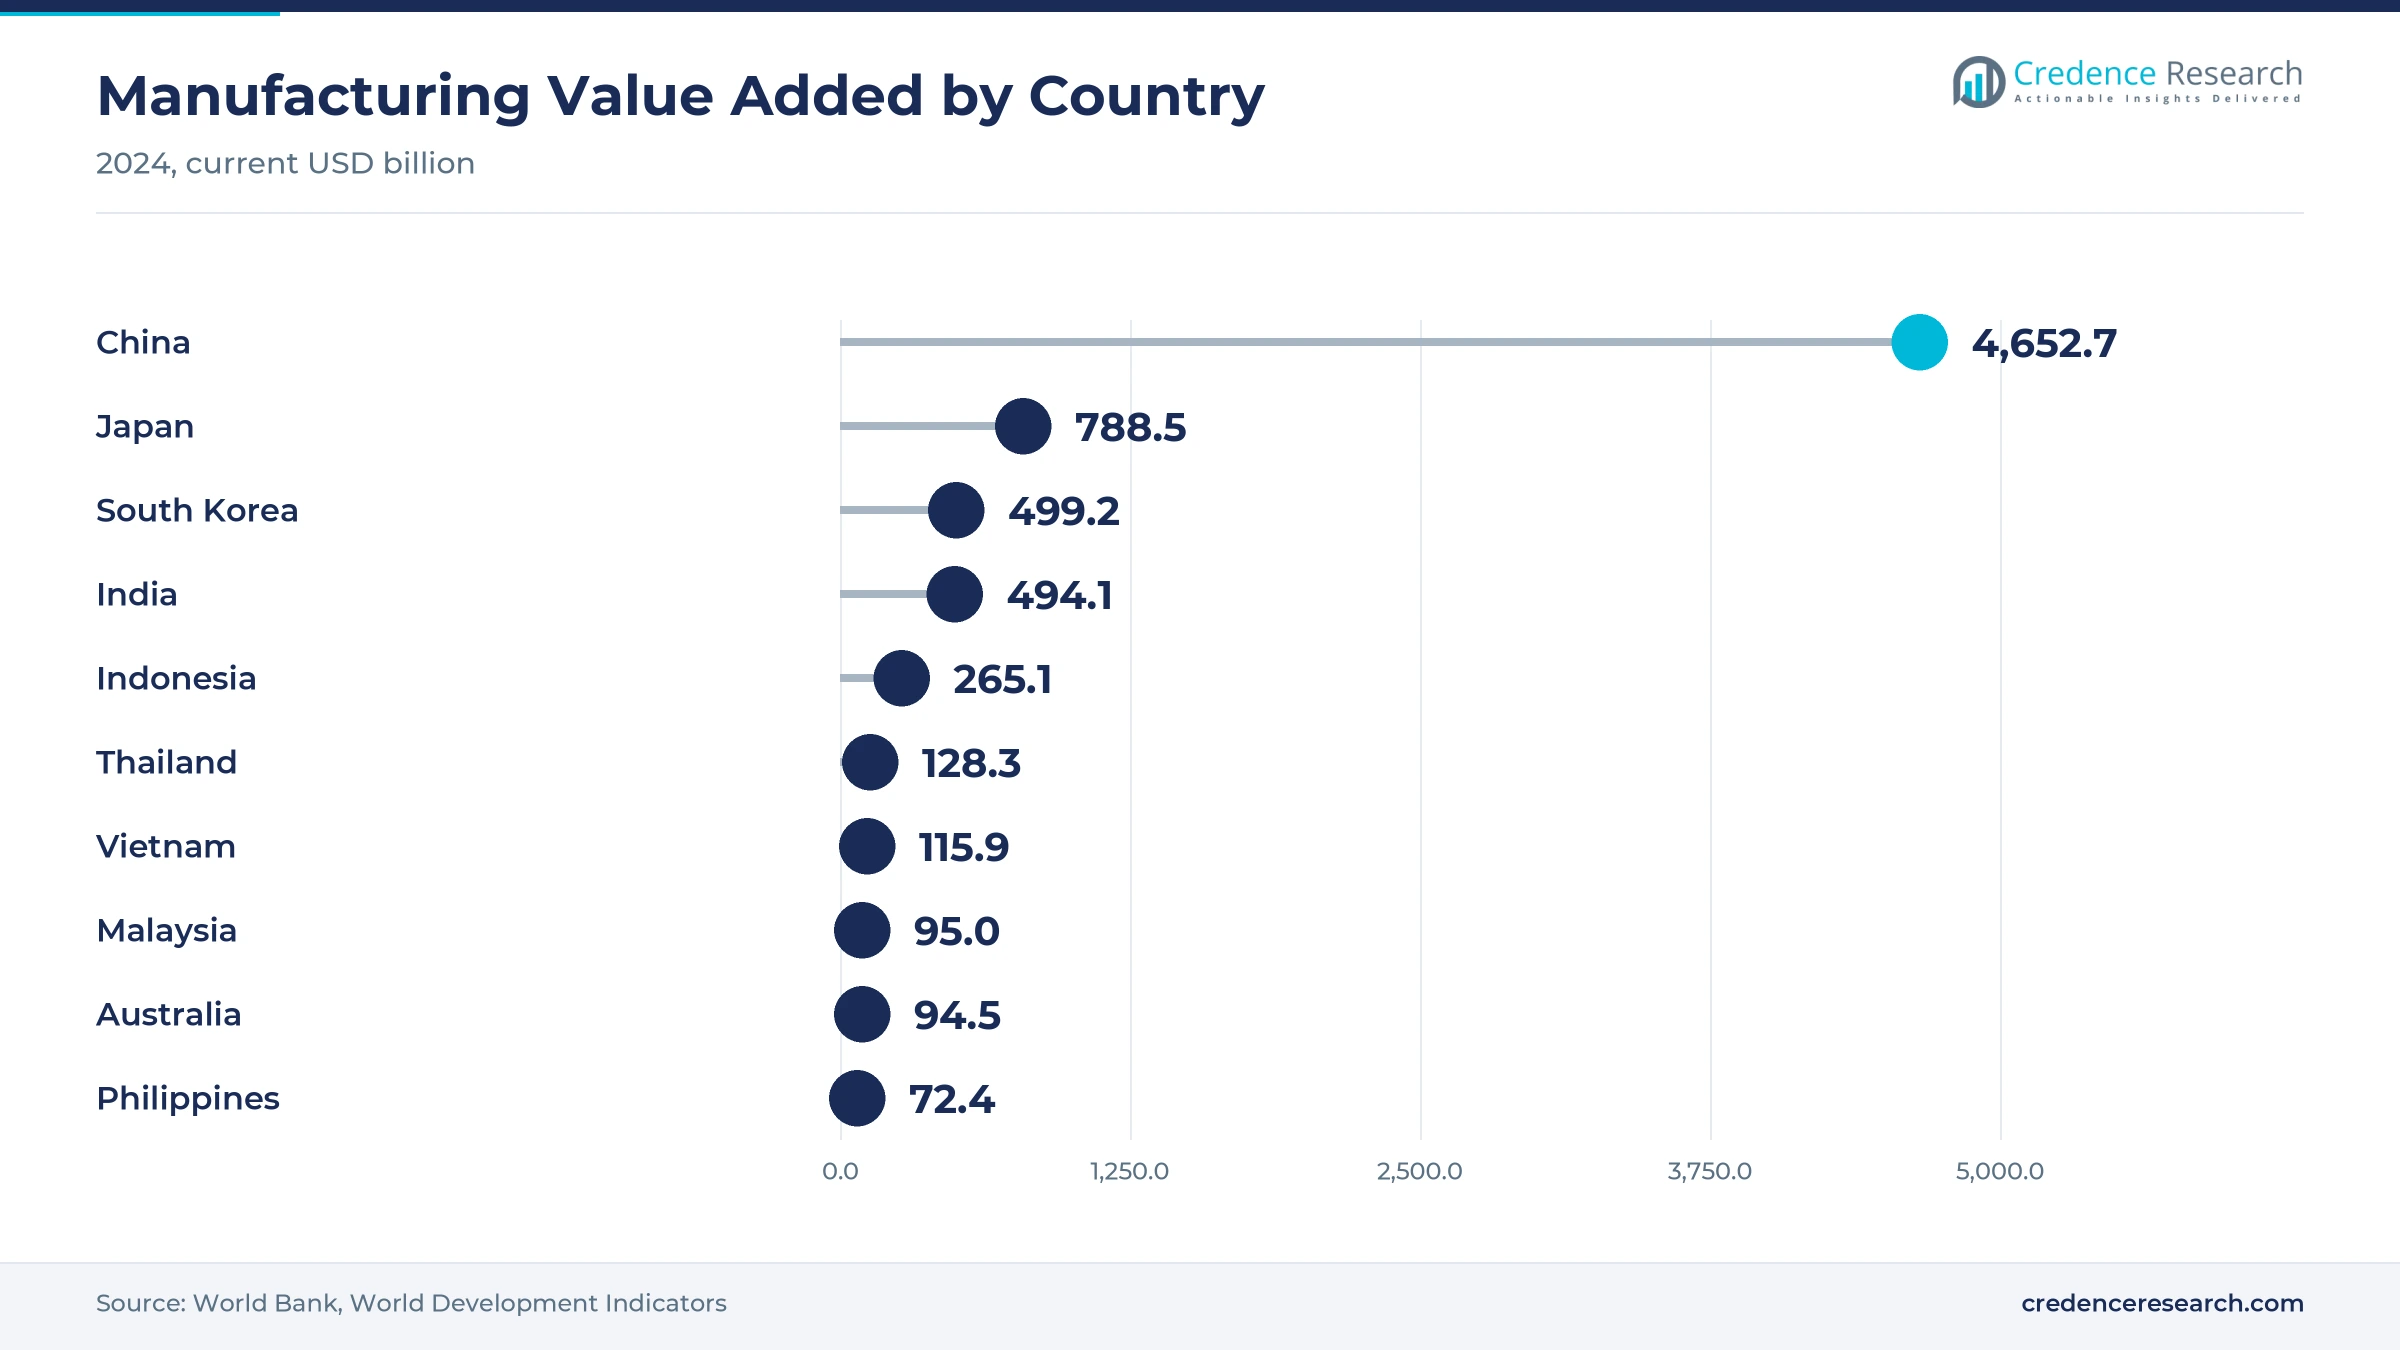
Food export processing in Southeast Asia offers an opening for suppliers that can deliver hygienic, high-speed packing lines with local support. Thailand's food exports reached a record 1.64 trillion baht in 2024, up 7.3%, and the food industry contributes 24.6% of the country's GDP, according to the ProPak Asia organizer. Food, beverages and tobacco made up about 33.7% of manufacturing value added in the Philippines and 28.6% in Indonesia in 2022, according to the World Bank. Duravant also launched Duravant Thailand in June 2025 to provide local technicians and spare parts. As a result, the ASEAN-6 countries grow at 6.41% a year.
Opening in local assembly and service networks
Local assembly and service give suppliers an opening to win mid-sized packers that cannot wait for parts from Europe. IMA-PG India announced a new manufacturing facility on a 2.5-hectare plot near Indore airport in April 2024, adding to its two sites in Mumbai and two in Indore. Coesia lists regional offices in Suzhou, China, Pune, India and Singapore, the last covering Southeast Asia, the Pacific, Japan and South Korea. Optima added 40 engineering specialists to its Pune site on April 1, 2025, according to Packaging South Asia. Because of this local footprint, authorized distributors and integrators can offer faster commissioning, which helps independent product manufacturers buy their first automatic lines.
Price rivalry, thin films and service gaps weigh on buyers
Price rivalry from domestic builders squeezes margins
Domestic builders in China and India sell basic vertical and horizontal machines at prices that imported lines struggle to match. As a result, global suppliers must justify higher prices through output per minute, film savings, uptime and hygiene. Smaller packers often choose the cheaper machine and accept lower speed, which limits the market for premium lines. Suppliers respond with local assembly, standardized models and service contracts that lower the total cost over the life of a machine.
Thin recyclable films narrow the sealing window
Mono-material polyethylene and thinner recyclable films seal within a narrower temperature range than older laminates, which raises the risk of leaks, wrinkles and rejected packs. Because of this, packers that switch films without upgrading jaws and controls face more downtime and waste. The problem is sharpest for older mechanical machines still running in smaller plants. Builders answer with servo-driven jaws, ultrasonic sealing and recipe control, although these upgrades add cost.
Capital costs delay automation at small packers
Many independent food and spice packers in India and Southeast Asia still pack by hand or on semi-automatic machines, because a full line with weigher, bagger and checkweigher is a large purchase. Consequently, uneven access to equipment finance delays upgrades even when labor costs rise. This affects the volume that builders can sell outside large brand owners. Suppliers reduce the barrier with entry-level models, leasing through distributors and modular lines that add units over time.
Skilled technicians and spare parts remain thin
Modern servo machines need trained operators and service technicians, and these skills are scarce outside major industrial clusters. Consequently, packers in smaller Indian cities and parts of Southeast Asia wait longer for commissioning, format changes and repairs, which lowers line uptime. Imported machines also face slower spare parts delivery than local builds. Builders respond with regional service hubs, remote diagnostics, operator training and distributors that hold common wear parts.
China leads while India grows fastest
| Country | Value, 2025 (USD billion) | Share, 2025 | CAGR, 2026–2035 |
|---|---|---|---|
| China | 1.59 | 50.2% | 4.81% |
| Remaining Covered APAC | 0.54 | 17.1% | 5.01% |
| Japan | 0.38 | 11.9% | 3.01% |
| ASEAN-6 | 0.34 | 10.7% | 6.41% |
| India | 0.32 | 10.1% | 7.01% |
China combines scale, online retail and local builders
China held 50.2% of 2025 value and grows at 4.81% a year, because it has the region's largest base of food, daily chemical and pharmaceutical packers. Retail sales of grain, oil and food by larger enterprises rose 9.3% in 2025, while online retail sales of physical goods reached 13,092.3 billion yuan, or 26.1% of total retail sales. Online grocery orders favor small, sealed packs, which keeps demand high for vertical and horizontal lines. Coesia also runs an office in Suzhou Industrial Park, which supports its packaging brands in the country.
Japan relies on precision and replacement demand
Japan held 11.9% of 2025 value and grows at 3.01% a year, the slowest pace in the region, because packers replace machines more than they add capacity. JAPAN PACK 2025 drew 572 exhibiting companies and organizations to Tokyo Big Sight from Oct. 7 to 10, 2025, according to Nippon Shokuryo Shimbun. Ishida supplies multihead weighers paired with baggers from its Shiga factory, which serves snack and fresh food packers across Japan. Food, beverages and tobacco made up about 12.2% of Japanese manufacturing value added in 2023, which supports steady demand for replacement lines.
ASEAN-6 countries gain export-oriented food lines
The ASEAN-6 countries held 10.7% of 2025 value and grow at 6.41% a year, as Thailand, Indonesia, Vietnam, Malaysia, the Philippines and Singapore expand packaged food output. ProPak Asia 2025 drew more than 2,000 exhibitors from 42 countries to BITEC in Bangkok from June 11 to 14, 2025, a sign of strong regional demand for packing equipment. Food, beverages and tobacco made up about 12.5% of Vietnam's manufacturing value added in 2023, while rising flexible pouch use across Southeast Asia keeps orders steady.
India adds snack, staple and pharmaceutical lines fastest
India held 10.1% of 2025 value and grows fastest at 7.01% a year, because food incentives, packaged snacks and pharmaceutical exports all require new packing lines. Domestic builders such as Pune-based Nichrome India supply vertical machines for packs from 5 grams to 250 grams of solid, powder, grain and liquid foods. Syntegon builds vertical machines in Goa, and IMA-PG India operates sites in Mumbai and Indore. Rising demand for food processing machinery in new plants also pulls packing lines along.
Remaining markets lean on high-value food and health packs
The remaining covered Asia Pacific markets held 17.1% of 2025 value and grow at 5.01% a year. South Korea, Australia, Taiwan and New Zealand lead this group, with South Korea's manufacturing value added at about USD 499.2 billion in 2024 and Australia's at about USD 94.5 billion. These markets buy fewer but more automated lines for dairy, meat, health supplements and personal care.
Regional launches, new sites and service hubs
| Development | Status and market relevance |
|---|---|
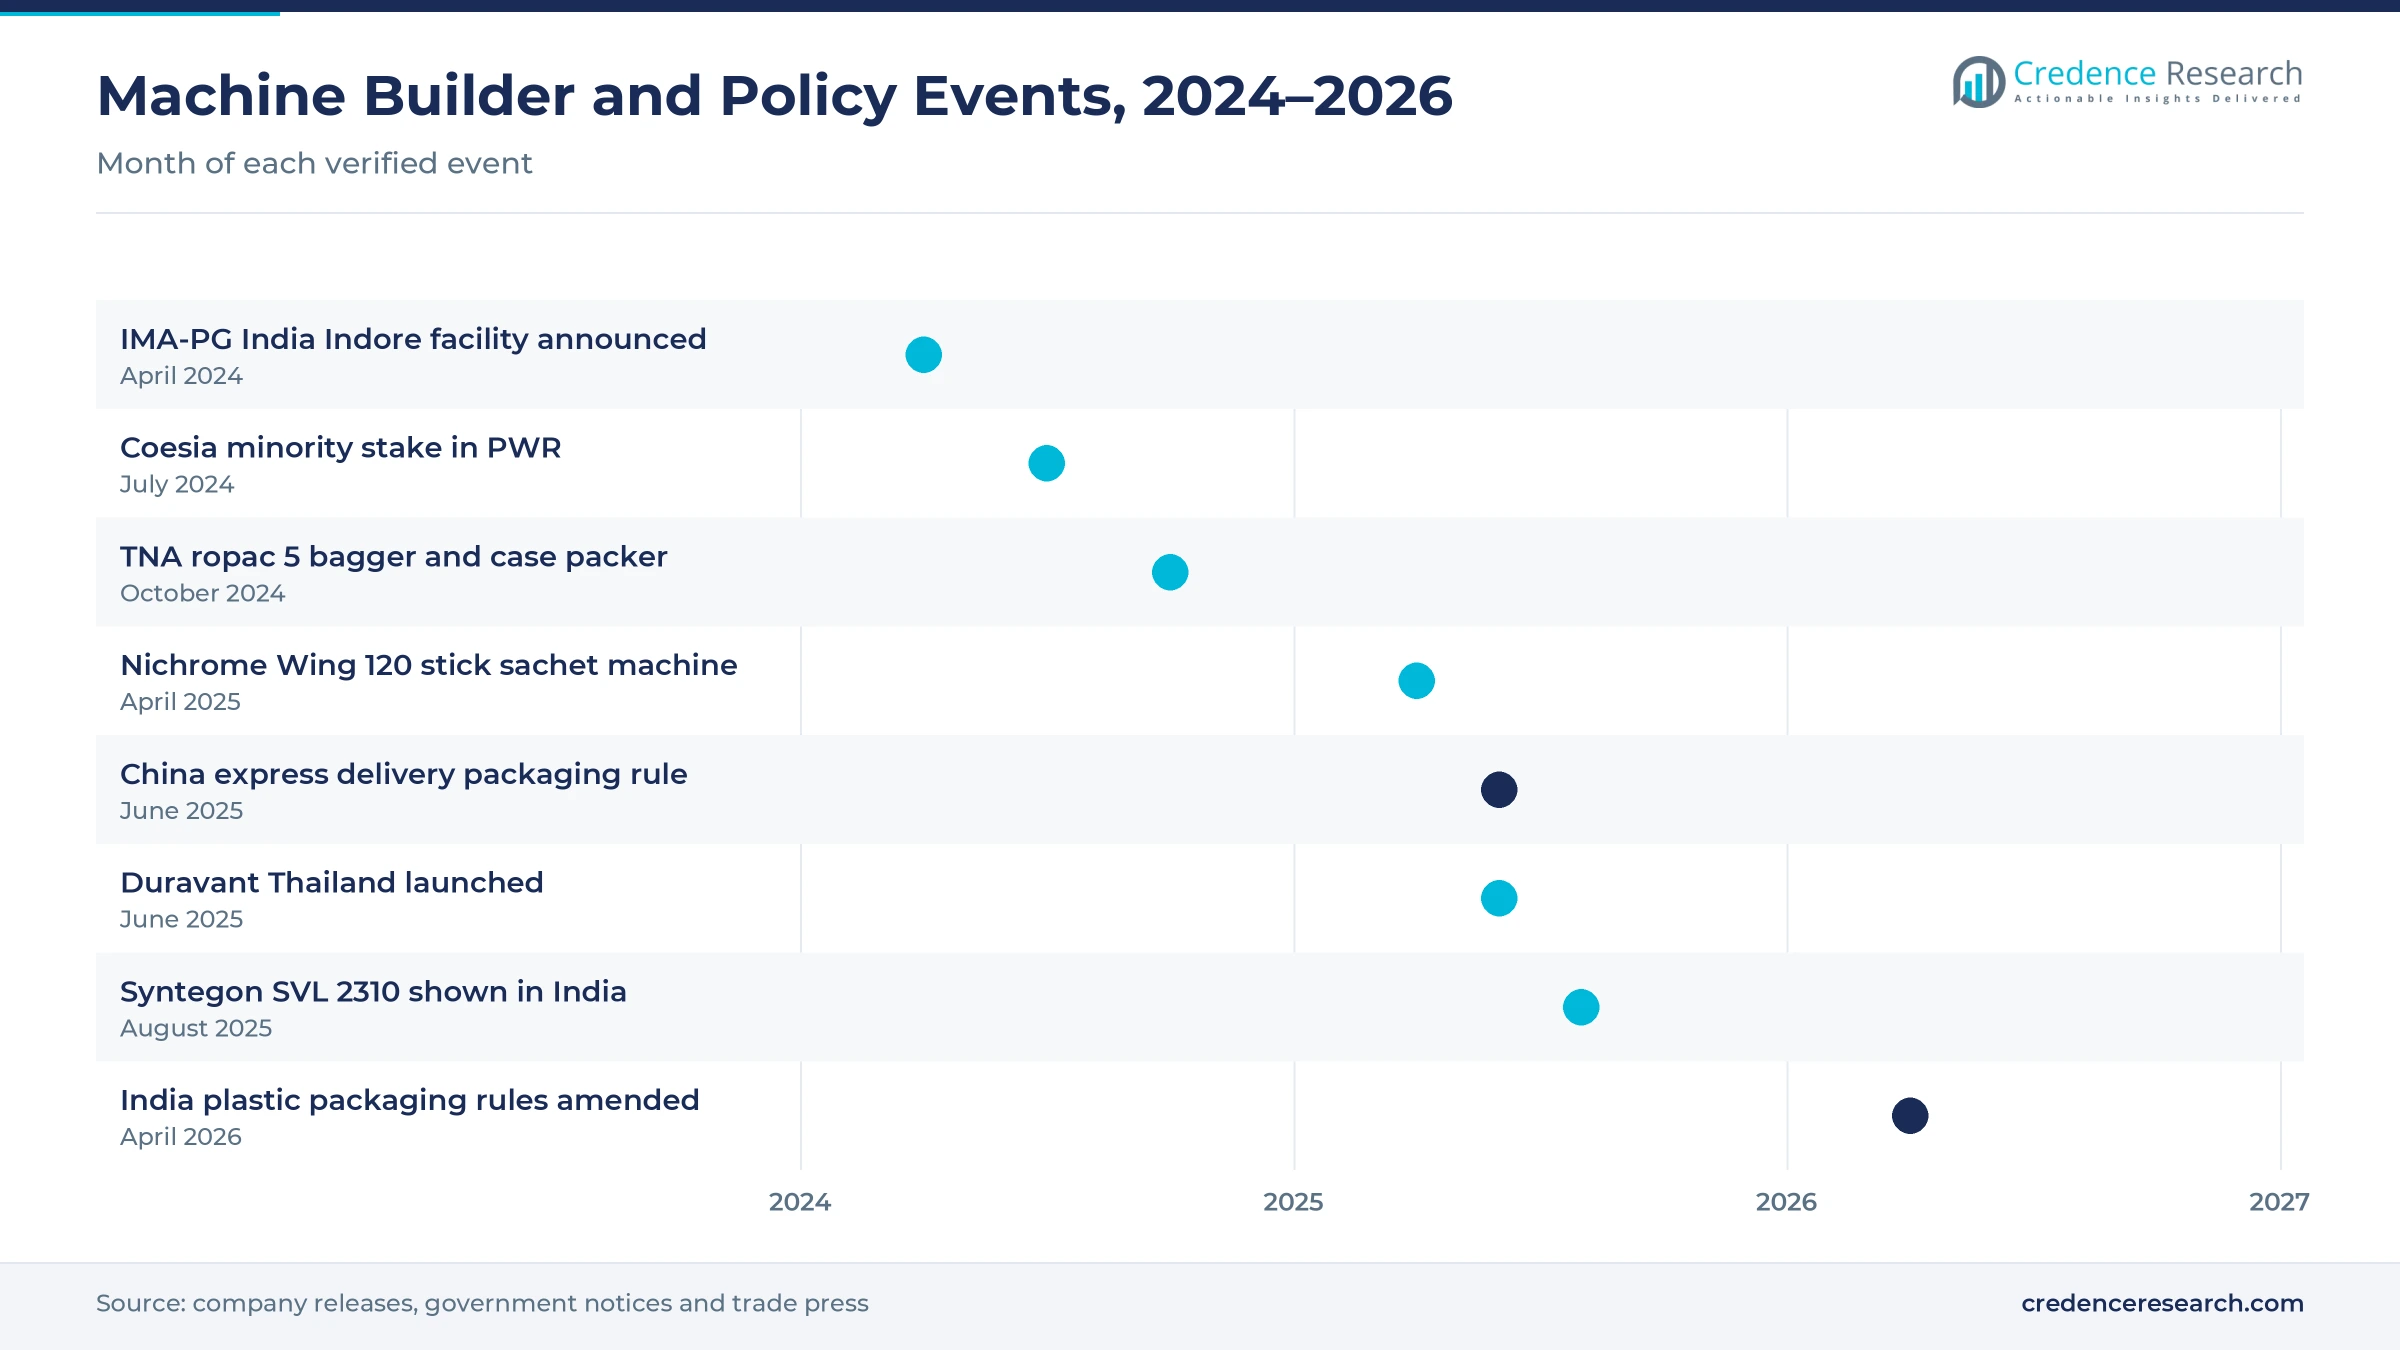
| In August 2025, Syntegon showed its SVL 2310 vertical bagger, rated up to 110 bags of chips a minute, at Anuga FoodTec India 2025. | Targets mass-market snack packers in India |
| In June 2025, Duravant launched Duravant Thailand at ProPak Asia 2025 in Bangkok, where Mespack showed pharmaceutical stick pack systems. | Adds local technicians and spare parts for Southeast Asia |
| In April 2025, Nichrome India launched the Wing 120 vertical machine for 5 to 10 gram stick sachets at Indusfood Manufacturing 2025. | Serves brands scaling up small-sachet production |
| In October 2024, TNA Solutions launched its ropac 5 vertical bagger and case packer system for snack and confectionery producers. | Links bagging and end-of-line packing in one system |
| In April 2024, IMA-PG India announced a new manufacturing facility on a 2.5-hectare plot near Indore. | Expands IMA local manufacturing in India |
Servo drives, weighers and sealing control shape choice
- Servo-driven film transport and jaws control pull length, sealing time and pressure precisely, which cuts film waste and supports thinner recyclable films.
- Multihead weighers combine partial weights from many buckets to reach target pack weight, which reduces product giveaway on snacks and frozen foods.
- Multilane stick pack heads fill several narrow sachets in parallel, which lifts output for pharmaceutical powders, coffee premixes and sugar.
- Connected machine controls report speed, stoppages and recipe changes to plant systems, which helps multisite owners compare lines and plan maintenance.
Need a Custom Version of This Report?
Tailor the scope, geography, or segments to your exact requirements.
- Custom geography or segment scope
- Direct access to our analyst team
Global builders and Indian specialists compete locally
Competition splits between global builders that sell high-speed, hygienic lines with integrated weighing and end-of-line equipment and regional builders that compete on price and fast service. Syntegon builds vertical machines and horizontal wrappers in Verna, Goa and targets snack and food packers in India. Ishida pairs its multihead weighers with baggers for snacks and fresh foods from its Japanese base. Coesia runs offices in Suzhou, Pune and Singapore and added robotic line capability through its PWR stake. IMA Group serves pharmaceutical and food packers in India through IMA-PG India sites in Mumbai and Indore. Duravant, through Mespack, supplies pouch, stick pack and sachet systems and now supports customers from Thailand. TNA Solutions sells complete snack lines, while Nichrome India serves domestic brands with vertical and filling systems. Buyers weigh price against speed, film savings, uptime and local service reach.
Companies profiled and their roles in this market
| Company | Type | Role in the market |
|---|---|---|
| Coesia Group | Global packaging group | Offices in Suzhou, Pune and Singapore, robotic line stake in PWR |
| IMA Group | Global packaging group | IMA-PG India sites in Mumbai and Indore, new Indore facility |
| Syntegon | Global line builder | Vertical machines and horizontal wrappers built in Verna, Goa |
| Ishida | Weighing and bagging specialist | Multihead weighers and baggers from its Shiga factory in Japan |
| Duravant (Mespack) | Pouch and sachet specialist | Stick pack and multilane systems, Duravant Thailand launched 2025 |
| TNA Solutions | Snack line supplier | ropac 5 vertical bagger with case packer, India growth focus |
| Nichrome India | Domestic builder | Vertical machines for packs from 5 to 250 grams, based in Pune |
Credence Research view on regional packing demand
Credence Research's view is that regional form fill seal demand is moving from simple capacity additions toward faster, connected lines that run recyclable films. China will stay the largest buyer, but India offers the strongest growth, because food processing incentives, snack plant expansion and pharmaceutical exports arrive at the same time. Suppliers that combine servo sealing, integrated weighing and local service should gain share, while builders that compete only on price risk losing multisite brand owners and contract packers that value uptime. Powder and granule packing should keep its 52.0% share lead in the regional market, because staples, spices and milk powder remain the largest packed volumes.
How the regional machine estimate was built
The report uses 2025 as the base year and forecasts values to 2035 in USD million from the Credence Research market model. Country, product, end-use, application and technology splits are Credence Research estimates based on manufacturing and food processing statistics, labor market data, trade show programs, company announcements and government rules. Sources include the National Bureau of Statistics of China, the World Bank, the Ministry of Health, Labour and Welfare of Japan, Indian government replies and company news. No interviews or surveys were conducted for this edition of the regional report.
Food capacity and recyclable films carry growth to 2035
The APAC form fill seal machines market is projected to grow from USD 3.33 billion in 2026 to USD 5.19 billion by 2035, a 5.07% CAGR during 2026–2035, as new food plants, labor shortages and recyclable films keep packers investing. Growth should be steady through 2030 while India phases in higher recycled-content targets and new snack plants open. After that, replacement of older mechanical machines in China and Japan should add volume. Faster film rules or stronger food investment would raise this outlook, while weak consumer spending or deep price cuts would lower it.
Frequently Asked Questions
How big is the APAC form fill seal machines market?
Which product type leads regional demand?
Which country leads the regional market?
How do plastic packaging rules affect machine demand?
Why does automation matter for packers in the region?
Which end-use industry leads the market?
Who are the leading companies in the region?
What are the main challenges for suppliers?
Table of Content
Chapter 1 Market Segmentation
- 1.1 Segmentation Framework
- 1.1.1 Product and Service Classification
- 1.1.2 Application and End-Use Classification
- 1.1.3 Technology and Solution Classification
- 1.1.4 Customer and Distribution Channel Classification
- 1.1.5 Geographic Segmentation
- 1.1.6 Market Segment Definitions and Boundaries
- 1.2 By Product Type
- 1.2.1 Vertical Form Fill Seal
- 1.2.2 Horizontal Form Fill Seal
- 1.2.3 Rotary Form Fill Seal
- 1.3 By End-Use Industry
- 1.3.1 Food and Beverage
- 1.3.2 Pharmaceuticals
- 1.3.3 Personal Care and Cosmetics
- 1.3.4 Agrochemicals and Animal Feed
- 1.3.5 Industrial Consumables
- 1.4 By Application
- 1.4.1 Powder and Granule Packing
- 1.4.2 Liquid and Paste Packing
- 1.4.3 Discrete Product Wrapping
- 1.5 By Technology
- 1.5.1 Mechanical Drive Systems
- 1.5.2 Servo Systems without Connectivity
- 1.5.3 Connected Servo Systems
- 1.6 By Country
- 1.6.1 China
- 1.6.2 India
- 1.6.3 Japan
- 1.6.4 ASEAN-6
- 1.6.5 Remaining Covered APAC
Chapter 2 Introduction
- 2.1 Report Objectives and Scope
- 2.2 Product Definition and Industry Terminology
- 2.3 Market Inclusions and Exclusions
- 2.4 Research Process
- 2.4.1 Primary Research and Expert Interviews
- 2.4.2 Secondary Research and Source Review
- 2.4.3 Top-Down and Bottom-Up Estimation
- 2.4.4 Data Triangulation and Verification
- 2.5 Market Size Measurement Basis
- 2.5.1 2025: USD 3.16 billion → 2035: USD 5.19 billion
- 2.6 Historical and Forecast Reference Periods
- 2.6.1 Historical Period: 2018-2025
- 2.6.2 Base Year: 2025
- 2.6.3 Forecast Period: 2025-2035
- 2.7 Research Assumptions and Limitations
Chapter 3 Executive Summary
- 3.1 Market Snapshot and Key Findings
- 3.2 Base-Year Market Size, 2025
- 3.3 Forecast Market Size, 2035
- 3.4 Revenue and Volume Growth Outlook
- 3.5 Key Demand and Supply Indicators
- 3.6 Leading Market Segments
- 3.7 Fastest-Growing Market Opportunities
- 3.8 Regional Performance Highlights
- 3.9 Technology and Industry Transformation
- 3.10 Competitive Landscape Summary
- 3.11 Analyst View and Strategic Implications
Chapter 4 APAC Form Fill Seal Machines Market Trends and Developments
- 4.1 Historical Industry Development, 2018-2025
- 4.2 Recent Market Trends and Developments
- 4.3 Demand and Customer Behavior Trends
- 4.4 Technology and Product Innovation
- 4.5 Artificial Intelligence, Automation and Digitalization
- 4.6 Local Manufacturing and Supply Chain Realignment
- 4.7 Industry Partnerships, Mergers and Acquisitions
- 4.8 Sustainability and Circular Economy Developments
- 4.9 Government and Private Sector Investment Trends
- 4.10 Emerging Business Models and Commercialization
- 4.11 Industry Developments and Announcements
Chapter 5 APAC Form Fill Seal Machines Market Production, Supply and Demand Analysis
- 5.1 Demand Trend and Consumption Analysis, 2018-2025
- 5.2 Demand Forecast, 2025-2035
- 5.3 Production and Output Trend, 2018-2025
- 5.4 Production and Output Forecast, 2025-2035
- 5.5 Installed Capacity and Capacity Utilization
- 5.6 Company-Wise Production Plants and Statistics
- 5.6.1 Installed Production Capacity
- 5.6.2 Actual Production
- 5.6.3 Planned Capacity and Expansion Targets
- 5.7 Supply Chain Structure and Procurement Trends
- 5.8 Supply-Demand Gap and Bottlenecks
- 5.9 Import Dependence and Sourcing Structure
- 5.10 Contract Manufacturing and Outsourcing
- 5.11 Regional Supply and Demand Concentration
Chapter 6 APAC Form Fill Seal Machines Market Pricing Analysis
- 6.1 Pricing Structure and Measurement
- 6.2 Historical Pricing Trends, 2018-2025
- 6.3 Pricing Outlook, 2025-2035
- 6.4 Average Selling Price and Unit Economics
- 6.5 Pricing by Product and Market Segment
- 6.6 Geographic Pricing Differences
- 6.7 Key Input, Energy, Labor and Logistics Costs
- 6.8 Contract Pricing and Purchasing Models
- 6.9 Pricing Sensitivity and Competitive Positioning
- 6.10 Price, Margin and Profitability Implications
Chapter 7 APAC Form Fill Seal Machines Market Dynamics
- 7.1 Market Growth Drivers
- 7.1.1 Demand-Side Drivers
- 7.1.2 Technology and Innovation Drivers
- 7.1.3 Infrastructure and Investment Drivers
- 7.1.4 Regulatory and Policy Drivers
- 7.2 Market Restraints
- 7.2.1 Cost and Affordability Constraints
- 7.2.2 Technology and Adoption Barriers
- 7.2.3 Supply Chain and Operational Constraints
- 7.3 Market Challenges
- 7.3.1 Competitive Pressure and Margin Erosion
- 7.3.2 Skills, Infrastructure and Implementation Gaps
- 7.4 Emerging Market Opportunities
- 7.5 Market Dynamics Impact and Time-Horizon Assessment
Chapter 8 APAC Form Fill Seal Machines Value Chain Analysis
- 8.1 Industry Value Chain Overview
- 8.2 Upstream Suppliers and Critical Inputs
- 8.3 Technology and Component Providers
- 8.4 Manufacturing or Service Delivery
- 8.5 Distribution, Channel Partners and Integrators
- 8.6 Downstream Applications and End Users
- 8.7 Value Addition and Profit Pools
- 8.8 Vertical Integration and Outsourcing
- 8.9 Supplier Concentration and Risk
- 8.10 Supply Chain Localization and Resilience
Chapter 9 APAC Form Fill Seal Machines Market Regulations and Policies
- 9.1 Relevant Laws, Standards and Compliance Frameworks
- 9.2 Product, Service, Safety and Quality Requirements
- 9.3 Government Policies, Incentives and Subsidies
- 9.4 Imports, Exports and Trade Barriers
- 9.5 Public Procurement and Local Content Requirements
- 9.6 Environmental and Sustainability Compliance
- 9.7 Upcoming Policy Changes and Market Implications
Chapter 10 APAC Form Fill Seal Machines Market Hotspots and Opportunities
- 10.1 Market Opportunity Mapping and Growth Hotspots
- 10.2 High-Growth Applications and Customer Groups
- 10.3 Underserved Markets and White-Space Opportunities
- 10.4 Emerging Technology and Product Opportunities
- 10.5 New Capacity and Investment Hotspots
- 10.6 Market Entry and Expansion Opportunities
- 10.7 Distribution and Partnership Opportunities
- 10.8 Near-Term and Long-Term Commercial Potential
- 10.9 Opportunity Attractiveness and Execution Risks
Chapter 11 APAC Form Fill Seal Machines Market Outlook, 2025-2035
- 11.1 Market Size and Analysis
- 11.1.1 Revenue (Market Measurement: 2025: USD 3.16 billion → 2035: USD 5.19 billion)
- 11.1.2 Market Volume and Quantity Sold
- 11.1.3 Historical Market Size, 2018-2025
- 11.1.4 Base-Year Market Size, 2025
- 11.2 Market Forecast, 2025-2035
- 11.2.1 Revenue Forecast to 2035
- 11.2.2 Volume Forecast to 2035
- 11.2.3 CAGR and Year-on-Year Growth
- 11.2.4 Incremental Revenue Opportunity
- 11.3 Forecast Assumptions and Scenario Analysis
- 11.3.1 Base-Case Forecast
- 11.3.2 Optimistic and Conservative Scenarios
- 11.3.3 Technology, Pricing and Policy Sensitivities
- 11.4 Market Attractiveness and Growth Outlook
Chapter 12 APAC Form Fill Seal Machines Market Segmentation and Outlook
- 12.1 Segmentation Summary and Market Shares, 2025
- 12.2 Largest and Fastest-Growing Segments
- 12.3 By Product Type - Market Size and Forecast, 2025-2035
- 12.3.1 Segment Definition and Scope
- 12.3.2 Historical Market Size, 2018-2025
- 12.3.3 Revenue Forecast, 2025-2035
- 12.3.4 Volume Forecast, 2025-2035
- 12.3.5 Base-Year Market Share, 2025
- 12.3.6 Segment CAGR and Growth Drivers
- 12.3.7 Subsegment Market Size and Forecast
- 12.3.7.1 Vertical Form Fill Seal
- 12.3.7.2 Horizontal Form Fill Seal
- 12.3.7.3 Rotary Form Fill Seal
- 12.3.8 Subsegment Pricing and Adoption Trends
- 12.3.9 Leading Suppliers and Competition
- 12.3.10 Regional Demand and Opportunities
- 12.4 By End-Use Industry - Market Size and Forecast, 2025-2035
- 12.4.1 Segment Definition and Scope
- 12.4.2 Historical Market Size, 2018-2025
- 12.4.3 Revenue Forecast, 2025-2035
- 12.4.4 Volume Forecast, 2025-2035
- 12.4.5 Base-Year Market Share, 2025
- 12.4.6 Segment CAGR and Growth Drivers
- 12.4.7 Subsegment Market Size and Forecast
- 12.4.7.1 Food and Beverage
- 12.4.7.2 Pharmaceuticals
- 12.4.7.3 Personal Care and Cosmetics
- 12.4.7.4 Agrochemicals and Animal Feed
- 12.4.7.5 Industrial Consumables
- 12.4.8 Subsegment Pricing and Adoption Trends
- 12.4.9 Leading Suppliers and Competition
- 12.4.10 Regional Demand and Opportunities
- 12.5 By Application - Market Size and Forecast, 2025-2035
- 12.5.1 Segment Definition and Scope
- 12.5.2 Historical Market Size, 2018-2025
- 12.5.3 Revenue Forecast, 2025-2035
- 12.5.4 Volume Forecast, 2025-2035
- 12.5.5 Base-Year Market Share, 2025
- 12.5.6 Segment CAGR and Growth Drivers
- 12.5.7 Subsegment Market Size and Forecast
- 12.5.7.1 Powder and Granule Packing
- 12.5.7.2 Liquid and Paste Packing
- 12.5.7.3 Discrete Product Wrapping
- 12.5.8 Subsegment Pricing and Adoption Trends
- 12.5.9 Leading Suppliers and Competition
- 12.5.10 Regional Demand and Opportunities
- 12.6 By Technology - Market Size and Forecast, 2025-2035
- 12.6.1 Segment Definition and Scope
- 12.6.2 Historical Market Size, 2018-2025
- 12.6.3 Revenue Forecast, 2025-2035
- 12.6.4 Volume Forecast, 2025-2035
- 12.6.5 Base-Year Market Share, 2025
- 12.6.6 Segment CAGR and Growth Drivers
- 12.6.7 Subsegment Market Size and Forecast
- 12.6.7.1 Mechanical Drive Systems
- 12.6.7.2 Servo Systems without Connectivity
- 12.6.7.3 Connected Servo Systems
- 12.6.8 Subsegment Pricing and Adoption Trends
- 12.6.9 Leading Suppliers and Competition
- 12.6.10 Regional Demand and Opportunities
- 12.7 By Country - Market Size and Forecast, 2025-2035
- 12.7.1 Segment Definition and Scope
- 12.7.2 Historical Market Size, 2018-2025
- 12.7.3 Revenue Forecast, 2025-2035
- 12.7.4 Volume Forecast, 2025-2035
- 12.7.5 Base-Year Market Share, 2025
- 12.7.6 Segment CAGR and Growth Drivers
- 12.7.7 Subsegment Market Size and Forecast
- 12.7.7.1 China
- 12.7.7.2 India
- 12.7.7.3 Japan
- 12.7.7.4 ASEAN-6
- 12.7.7.5 Remaining Covered APAC
- 12.7.8 Subsegment Pricing and Adoption Trends
- 12.7.9 Leading Suppliers and Competition
- 12.7.10 Regional Demand and Opportunities
- 12.8 Segment Growth Comparison
- 12.9 Segment Attractiveness and Priority Matrix
Chapter 13 APAC Form Fill Seal Machines End-Use and Application Market Outlook
- 13.1 End-Use Industry and Customer Demand Structure
- 13.2 Leading Applications and Customer Groups
- 13.3 End-Use Market Size, Share and Forecast
- 13.4 Major End-Use Industry Deep Dives
- 13.4.1 Customer Requirements and Use Cases
- 13.4.2 Demand and Replacement Cycles
- 13.4.3 Technical and Regulatory Considerations
- 13.4.4 Purchasing and Procurement Models
- 13.4.5 Leading Vendors and Distribution Channels
- 13.4.6 Forecast and Commercial Opportunities
- 13.5 Emerging Applications and Cross-Segment Demand
- 13.6 End-Use Industry Investment Priorities
Chapter 14 APAC Form Fill Seal Machines Geographic Market Outlook, 2025-2035
- 14.1 Regional Market Size and Country-Level Shares, 2025
- 14.2 Country Market Size Comparison, 2025
- 14.3 Country Market Forecasts, 2025-2035
- 14.4 Subregional Industrial and Demand Clusters
- 14.5 Intra-Regional Pricing and Cost Differences
- 14.6 Cross-Border Trade and Supply Networks
- 14.7 Regional Supply and Demand Balances
- 14.8 Country Opportunity Comparison and Prioritization
Note: Every listed country is covered on the structure shown under the first country.
Chapter 15 APAC Form Fill Seal Machines Technology, Innovation and Sustainability Outlook
- 15.1 Technology Landscape and Maturity
- 15.2 Product, Process and Service Innovation
- 15.3 AI, Automation and Digital Tools in the Industry
- 15.4 Technology Adoption and Performance Benchmarking
- 15.5 Innovation Pipeline and R&D Investment
- 15.6 Patent and Intellectual Property Trends
- 15.7 Energy Efficiency and Resource Management
- 15.8 Sustainability, Recycling and Circularity
- 15.9 Technology Roadmap, 2025-2035
- 15.10 Risks of Obsolescence and Technology Substitution
Chapter 16 APAC Form Fill Seal Machines Market Key Strategic Imperatives
- 16.1 Growth and Market Entry Priorities
- 16.2 High-Return Products and Segments
- 16.3 Pricing, Profitability and Cost Optimization
- 16.4 Technology Investment and Product Differentiation
- 16.5 Supply Chain Localization and Resilience
- 16.6 Distribution and Customer Acquisition
- 16.7 Partnership, Acquisition and Capacity Strategy
- 16.8 Regional Expansion Priorities
- 16.9 Short-, Medium- and Long-Term Actions
Chapter 17 Competition Outlook
- 17.1 Industry Competition Characteristics
- 17.2 Market Structure and Concentration
- 17.3 Market Share and Competitive Positioning, 2025
- 17.4 Company-Wise Revenue and Product Benchmarking
- 17.5 Production and Service Capacity Benchmarking
- 17.6 Technology, Pricing and Differentiation
- 17.7 Regional Footprint and Distribution Strength
- 17.8 Mergers, Acquisitions and Strategic Alliances
- 17.9 New Entrants and Competitive Threats
- 17.10 Porter's Five Forces and Industry Attractiveness
- 17.11 Competitive Outlook, 2025-2035
Chapter 18 Company Profiles
- 18.1 Company Coverage and Selection Criteria
- 18.2 Coesia Group
- 18.2.1 Business Description
- 18.2.2 Company Ownership and Geographic Presence
- 18.2.3 Product and Service Portfolio
- 18.2.4 Manufacturing and Operating Footprint
- 18.2.5 Production Capacity and Expansion Plans
- 18.2.6 Financial Performance and Investment
- 18.2.7 Market Share and Competitive Position
- 18.2.8 Technology and Innovation Capabilities
- 18.2.9 Strategic Alliances or Partnerships
- 18.2.10 Recent Developments
- 18.2.11 Growth Strategy and Outlook
- 18.3 IMA Group
- 18.4 Syntegon
- 18.5 Ishida
- 18.6 Duravant (Mespack)
- 18.7 TNA Solutions
- 18.8 Nichrome India
- 18.9 Other Relevant Market Participants
Note: Every listed company is profiled on the structure shown under the first company. The company list is preliminary and may change based on research findings, market developments, data availability and client requirements.
Chapter 19 Disclaimer
- 19.1 Research and Forecast Disclaimer
- 19.2 Data Source and Estimation Limitations
Note: The depth of individual sections depends on data availability for this market. Volume, capacity, trade and other unit-based metrics are included where applicable.

