
Beverage, food and goods dispensers for regional operators
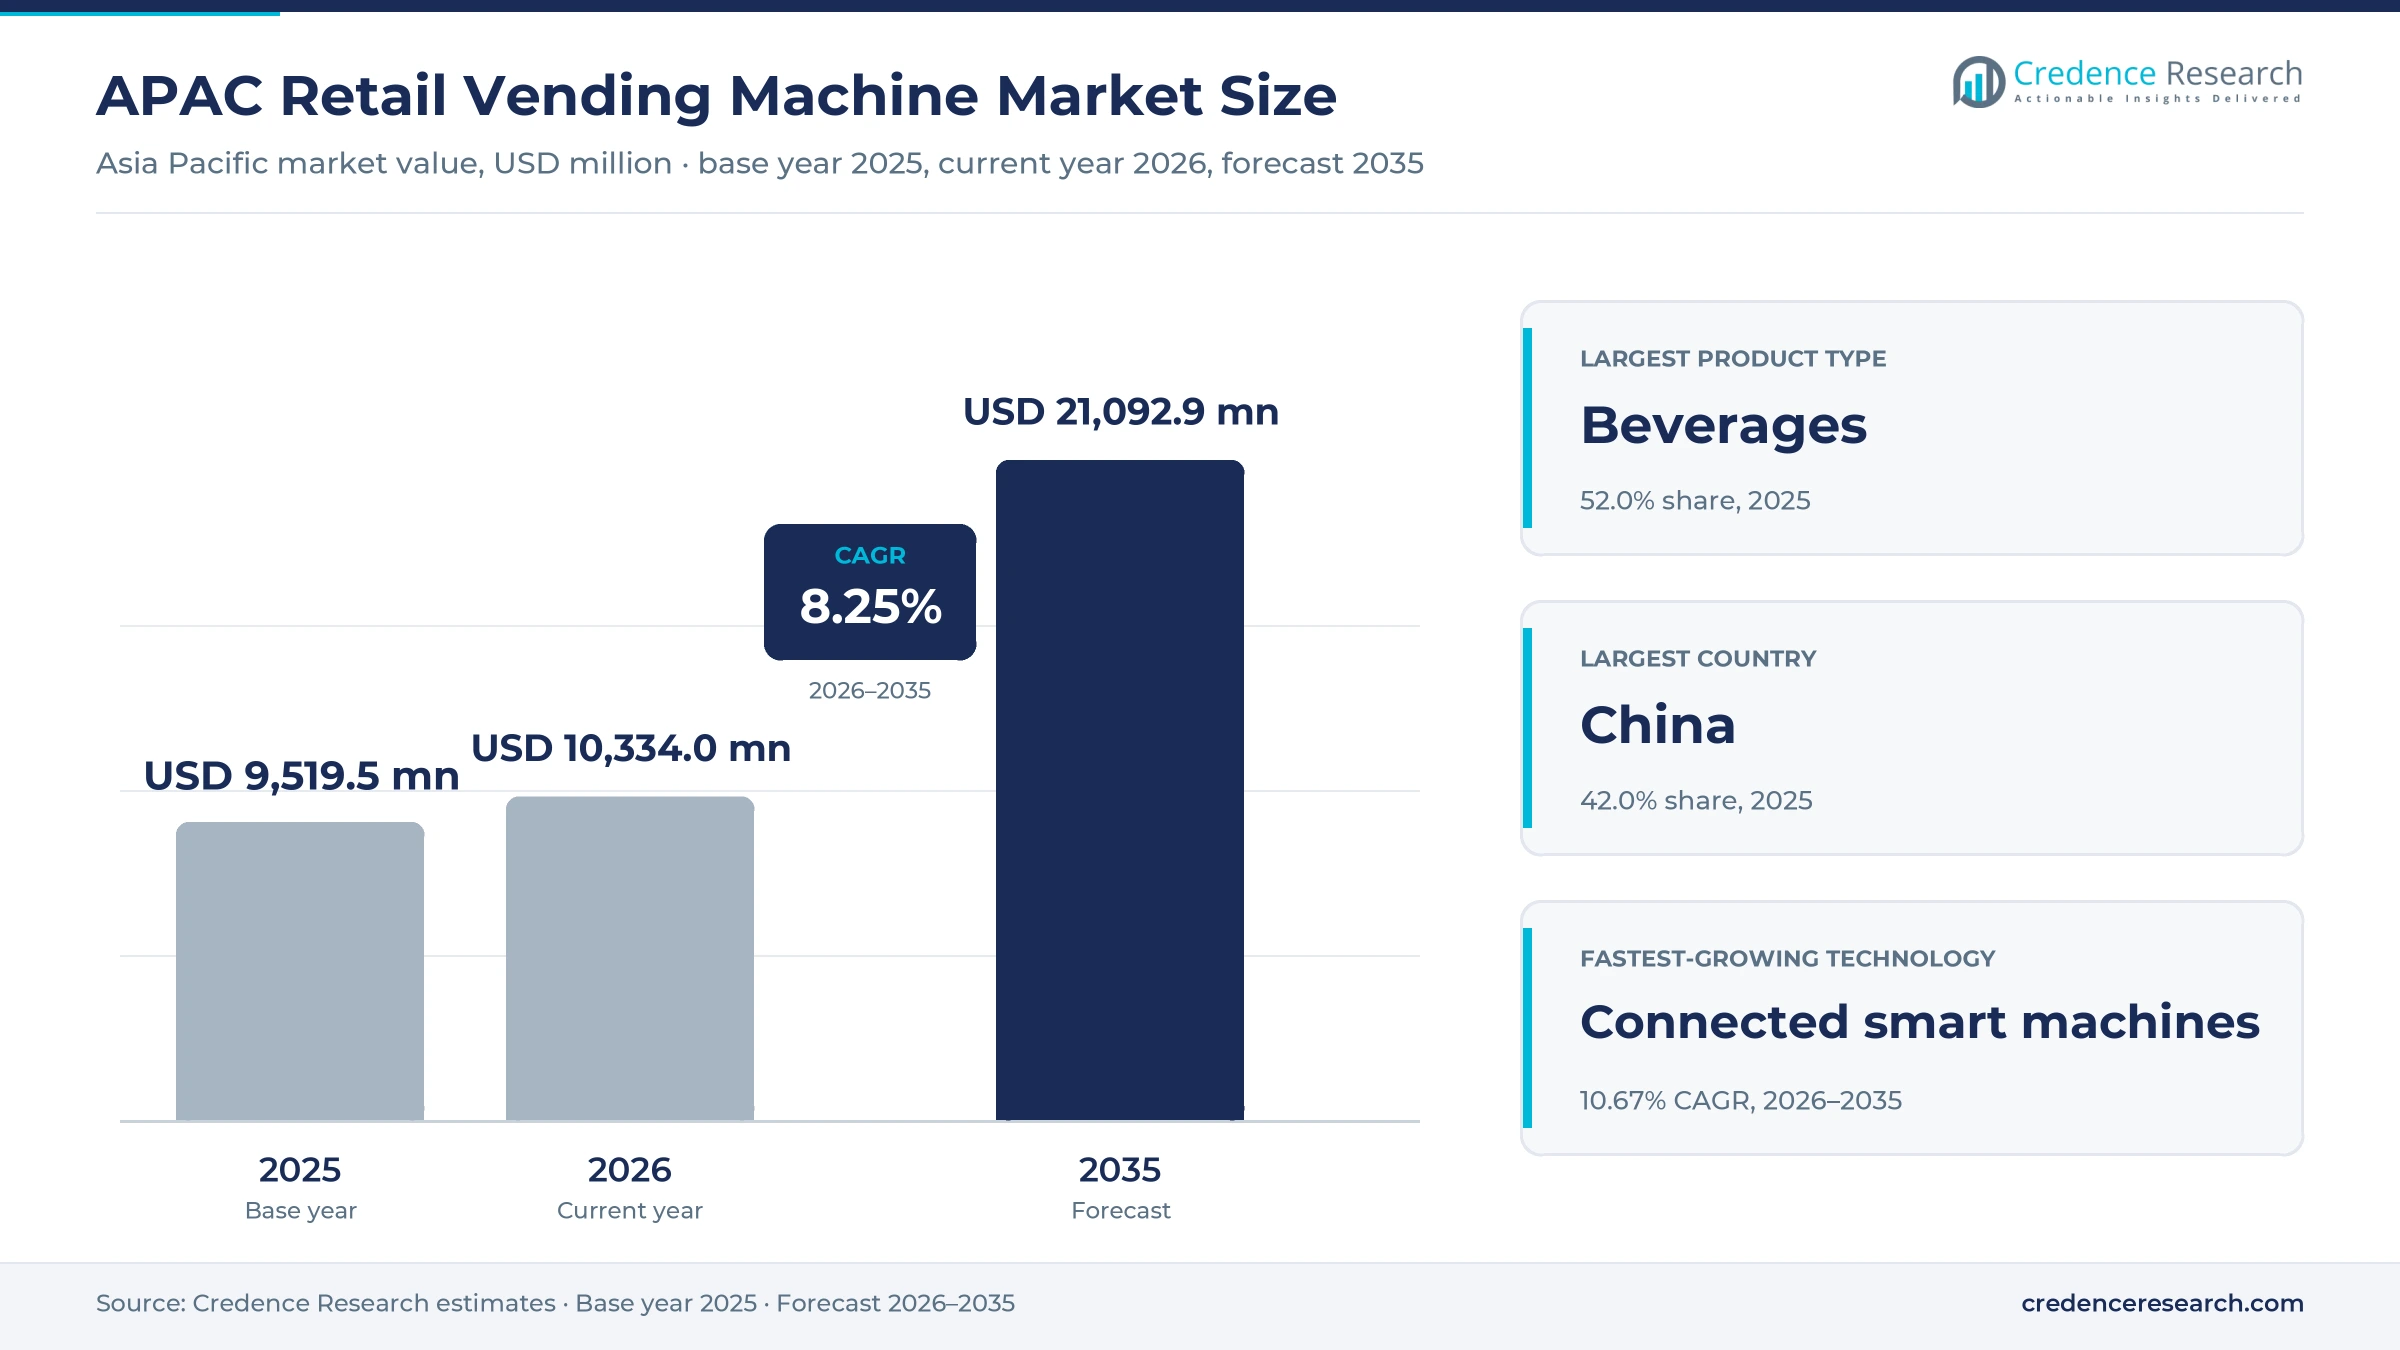
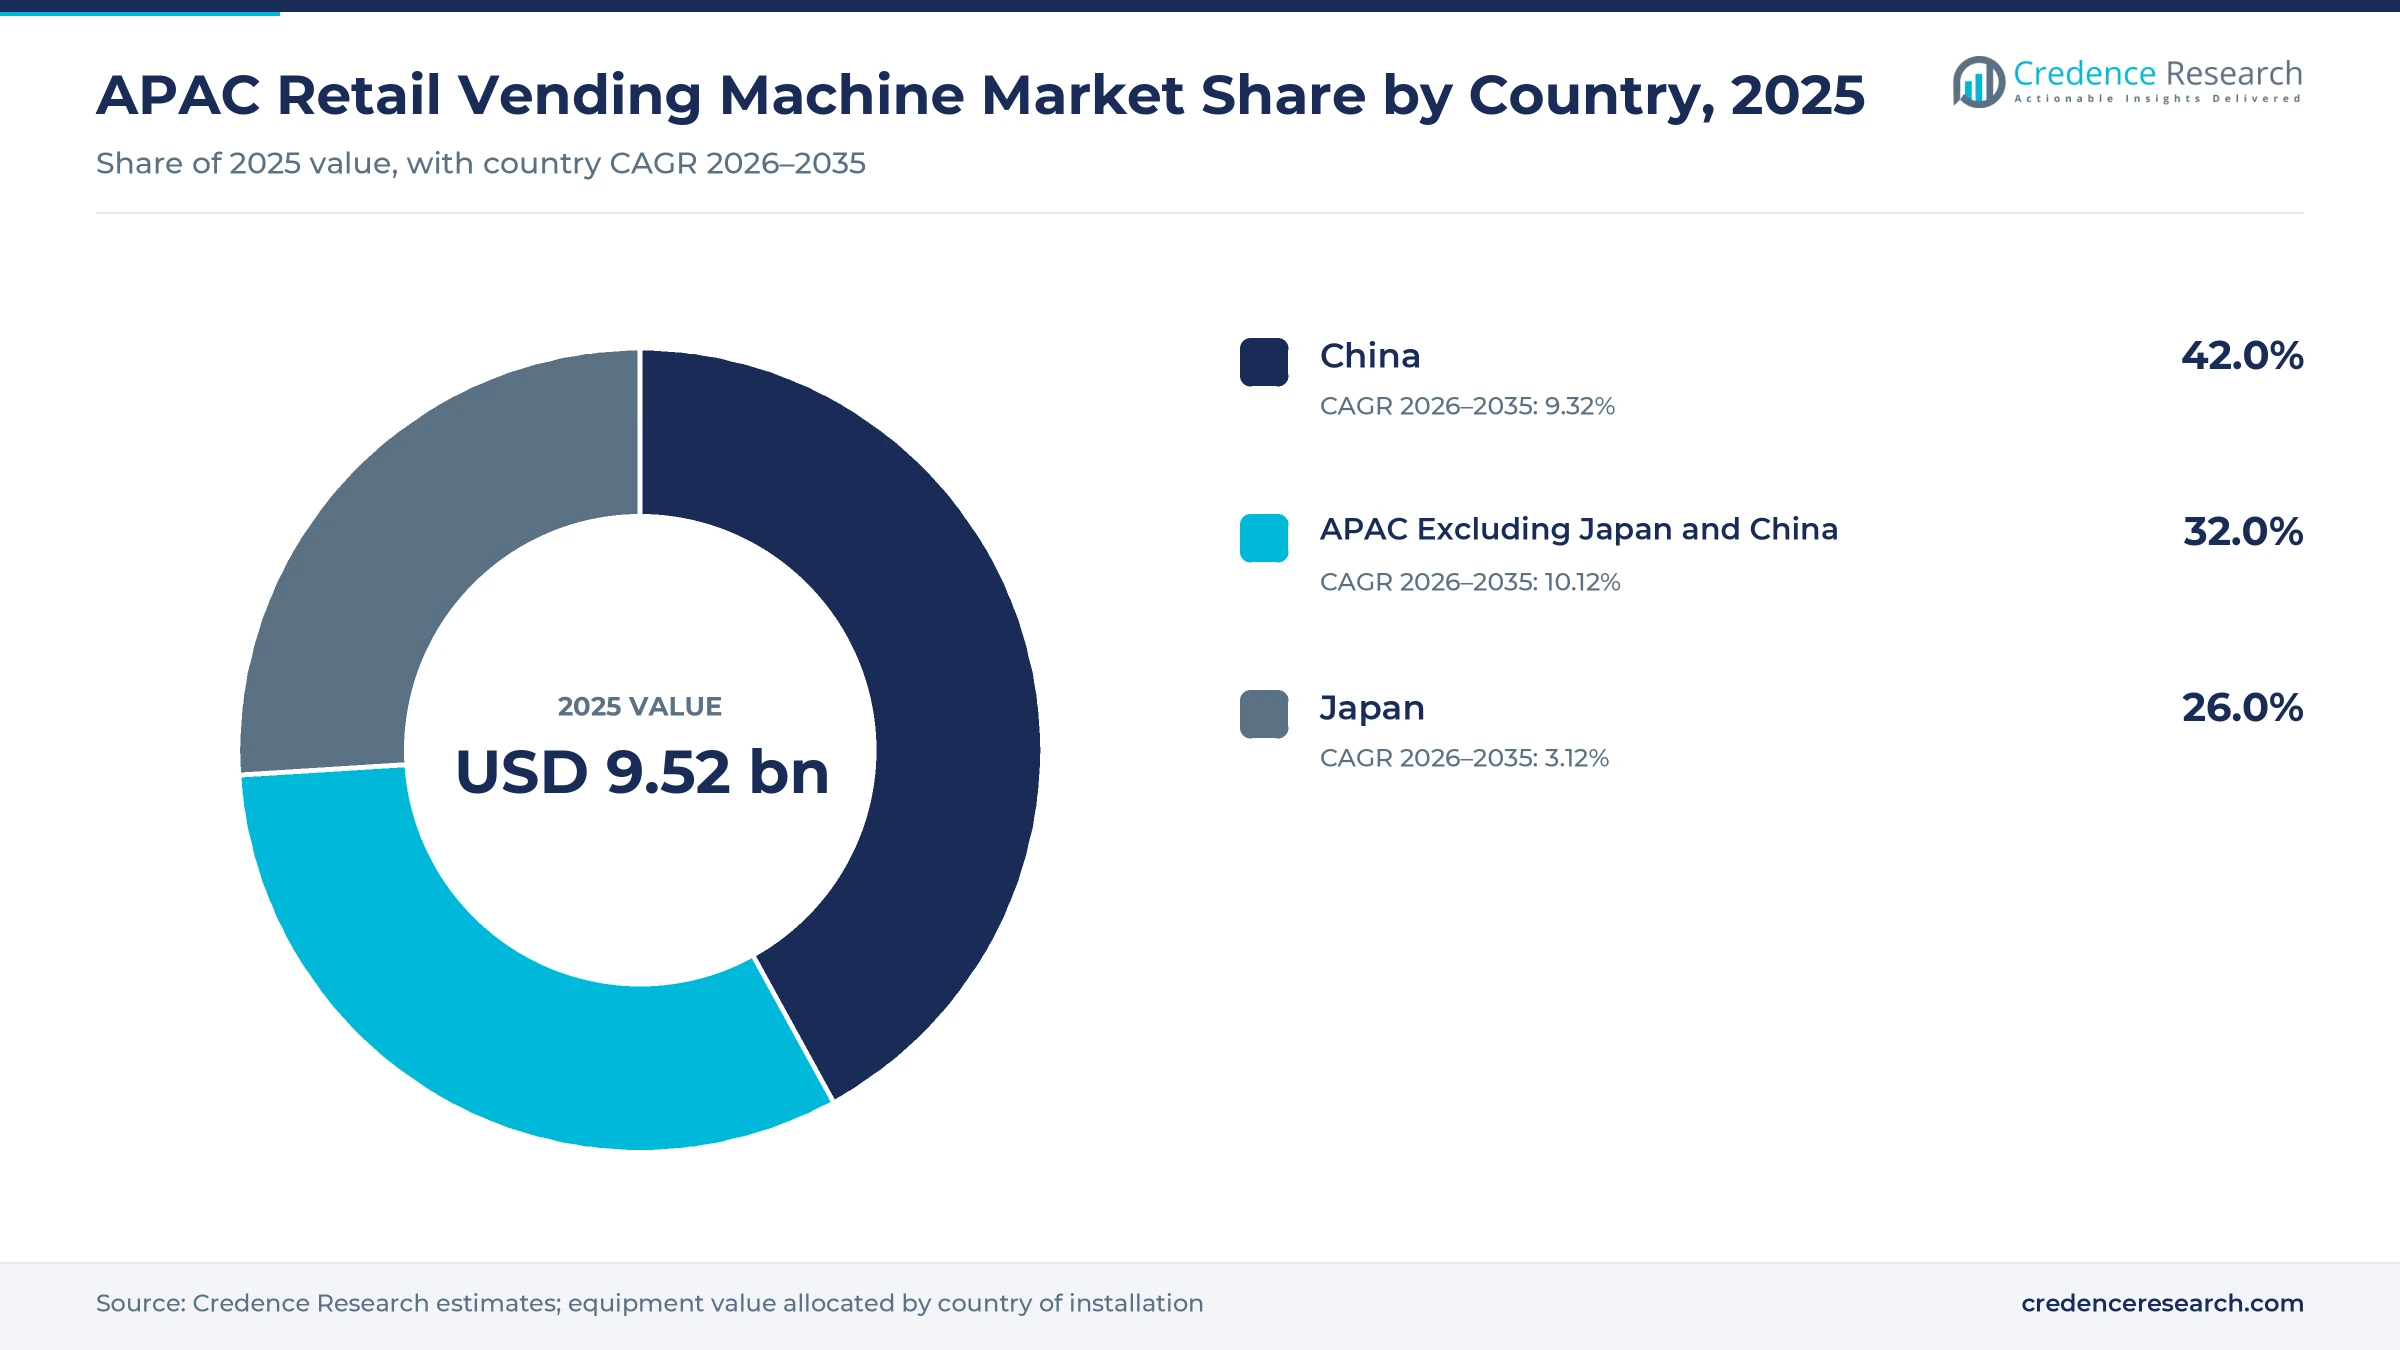
The APAC retail vending machine market was valued at USD 9.52 billion in 2025 and is projected to increase from USD 10.33 billion in 2026 to USD 21.09 billion by 2035, registering a CAGR of 8.25% during 2026–2035. Demand comes from bottlers that own large beverage fleets, independent operators that run workplace and station routes, facility owners in campuses and hospitals, and retail franchise operators that add unattended sales points. China held the largest country share, 42.0% in 2025, because it combines a large urban workforce, dense mobile payment use and domestic machine production. The group of Asia Pacific markets outside Japan and China grows fastest at 10.12% a year, as India and Southeast Asia add cashless machines in offices, transit hubs and residential towers. Japan issued new banknotes in July 2024, which forced operators to replace bill validators and accelerated the move toward app and card payment on new machines.
Which dispensers, readers and upgrade kits are counted here?
The estimate measures spending on new retail vending machines installed across Japan, China and the other Asia Pacific markets. It covers mechanical, standalone electronic and connected smart machines that dispense beverages, food and snacks, non-food goods and mixed merchandise, including payment readers, bill validators and telemetry units sold with the machine or as maker upgrade kits. Values are measured at the price paid by operators, brand owners, facility owners and franchise operators through direct sales, distributors, integrators and tenders.
The estimate excludes the retail value of products sold through the machines, route operation and refilling services, and industrial tool dispensers used inside factories. The value chain runs from compressor, refrigeration, payment and sensor suppliers through machine makers and integrators to beverage bottlers, independent operators and site owners that host the machines.
APAC Retail Vending Machine Market Insights
- The APAC retail vending machine market was valued at USD 9.52 billion in 2025 and is projected to reach USD 21.09 billion by 2035, registering a CAGR of 8.25% during 2026–2035.
- China held a 42.0% share of 2025 value, because its large urban workforce and mobile payment habits support dense machine networks.
- Beverage machines led product demand with a 52.0% share of 2025 value, because bottlers still own the largest fleets in the region.
- Japan issued new banknotes on July 3, 2024, which pushed operators to replace bill validators and add cashless readers on existing fleets.
- Suntory Beverage Solution planned about 150,000 machines compatible with its Jihanpi payment app by 2025, a sign of app-led replacement demand.
Beverage units lead while connected smart units grow fastest
Why do beverage machines still dominate product demand?
Based on product type, the market is categorized into beverages, food and snacks, non-food consumer goods and mixed merchandise. Beverages led with a 52.0% share of 2025 value, because bottlers in Japan and China run the largest machine fleets. Food and Snacks grow fastest at 9.36% a year, as frozen meals, ice cream and fresh coffee move into locker and multi-temperature machines.
How do offices and residential sites shape placement?
Based on application, the market is categorized into workplace refreshment, travel convenience, campus and hospital access, and retail and residential convenience. Workplace Refreshment led with a 34.0% share of 2025 value, because offices and factories give operators dense, predictable routes. Retail and Residential Convenience grows fastest at 8.76% a year, as apartment towers, stores and community hubs add pickup lockers and food machines.
How fast are connected smart machines replacing older units?
Based on technology, the market is categorized into mechanical machines, standalone electronic machines and connected smart machines. Standalone Electronic Machines led with a 50.0% share of 2025 value, because most installed fleets still use electronic controls without remote links. Connected Smart Machines grow fastest at 10.67% a year, as operators want remote stock data, dynamic pricing and app payment.
Which buyers place the largest machine orders?
Based on customer type, the market is categorized into independent vending operators, brand-owned vending operators, facility owners and retail franchise operators. Brand-Owned Vending Operators led with a 41.0% share of 2025 value, because bottlers such as Coca-Cola Bottlers Japan buy machines in large replacement programs. Retail Franchise Operators grow fastest at 9.17% a year, as convenience store chains add unattended sales points, coffee corners and pickup lockers that run without extra staff.
| Segment Group | Leading Sub-segment | Share, 2025 | Fastest-growing Sub-segment | CAGR, 2026–2035 |
|---|---|---|---|---|
| By Product Type | Beverages | 52.0% | Food and Snacks | 9.36% |
| By Application | Workplace Refreshment | 34.0% | Retail and Residential Convenience | 8.76% |
| By Technology | Standalone Electronic Machines | 50.0% | Connected Smart Machines | 10.67% |
| By Customer Type | Brand-Owned Vending Operators | 41.0% | Retail Franchise Operators | 9.17% |
Request a Free Sample
Fill in your details and we'll send you a free sample report.
- Sample data tables & charts
- Research methodology
Payment upgrades, dense routes and food formats lift orders
Payment modernization drives reader and machine upgrades
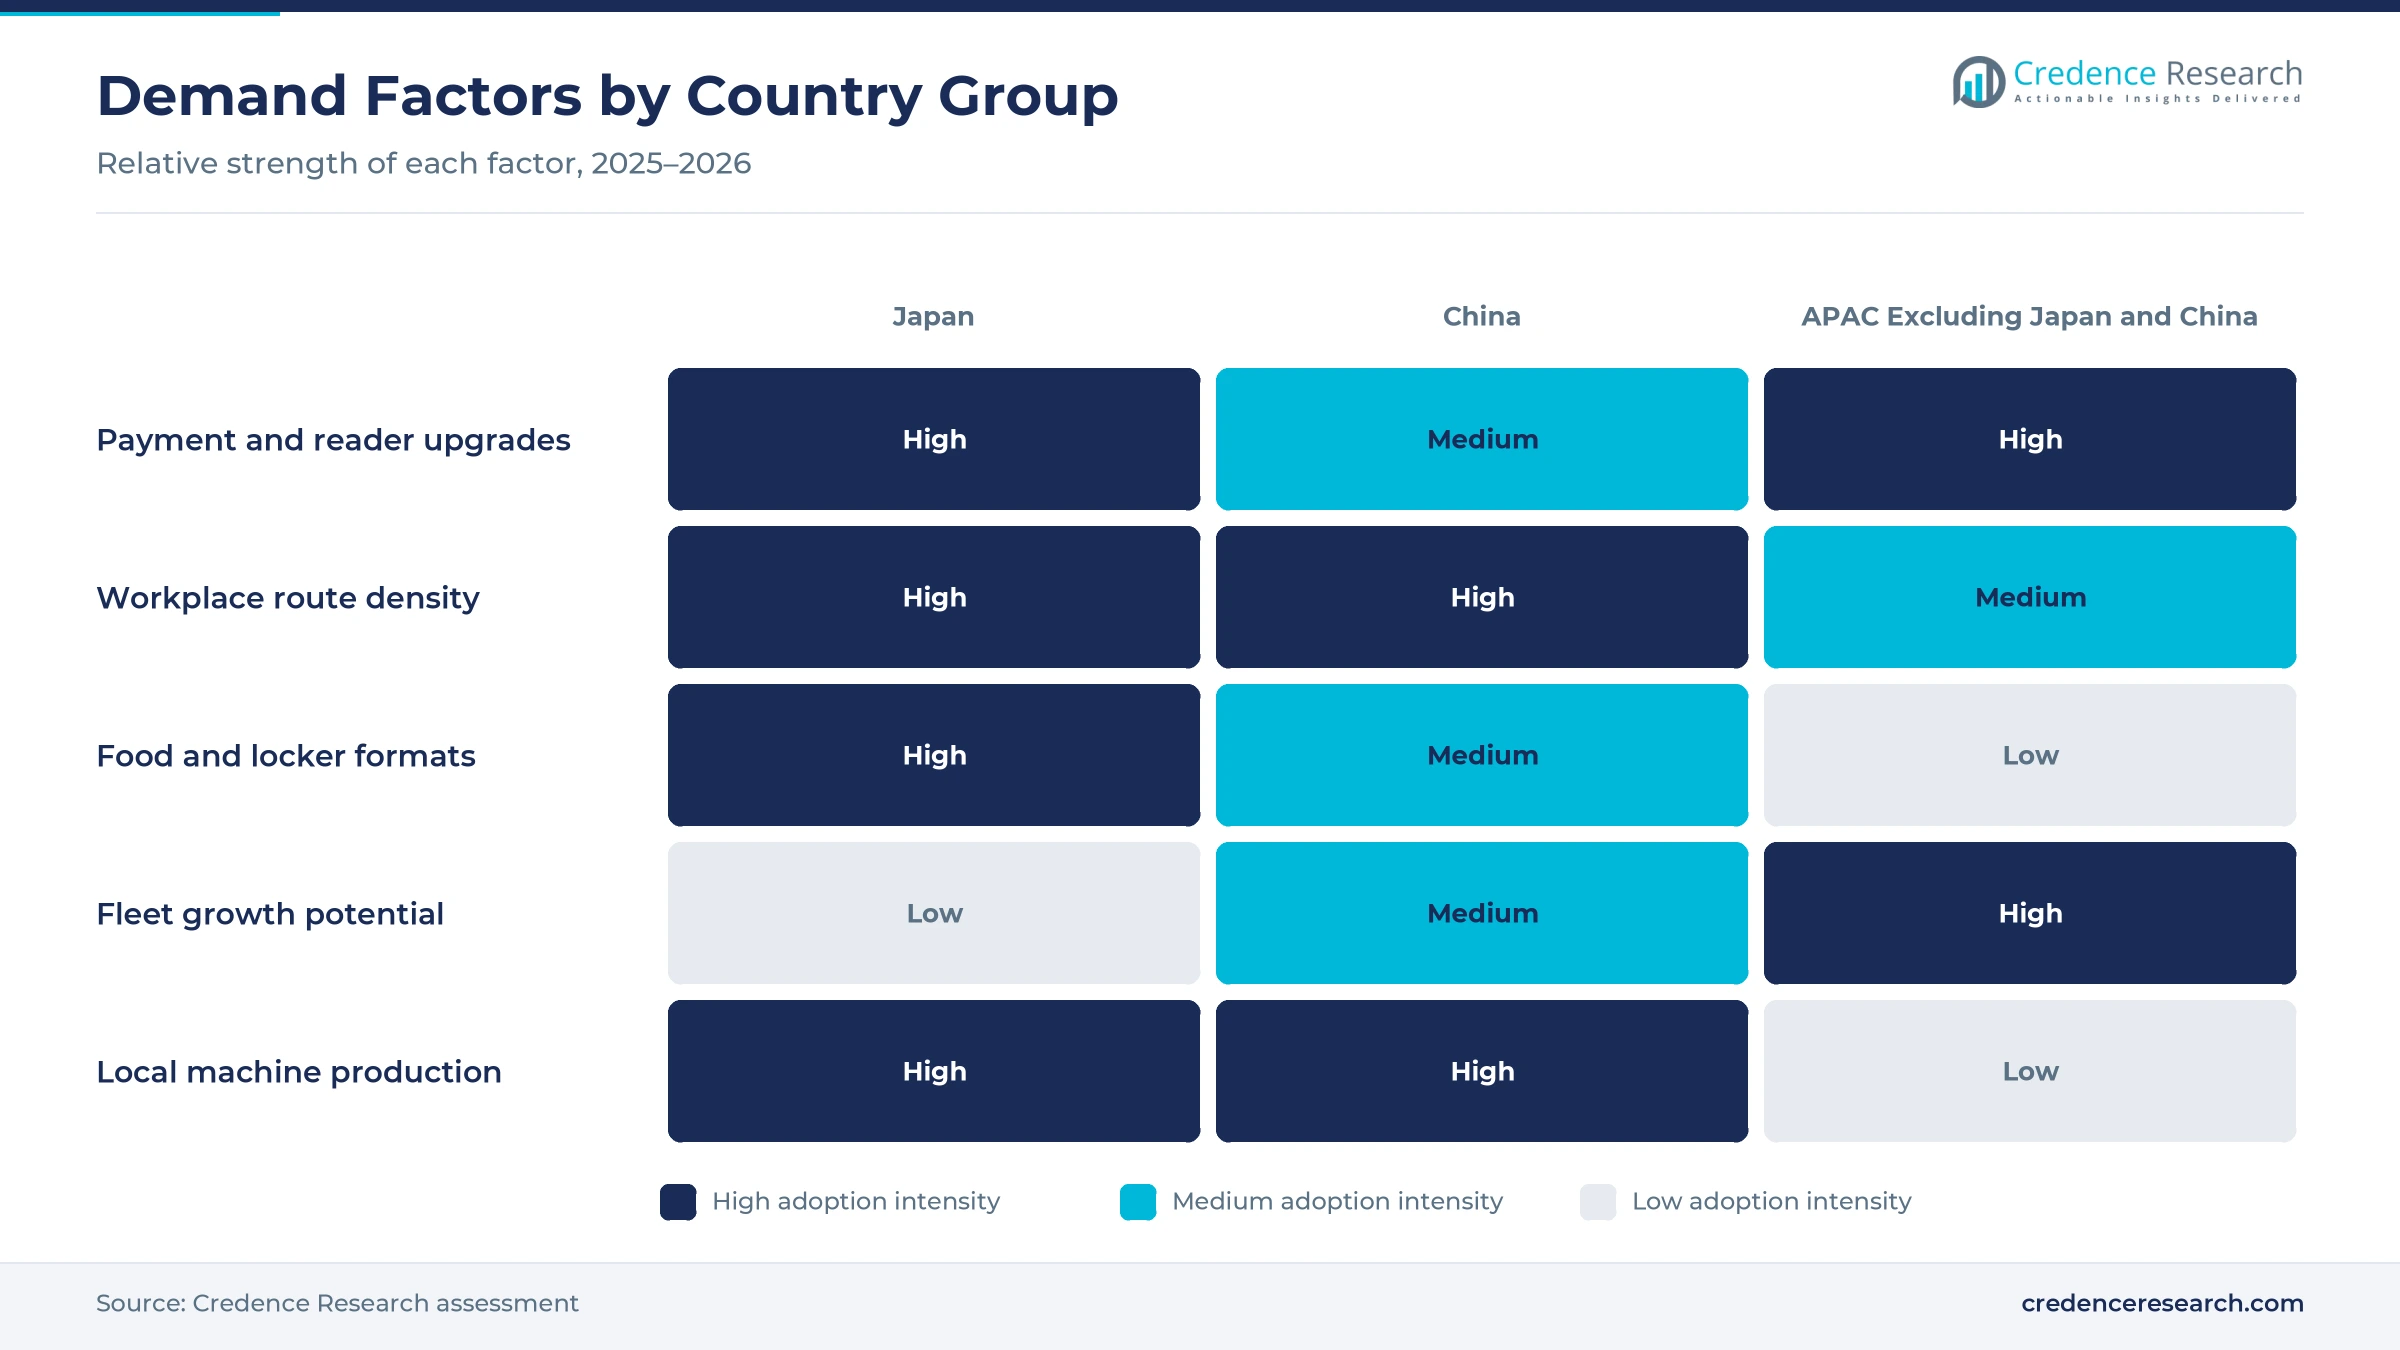
Payment modernization is the strongest replacement trigger, because older machines cannot read new notes, cards or phone apps without new hardware. Japan's cashless payment ratio reached 42.8% in 2024, worth 141.0 trillion yen, according to the Ministry of Economy, Trade and Industry. When the Bank of Japan issued new banknotes on July 3, 2024, Finance Minister Shunichi Suzuki said only about 30% of vending machines were expected to be ready, Fortune reported. Fuji Electric said in its 2025 integrated report that it captured new banknote demand in fiscal 2024 and gained share in vending machines and change dispensers. Suntory Beverage Solution launched its Jihanpi app in December 2024 and planned about 150,000 compatible machines by 2025, according to CCCMK Holdings. As a result, connected smart machines grow fastest at 10.67% a year.
Dense workplace routes keep operator fleets productive
Operators earn the best return where many workers sit close together, because one truck can refill more machines on each shift. China had 475.35 million urban employed persons at the end of 2025 and added 12.67 million new urban jobs during the year, according to the National Bureau of Statistics of China. In Japan, truck drivers became subject to an annual overtime cap of 960 hours in April 2024, East Asia Forum reported, which forces operators to shorten routes. The national weighted average minimum wage also rose by 66 yen to 1,121 yen in fiscal 2025, according to the Ministry of Health, Labour and Welfare. Consequently, workplace refreshment held 34.0% of 2025 value, and operators favor machines placed on dense office and factory routes.
Food vending formats widen what machines can sell
Food formats widen the range of products a machine can sell, which brings new buyers such as restaurant chains and grocers into the market. Fuji Electric supplies locker vending machines for frozen products and refrigerated grocery pickup to restaurant chains, and it plans growth in coffee and ice cream machines in China, according to its May 2026 business briefing. Sanden Retail Systems launched the Do-Hiemon MULTI outdoor machine in November 2022, which switches between 5 C, 18 C and room temperature and holds up to 168 items, Impress Watch reported. These machines also carry frozen meals and desserts that standard beverage units cannot store. As a result, food and snacks grow fastest among product types at 9.36% a year.
Mobile payment scale opens new markets beyond Japan
Mass mobile payment use removes the need for coins and notes, which lowers the cost of placing machines in new countries and sites. Mobile payments in China reached 60.63 billion transactions worth 137.53 trillion yuan in the third quarter of 2025, according to the People's Bank of China. India recorded about 228 billion UPI transactions in 2025, including 21.6 billion in December alone, up 29% from a year earlier, based on National Payments Corporation of India data reported by Deccan Chronicle. Fuji Electric announced in May 2026 plans to enter India with an initial deployment in Bangalore and a machine designed for the local market. Because phone-based payment is now routine, makers can place cashless machines in markets where coin handling once limited demand.
Leaner fleets, app-led designs and new pickup formats emerge
Shift from large fleets to fewer data-led machines
Japanese operators are shrinking fleets and spending more on each remaining machine, which changes replacement demand from volume to capability. Japan had about 1.95 million soft drink machines in 2025, down about 90,000 in a year and the largest drop since records began in 1995, Vending Times reported, citing the Asahi Shimbun. Coca-Cola Bottlers Japan reduced its network from about 700,000 to about 650,000 machines over the same period. DyDo Group Holdings plans to cut about 20,000 machines from roughly 270,000 in fiscal 2026, and Sapporo Holdings announced in March 2026 that it would sell about 40,000 machines to Lifedrink, Jiji Press reported. As a result, brand-owned operators grow slowest among buyers, while connected replacement units gain share.
Rise of buttonless and app-led machine designs
Machine design is moving toward screens, QR codes and apps, because operators want sales data and lower cash handling costs. DyDo DRINCO launched a pilot of its HAKU machine at Toyota Woven City in September 2025, a white unit with no product samples, buttons or coin slots, where buyers scan a QR code and pay cashless, according to DyDo Group Holdings. Suntory said average sales rose at machines that began accepting its Jihanpi app, Jiji Press reported. Coca-Cola Bottlers Japan also ran a Coke ON app campaign with 21 Kanto railway operators from Nov. 10 to Dec. 25, 2025, according to Payment Navi. Consequently, standalone electronic machines lose share to connected models through the forecast period.
Opportunity in coffee and frozen dessert machines
Coffee and frozen dessert machines offer an opening for makers that can sell beyond Japan's mature beverage fleets. Fuji Electric reports the leading share of beverage machines in China and builds machines for China and Southeast Asia at its Dalian plant, which also exports to Southeast Asia. The company plans growth in coffee and ice cream machines in China, convenience store coffee machines in Thailand and smoothie machines in South Korea. China's National Bureau of Statistics counted 6.52 billion domestic tourism trips in 2025, up 16.2%, which widens travel sites for these formats. Suppliers that also sell commercial coffee equipment to store chains can bundle both product lines.
Opening in pickup lockers and community sales points
Pickup lockers and community sales points give makers an opening with grocers, pharmacies and residential developers. Fuji Electric plans pharmaceutical pickup lockers for the fourth quarter of fiscal 2026, tied to a Japanese pharmaceutical law amendment scheduled for March 2027, and multi-function lockers for train stations. In China, the Ministry of Commerce and eight other departments issued a notice in September 2025 to upgrade 15-minute convenience living circles, calling for smart terminal equipment in community outlets, Xinhua reported. These units overlap with smart parcel lockers, which the notice treats as public service infrastructure. As a result, retail and residential convenience grows fastest among applications at 8.76% a year.
Fleet cuts, upgrade costs and route labor weigh on buyers
Shrinking beverage fleets cut replacement volume
Japanese bottlers are removing unprofitable machines faster than they add new ones, which lowers the number of units ordered each year. As a result, makers that depend on beverage replacement cycles face flat or falling volume at home. Higher drink prices push buyers toward supermarkets and drugstores, which weakens sales per machine. Makers respond with higher-value units, energy-saving designs and food formats that earn more per site.
Upgrade costs strain small operators and site owners
New payment hardware, bill validators and telemetry units add cost that small operators struggle to recover from thin margins. Fortune reported that no government subsidies were available to help small businesses adapt machines to the 2024 yen notes. Consequently, some operators delay upgrades or remove older machines instead of replacing them. Makers and distributors reduce the barrier with retrofit kits, leasing and payment providers that share transaction fees.
Route labor limits raise the cost of service
Refilling, cleaning and cash collection depend on drivers and route staff, and these workers are harder and costlier to hire. Because Japan capped truck driver overtime in April 2024 and raised minimum wages again in fiscal 2025, each service visit costs more. Remote sites with low sales lose money first and are often removed. Operators respond with telemetry, demand-based restocking and machines that hold more stock between visits.
Refrigerant and energy rules add design cost
Makers must move refrigeration systems toward non-fluorocarbon and lower global warming potential refrigerants while cutting power use. Fuji Electric lists eco-friendly products with new refrigerants, including R474B, among its current development work. These changes require new compressors, testing and service training, which raises unit costs before volumes grow. Buyers benefit from lower electricity bills, although payback depends on how much each machine sells.
China leads while emerging Asian markets grow fastest
| Country | Value, 2025 (USD billion) | Share, 2025 | CAGR, 2026–2035 |
|---|---|---|---|
| China | 4.00 | 42.0% | 9.32% |
| APAC Excluding Japan and China | 3.05 | 32.0% | 10.12% |
| Japan | 2.48 | 26.0% | 3.12% |
China combines urban scale, phone payment and local production
China held a 42.0% share of 2025 value and grows at 9.32% a year. Its urban workforce, transit networks and phone payment habits support dense machine placement across offices, stations and housing estates. Railway passenger traffic reached 4.60 billion person-times in 2025, up 6.7%, and online retail sales of physical goods equaled 26.1% of total retail sales, which shows how familiar unattended and digital buying has become. Fuji Electric reports the leading share of beverage machines in China and builds units in Dalian. Community outlet upgrades under the 15-minute convenience living circle program also add sites for smart cabinets.
Japan replaces a mature fleet with smarter machines
Japan held a 26.0% share of 2025 value and grows at 3.12% a year, the slowest pace in the region. Operators there replace machines more than they add them, so demand depends on upgrades. The Japan Vending Machine Manufacturers Association counted 3,931,900 vending and automatic service machines at the end of 2023, including 2,218,600 beverage machines, Nihon Shokuryo Shimbun reported. Domestic production fell from 202,448 units in 2020 to 131,680 units in 2024, according to METI production statistics. Fuji Electric also sees rising coffee demand among restaurant chains and convenience stores, which links machine planning to caffeinated drinks in Japan.
Emerging Asian markets add cashless machines fastest
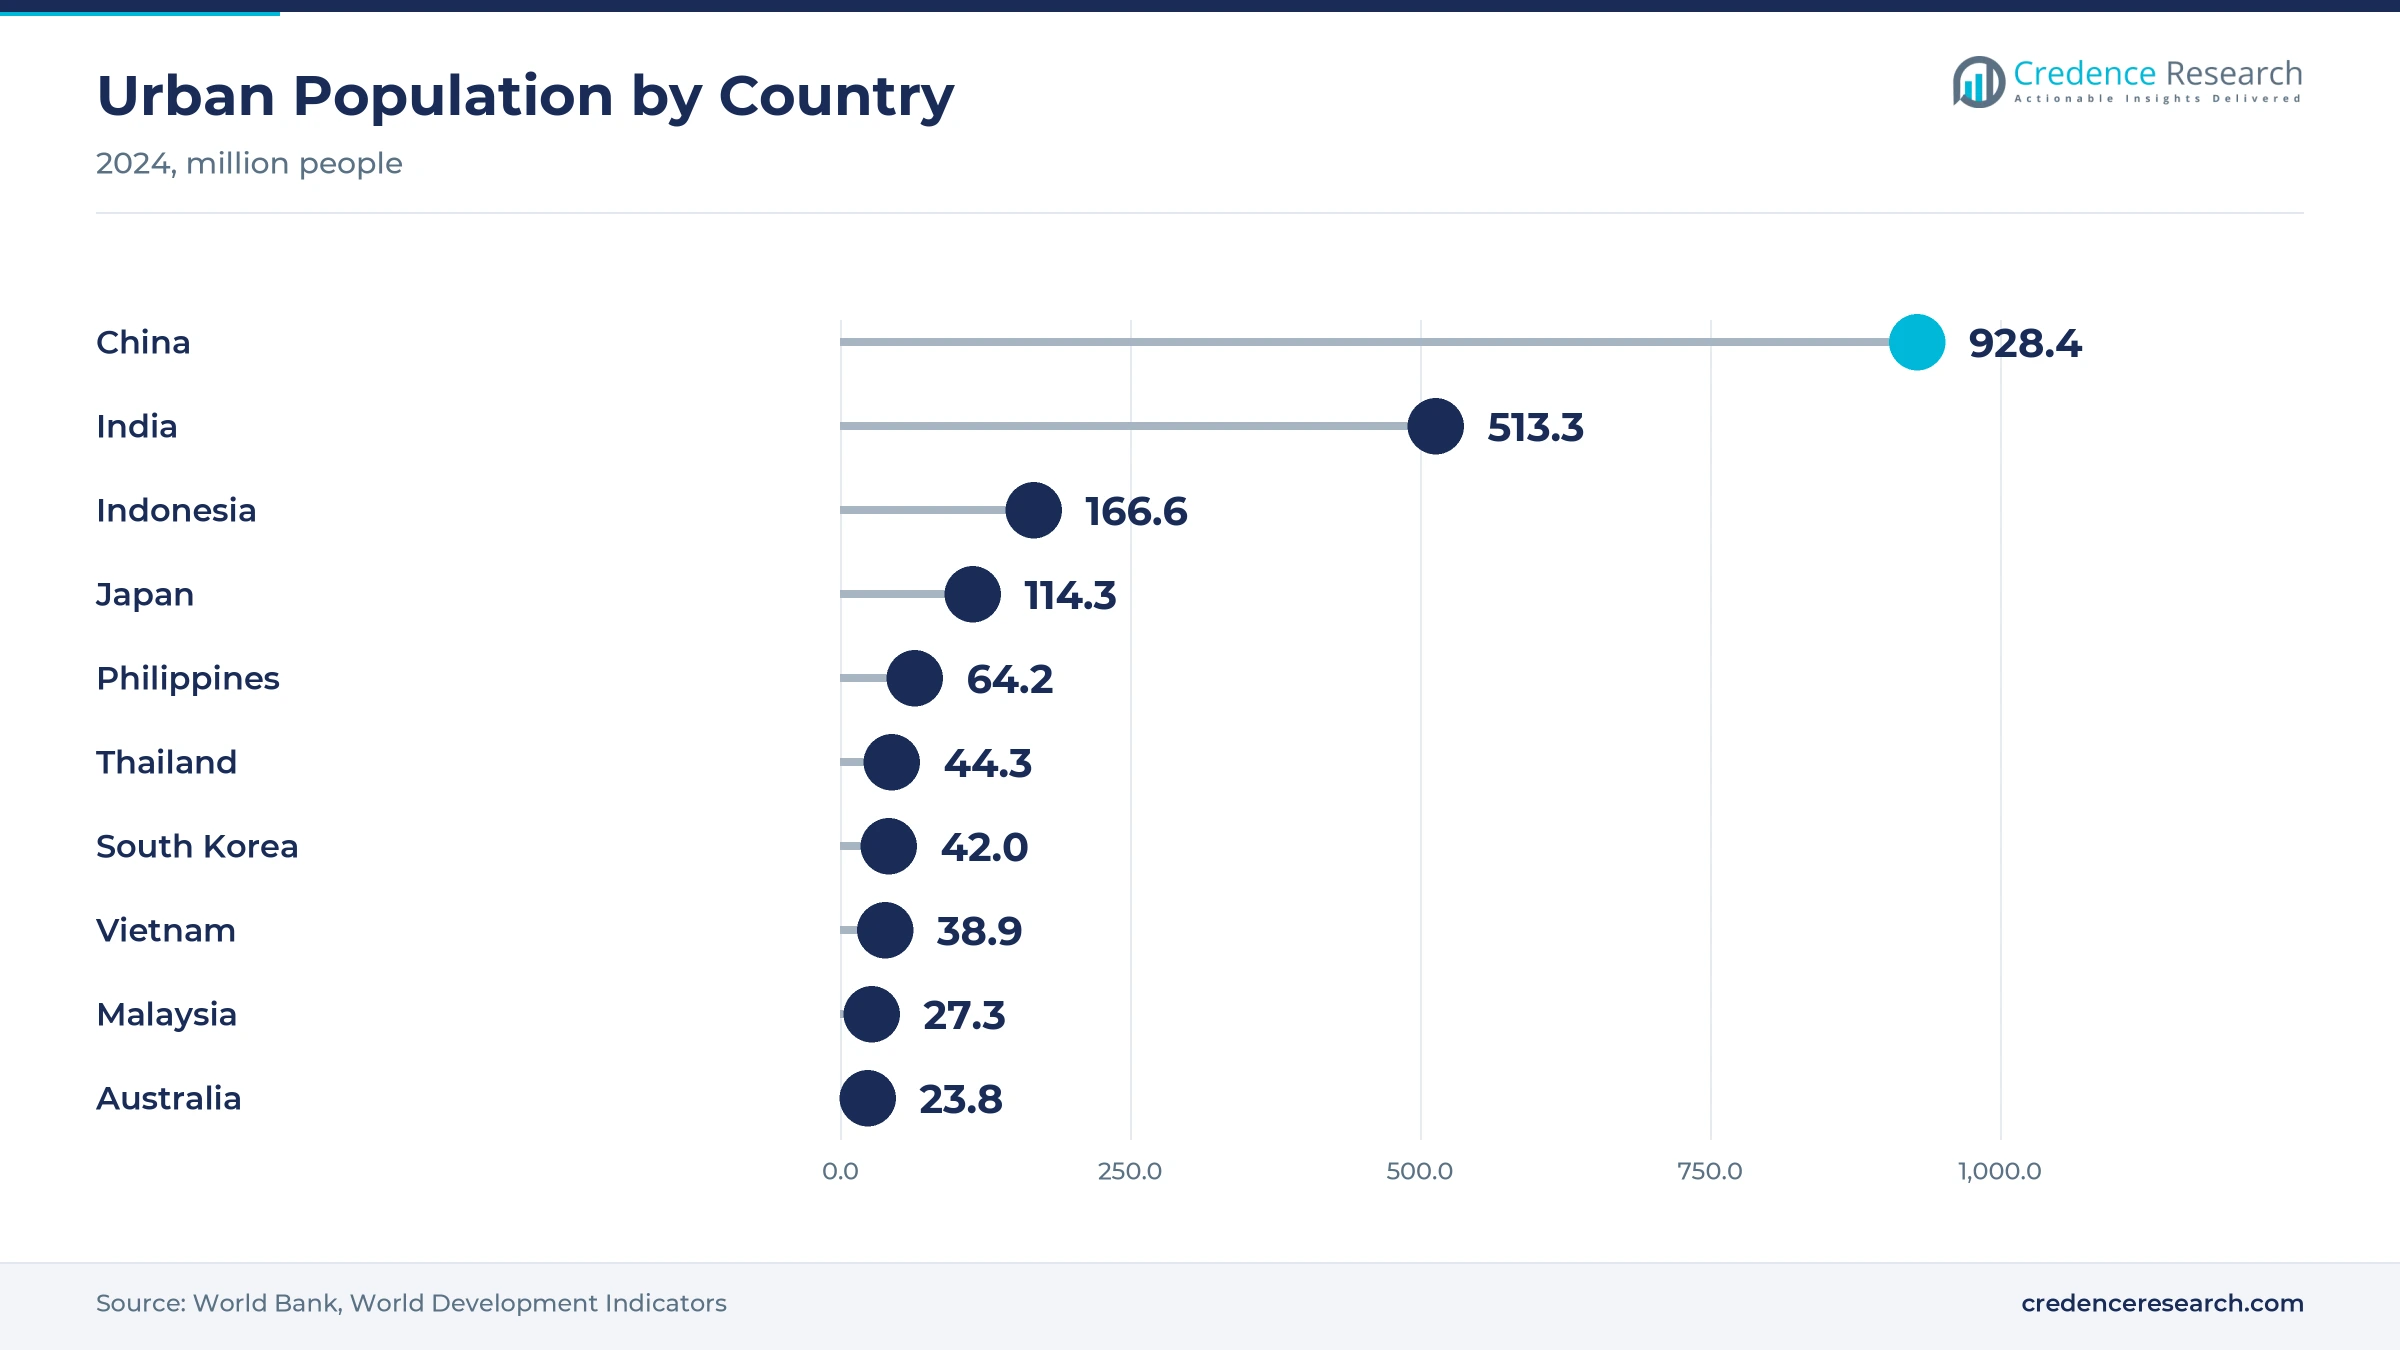
The markets outside Japan and China held a 32.0% share of 2025 value and grow fastest in the region. India, Indonesia, the Philippines, Thailand, Vietnam, South Korea and Australia lead this group, with India's urban population at about 513.3 million and Indonesia's at about 166.6 million in 2024, according to the World Bank. Fuji Electric plans an initial vending deployment in Bangalore through partnerships with general trading companies, alongside coffee machines in Thailand and smoothie machines in South Korea.
Fleet exits, app launches and new machine pilots
| Development | Status and market relevance |
|---|---|
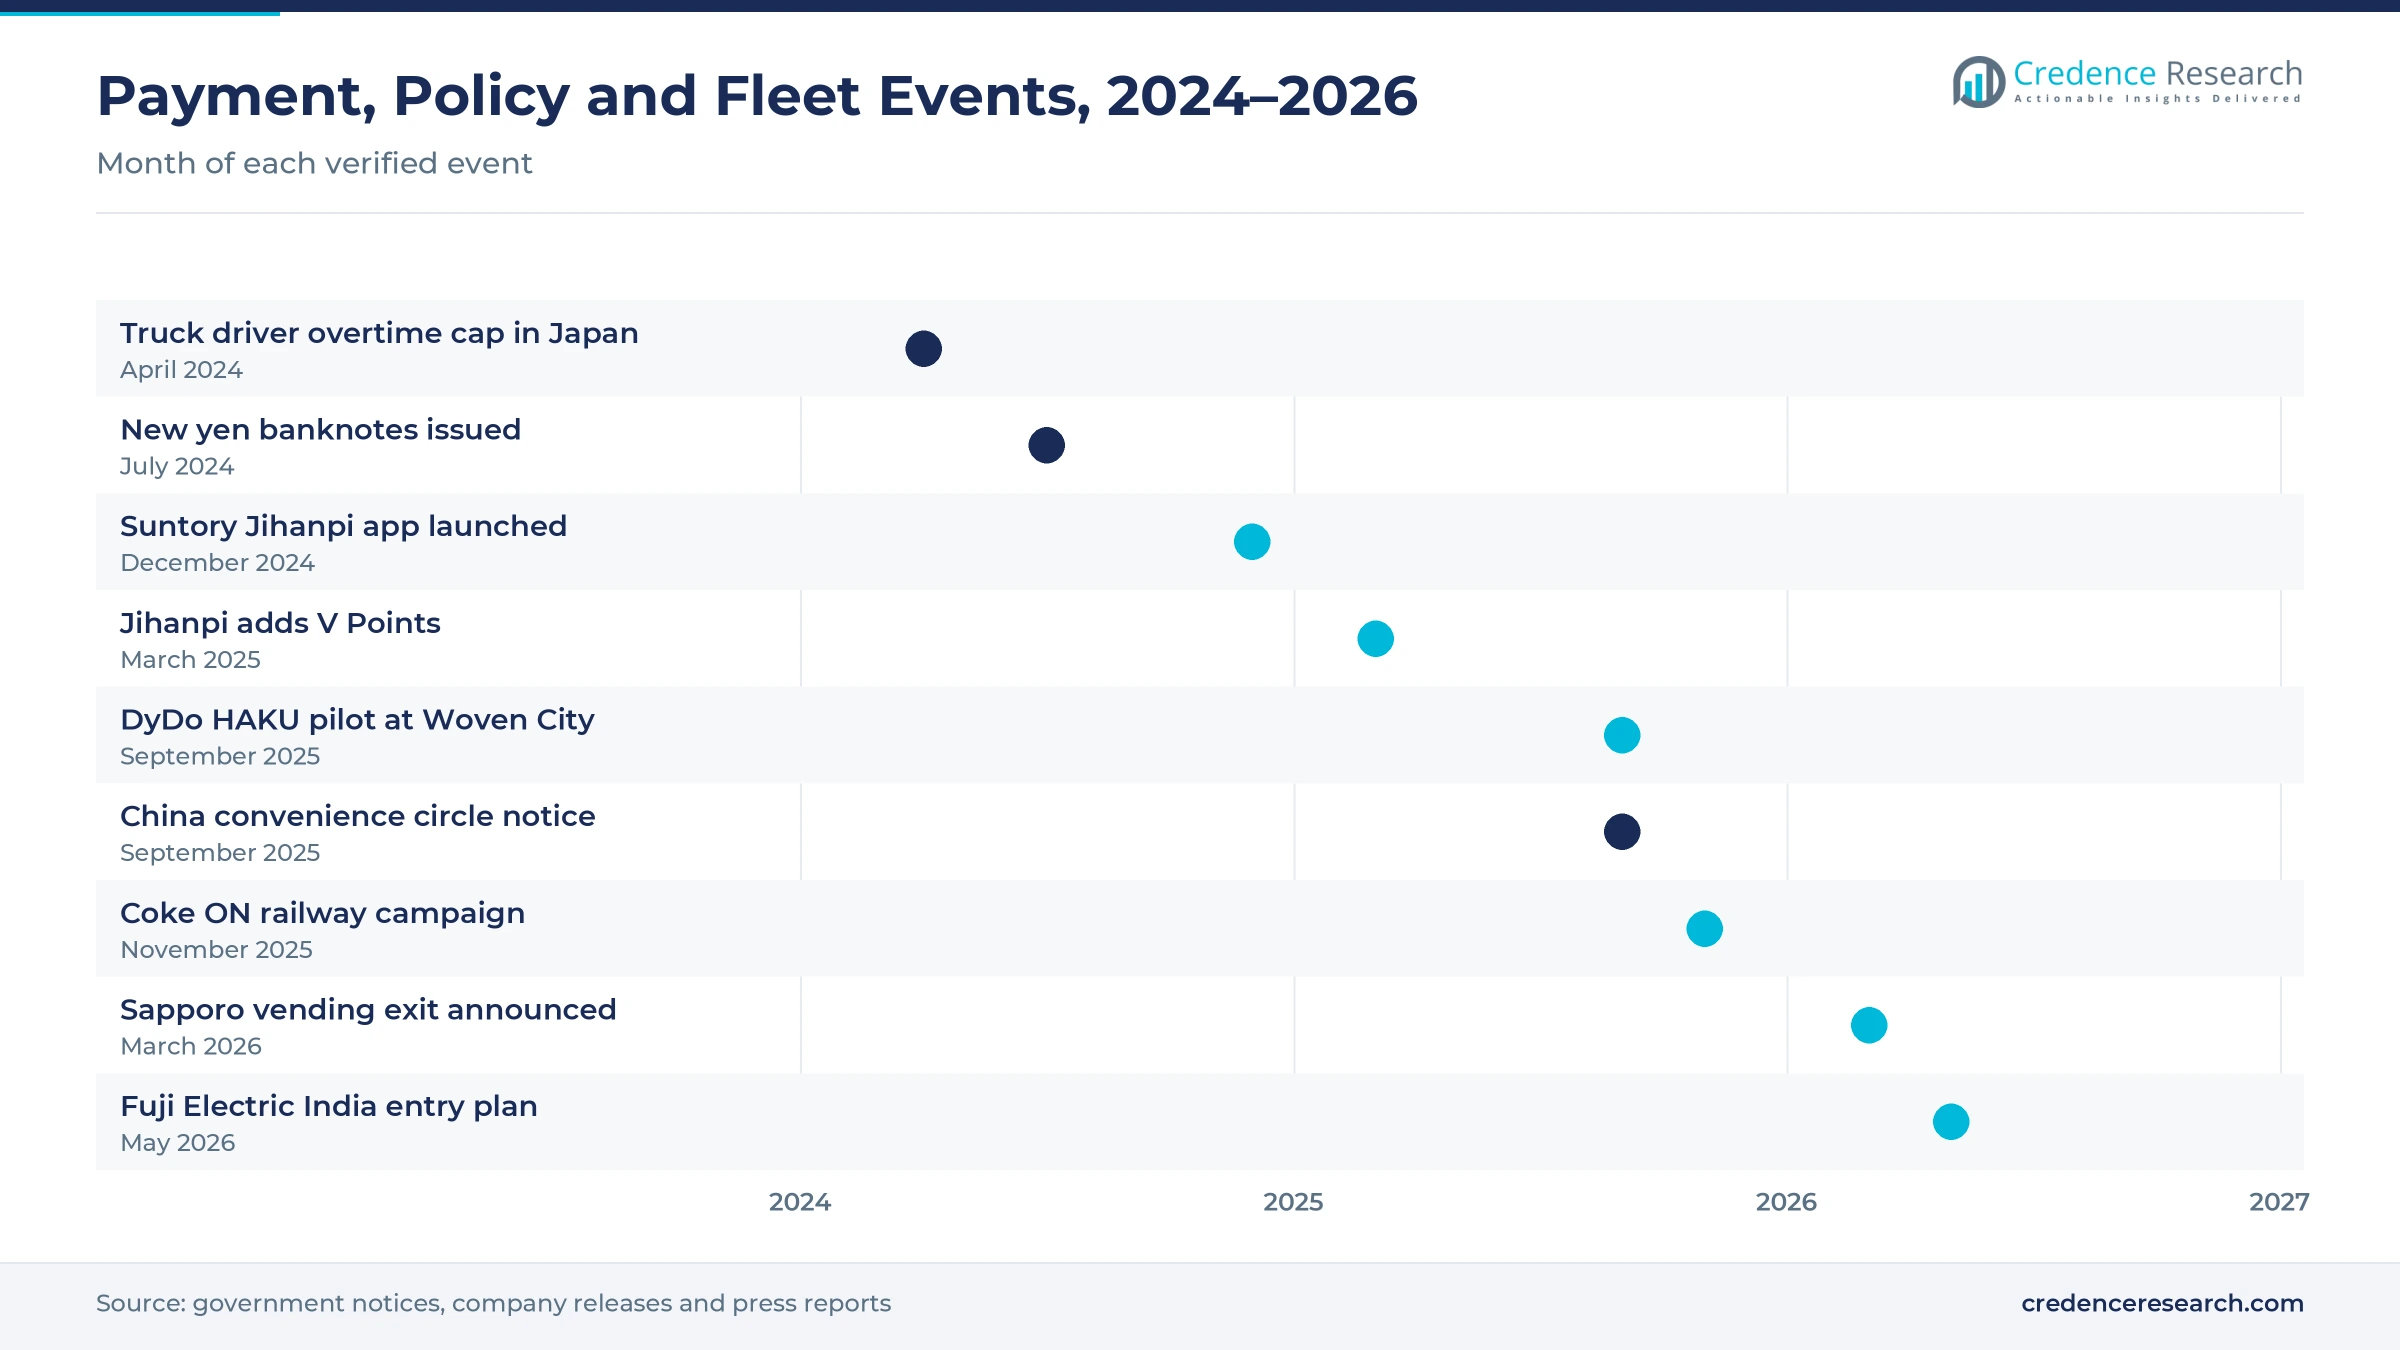
| In March 2026, Sapporo Holdings announced it would exit vending operations and sell about 40,000 machines to Lifedrink, Jiji Press reported. | Shows consolidation of Japanese beverage fleets |
| In September 2025, DyDo DRINCO began a pilot of its HAKU machine, with no buttons or coin slots, at Toyota Woven City. | Tests QR-based cashless machine designs |
| In March 2025, Suntory Beverage Solution added V Points to its Jihanpi vending app, after launching the app in Hokkaido in December 2024. | Targets about 150,000 compatible machines by 2025 |
| In November 2025, Coca-Cola Bottlers Japan ran a Coke ON app campaign at stations of 21 Kanto railway operators. | Promotes app payment at station machines |
| In May 2026, Fuji Electric outlined plans to enter India with an initial deployment in Bangalore and a model for the Indian market. | Extends its machine business beyond China and Southeast Asia |
Cashless readers, telemetry and multi-temperature cabinets
- Cashless readers and bill validators accept cards, phone apps, QR codes and the 2024 yen notes, which keeps older fleets usable and lifts sales per machine.
- Telemetry and two-way communication units report stock, faults and sales in real time, which supports dynamic pricing, demand-based restocking and shorter routes.
- Multi-temperature and locker cabinets hold frozen, chilled and room-temperature goods in one unit, which lets operators sell meals, desserts and grocery pickups.
- Low-GWP refrigeration systems use newer refrigerants and efficient compressors, which cut electricity use and help bottlers meet climate targets.
Need a Custom Version of This Report?
Tailor the scope, geography, or segments to your exact requirements.
- Custom geography or segment scope
- Direct access to our analyst team
Japanese makers and bottler fleets shape competition
Competition splits between Japanese machine makers that supply large bottler fleets and newer formats sold to food chains, grocers and site owners. Fuji Electric reports the top domestic share in beverage and food and goods machines, the leading beverage machine share in China, and a Dalian plant serving China and Southeast Asia. Sanden Retail Systems sells the Do-Hiemon series of frozen and multi-temperature food machines in Japan. Coca-Cola Bottlers Japan, DyDo Group Holdings and Suntory Beverage Solution are the largest buyers, and their fleet plans set much of the replacement cycle. These bottlers now compete through apps such as Coke ON and Jihanpi, which raises demand for readers and connected units. Makers compete on energy use, payment flexibility, product range per cabinet and service coverage rather than on price alone.
Machine makers and bottler fleets active in the region
| Company | Type | Role in the market |
|---|---|---|
| Fuji Electric | Machine maker | Top domestic share, leading beverage share in China, Dalian plant, India entry plan |
| Sanden Retail Systems | Machine maker | Do-Hiemon frozen and multi-temperature food machine series in Japan |
| Coca-Cola Bottlers Japan | Brand-owned operator | About 650,000 machines, Coke ON app campaigns at stations |
| DyDo Group Holdings | Brand-owned operator | About 270,000 machines, HAKU buttonless pilot at Woven City |
| Suntory Beverage Solution | Brand-owned operator | Jihanpi app, about 150,000 compatible machines planned by 2025 |
Credence Research view on regional dispenser demand
Credence Research's view is that regional vending equipment demand is moving from fleet expansion toward fewer, smarter machines that sell more per site. Japan will keep shrinking its beverage fleet, but replacement buyers there now want cashless readers, telemetry and energy-saving refrigeration. China remains the largest buyer, while India and Southeast Asia offer the fastest growth because phone payment removes the cost of cash handling. Makers that combine connected controls, food and locker formats and local service should gain share, and beverage machines should still hold the 52.0% share lead in 2025 as bottlers modernize rather than abandon vending.
How the regional equipment estimate was built
The report uses 2025 as the base year and forecasts values to 2035 in USD million from the Credence Research market model. Country, product type, application, technology and customer splits are Credence Research estimates based on installed machine counts, production statistics, payment data, urban population and company announcements. Sources include the Ministry of Economy, Trade and Industry of Japan, the National Bureau of Statistics of China, the People's Bank of China, the World Bank and company releases. No interviews or surveys were conducted for this edition of the regional report.
Smart replacements and new formats carry growth to 2035
The APAC retail vending machine market is projected to grow from USD 10.33 billion in 2026 to USD 21.09 billion by 2035, an 8.25% CAGR during 2026–2035, as operators replace older machines with connected, cashless units and add food and pickup formats. Growth should be strongest in India and Southeast Asia, where phone payment is already routine and machine density is still low. Japan should add value through upgrades even as its fleet shrinks. Faster community retail programs would raise this outlook, while weaker drink sales or higher route costs would lower it.
Frequently Asked Questions
How big is the APAC retail vending machine market?
Which product type leads regional demand?
Which country leads the regional market?
How did the new yen banknotes affect machine demand?
Why are connected smart machines growing fastest?
Which application leads the market?
Who are the leading companies in the region?
What are the main challenges for machine makers?
Table of Content
Chapter 1 Market Segmentation
- 1.1 Segmentation Framework
- 1.1.1 Product and Service Classification
- 1.1.2 Application and End-Use Classification
- 1.1.3 Technology and Solution Classification
- 1.1.4 Customer and Distribution Channel Classification
- 1.1.5 Geographic Segmentation
- 1.1.6 Market Segment Definitions and Boundaries
- 1.2 By Product Type
- 1.2.1 Beverages
- 1.2.2 Food and Snacks
- 1.2.3 Non-Food Consumer Goods
- 1.2.4 Mixed Merchandise
- 1.3 By Application
- 1.3.1 Workplace Refreshment
- 1.3.2 Travel Convenience
- 1.3.3 Campus and Hospital Access
- 1.3.4 Retail and Residential Convenience
- 1.4 By Technology
- 1.4.1 Mechanical Machines
- 1.4.2 Standalone Electronic Machines
- 1.4.3 Connected Smart Machines
- 1.5 By Customer Type
- 1.5.1 Independent Vending Operators
- 1.5.2 Brand-Owned Vending Operators
- 1.5.3 Facility Owners
- 1.5.4 Retail Franchise Operators
- 1.6 By Country
- 1.6.1 Japan
- 1.6.2 China
- 1.6.3 APAC Excluding Japan and China
Chapter 2 Introduction
- 2.1 Report Objectives and Scope
- 2.2 Product Definition and Industry Terminology
- 2.3 Market Inclusions and Exclusions
- 2.4 Research Process
- 2.4.1 Primary Research and Expert Interviews
- 2.4.2 Secondary Research and Source Review
- 2.4.3 Top-Down and Bottom-Up Estimation
- 2.4.4 Data Triangulation and Verification
- 2.5 Market Size Measurement Basis
- 2.5.1 2025: USD 9.52 billion → 2035: USD 21.09 billion
- 2.6 Historical and Forecast Reference Periods
- 2.6.1 Historical Period: 2018-2025
- 2.6.2 Base Year: 2025
- 2.6.3 Forecast Period: 2025-2035
- 2.7 Research Assumptions and Limitations
Chapter 3 Executive Summary
- 3.1 Market Snapshot and Key Findings
- 3.2 Base-Year Market Size, 2025
- 3.3 Forecast Market Size, 2035
- 3.4 Revenue and Volume Growth Outlook
- 3.5 Key Demand and Supply Indicators
- 3.6 Leading Market Segments
- 3.7 Fastest-Growing Market Opportunities
- 3.8 Regional Performance Highlights
- 3.9 Technology and Industry Transformation
- 3.10 Competitive Landscape Summary
- 3.11 Analyst View and Strategic Implications
Chapter 4 APAC Retail Vending Machine Market Trends and Developments
- 4.1 Historical Industry Development, 2018-2025
- 4.2 Recent Market Trends and Developments
- 4.3 Demand and Customer Behavior Trends
- 4.4 Technology and Product Innovation
- 4.5 Artificial Intelligence, Automation and Digitalization
- 4.6 Local Manufacturing and Supply Chain Realignment
- 4.7 Industry Partnerships, Mergers and Acquisitions
- 4.8 Sustainability and Circular Economy Developments
- 4.9 Government and Private Sector Investment Trends
- 4.10 Emerging Business Models and Commercialization
- 4.11 Industry Developments and Announcements
Chapter 5 APAC Retail Vending Machine Market Production, Supply and Demand Analysis
- 5.1 Demand Trend and Consumption Analysis, 2018-2025
- 5.2 Demand Forecast, 2025-2035
- 5.3 Production and Output Trend, 2018-2025
- 5.4 Production and Output Forecast, 2025-2035
- 5.5 Installed Capacity and Capacity Utilization
- 5.6 Company-Wise Production Plants and Statistics
- 5.6.1 Installed Production Capacity
- 5.6.2 Actual Production
- 5.6.3 Planned Capacity and Expansion Targets
- 5.7 Supply Chain Structure and Procurement Trends
- 5.8 Supply-Demand Gap and Bottlenecks
- 5.9 Import Dependence and Sourcing Structure
- 5.10 Contract Manufacturing and Outsourcing
- 5.11 Regional Supply and Demand Concentration
Chapter 6 APAC Retail Vending Machine Market Pricing Analysis
- 6.1 Pricing Structure and Measurement
- 6.2 Historical Pricing Trends, 2018-2025
- 6.3 Pricing Outlook, 2025-2035
- 6.4 Average Selling Price and Unit Economics
- 6.5 Pricing by Product and Market Segment
- 6.6 Geographic Pricing Differences
- 6.7 Key Input, Energy, Labor and Logistics Costs
- 6.8 Contract Pricing and Purchasing Models
- 6.9 Pricing Sensitivity and Competitive Positioning
- 6.10 Price, Margin and Profitability Implications
Chapter 7 APAC Retail Vending Machine Market Dynamics
- 7.1 Market Growth Drivers
- 7.1.1 Demand-Side Drivers
- 7.1.2 Technology and Innovation Drivers
- 7.1.3 Infrastructure and Investment Drivers
- 7.1.4 Regulatory and Policy Drivers
- 7.2 Market Restraints
- 7.2.1 Cost and Affordability Constraints
- 7.2.2 Technology and Adoption Barriers
- 7.2.3 Supply Chain and Operational Constraints
- 7.3 Market Challenges
- 7.3.1 Competitive Pressure and Margin Erosion
- 7.3.2 Skills, Infrastructure and Implementation Gaps
- 7.4 Emerging Market Opportunities
- 7.5 Market Dynamics Impact and Time-Horizon Assessment
Chapter 8 APAC Retail Vending Machine Value Chain Analysis
- 8.1 Industry Value Chain Overview
- 8.2 Upstream Suppliers and Critical Inputs
- 8.3 Technology and Component Providers
- 8.4 Manufacturing or Service Delivery
- 8.5 Distribution, Channel Partners and Integrators
- 8.6 Downstream Applications and End Users
- 8.7 Value Addition and Profit Pools
- 8.8 Vertical Integration and Outsourcing
- 8.9 Supplier Concentration and Risk
- 8.10 Supply Chain Localization and Resilience
Chapter 9 APAC Retail Vending Machine Market Regulations and Policies
- 9.1 Relevant Laws, Standards and Compliance Frameworks
- 9.2 Product, Service, Safety and Quality Requirements
- 9.3 Government Policies, Incentives and Subsidies
- 9.4 Imports, Exports and Trade Barriers
- 9.5 Public Procurement and Local Content Requirements
- 9.6 Environmental and Sustainability Compliance
- 9.7 Upcoming Policy Changes and Market Implications
Chapter 10 APAC Retail Vending Machine Market Hotspots and Opportunities
- 10.1 Market Opportunity Mapping and Growth Hotspots
- 10.2 High-Growth Applications and Customer Groups
- 10.3 Underserved Markets and White-Space Opportunities
- 10.4 Emerging Technology and Product Opportunities
- 10.5 New Capacity and Investment Hotspots
- 10.6 Market Entry and Expansion Opportunities
- 10.7 Distribution and Partnership Opportunities
- 10.8 Near-Term and Long-Term Commercial Potential
- 10.9 Opportunity Attractiveness and Execution Risks
Chapter 11 APAC Retail Vending Machine Market Outlook, 2025-2035
- 11.1 Market Size and Analysis
- 11.1.1 Revenue (Market Measurement: 2025: USD 9.52 billion → 2035: USD 21.09 billion)
- 11.1.2 Market Volume and Quantity Sold
- 11.1.3 Historical Market Size, 2018-2025
- 11.1.4 Base-Year Market Size, 2025
- 11.2 Market Forecast, 2025-2035
- 11.2.1 Revenue Forecast to 2035
- 11.2.2 Volume Forecast to 2035
- 11.2.3 CAGR and Year-on-Year Growth
- 11.2.4 Incremental Revenue Opportunity
- 11.3 Forecast Assumptions and Scenario Analysis
- 11.3.1 Base-Case Forecast
- 11.3.2 Optimistic and Conservative Scenarios
- 11.3.3 Technology, Pricing and Policy Sensitivities
- 11.4 Market Attractiveness and Growth Outlook
Chapter 12 APAC Retail Vending Machine Market Segmentation and Outlook
- 12.1 Segmentation Summary and Market Shares, 2025
- 12.2 Largest and Fastest-Growing Segments
- 12.3 By Product Type - Market Size and Forecast, 2025-2035
- 12.3.1 Segment Definition and Scope
- 12.3.2 Historical Market Size, 2018-2025
- 12.3.3 Revenue Forecast, 2025-2035
- 12.3.4 Volume Forecast, 2025-2035
- 12.3.5 Base-Year Market Share, 2025
- 12.3.6 Segment CAGR and Growth Drivers
- 12.3.7 Subsegment Market Size and Forecast
- 12.3.7.1 Beverages
- 12.3.7.2 Food and Snacks
- 12.3.7.3 Non-Food Consumer Goods
- 12.3.7.4 Mixed Merchandise
- 12.3.8 Subsegment Pricing and Adoption Trends
- 12.3.9 Leading Suppliers and Competition
- 12.3.10 Regional Demand and Opportunities
- 12.4 By Application - Market Size and Forecast, 2025-2035
- 12.4.1 Segment Definition and Scope
- 12.4.2 Historical Market Size, 2018-2025
- 12.4.3 Revenue Forecast, 2025-2035
- 12.4.4 Volume Forecast, 2025-2035
- 12.4.5 Base-Year Market Share, 2025
- 12.4.6 Segment CAGR and Growth Drivers
- 12.4.7 Subsegment Market Size and Forecast
- 12.4.7.1 Workplace Refreshment
- 12.4.7.2 Travel Convenience
- 12.4.7.3 Campus and Hospital Access
- 12.4.7.4 Retail and Residential Convenience
- 12.4.8 Subsegment Pricing and Adoption Trends
- 12.4.9 Leading Suppliers and Competition
- 12.4.10 Regional Demand and Opportunities
- 12.5 By Technology - Market Size and Forecast, 2025-2035
- 12.5.1 Segment Definition and Scope
- 12.5.2 Historical Market Size, 2018-2025
- 12.5.3 Revenue Forecast, 2025-2035
- 12.5.4 Volume Forecast, 2025-2035
- 12.5.5 Base-Year Market Share, 2025
- 12.5.6 Segment CAGR and Growth Drivers
- 12.5.7 Subsegment Market Size and Forecast
- 12.5.7.1 Mechanical Machines
- 12.5.7.2 Standalone Electronic Machines
- 12.5.7.3 Connected Smart Machines
- 12.5.8 Subsegment Pricing and Adoption Trends
- 12.5.9 Leading Suppliers and Competition
- 12.5.10 Regional Demand and Opportunities
- 12.6 By Customer Type - Market Size and Forecast, 2025-2035
- 12.6.1 Segment Definition and Scope
- 12.6.2 Historical Market Size, 2018-2025
- 12.6.3 Revenue Forecast, 2025-2035
- 12.6.4 Volume Forecast, 2025-2035
- 12.6.5 Base-Year Market Share, 2025
- 12.6.6 Segment CAGR and Growth Drivers
- 12.6.7 Subsegment Market Size and Forecast
- 12.6.7.1 Independent Vending Operators
- 12.6.7.2 Brand-Owned Vending Operators
- 12.6.7.3 Facility Owners
- 12.6.7.4 Retail Franchise Operators
- 12.6.8 Subsegment Pricing and Adoption Trends
- 12.6.9 Leading Suppliers and Competition
- 12.6.10 Regional Demand and Opportunities
- 12.7 By Country - Market Size and Forecast, 2025-2035
- 12.7.1 Segment Definition and Scope
- 12.7.2 Historical Market Size, 2018-2025
- 12.7.3 Revenue Forecast, 2025-2035
- 12.7.4 Volume Forecast, 2025-2035
- 12.7.5 Base-Year Market Share, 2025
- 12.7.6 Segment CAGR and Growth Drivers
- 12.7.7 Subsegment Market Size and Forecast
- 12.7.7.1 Japan
- 12.7.7.2 China
- 12.7.7.3 APAC Excluding Japan and China
- 12.7.8 Subsegment Pricing and Adoption Trends
- 12.7.9 Leading Suppliers and Competition
- 12.7.10 Regional Demand and Opportunities
- 12.8 Segment Growth Comparison
- 12.9 Segment Attractiveness and Priority Matrix
Chapter 13 APAC Retail Vending Machine End-Use and Application Market Outlook
- 13.1 End-Use Industry and Customer Demand Structure
- 13.2 Leading Applications and Customer Groups
- 13.3 End-Use Market Size, Share and Forecast
- 13.4 Major End-Use Industry Deep Dives
- 13.4.1 Customer Requirements and Use Cases
- 13.4.2 Demand and Replacement Cycles
- 13.4.3 Technical and Regulatory Considerations
- 13.4.4 Purchasing and Procurement Models
- 13.4.5 Leading Vendors and Distribution Channels
- 13.4.6 Forecast and Commercial Opportunities
- 13.5 Emerging Applications and Cross-Segment Demand
- 13.6 End-Use Industry Investment Priorities
Chapter 14 APAC Retail Vending Machine Geographic Market Outlook, 2025-2035
- 14.1 Regional Market Size and Country-Level Shares, 2025
- 14.2 Country Market Size Comparison, 2025
- 14.3 Country Market Forecasts, 2025-2035
- 14.4 Subregional Industrial and Demand Clusters
- 14.5 Intra-Regional Pricing and Cost Differences
- 14.6 Cross-Border Trade and Supply Networks
- 14.7 Regional Supply and Demand Balances
- 14.8 Country Opportunity Comparison and Prioritization
Note: Every listed country is covered on the structure shown under the first country.
Chapter 15 APAC Retail Vending Machine Technology, Innovation and Sustainability Outlook
- 15.1 Technology Landscape and Maturity
- 15.2 Product, Process and Service Innovation
- 15.3 AI, Automation and Digital Tools in the Industry
- 15.4 Technology Adoption and Performance Benchmarking
- 15.5 Innovation Pipeline and R&D Investment
- 15.6 Patent and Intellectual Property Trends
- 15.7 Energy Efficiency and Resource Management
- 15.8 Sustainability, Recycling and Circularity
- 15.9 Technology Roadmap, 2025-2035
- 15.10 Risks of Obsolescence and Technology Substitution
Chapter 16 APAC Retail Vending Machine Market Key Strategic Imperatives
- 16.1 Growth and Market Entry Priorities
- 16.2 High-Return Products and Segments
- 16.3 Pricing, Profitability and Cost Optimization
- 16.4 Technology Investment and Product Differentiation
- 16.5 Supply Chain Localization and Resilience
- 16.6 Distribution and Customer Acquisition
- 16.7 Partnership, Acquisition and Capacity Strategy
- 16.8 Regional Expansion Priorities
- 16.9 Short-, Medium- and Long-Term Actions
Chapter 17 Competition Outlook
- 17.1 Industry Competition Characteristics
- 17.2 Market Structure and Concentration
- 17.3 Market Share and Competitive Positioning, 2025
- 17.4 Company-Wise Revenue and Product Benchmarking
- 17.5 Production and Service Capacity Benchmarking
- 17.6 Technology, Pricing and Differentiation
- 17.7 Regional Footprint and Distribution Strength
- 17.8 Mergers, Acquisitions and Strategic Alliances
- 17.9 New Entrants and Competitive Threats
- 17.10 Porter's Five Forces and Industry Attractiveness
- 17.11 Competitive Outlook, 2025-2035
Chapter 18 Company Profiles
- 18.1 Company Coverage and Selection Criteria
- 18.2 Coca-Cola Bottlers Japan
- 18.2.1 Business Description
- 18.2.2 Company Ownership and Geographic Presence
- 18.2.3 Product and Service Portfolio
- 18.2.4 Manufacturing and Operating Footprint
- 18.2.5 Production Capacity and Expansion Plans
- 18.2.6 Financial Performance and Investment
- 18.2.7 Market Share and Competitive Position
- 18.2.8 Technology and Innovation Capabilities
- 18.2.9 Strategic Alliances or Partnerships
- 18.2.10 Recent Developments
- 18.2.11 Growth Strategy and Outlook
- 18.3 DyDo Group Holdings
- 18.4 Suntory Beverage Solution
- 18.5 Fuji Electric
- 18.6 Sanden Retail Systems
- 18.7 Other Relevant Market Participants
Note: Every listed company is profiled on the structure shown under the first company. The company list is preliminary and may change based on research findings, market developments, data availability and client requirements.
Chapter 19 Disclaimer
- 19.1 Research and Forecast Disclaimer
- 19.2 Data Source and Estimation Limitations
Note: The depth of individual sections depends on data availability for this market. Volume, capacity, trade and other unit-based metrics are included where applicable.

