
Premium toothpaste and rural brushing lift regional demand
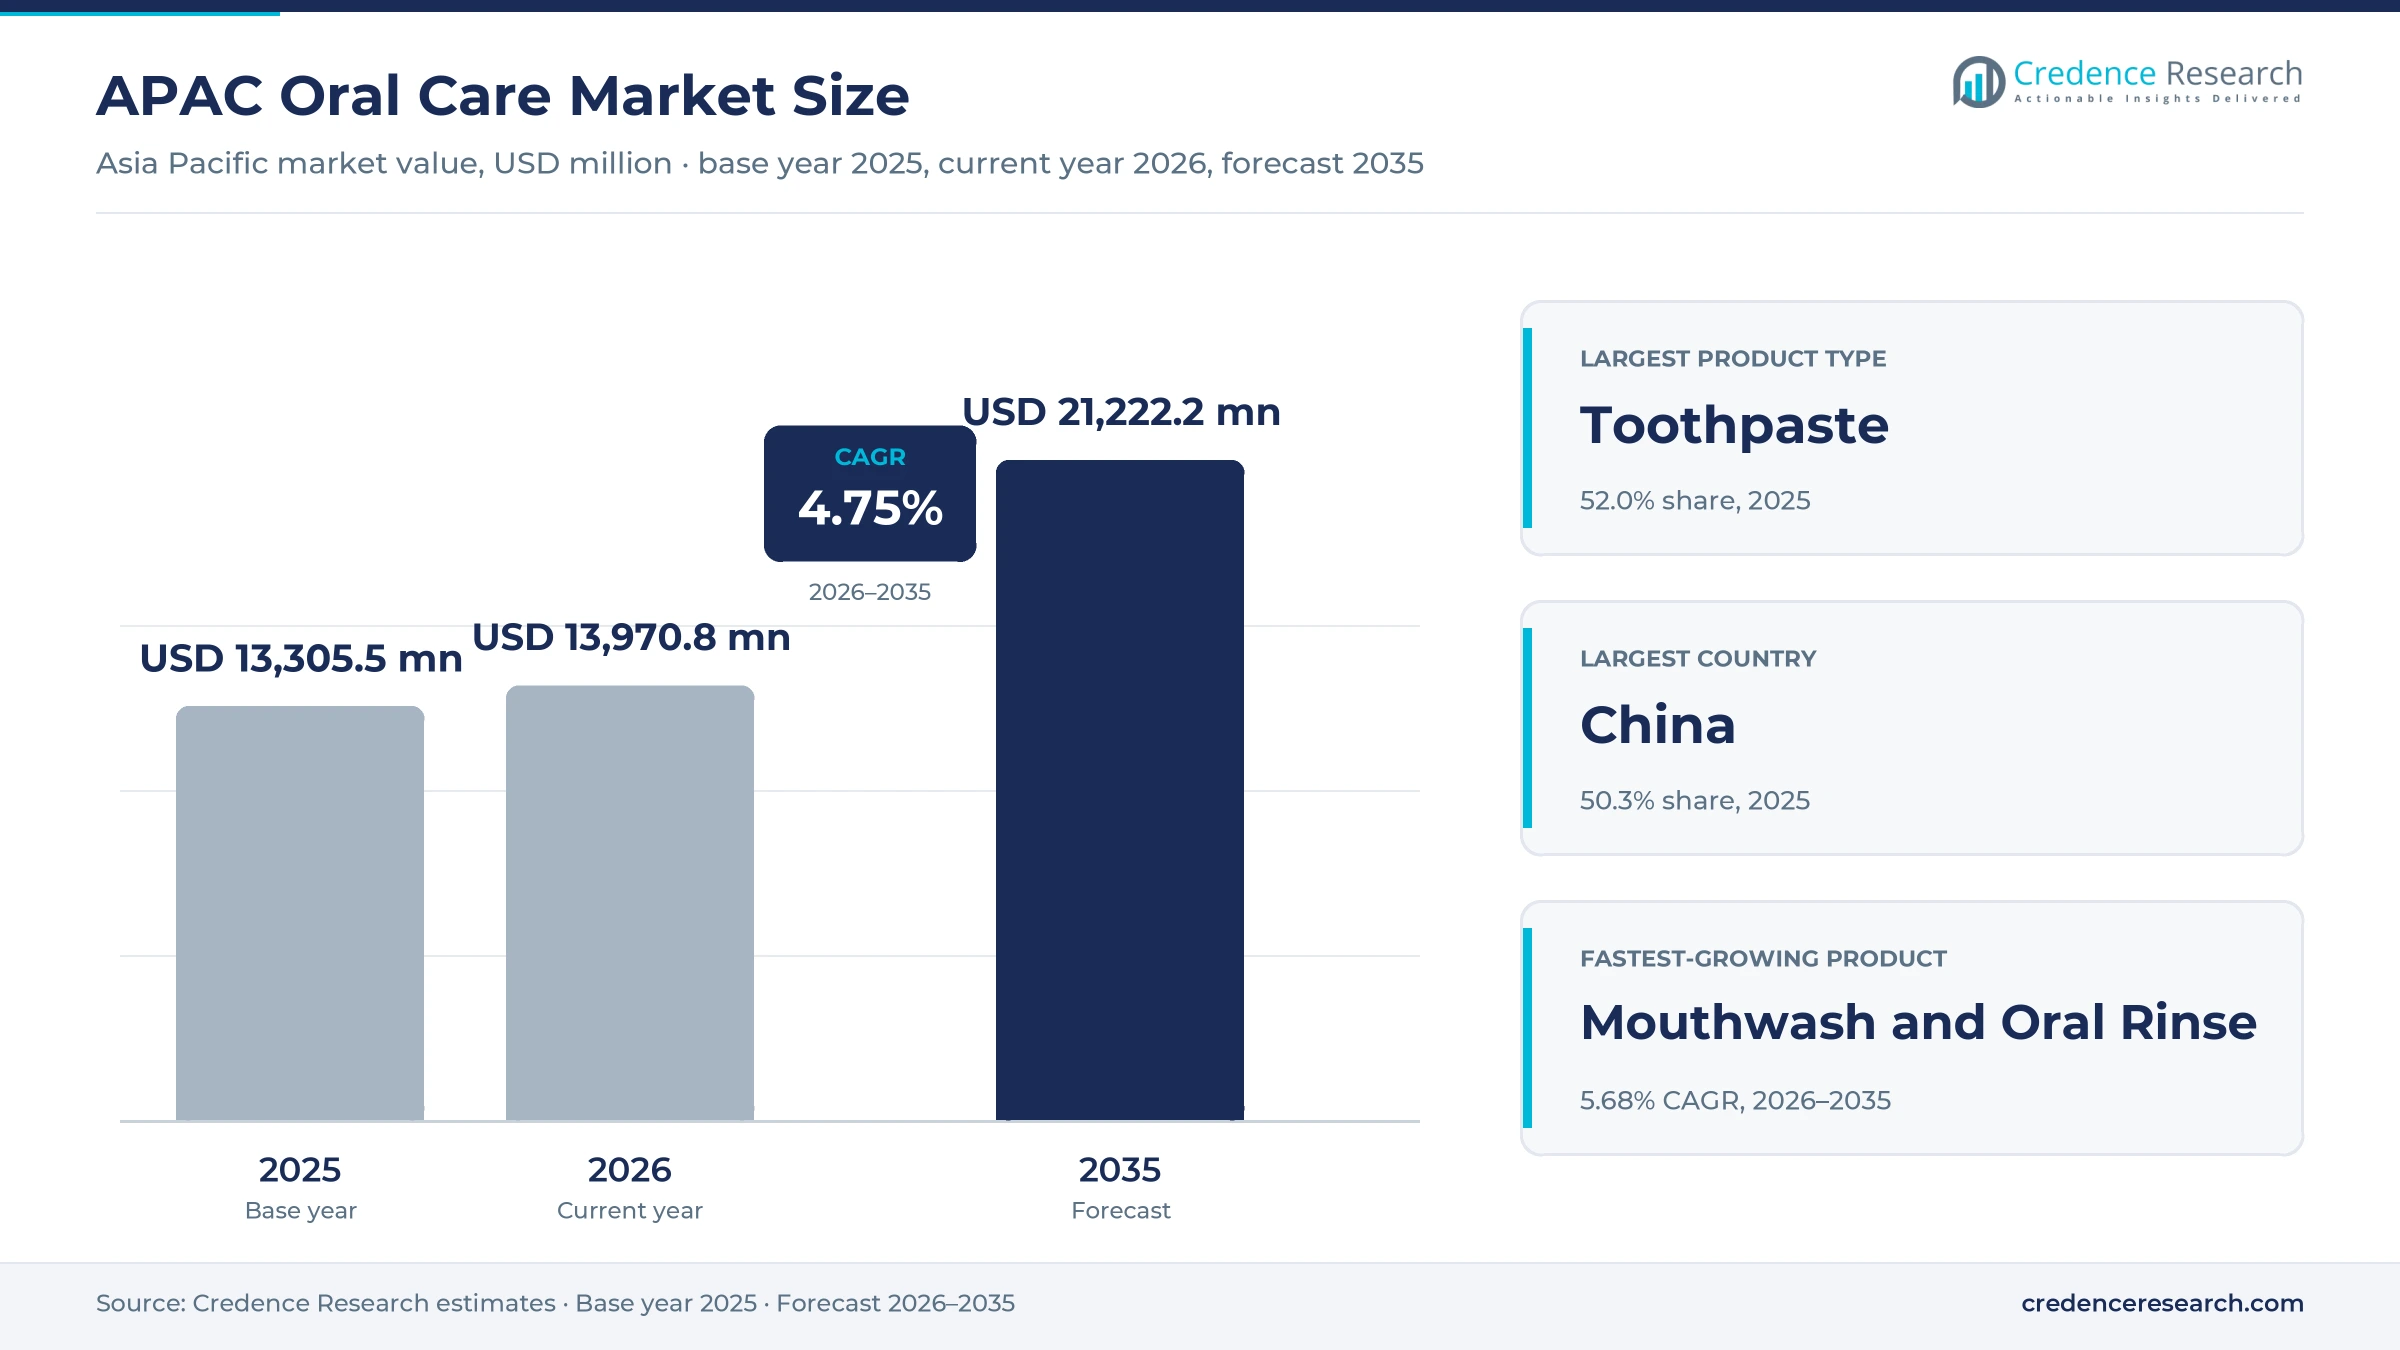
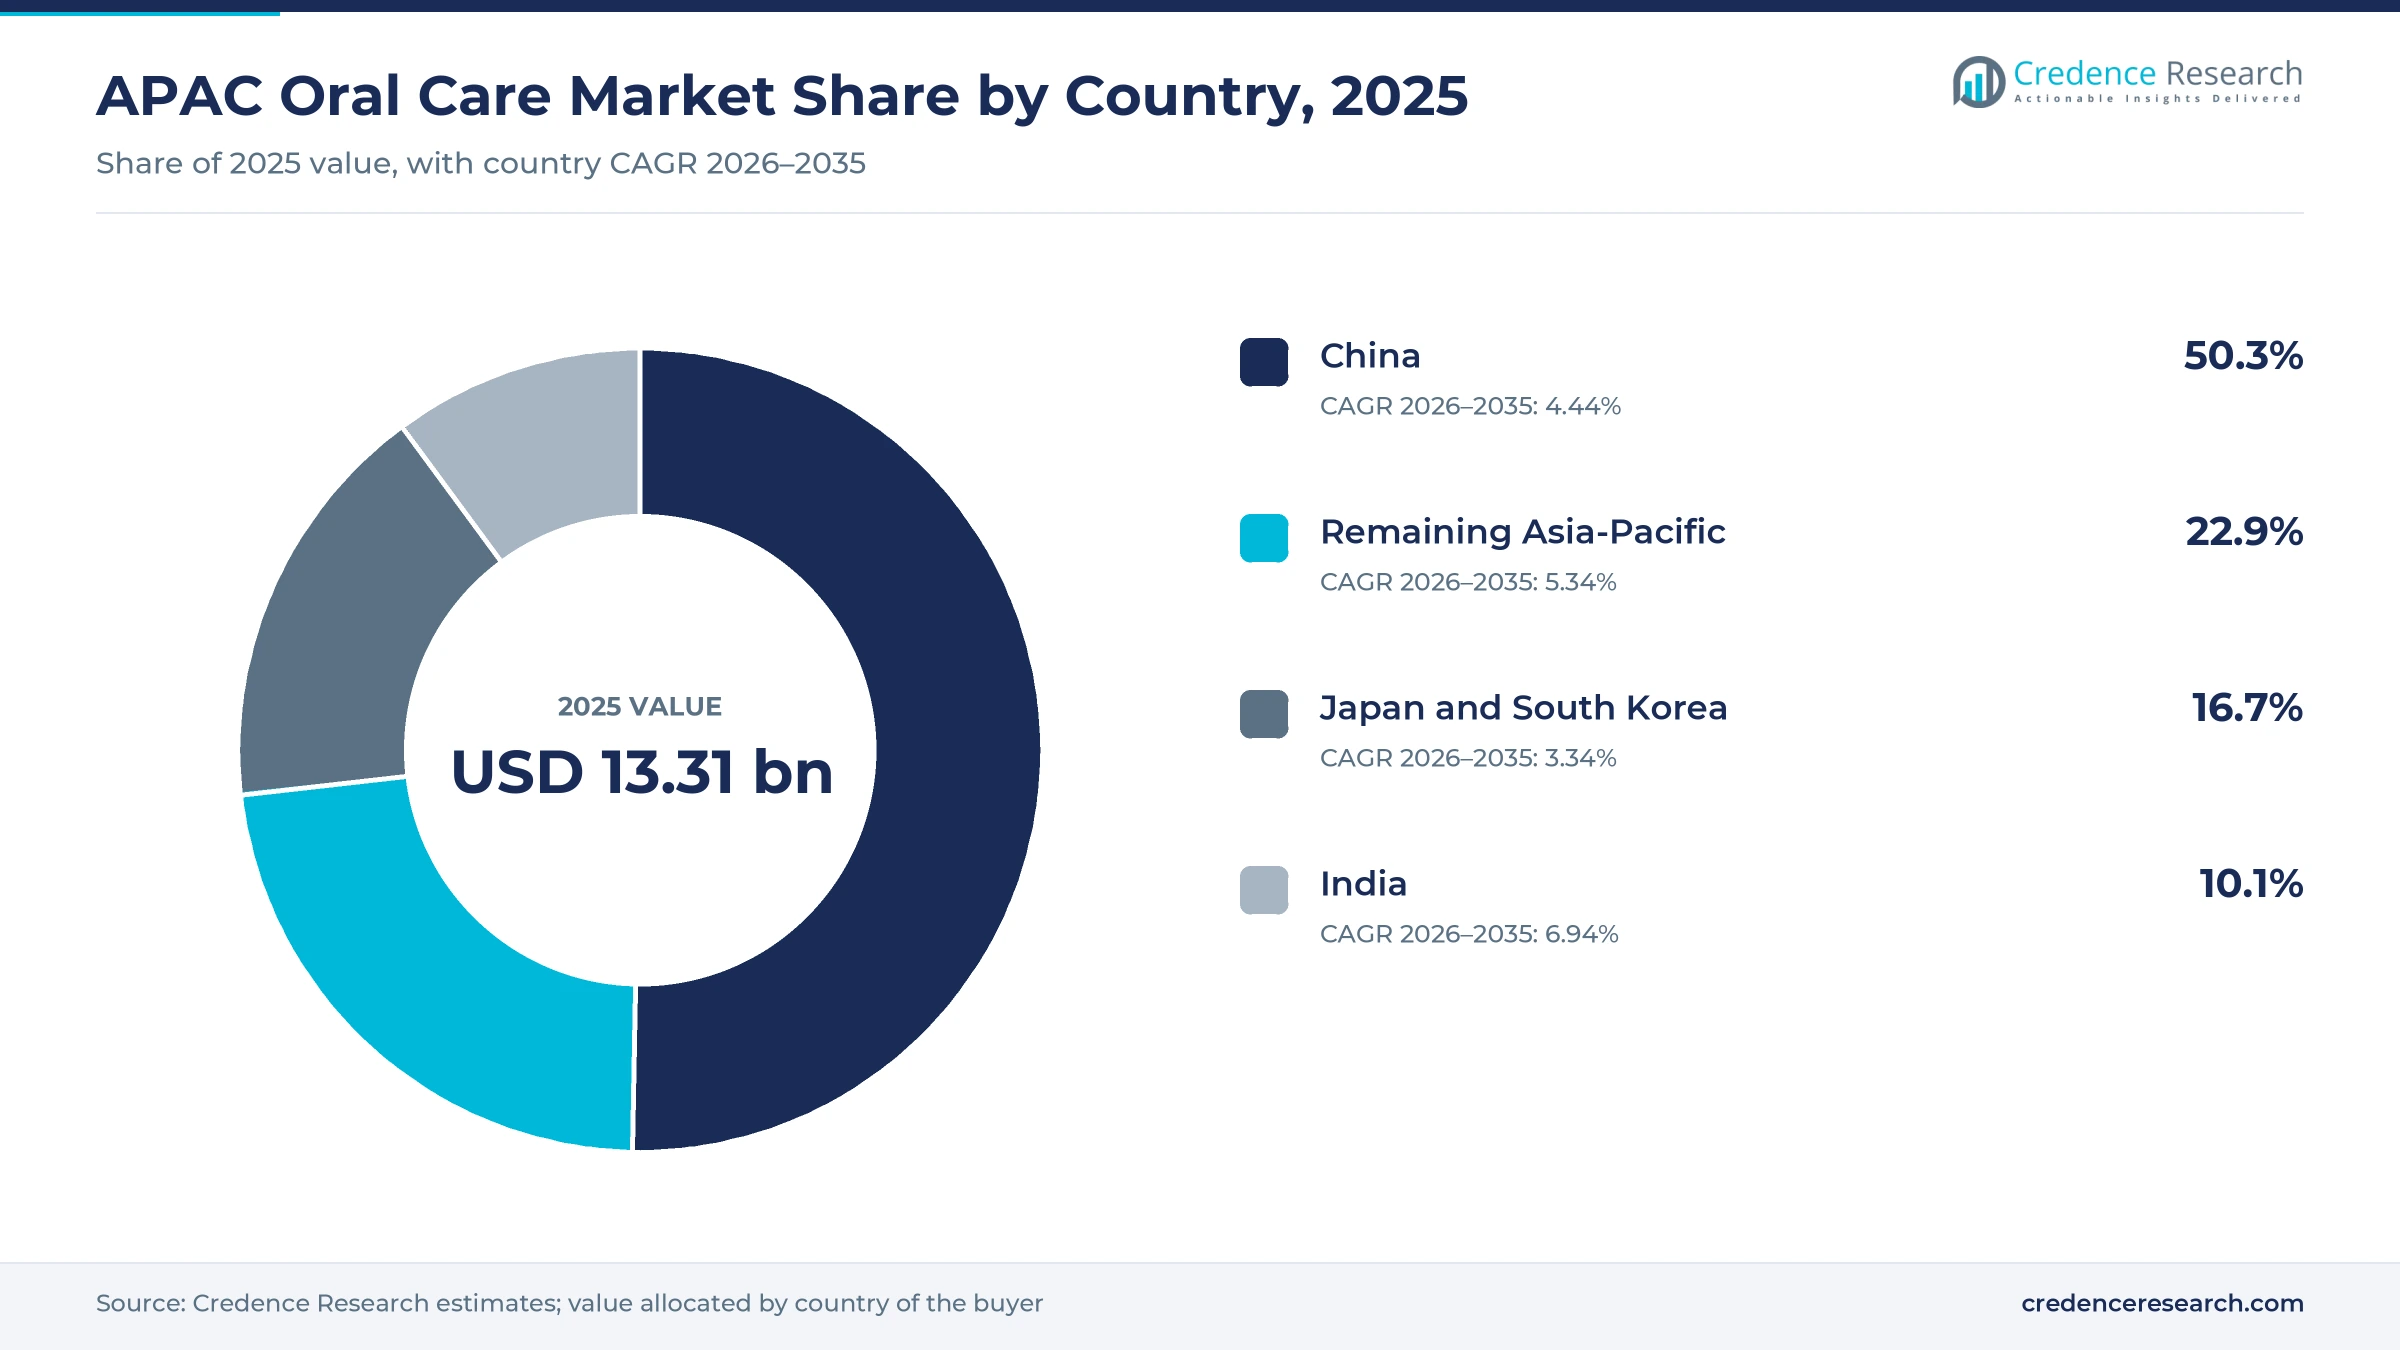
The APAC oral care market was valued at USD 13.31 billion in 2025 and is projected to increase from USD 13.97 billion in 2026 to USD 21.22 billion by 2035, registering a CAGR of 4.75% during 2026–2035. Demand comes from households that buy toothpaste and brushes every month, from older buyers who need gum and sensitivity care, and from younger urban shoppers who trade up to whitening formulas and powered brushes. China held the largest country share, 50.3% in 2025, because Chinese brands and global groups sell large volumes through stores and social commerce platforms. India is the fastest-growing country at 6.94% a year, as rural households adopt daily brushing and lower taxes cut shelf prices. Japan and South Korea add steady value from aging buyers who use floss, rinses and dentist-recommended products. Tax rules are also changing, because India cut the goods and services tax on toothpaste and toothbrushes from 18% to 5% in September 2025.
Which mouth hygiene products does the regional estimate cover?
The estimate measures retail spending on toothpaste, manual and powered toothbrushes, mouthwash and oral rinses, and complementary products such as dental floss, interdental brushes, breath sprays and denture care across the Asia Pacific region. It covers purchases by households, hotels and public health programs, and values are measured at the price paid in shops, pharmacies, online stores and dental clinics.
The estimate excludes professional dental treatment, clinical equipment, prescription drugs and teeth whitening done in dental offices. The value chain runs from chemical, abrasive and plastic suppliers through toothpaste and brush plants to distributors, general trade stores, supermarkets, pharmacies, e-commerce platforms and dentists that sell to buyers in China, Japan and South Korea, India and the rest of the region.
APAC Oral Care Market Insights
- The APAC oral care market was valued at USD 13.31 billion in 2025 and is projected to reach USD 21.22 billion by 2035, registering a CAGR of 4.75% during 2026–2035.
- China held a 50.3% share of 2025 value, while online oral care sales on key Chinese platforms rose 9.8% in the first half of 2024.
- Toothpaste led product demand with a 52.0% share of 2025 value, because households in every country of the region buy it routinely.
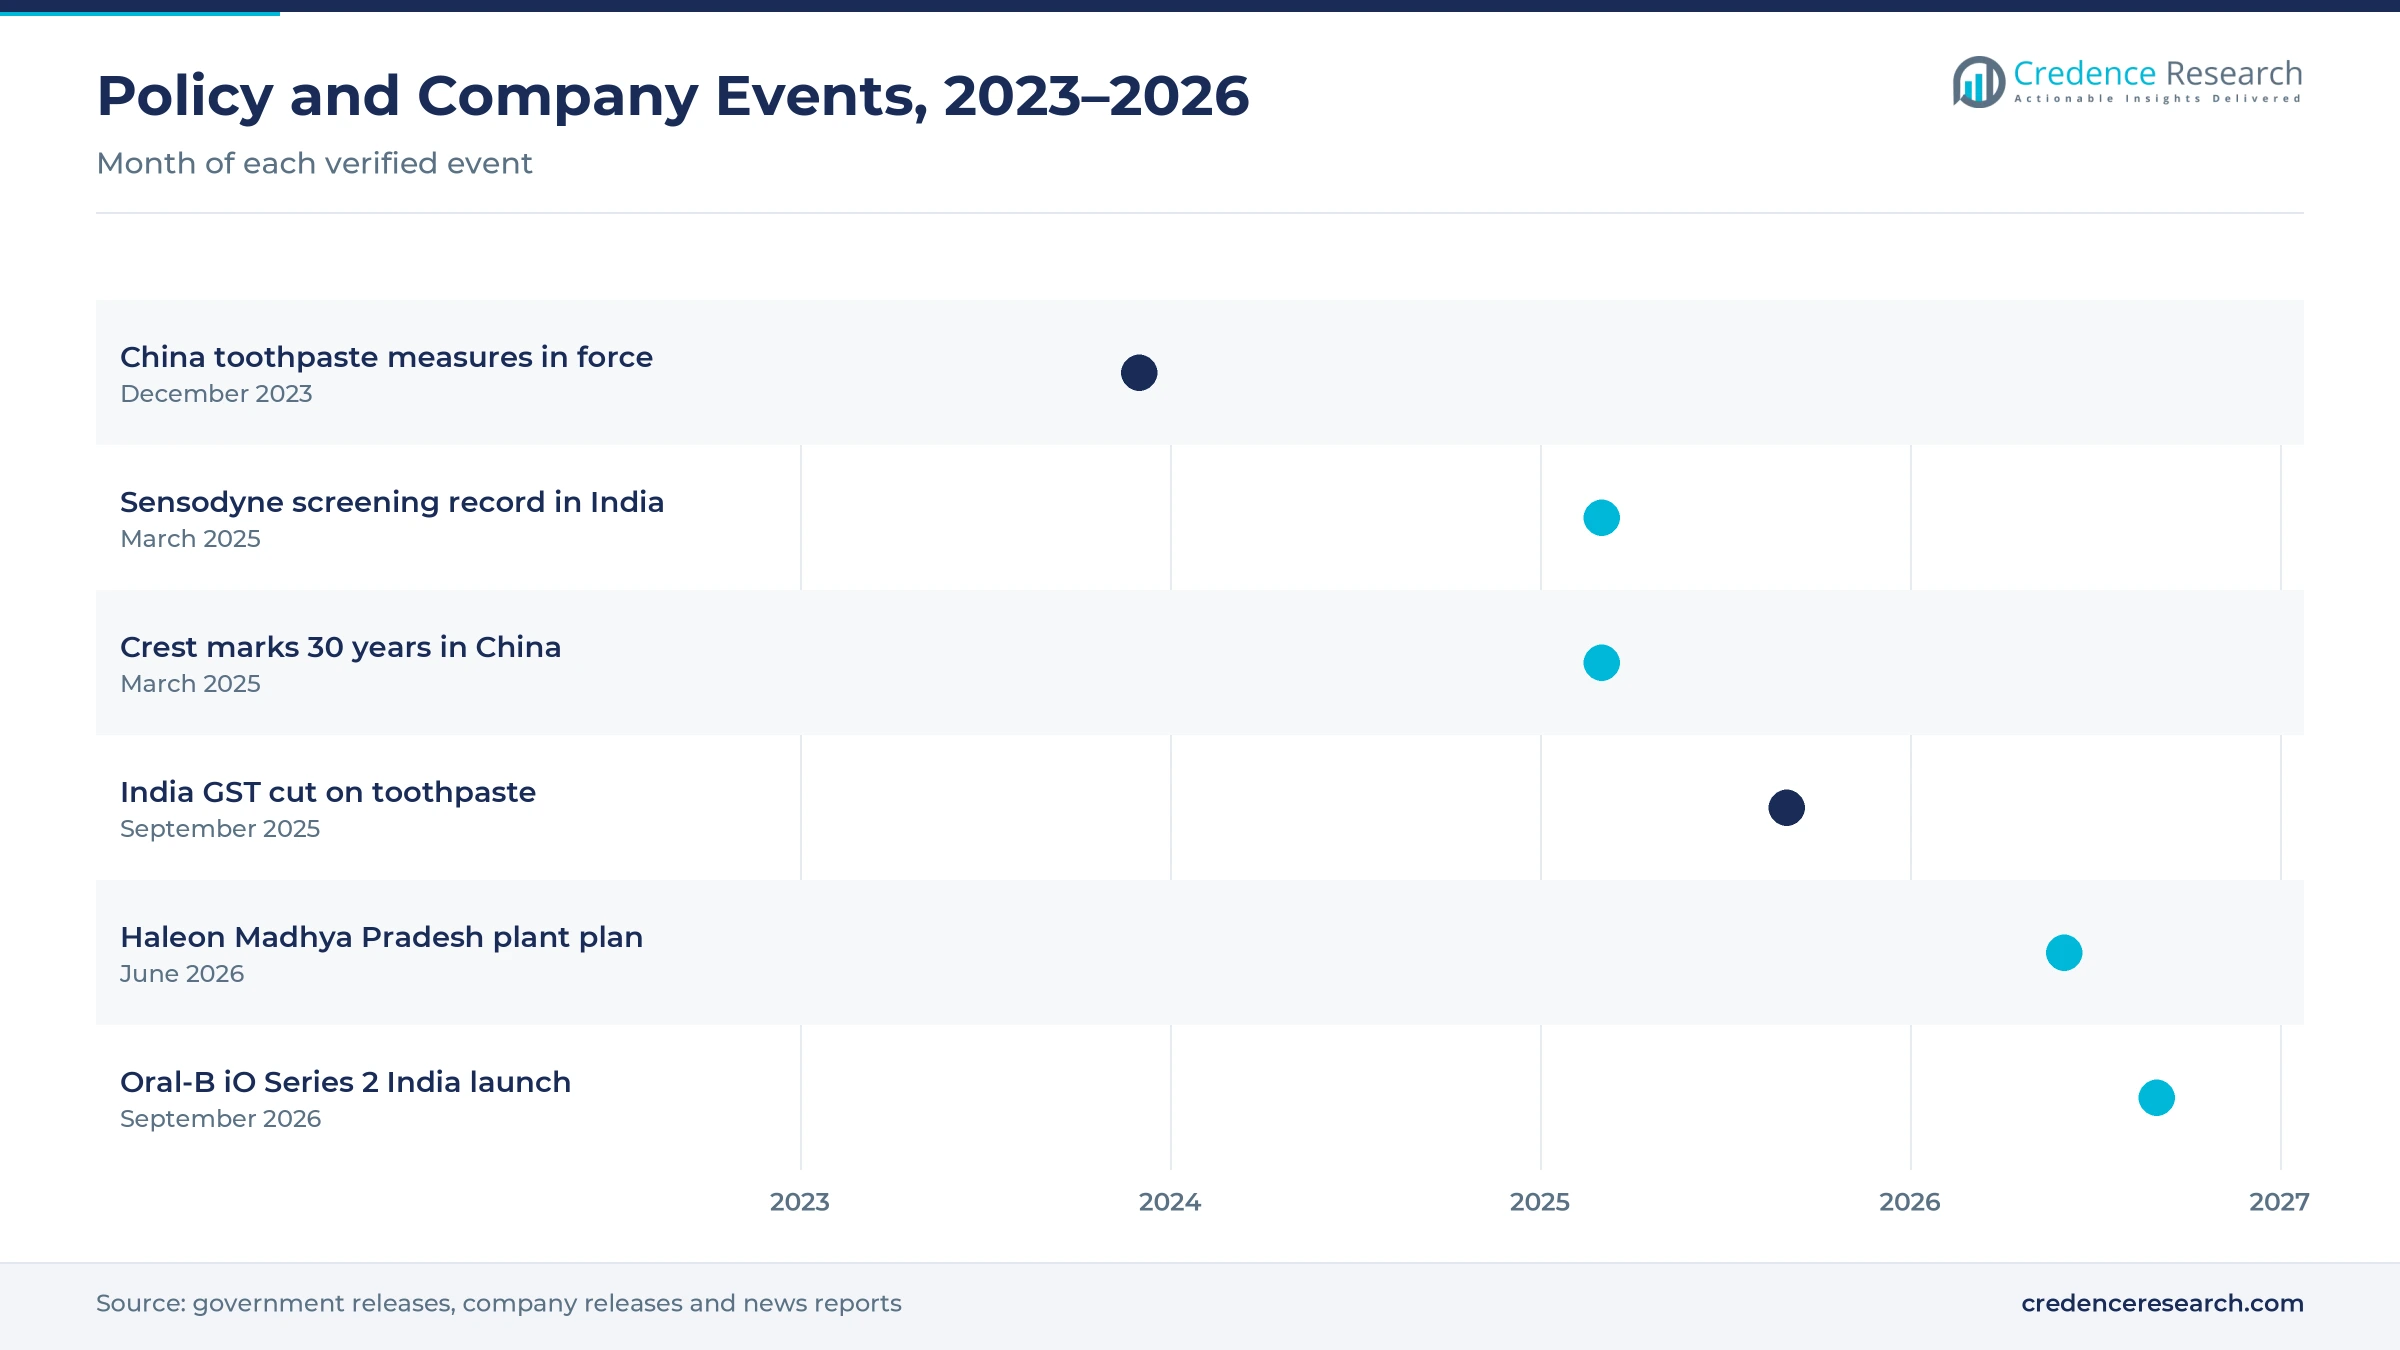
- India cut the goods and services tax on toothpaste and toothbrushes from 18% to 5% in September 2025, which lowers shelf prices for buyers.
- Haleon announced in June 2026 an investment of about 175 million pounds in a new oral health plant in Madhya Pradesh, India.
Toothpaste leads while mouthwash and rinses grow fastest
Why does toothpaste dominate product demand?
Based on product type, the market is categorized into toothpaste, toothbrushes, mouthwash and oral rinse, and complementary oral care. Toothpaste led with a 52.0% share of 2025 value, because households buy tubes every month and brands add gum care and whitening formulas. Mouthwash and Oral Rinse grows fastest at 5.68% a year, as urban buyers in China, Japan and South Korea add rinses and sprays to daily routines.
How do mainstream and premium formulas shape price tiers?
Based on price tier, the market is categorized into economy, mainstream and premium. Mainstream led with a 46.0% share of 2025 value, because family packs from large brands fill most shopping baskets in China and India. Premium grows fastest at 5.88% a year, as buyers pay more for sensitivity, gum care and whitening claims, while small economy packs keep first-time rural users in the market.
Why do grocery and general trade stores lead distribution?
Based on distribution channel, the market is categorized into grocery and general trade, pharmacies and health stores, e-commerce and direct and professional channels. Grocery and General Trade led with a 50.0% share of 2025 value, because small shops and supermarkets sell most tubes and brushes. E-Commerce grows fastest at 6.20% a year, as Chinese shoppers buy through livestream and short-video platforms.
How does routine replenishment lead purchase occasions?
Based on purchase occasion, the market is categorized into routine replenishment, targeted care initiation, aesthetic upgrade and travel and gifting. Routine Replenishment led with a 64.0% share of 2025 value, because households replace toothpaste and brushes on a regular cycle. Aesthetic Upgrade grows fastest at 5.69% a year, as younger buyers choose whitening formulas and powered brushes to improve their smiles.
| Segment Group | Leading Sub-segment | Share, 2025 | Fastest-growing Sub-segment | CAGR, 2026–2035 |
|---|---|---|---|---|
| By Product Type | Toothpaste | 52.0% | Mouthwash and Oral Rinse | 5.68% |
| By Price Tier | Mainstream | 46.0% | Premium | 5.88% |
| By Distribution Channel | Grocery and General Trade | 50.0% | E-Commerce | 6.20% |
| By Purchase Occasion | Routine Replenishment | 64.0% | Aesthetic Upgrade | 5.69% |
Request a Free Sample
Fill in your details and we'll send you a free sample report.
- Sample data tables & charts
- Research methodology
Premium formulas, wider reach and new routines drive sales
How does specialized toothpaste lift the value of each tube?
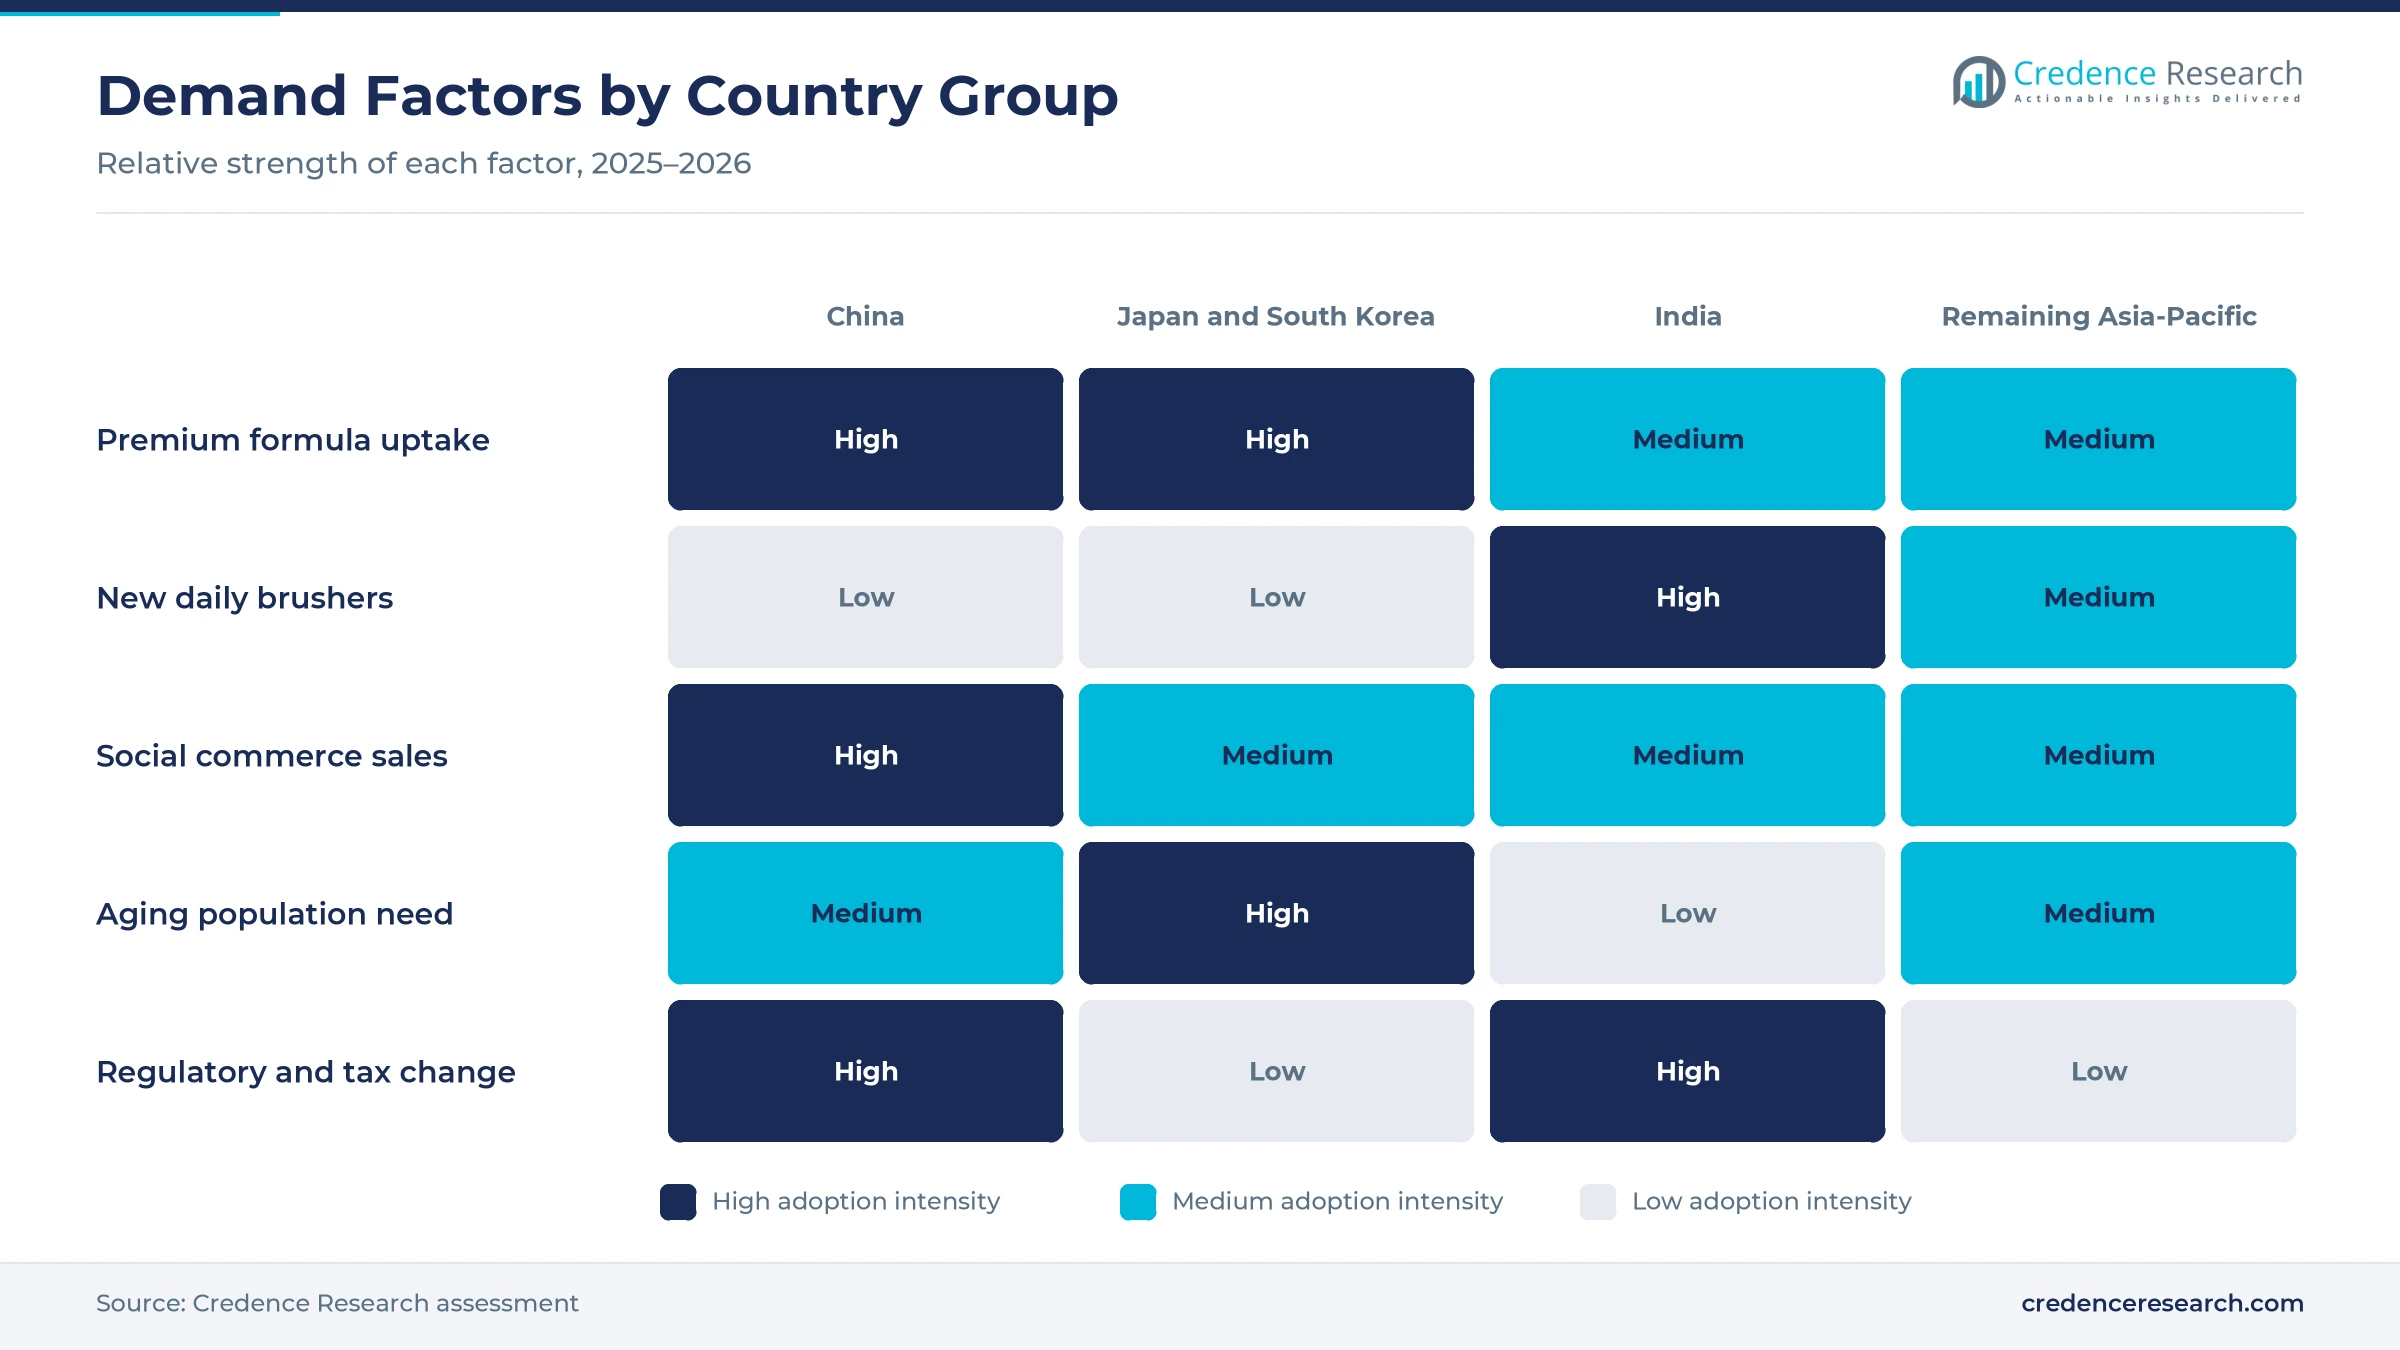
Buyers across the region are moving from basic fluoride pastes to gum care, whitening and sensitivity formulas, which raises the value of each tube sold. In China, gum care products held 28.9% of offline toothpaste sales in the first half of 2023, whitening held 23.9% and sensitivity relief held 11.4%, according to ChemLinked. Lion said its toothpaste unit price in Japan rose 52% from 2014 to 2024, well above the market average. Hindustan Unilever also said on July 28, 2026, that Closeup White Now, Pepsodent Gum Care and Sensitive Care continued to gain traction. As a result, premium products grow at 5.88% a year, and demand for sensitive toothpaste keeps rising in large cities.
How do established brands widen daily brushing habits?
Large brand owners are pushing into rural towns with low-priced packs, which turns occasional users into regular buyers. Colgate-Palmolive India said in its annual report that only about 20% of urban consumers brush twice a day, and that around 55% of rural households do not brush daily. Haleon sells Sensodyne in 20-rupee packs and plans to reach more than 3 million Indian outlets by 2030, according to Oral Health Group. India also cut the goods and services tax on toothpaste and toothbrushes from 18% to 5%, All India Radio reported on Sept. 23, 2025. In turn, routine replenishment remains the largest purchase occasion, with a 64.0% share of 2025 value.
Why do floss, rinses and sprays broaden household baskets?
Consumers are adding floss, mouthwash and breath sprays to their routines, which raises spending per household beyond toothpaste and brushes. Lion said frequent dental floss use in Japan rose from 13% to 30% between 2014 and 2024, while the share of people who see a dentist twice a year or more rose from 25% to 38%. China Daily reported that oral spray sales on key Chinese e-commerce platforms rose 15% in the first half of 2024, citing the China Oral Care Industry Association. Japan's 2022 Survey of Dental Diseases also found that 47.9% of people had periodontal pockets of four millimeters or more. As a result, mouthwash and oral rinse grows fastest among product types at 5.68% a year.
How do disease burden and aging raise hygiene needs?
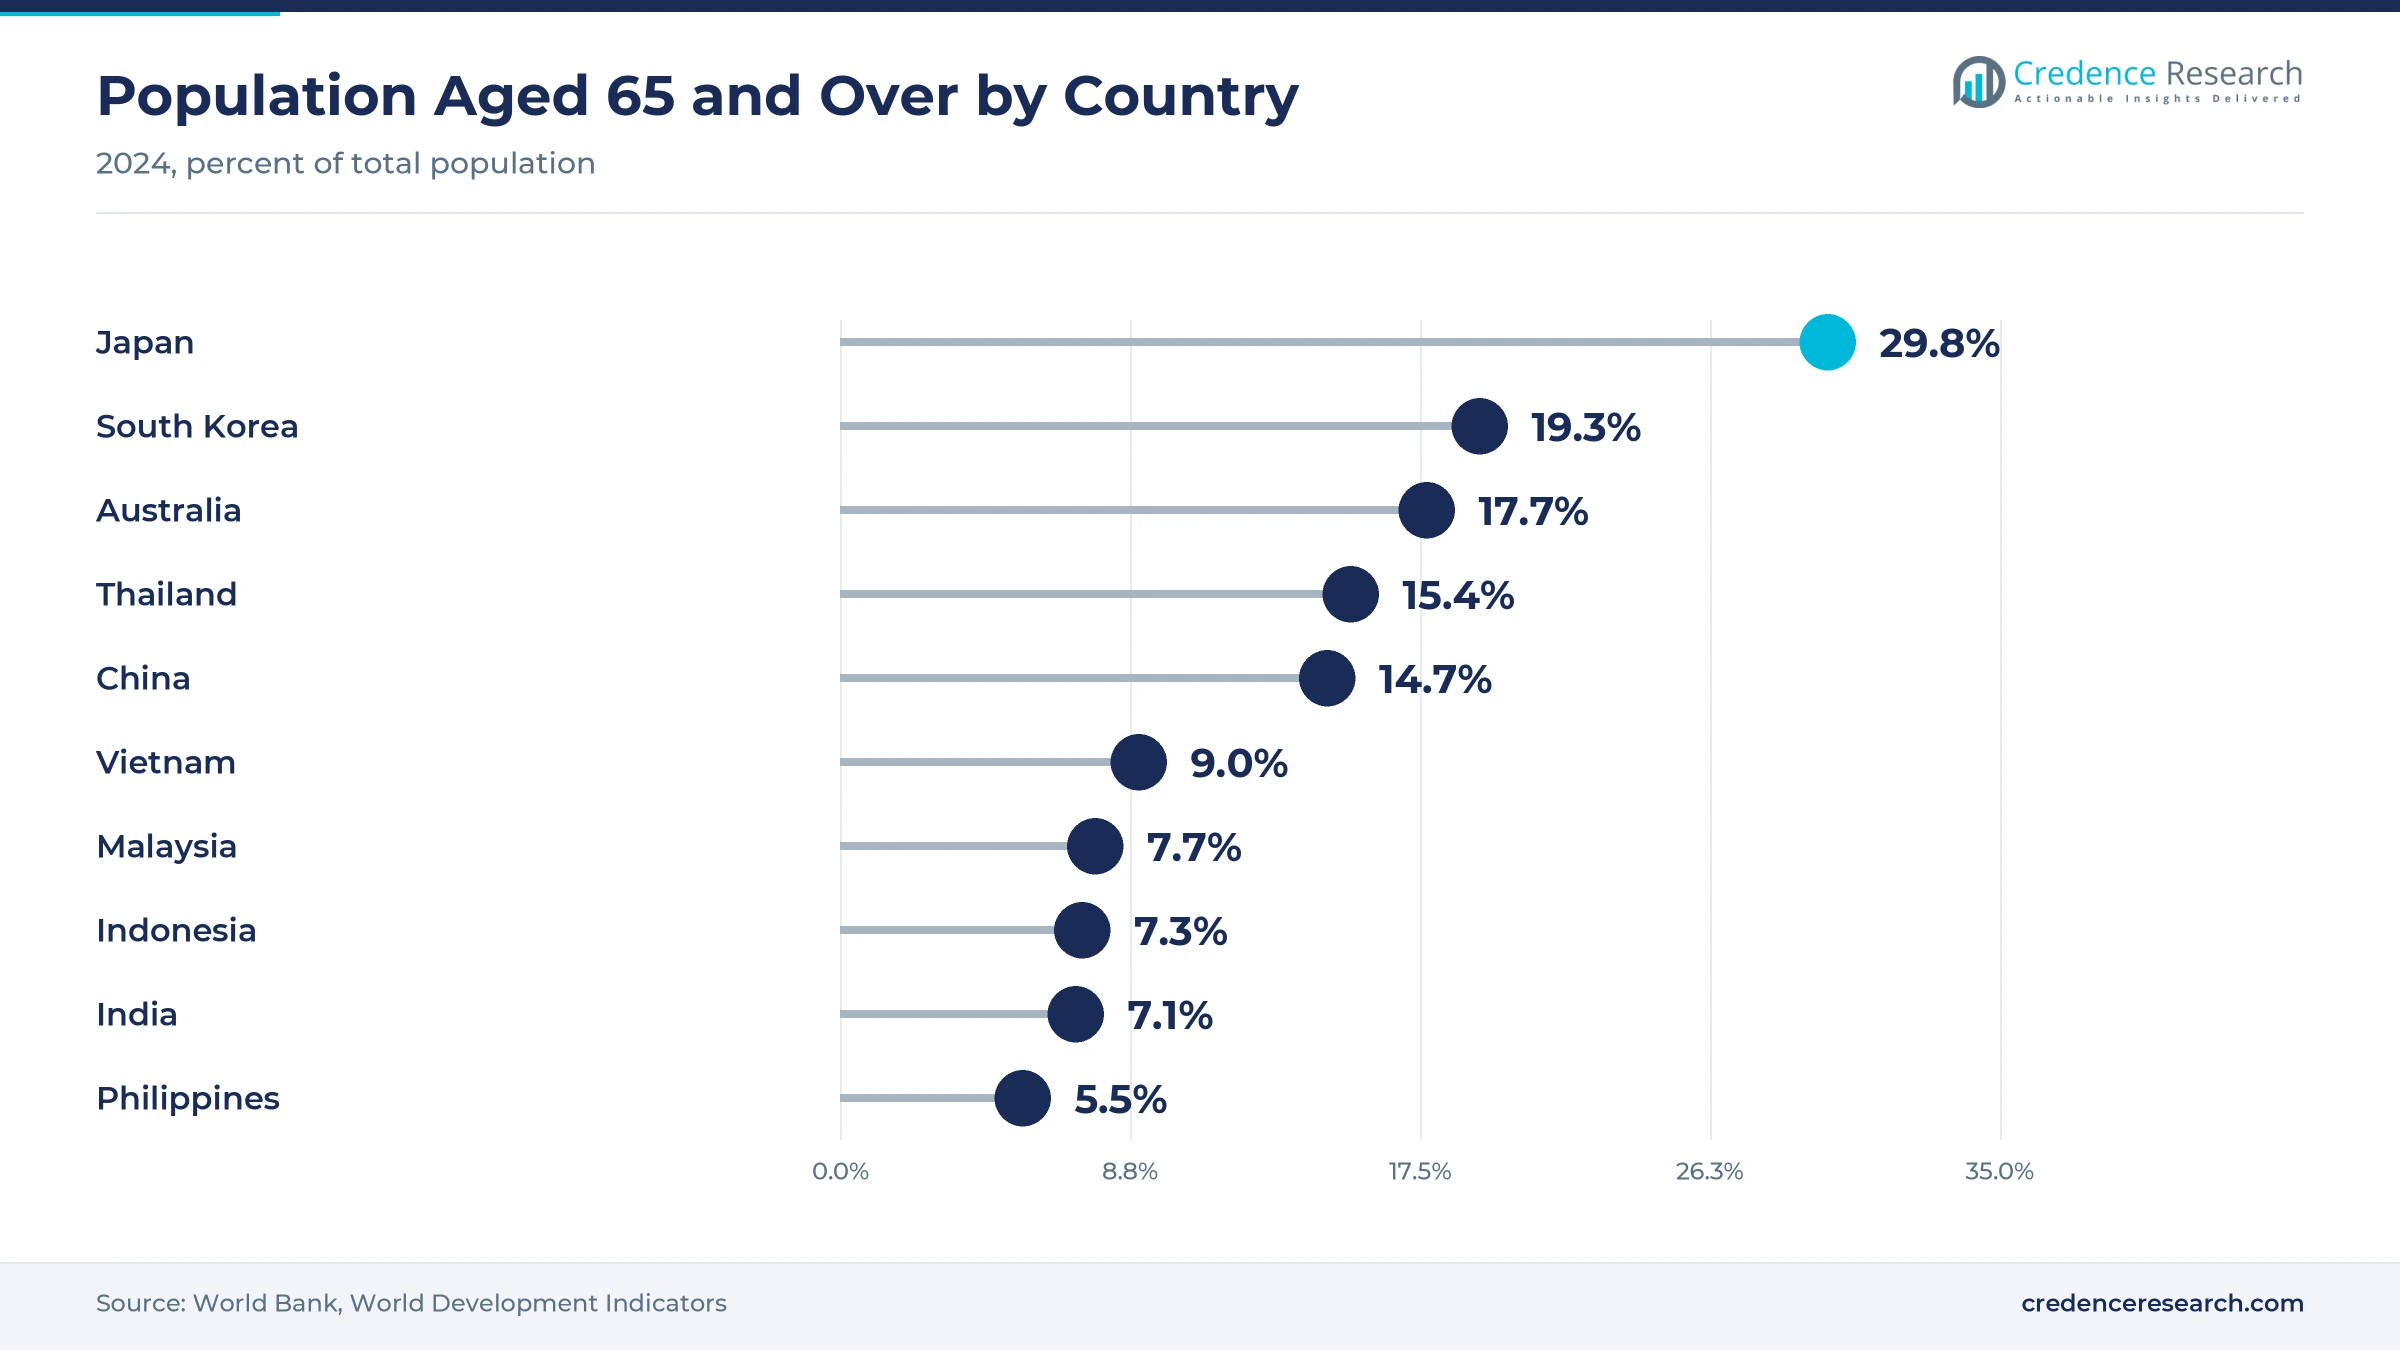
A large untreated disease burden and fast population aging keep mouth hygiene on public health agendas across the region. The World Health Organization estimated in November 2022 that oral diseases affect about 3.5 billion people worldwide, including 2.5 billion with untreated caries. China's National Health Commission set a goal in 2019 to cut caries among 12-year-olds from 34.5% to under 30% by 2025. People aged 65 and over made up 29.8% of Japan's population and 19.3% of South Korea's in 2024, according to World Bank data. In turn, older buyers need gum care, sensitivity and denture products, which supports targeted care purchases across the forecast.
Social commerce, powered brushes and rural reach
How is the shift to social commerce reshaping toothpaste sales?
Chinese shoppers increasingly buy toothpaste through livestream and short-video platforms, which changes how brands launch and price products. China Daily reported that online retail sales of oral care products on key Chinese platforms reached 13.37 billion yuan in the first half of 2024, up 9.8% from a year earlier. Online sales of toothpaste and tooth powder rose 16.7% over the same period. ChemLinked also reported that Douyin holds the largest share of any toothpaste channel and grows at more than 60%. Lion said it sells toothpaste and toothbrushes in China mainly through e-commerce. As a result, e-commerce grows fastest among distribution channels at 6.20% a year.
How is the rise of powered brushing changing toothbrush demand?
Brand owners are bringing lower-priced powered brushes to mass markets, which moves buyers from manual brushes to devices with replacement heads. Procter & Gamble launched the Oral-B iO Series 2 in India on Sept. 12, 2026, exclusively on Flipkart, at prices from 2,449 to 2,999 rupees, Fonearena reported. The brush uses a magnetic drive, a pressure sensor and a two-minute timer, features that earlier came only on costlier iO models. The company also claims that its round head removes up to 100% more plaque than a manual brush. In turn, demand for electric toothbrushes lifts aesthetic upgrade purchases, which grow fastest among occasions at 5.69% a year.
Can rural India open room for new daily users?
Rural India offers a large opening because many households still do not brush every day and dentists are scarce. About 65% of India's population lives in rural areas across more than 650,000 villages, and one dentist may serve as many as 250,000 people in some rural communities, Haleon said in June 2026. The company plans to invest about 175 million pounds in a new plant in Madhya Pradesh, which is expected to open in early 2028 and add up to 500 jobs. Its Sensodyne brand also ran 27,396 online dental screenings in one day at Maha Kumbh 2025, The Week reported. As a result, India gains share of regional value across the forecast period.
Is there an opening in dentist-led gum and sensitivity care?
Dentist-led prevention opens room for gum care and sensitivity products sold through clinics and pharmacies. South Korea's National Health Insurance has covered one scaling a year for adults over 19 since 2013, and the share of people who had scaling in the past year rose from 33.9% in 2013 to 42.6% in 2015, according to a study published on PubMed Central. China's oral health plan also aims to raise the average number of remaining teeth among people aged 65 to 74 from 22.5 to 24 by 2025. Lion also runs an oral healthcare habit service for patients of Japanese dental clinics. In turn, targeted care can gain value as dentists recommend products alongside the dental consumables they use in clinics.
Filing rules, slow mature markets and low rural use
How do China's toothpaste rules raise filing costs?
China's Administrative Measures on Toothpaste took effect on Dec. 1, 2023, and require domestic products to be filed with provincial drug regulators and imported products with the National Medical Products Administration. Efficacy claims such as gum care or whitening must also rest on a sufficient scientific basis, ChemLinked reported. As a result, smaller brands face higher testing and filing costs before launch. Producers respond by focusing on fewer, better-tested claims and by building test data early.
Why do mature markets slow regional growth?
Japan and South Korea already have high brushing rates and aging, shrinking populations, which limits volume growth. Lion's 2025 business outline put domestic oral care sales growth at 3.3% a year from 2021 to 2024, and it set market growth in China at 1.9% a year over the same period. As a result, brands must win value through higher-priced formulas rather than more tubes. Producers respond with mid-priced and premium lines, floss and rinses that raise spending per person.
How does low rural usage hold back India?
Many rural buyers in India still brush irregularly, which limits volume even though the market is large. Colgate-Palmolive India said in its annual report that per capita toothpaste use still remains low in India, which keeps volume per household below that of richer markets. As a result, brands must spend more on education, sampling and small packs before sales grow. Companies respond with dental vans, school programs and 20-rupee packs that lower the cost of trying a product.
Why does price competition squeeze margins in China?
Chinese brands compete hard with global groups on price and promotions, which limits room for price increases. Six of the top 10 online toothpaste brands in the first eight months of 2023 were Chinese, according to the China Oral Care Industry Association, and Yunnan Baiyao ranked first in online toothpaste sales. As a result, livestream discounts on Douyin push down average selling prices. Brands respond with efficacy claims, gift sets and new formats that justify higher prices.
China leads while India grows fastest in the region
| Country | Value, 2025 (USD billion) | Share, 2025 | CAGR, 2026–2035 |
|---|---|---|---|
| China | 6.69 | 50.3% | 4.44% |
| Remaining Asia-Pacific | 3.05 | 22.9% | 5.34% |
| Japan and South Korea | 2.22 | 16.7% | 3.34% |
| India | 1.34 | 10.1% | 6.94% |
Why does China keep the largest share of regional value?
China held a 50.3% share of 2025 value and grows at 4.44% a year, because its large population buys toothpaste through stores and fast-growing social commerce platforms. Online oral care sales on key platforms reached 13.37 billion yuan in the first half of 2024, China Daily reported. Yunnan Baiyao held a 25% share of offline toothpaste sales in the first half of 2023, while Procter & Gamble marked 30 years of Crest in China in 2025. However, new filing rules raise testing costs for smaller local and imported brands.
How do aging buyers shape Japan and South Korea?
Japan and South Korea held a 16.7% share of 2025 value and grow at 3.34% a year, because high brushing rates and shrinking populations limit volume. People aged 65 and over made up 29.8% of Japan's population in 2024, and Japan's 8020 achievement rate reached 51.6% in the 2022 dental survey. South Korea has covered annual scaling for adults since 2013. As a result, value growth comes from gum care, floss, rinses and dentist-recommended products.
Why is India the fastest-growing market in the region?
India held a 10.1% share of 2025 value and grows fastest at 6.94% a year, because many rural households are still adopting daily brushing. The toothpaste category is worth about 18,000 crore rupees and grew at 5.3% a year over five years, according to Colgate-Palmolive India. The national tax cut on toothpaste and toothbrushes in September 2025 also lowered shelf prices for households in small towns and villages across the country.
Which forces shape demand across the remaining markets?
Remaining Asia-Pacific held a 22.9% share of 2025 value and grows at 5.34% a year, because Indonesia, Vietnam and the Philippines add young first-time buyers while Australia and Thailand buy more sensitivity and denture care. People aged 65 and over made up 17.7% of Australia's population and 15.4% of Thailand's in 2024, against 5.5% in the Philippines. In turn, brands sell small, low-priced packs in the younger markets and gum care lines in the older ones, which balances growth across the group.
Tax cuts, plant plans and brush launches, 2023 to 2026
| Development | Status and market relevance |
|---|---|
| In December 2023, China's Administrative Measures on Toothpaste took effect and required product filing before sale. | Raises testing and filing work for efficacy claims |
| In March 2025, Sensodyne completed 27,396 online dental screenings in one day at Maha Kumbh 2025 in India. | Builds awareness of tooth sensitivity care |
| In September 2025, India cut the goods and services tax on toothpaste and toothbrushes from 18% to 5%. | Lowers shelf prices for Indian households |
| In June 2026, Haleon announced an investment of about 175 million pounds in an oral health plant in Madhya Pradesh. | Plant expected to open in early 2028 |
| In September 2026, Procter & Gamble launched the Oral-B iO Series 2 powered brush in India on Flipkart. | Brings magnetic drive brushing to lower price points |
Proven claims, magnetic brushes and small packs
- Efficacy testing supports gum care, whitening and sensitivity claims, which China now requires before toothpaste reaches the market.
- Magnetic drive brushes reduce noise and add pressure sensors and timers, which brings premium brushing features to lower price points.
- Small low-priced packs let first-time buyers try sensitivity toothpaste for 20 rupees, which widens reach in rural India.
- Livestream selling on Douyin and other short-video platforms lets brands launch products quickly and reach younger shoppers.
Need a Custom Version of This Report?
Tailor the scope, geography, or segments to your exact requirements.
- Custom geography or segment scope
- Direct access to our analyst team
Global groups and Chinese brands vie on efficacy and reach
Competition combines global consumer health and personal care groups with strong Chinese brands that sell through both stores and social commerce. Colgate-Palmolive India calls Colgate the most penetrated consumer brand in India, reaching nine of ten households. Unilever competes through Hindustan Unilever with Closeup and Pepsodent, where premium gum care and whitening lines gained traction in 2026. Procter & Gamble sells Crest in China, where 2025 marked its 30th year, and Oral-B powered brushes in India. Haleon builds Sensodyne and parodontax with small packs, screening campaigns and a planned Indian plant. Yunnan Baiyao ranked first in online toothpaste sales in China in 2023. Companies compete on efficacy claims, price tiers, rural reach and digital sales, while new filing rules in China favor brands with strong testing.
Companies profiled and their roles in this market
| Company | Type | Role in the market |
|---|---|---|
| Colgate-Palmolive Company | Global oral care group | Reaches nine of ten Indian households with Colgate toothpaste |
| Unilever PLC | Global personal care group | Sells Closeup and Pepsodent through Hindustan Unilever in India |
| The Procter & Gamble Company | Global consumer goods group | Sells Crest in China and launched the Oral-B iO2 in India |
| Haleon plc | Consumer health group | Plans a new Indian plant and sells 20-rupee Sensodyne packs |
| Yunnan Baiyao Group Co., Ltd. | Chinese health products group | Held 25% of offline toothpaste sales in China in H1 2023 |
Credence Research view on regional mouth hygiene spending
Credence Research's view is that mouth hygiene spending in the Asia Pacific region will grow at a steady pace, because premium formulas and new rural buyers outweigh slow volume in mature markets. Toothpaste keeps the largest product share, while mouthwash and oral rinse grows fastest as routines widen. China stays the largest market, while India grows fastest as daily brushing spreads and lower taxes cut prices. However, filing rules in China and price competition on Douyin will test margins. Brands that combine proven claims, small packs and strong digital sales should gain share.
How the regional toothpaste and brush estimate was built
The report uses 2025 as the base year on a calendar basis, and market values come from the Credence Research model. That model combines population and health statistics, tax rules, regulatory notices and company information on products, prices, channels and capacity. Segment splits and country growth rates are Credence Research estimates, while country shares follow the Credence Research regional model. Sources used are official statistics, government releases, international agency reports, industry association data, company reports and news reports, and no interviews or surveys were used.
India and premium formulas carry growth to 2035
APAC oral care value is expected to reach USD 21.22 billion by 2035, a 4.75% CAGR during 2026–2035, as India and premium formulas carry growth. Growth should stay moderate in China while brands adjust to filing rules and online price competition. After that, new rural users in India, wider use of rinses and floss, and more powered brushes should add value each year. Faster rural adoption would raise this outlook, while weaker consumer spending in China would lower it.
Frequently Asked Questions
How big is the APAC oral care market?
Which product type leads regional demand?
Which country leads the regional market?
How did India's tax change affect toothpaste prices?
Why are premium formulas gaining share?
Which channel grows fastest?
Who are the leading companies in the region?
What are the main challenges for producers?
Table of Content
Chapter 1 Market Segmentation
- 1.1 Segmentation Framework
- 1.1.1 Product and Service Classification
- 1.1.2 Application and End-Use Classification
- 1.1.3 Technology and Solution Classification
- 1.1.4 Customer and Distribution Channel Classification
- 1.1.5 Geographic Segmentation
- 1.1.6 Market Segment Definitions and Boundaries
- 1.2 By Product Type
- 1.2.1 Toothpaste
- 1.2.2 Toothbrushes
- 1.2.3 Mouthwash and Oral Rinse
- 1.2.4 Complementary Oral Care
- 1.3 By Price Tier
- 1.3.1 Economy
- 1.3.2 Mainstream
- 1.3.3 Premium
- 1.4 By Purchase Occasion
- 1.4.1 Routine Replenishment
- 1.4.2 Targeted Care Initiation
- 1.4.3 Aesthetic Upgrade
- 1.4.4 Travel and Gifting
- 1.5 By Country
- 1.5.1 China
- 1.5.2 Japan and South Korea
- 1.5.3 India
- 1.5.4 Remaining Asia-Pacific
Chapter 2 Introduction
- 2.1 Report Objectives and Scope
- 2.2 Product Definition and Industry Terminology
- 2.3 Market Inclusions and Exclusions
- 2.4 Research Process
- 2.4.1 Primary Research and Expert Interviews
- 2.4.2 Secondary Research and Source Review
- 2.4.3 Top-Down and Bottom-Up Estimation
- 2.4.4 Data Triangulation and Verification
- 2.5 Market Size Measurement Basis
- 2.5.1 2025: USD 13.31 billion → 2035: USD 21.22 billion
- 2.6 Historical and Forecast Reference Periods
- 2.6.1 Historical Period: 2018-2025
- 2.6.2 Base Year: 2025
- 2.6.3 Forecast Period: 2025-2035
- 2.7 Research Assumptions and Limitations
Chapter 3 Executive Summary
- 3.1 Market Snapshot and Key Findings
- 3.2 Base-Year Market Size, 2025
- 3.3 Forecast Market Size, 2035
- 3.4 Revenue and Volume Growth Outlook
- 3.5 Key Demand and Supply Indicators
- 3.6 Leading Market Segments
- 3.7 Fastest-Growing Market Opportunities
- 3.8 Regional Performance Highlights
- 3.9 Technology and Industry Transformation
- 3.10 Competitive Landscape Summary
- 3.11 Analyst View and Strategic Implications
Chapter 4 APAC Oral Care Market Trends and Developments
- 4.1 Historical Industry Development, 2018-2025
- 4.2 Recent Market Trends and Developments
- 4.3 Demand and Customer Behavior Trends
- 4.4 Technology and Product Innovation
- 4.5 Artificial Intelligence, Automation and Digitalization
- 4.6 Local Manufacturing and Supply Chain Realignment
- 4.7 Industry Partnerships, Mergers and Acquisitions
- 4.8 Sustainability and Circular Economy Developments
- 4.9 Government and Private Sector Investment Trends
- 4.10 Emerging Business Models and Commercialization
- 4.11 Industry Developments and Announcements
Chapter 5 APAC Oral Care Market Production, Supply and Demand Analysis
- 5.1 Demand Trend and Consumption Analysis, 2018-2025
- 5.2 Demand Forecast, 2025-2035
- 5.3 Production and Output Trend, 2018-2025
- 5.4 Production and Output Forecast, 2025-2035
- 5.5 Installed Capacity and Capacity Utilization
- 5.6 Company-Wise Production Plants and Statistics
- 5.6.1 Installed Production Capacity
- 5.6.2 Actual Production
- 5.6.3 Planned Capacity and Expansion Targets
- 5.7 Supply Chain Structure and Procurement Trends
- 5.8 Supply-Demand Gap and Bottlenecks
- 5.9 Import Dependence and Sourcing Structure
- 5.10 Contract Manufacturing and Outsourcing
- 5.11 Regional Supply and Demand Concentration
Chapter 6 APAC Oral Care Market Pricing Analysis
- 6.1 Pricing Structure and Measurement
- 6.2 Historical Pricing Trends, 2018-2025
- 6.3 Pricing Outlook, 2025-2035
- 6.4 Average Selling Price and Unit Economics
- 6.5 Pricing by Product and Market Segment
- 6.6 Geographic Pricing Differences
- 6.7 Key Input, Energy, Labor and Logistics Costs
- 6.8 Contract Pricing and Purchasing Models
- 6.9 Pricing Sensitivity and Competitive Positioning
- 6.10 Price, Margin and Profitability Implications
Chapter 7 APAC Oral Care Market Dynamics
- 7.1 Market Growth Drivers
- 7.1.1 Demand-Side Drivers
- 7.1.2 Technology and Innovation Drivers
- 7.1.3 Infrastructure and Investment Drivers
- 7.1.4 Regulatory and Policy Drivers
- 7.2 Market Restraints
- 7.2.1 Cost and Affordability Constraints
- 7.2.2 Technology and Adoption Barriers
- 7.2.3 Supply Chain and Operational Constraints
- 7.3 Market Challenges
- 7.3.1 Competitive Pressure and Margin Erosion
- 7.3.2 Skills, Infrastructure and Implementation Gaps
- 7.4 Emerging Market Opportunities
- 7.5 Market Dynamics Impact and Time-Horizon Assessment
Chapter 8 APAC Oral Care Value Chain Analysis
- 8.1 Industry Value Chain Overview
- 8.2 Upstream Suppliers and Critical Inputs
- 8.3 Technology and Component Providers
- 8.4 Manufacturing or Service Delivery
- 8.5 Distribution, Channel Partners and Integrators
- 8.6 Downstream Applications and End Users
- 8.7 Value Addition and Profit Pools
- 8.8 Vertical Integration and Outsourcing
- 8.9 Supplier Concentration and Risk
- 8.10 Supply Chain Localization and Resilience
Chapter 9 APAC Oral Care Market Regulations and Policies
- 9.1 Relevant Laws, Standards and Compliance Frameworks
- 9.2 Product, Service, Safety and Quality Requirements
- 9.3 Government Policies, Incentives and Subsidies
- 9.4 Imports, Exports and Trade Barriers
- 9.5 Public Procurement and Local Content Requirements
- 9.6 Environmental and Sustainability Compliance
- 9.7 Upcoming Policy Changes and Market Implications
Chapter 10 APAC Oral Care Market Hotspots and Opportunities
- 10.1 Market Opportunity Mapping and Growth Hotspots
- 10.2 High-Growth Applications and Customer Groups
- 10.3 Underserved Markets and White-Space Opportunities
- 10.4 Emerging Technology and Product Opportunities
- 10.5 New Capacity and Investment Hotspots
- 10.6 Market Entry and Expansion Opportunities
- 10.7 Distribution and Partnership Opportunities
- 10.8 Near-Term and Long-Term Commercial Potential
- 10.9 Opportunity Attractiveness and Execution Risks
Chapter 11 APAC Oral Care Market Outlook, 2025-2035
- 11.1 Market Size and Analysis
- 11.1.1 Revenue (Market Measurement: 2025: USD 13.31 billion → 2035: USD 21.22 billion)
- 11.1.2 Market Volume and Quantity Sold
- 11.1.3 Historical Market Size, 2018-2025
- 11.1.4 Base-Year Market Size, 2025
- 11.2 Market Forecast, 2025-2035
- 11.2.1 Revenue Forecast to 2035
- 11.2.2 Volume Forecast to 2035
- 11.2.3 CAGR and Year-on-Year Growth
- 11.2.4 Incremental Revenue Opportunity
- 11.3 Forecast Assumptions and Scenario Analysis
- 11.3.1 Base-Case Forecast
- 11.3.2 Optimistic and Conservative Scenarios
- 11.3.3 Technology, Pricing and Policy Sensitivities
- 11.4 Market Attractiveness and Growth Outlook
Chapter 12 APAC Oral Care Market Segmentation and Outlook
- 12.1 Segmentation Summary and Market Shares, 2025
- 12.2 Largest and Fastest-Growing Segments
- 12.3 By Product Type - Market Size and Forecast, 2025-2035
- 12.3.1 Segment Definition and Scope
- 12.3.2 Historical Market Size, 2018-2025
- 12.3.3 Revenue Forecast, 2025-2035
- 12.3.4 Volume Forecast, 2025-2035
- 12.3.5 Base-Year Market Share, 2025
- 12.3.6 Segment CAGR and Growth Drivers
- 12.3.7 Subsegment Market Size and Forecast
- 12.3.7.1 Toothpaste
- 12.3.7.2 Toothbrushes
- 12.3.7.3 Mouthwash and Oral Rinse
- 12.3.7.4 Complementary Oral Care
- 12.3.8 Subsegment Pricing and Adoption Trends
- 12.3.9 Leading Suppliers and Competition
- 12.3.10 Regional Demand and Opportunities
- 12.4 By Price Tier - Market Size and Forecast, 2025-2035
- 12.4.1 Segment Definition and Scope
- 12.4.2 Historical Market Size, 2018-2025
- 12.4.3 Revenue Forecast, 2025-2035
- 12.4.4 Volume Forecast, 2025-2035
- 12.4.5 Base-Year Market Share, 2025
- 12.4.6 Segment CAGR and Growth Drivers
- 12.4.7 Subsegment Market Size and Forecast
- 12.4.7.1 Economy
- 12.4.7.2 Mainstream
- 12.4.7.3 Premium
- 12.4.8 Subsegment Pricing and Adoption Trends
- 12.4.9 Leading Suppliers and Competition
- 12.4.10 Regional Demand and Opportunities
- 12.5 By Purchase Occasion - Market Size and Forecast, 2025-2035
- 12.5.1 Segment Definition and Scope
- 12.5.2 Historical Market Size, 2018-2025
- 12.5.3 Revenue Forecast, 2025-2035
- 12.5.4 Volume Forecast, 2025-2035
- 12.5.5 Base-Year Market Share, 2025
- 12.5.6 Segment CAGR and Growth Drivers
- 12.5.7 Subsegment Market Size and Forecast
- 12.5.7.1 Routine Replenishment
- 12.5.7.2 Targeted Care Initiation
- 12.5.7.3 Aesthetic Upgrade
- 12.5.7.4 Travel and Gifting
- 12.5.8 Subsegment Pricing and Adoption Trends
- 12.5.9 Leading Suppliers and Competition
- 12.5.10 Regional Demand and Opportunities
- 12.6 By Country - Market Size and Forecast, 2025-2035
- 12.6.1 Segment Definition and Scope
- 12.6.2 Historical Market Size, 2018-2025
- 12.6.3 Revenue Forecast, 2025-2035
- 12.6.4 Volume Forecast, 2025-2035
- 12.6.5 Base-Year Market Share, 2025
- 12.6.6 Segment CAGR and Growth Drivers
- 12.6.7 Subsegment Market Size and Forecast
- 12.6.7.1 China
- 12.6.7.2 Japan and South Korea
- 12.6.7.3 India
- 12.6.7.4 Remaining Asia-Pacific
- 12.6.8 Subsegment Pricing and Adoption Trends
- 12.6.9 Leading Suppliers and Competition
- 12.6.10 Regional Demand and Opportunities
- 12.7 Segment Growth Comparison
- 12.8 Segment Attractiveness and Priority Matrix
Chapter 13 APAC Oral Care Geographic Market Outlook, 2025-2035
- 13.1 Regional Market Size and Country-Level Shares, 2025
- 13.2 Country Market Size Comparison, 2025
- 13.3 Country Market Forecasts, 2025-2035
- 13.4 Subregional Industrial and Demand Clusters
- 13.5 Intra-Regional Pricing and Cost Differences
- 13.6 Cross-Border Trade and Supply Networks
- 13.7 Regional Supply and Demand Balances
- 13.8 Country Opportunity Comparison and Prioritization
Note: Every listed country is covered on the structure shown under the first country.
Chapter 14 APAC Oral Care Technology, Innovation and Sustainability Outlook
- 14.1 Technology Landscape and Maturity
- 14.2 Product, Process and Service Innovation
- 14.3 AI, Automation and Digital Tools in the Industry
- 14.4 Technology Adoption and Performance Benchmarking
- 14.5 Innovation Pipeline and R&D Investment
- 14.6 Patent and Intellectual Property Trends
- 14.7 Energy Efficiency and Resource Management
- 14.8 Sustainability, Recycling and Circularity
- 14.9 Technology Roadmap, 2025-2035
- 14.10 Risks of Obsolescence and Technology Substitution
Chapter 15 APAC Oral Care Market Key Strategic Imperatives
- 15.1 Growth and Market Entry Priorities
- 15.2 High-Return Products and Segments
- 15.3 Pricing, Profitability and Cost Optimization
- 15.4 Technology Investment and Product Differentiation
- 15.5 Supply Chain Localization and Resilience
- 15.6 Distribution and Customer Acquisition
- 15.7 Partnership, Acquisition and Capacity Strategy
- 15.8 Regional Expansion Priorities
- 15.9 Short-, Medium- and Long-Term Actions
Chapter 16 Competition Outlook
- 16.1 Industry Competition Characteristics
- 16.2 Market Structure and Concentration
- 16.3 Market Share and Competitive Positioning, 2025
- 16.4 Company-Wise Revenue and Product Benchmarking
- 16.5 Production and Service Capacity Benchmarking
- 16.6 Technology, Pricing and Differentiation
- 16.7 Regional Footprint and Distribution Strength
- 16.8 Mergers, Acquisitions and Strategic Alliances
- 16.9 New Entrants and Competitive Threats
- 16.10 Porter's Five Forces and Industry Attractiveness
- 16.11 Competitive Outlook, 2025-2035
Chapter 17 Company Profiles
- 17.1 Company Coverage and Selection Criteria
- 17.2 Colgate-Palmolive Company
- 17.2.1 Business Description
- 17.2.2 Company Ownership and Geographic Presence
- 17.2.3 Product and Service Portfolio
- 17.2.4 Manufacturing and Operating Footprint
- 17.2.5 Production Capacity and Expansion Plans
- 17.2.6 Financial Performance and Investment
- 17.2.7 Market Share and Competitive Position
- 17.2.8 Technology and Innovation Capabilities
- 17.2.9 Strategic Alliances or Partnerships
- 17.2.10 Recent Developments
- 17.2.11 Growth Strategy and Outlook
- 17.3 Unilever PLC
- 17.4 The Procter & Gamble Company
- 17.5 Haleon plc
- 17.6 Yunnan Baiyao Group Co., Ltd.
- 17.7 Other Relevant Market Participants
Note: Every listed company is profiled on the structure shown under the first company. The company list is preliminary and may change based on research findings, market developments, data availability and client requirements.
Chapter 18 Disclaimer
- 18.1 Research and Forecast Disclaimer
- 18.2 Data Source and Estimation Limitations
Note: The depth of individual sections depends on data availability for this market. Volume, capacity, trade and other unit-based metrics are included where applicable.

