
Tissue maps move from atlas projects to drug research
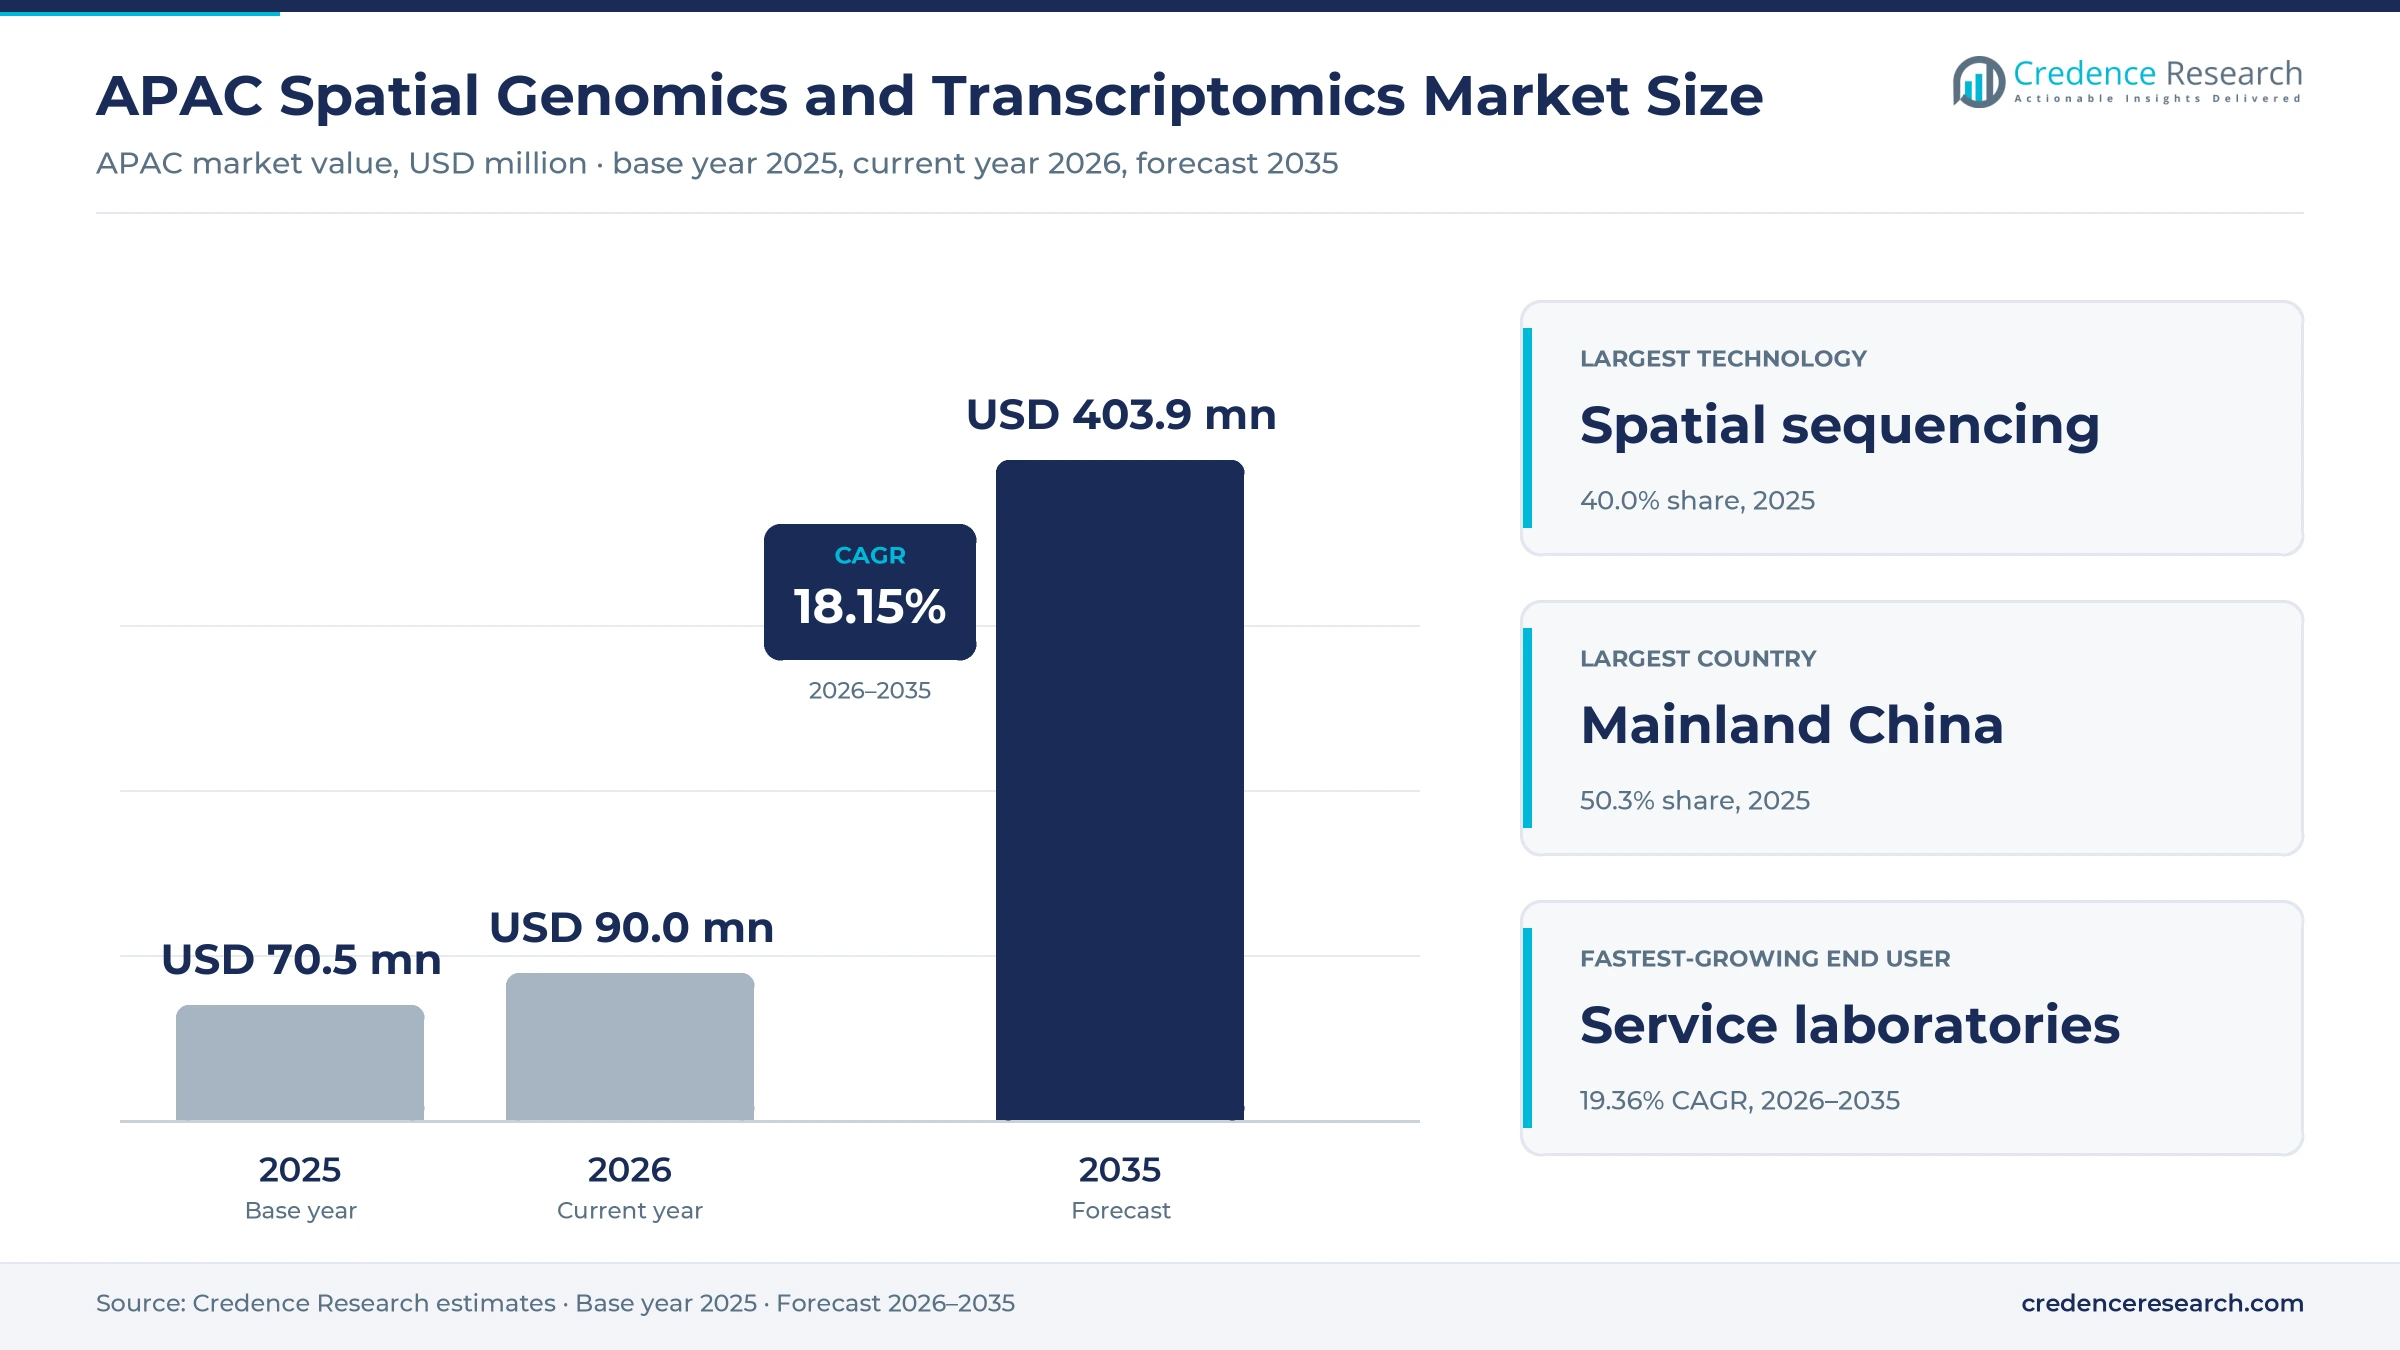
The APAC spatial genomics and transcriptomics market was valued at USD 70.5 million in 2025 and is projected to increase from USD 90.0 million in 2026 to USD 403.9 million by 2035, registering a CAGR of 18.15% during 2026–2035. Demand comes from universities and public institutes that build tissue atlases, drug developers that study tumor and immune cells in place, and service laboratories that run instruments for groups without their own systems. Mainland China held the largest country share, 50.3% in 2025, because Stereo-seq was developed there and large atlas programs use it. South Korea is the fastest-growing country at 18.81% a year, as research spending stays high and service providers add new imaging platforms. Japan and the remaining markets add demand from drug research and national institutes. Panels have also grown from a few hundred genes to near whole transcriptome coverage since 2024, which widens the questions one tissue section can answer.
Which products and services does the regional estimate cover?
The estimate measures the value of instruments with bundled software, capture and preparation consumables, and detection and readout consumables sold to buyers in the Asia-Pacific region. It also counts the value of direct research service contracts in which a laboratory runs the assay for a customer. Values are measured at the first point of sale to the buying institute, company or hospital laboratory.
The estimate excludes general sequencers, standard microscopes and routine clinical pathology tests that do not record where molecules sit in tissue. The value chain runs from slide, probe and reagent makers through instrument owners, authorized distributors and service laboratories to universities, drug developers and hospital research groups across Mainland China, Japan, South Korea and the remaining markets of the region.
APAC Spatial Genomics and Transcriptomics Market Insights
- The APAC spatial genomics and transcriptomics market was valued at USD 70.5 million in 2025 and is projected to reach USD 403.9 million by 2035, registering a CAGR of 18.15% during 2026–2035.
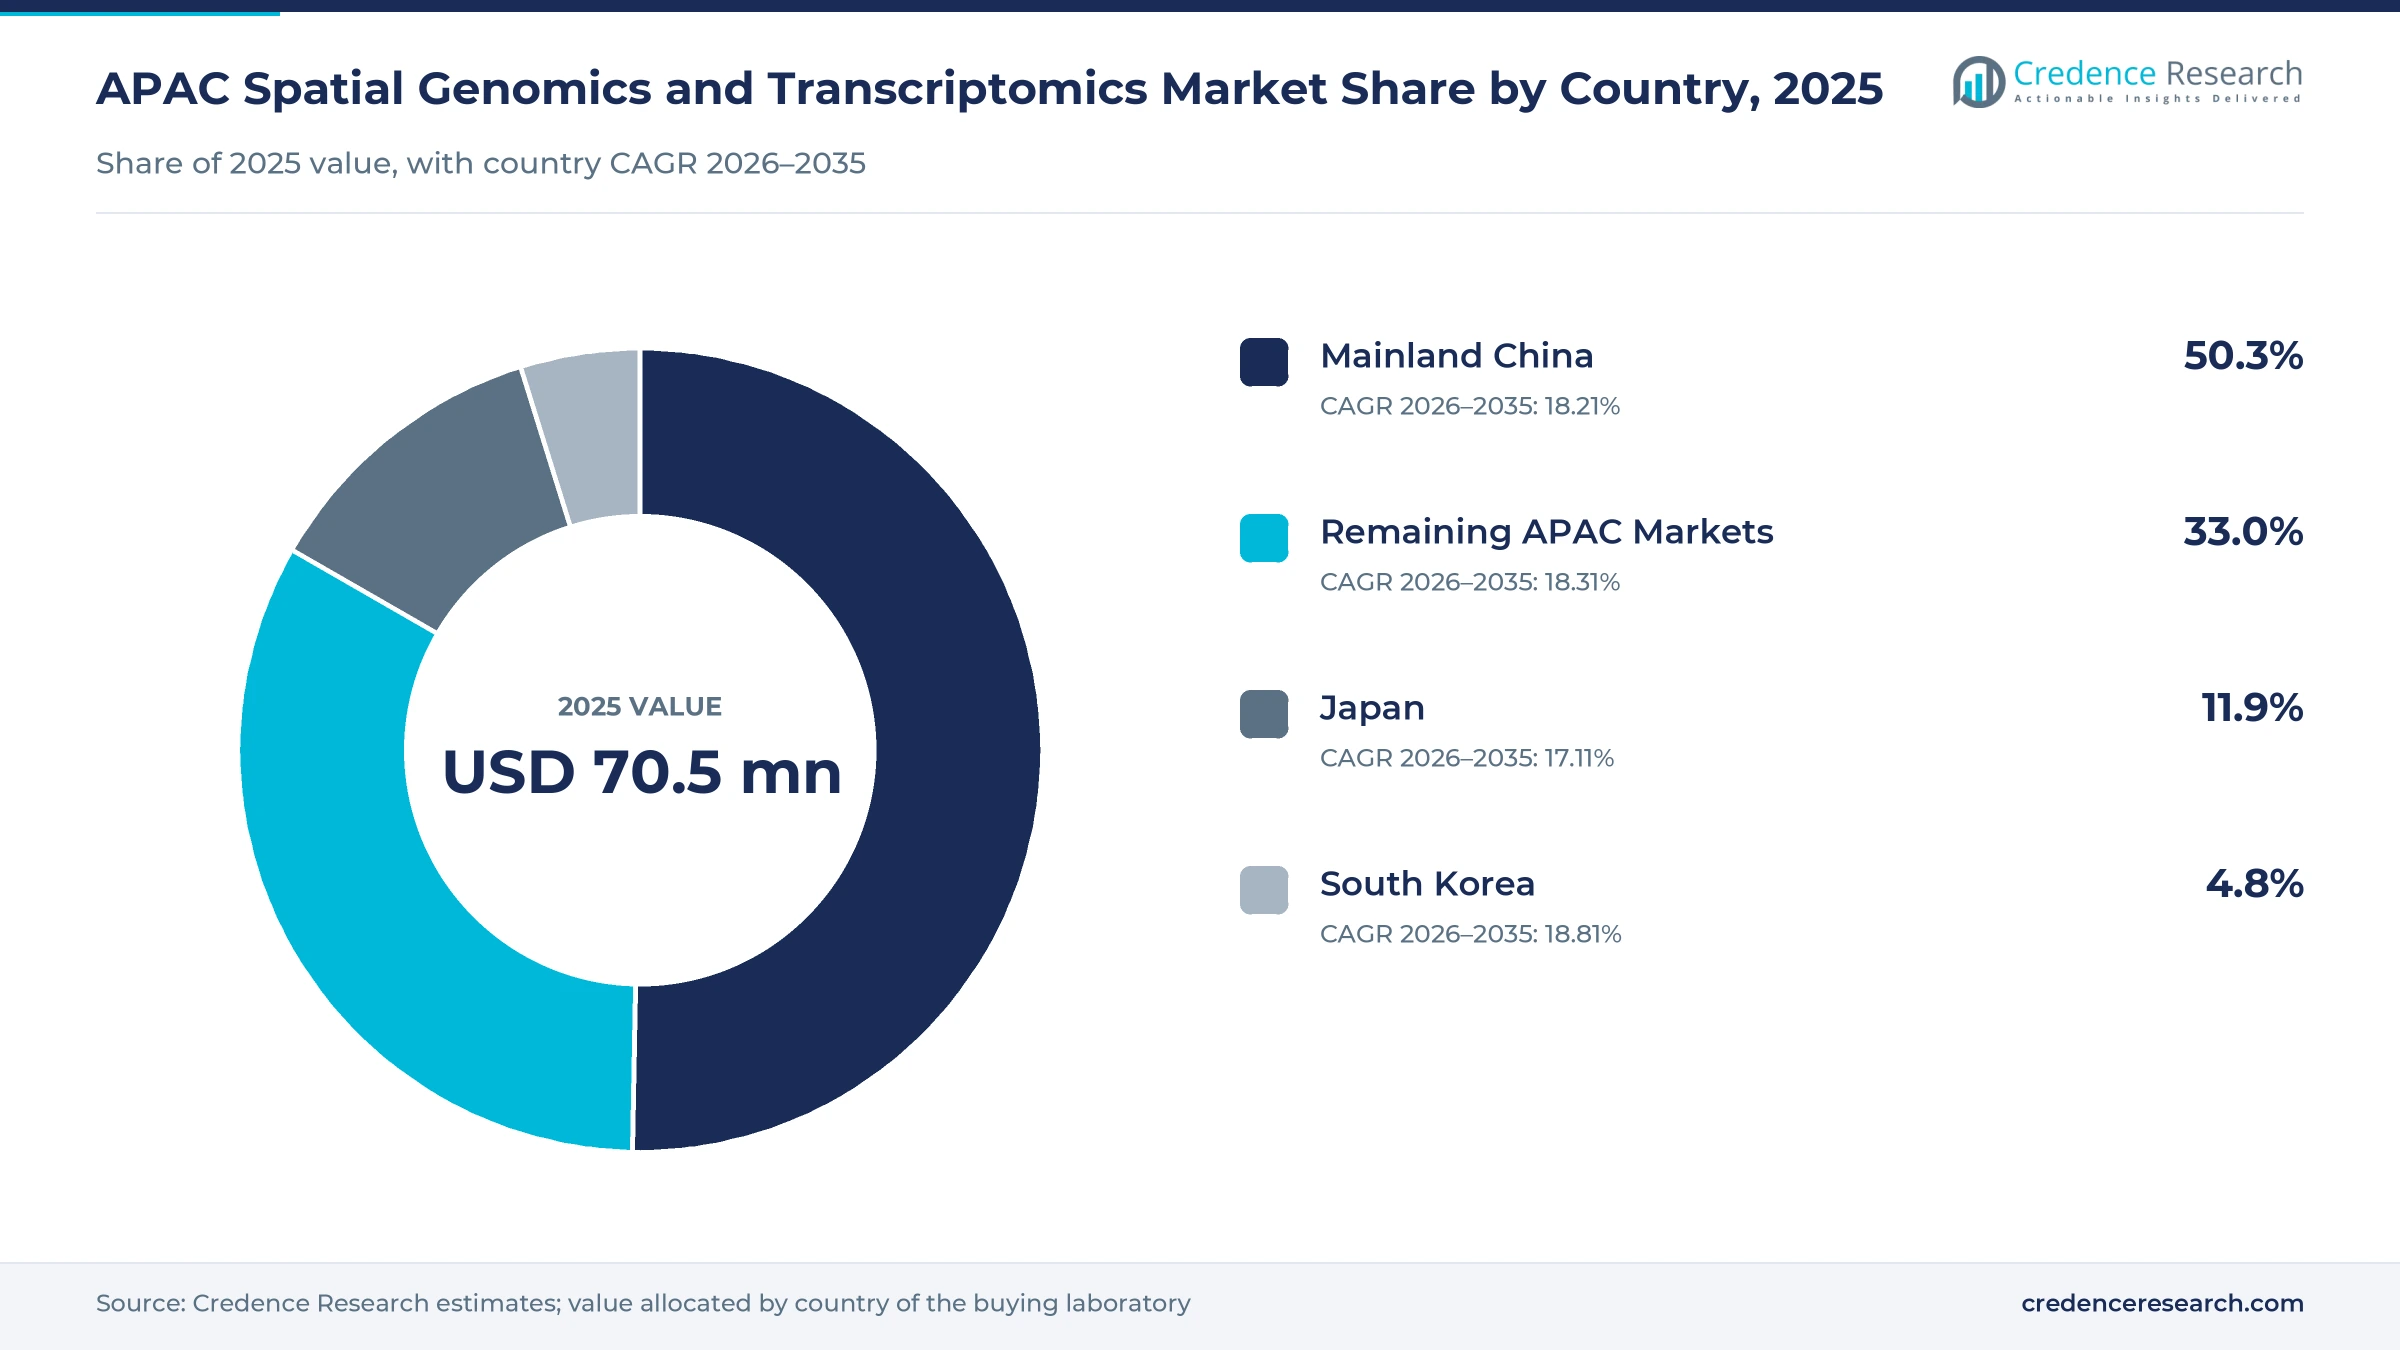
- Mainland China held a 50.3% share of 2025 value, because large atlas programs built on Stereo-seq and national institutes buy most systems.
- Spatial sequencing led technology demand with a 40.0% share of 2025 value, because barcoded chips work with sequencers that labs already own.
- Macrogen introduced the Atera platform in Asia on Sept. 9, 2026, which reads more than 18,000 genes at single-cell resolution.
- Contract research and service laboratories grow fastest at 19.36% a year during 2026–2035, as many groups buy results rather than instruments.
Sequencing chips lead while service labs grow fastest
Why do consumables outgrow instruments over time?
Based on product type, the market is categorized into instruments and bundled software, capture and preparation consumables, and detection and readout consumables. Instruments and Bundled Software led with a 38.0% share of 2025 value, because new imaging systems carry high unit prices. Detection and Readout Consumables grow fastest at 19.02% a year, as each installed system runs larger gene panels and more slides every year.
How does oncology research shape application demand?
Based on application, the market is categorized into oncology, neuroscience, developmental biology and immunology and cross-disease research. Oncology led with a 42.0% share of 2025 value, because tumor samples are the most common tissue that drug developers and hospitals profile. Immunology and Cross-Disease Research grows fastest at 18.58% a year, as immune atlases from Asian donors open new comparison studies.
Why do service laboratories gain share from institutes?
Based on end user, the market is categorized into academic and public research institutes, pharmaceutical and biotechnology companies, contract research and service laboratories, and hospital research laboratories. Academic and Public Research Institutes led with a 52.0% share of 2025 value, because atlas programs are publicly funded. Contract Research and Service Laboratories grow fastest at 19.36% a year, as more groups send slides out for analysis.
How do imaging platforms challenge sequencing chips?
Based on technology, the market is categorized into in situ imaging, spatial sequencing, digital spatial profiling and targeted and multimodal assays. Spatial Sequencing led with a 40.0% share of 2025 value, because it extends single-cell omics work onto tissue. Targeted and Multimodal Assays grow fastest at 18.96% a year, as RNA and protein are read on one slide.
| Segment Group | Leading Sub-segment | Share, 2025 | Fastest-growing Sub-segment | CAGR, 2026–2035 |
|---|---|---|---|---|
| By Product Type | Instruments and Bundled Software | 38.0% | Detection and Readout Consumables | 19.02% |
| By Application | Oncology | 42.0% | Immunology and Cross-Disease Research | 18.58% |
| By End User | Academic and Public Research Institutes | 52.0% | Contract Research and Service Laboratories | 19.36% |
| By Technology | Spatial Sequencing | 40.0% | Targeted and Multimodal Assays | 18.96% |
Request a Free Sample
Fill in your details and we'll send you a free sample report.
- Sample data tables & charts
- Research methodology
Higher plex, atlas networks and service labs lift use
How does higher-plex detection widen research questions?
One tissue section can now show thousands of genes instead of a few dozen markers, which lets a single study test many cell types at once. 10x Genomics launched its Xenium Prime 5K panel on May 29, 2024, which raised plex about tenfold and covers up to 472 square millimeters of tissue in six days or less. Bruker then took advance orders in May 2025 for CosMx Whole Transcriptome, which covers about 19,000 gene targets, according to its AACR 2025 release. The same release said CosMx can pair the whole transcriptome with up to 76 immuno-oncology proteins in the same cell. As a result, detection and readout consumables grow at 19.02% a year, the fastest product rate in the region.
Why does research network expansion lift atlas demand?
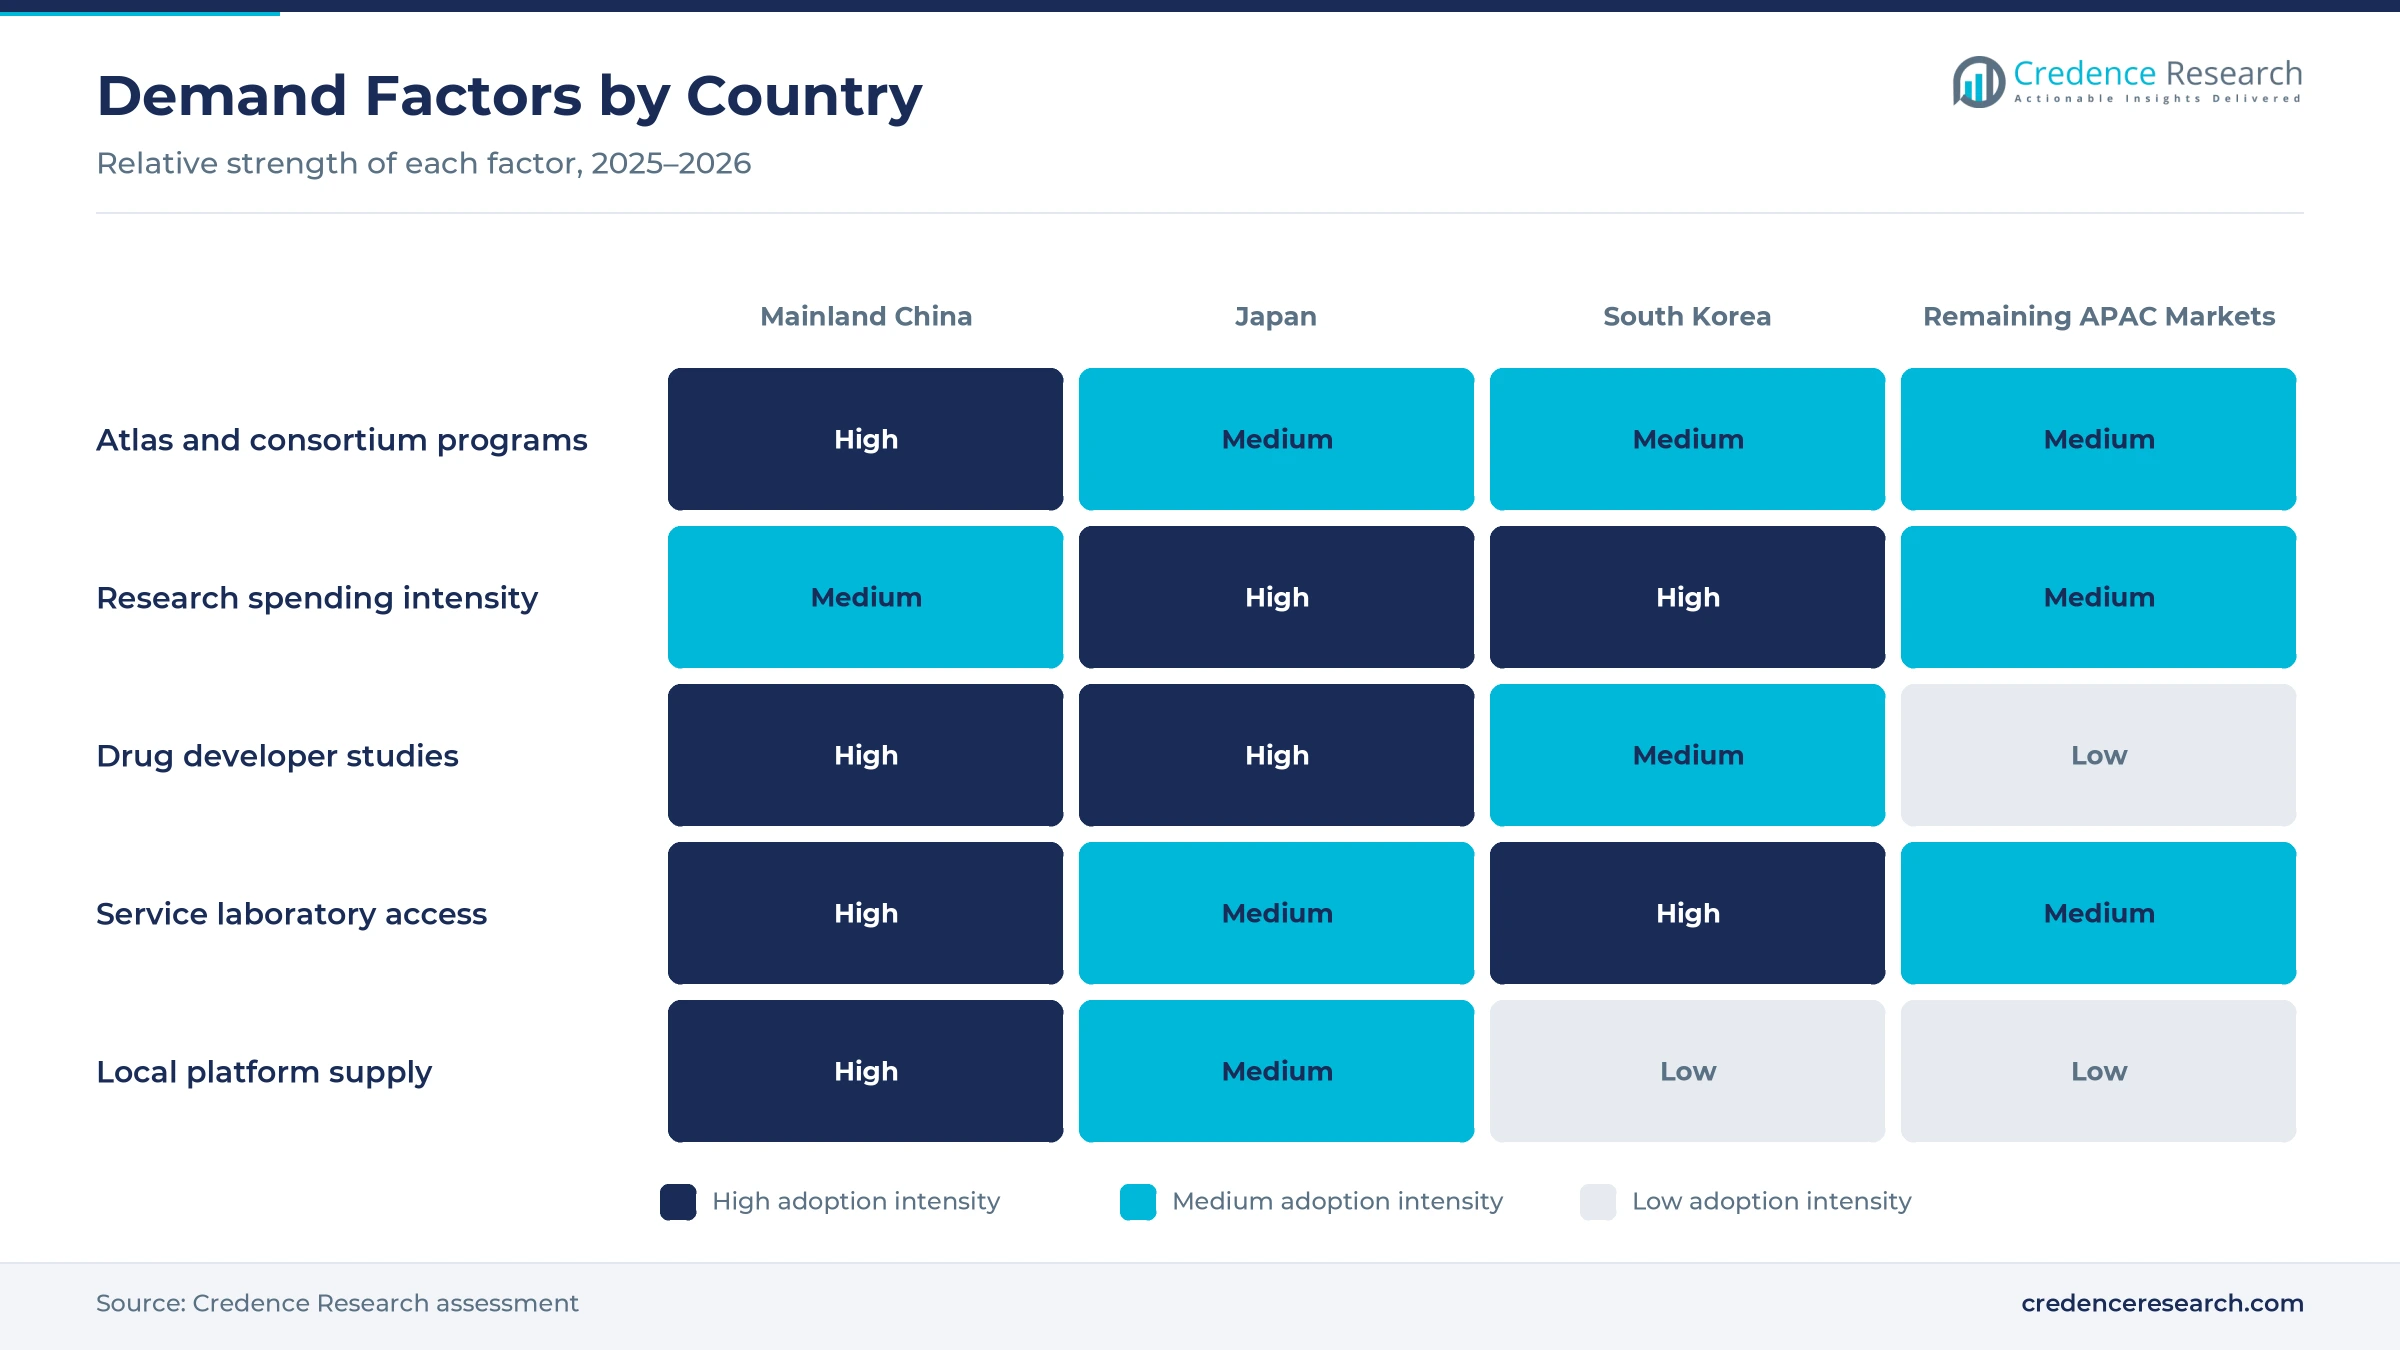
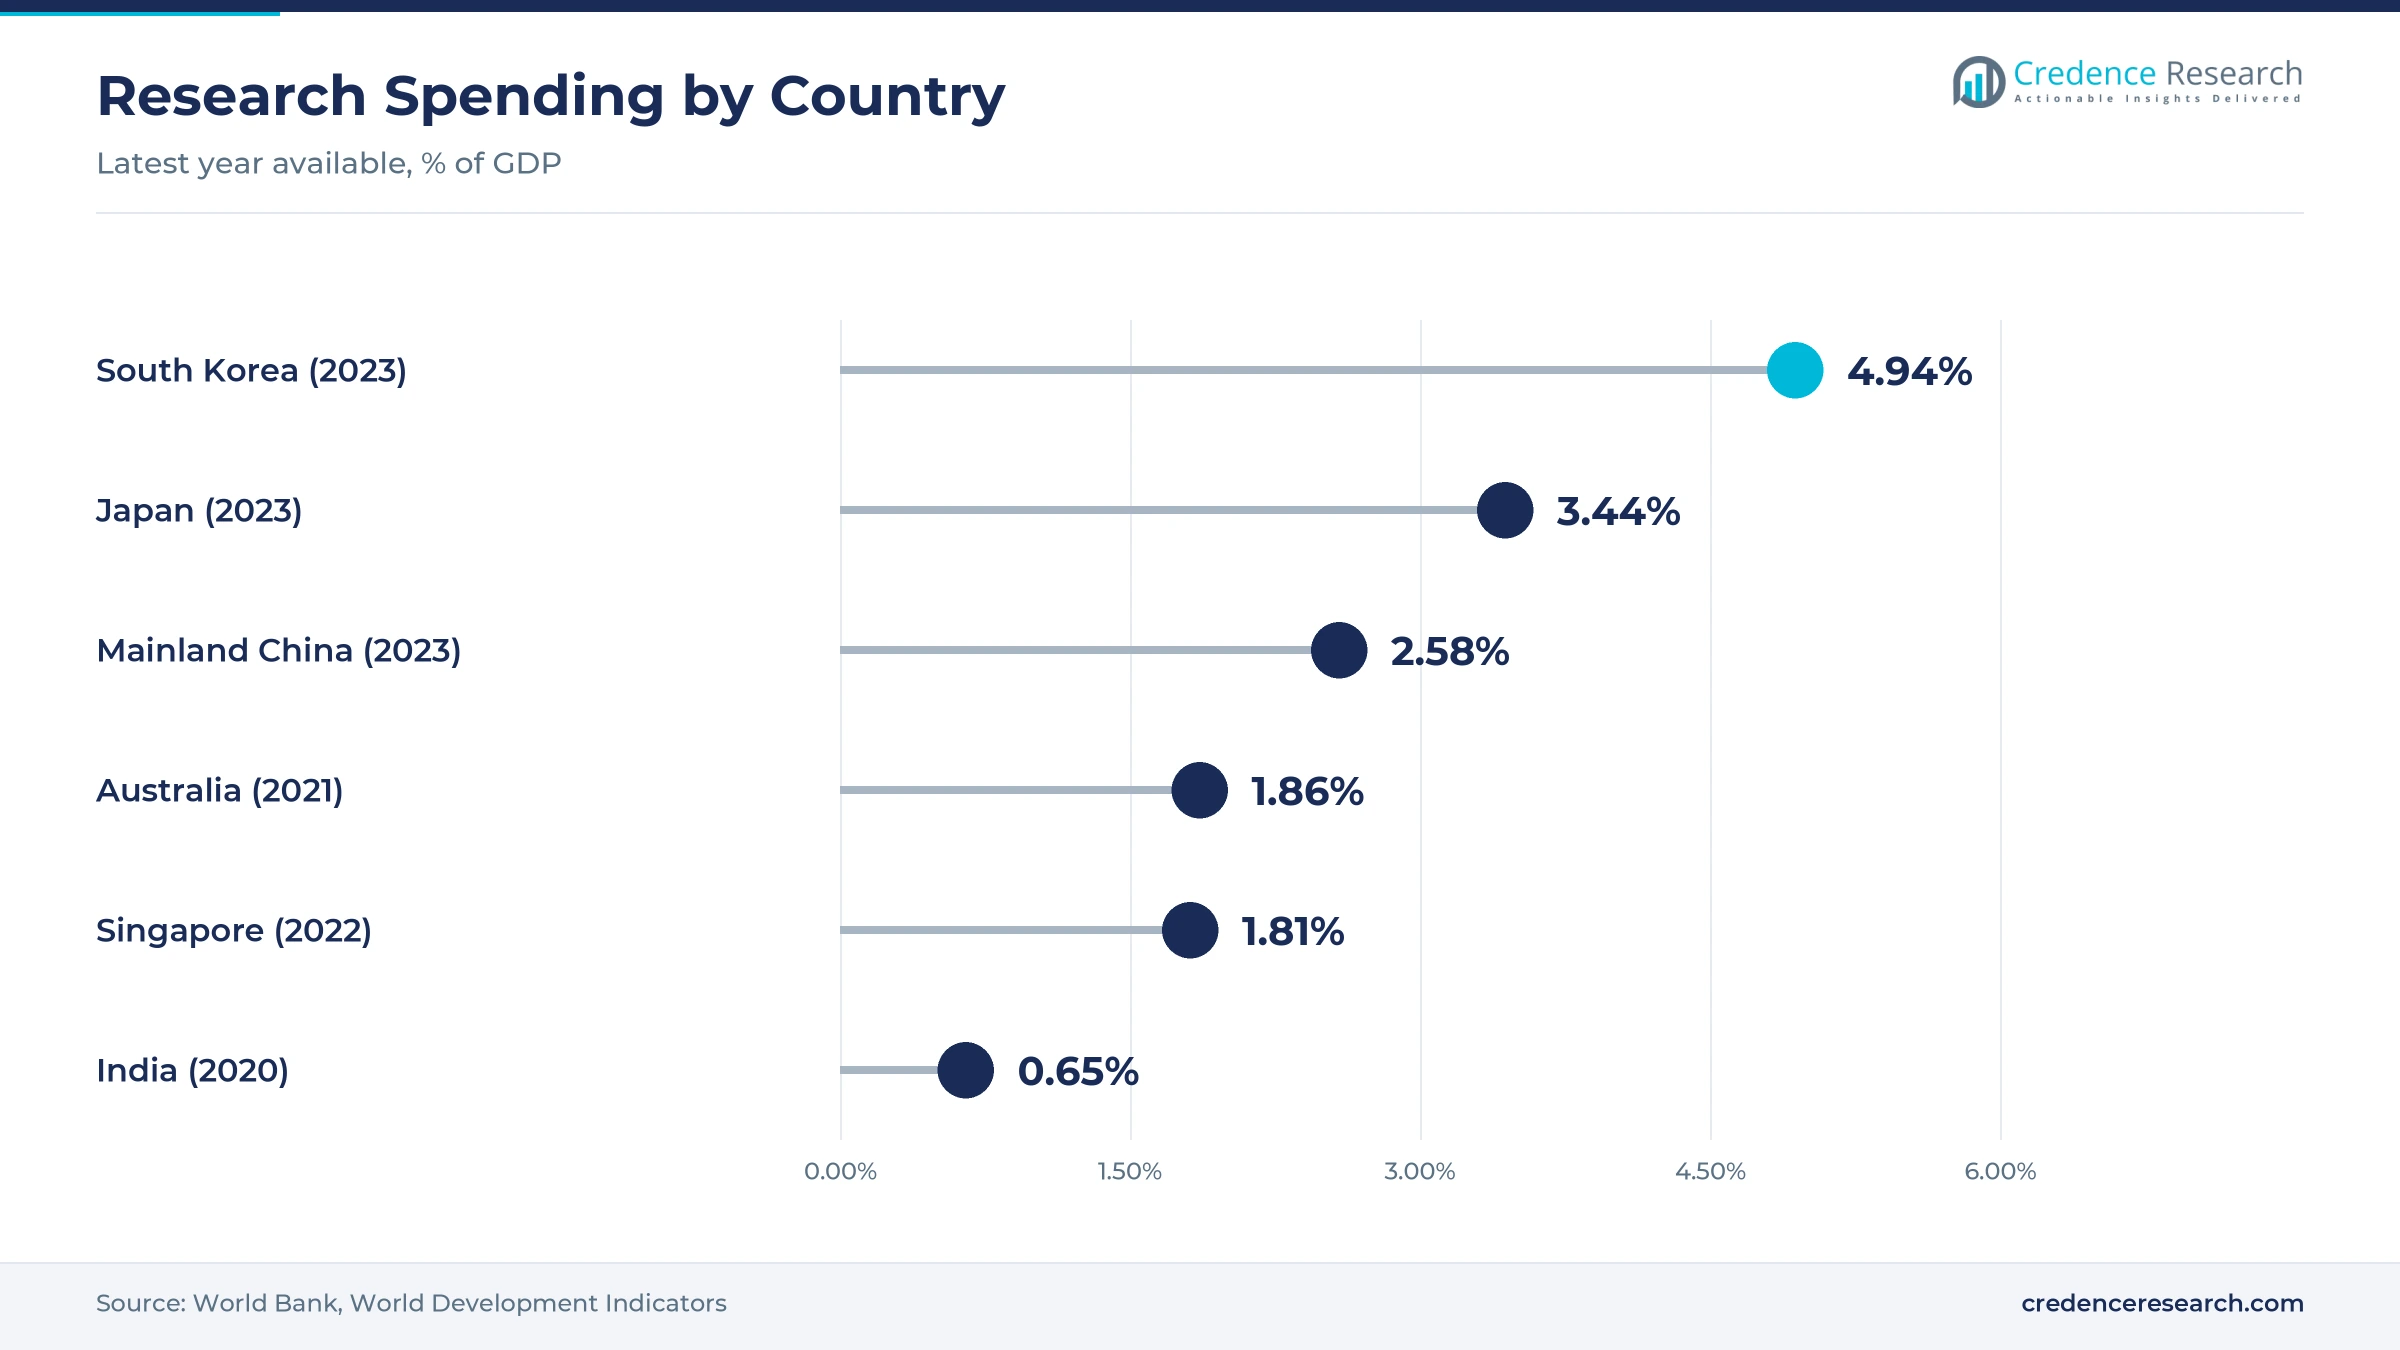
Large consortia now map tissue across many laboratories and countries, and each member must buy matched chips, probes and reagents. Scientists from 16 countries formed the SpatioTemporal Omics Consortium in May 2022, with members such as the Genome Institute of Singapore, the University of Western Australia and BGI-Research. The Asian Immune Diversity Atlas profiled more than 1.2 million immune cells from 625 donors in five countries, according to A*STAR. Research funding also stays high, at 4.94% of GDP in South Korea and 3.44% in Japan in 2023, according to World Bank data. In turn, academic and public research institutes hold a 52.0% share of 2025 value.
How does service-based access lower the entry barrier?
Many groups need only a few studies a year, so buying results from a service laboratory costs less than owning a system. Macrogen introduced the 10x Genomics Atera platform in Asia on Sept. 9, 2026, and said it can process up to 800 whole transcriptome samples a year, according to Asia Economy. Macrogen already runs Xenium projects in about six weeks and CosMx projects in about five weeks. Omics Empower also began Xenium services at Hong Kong Science Park in February 2026, the second Hong Kong laboratory to run that system. As more drug developers use contract research outsourcing, service laboratories grow at 19.36% a year.
Why do grants and distributors speed first adoption?
Pilot funding and local sales partners cut the cost and risk of a first study for new laboratories. MGI Tech and STOmics opened a spatial grant program on Nov. 6, 2025, for Japan, South Korea and Southeast Asia, according to MGI Tech. Its awards include Stereo-seq pilot tests and large discounts on product kits. Vizgen signed distributors in October 2022 for China and Hong Kong, Japan, South Korea and Australia and New Zealand, while it sells directly in Singapore. These channels put local application scientists near new customers, which shortens training and sample checks. As a result, the remaining APAC markets hold a 33.0% share of 2025 value.
Same-slide multiomics and instrument-free kits gain ground
How is the shift to same-slide RNA and protein changing assays?
Researchers increasingly want cell identity and cell state from one tissue section, which pushes vendors to add protein readout to gene panels. 10x Genomics launched Xenium Protein on Aug. 19, 2025, which detects RNA and protein in the same cell in one automated run. Bio-Techne showed RNAscope with Lunaphore COMET on the same section in September 2025, using a 21-plex protein panel for lymphoid cancers. Bruker also planned CosMx same-slide multiomics for the second half of 2025. These tools bring multiplex biomarker imaging and gene panels into one workflow. As a result, targeted and multimodal assays grow at 18.96% a year, the fastest technology rate.
Why is the rise of instrument-free capture kits gaining weight?
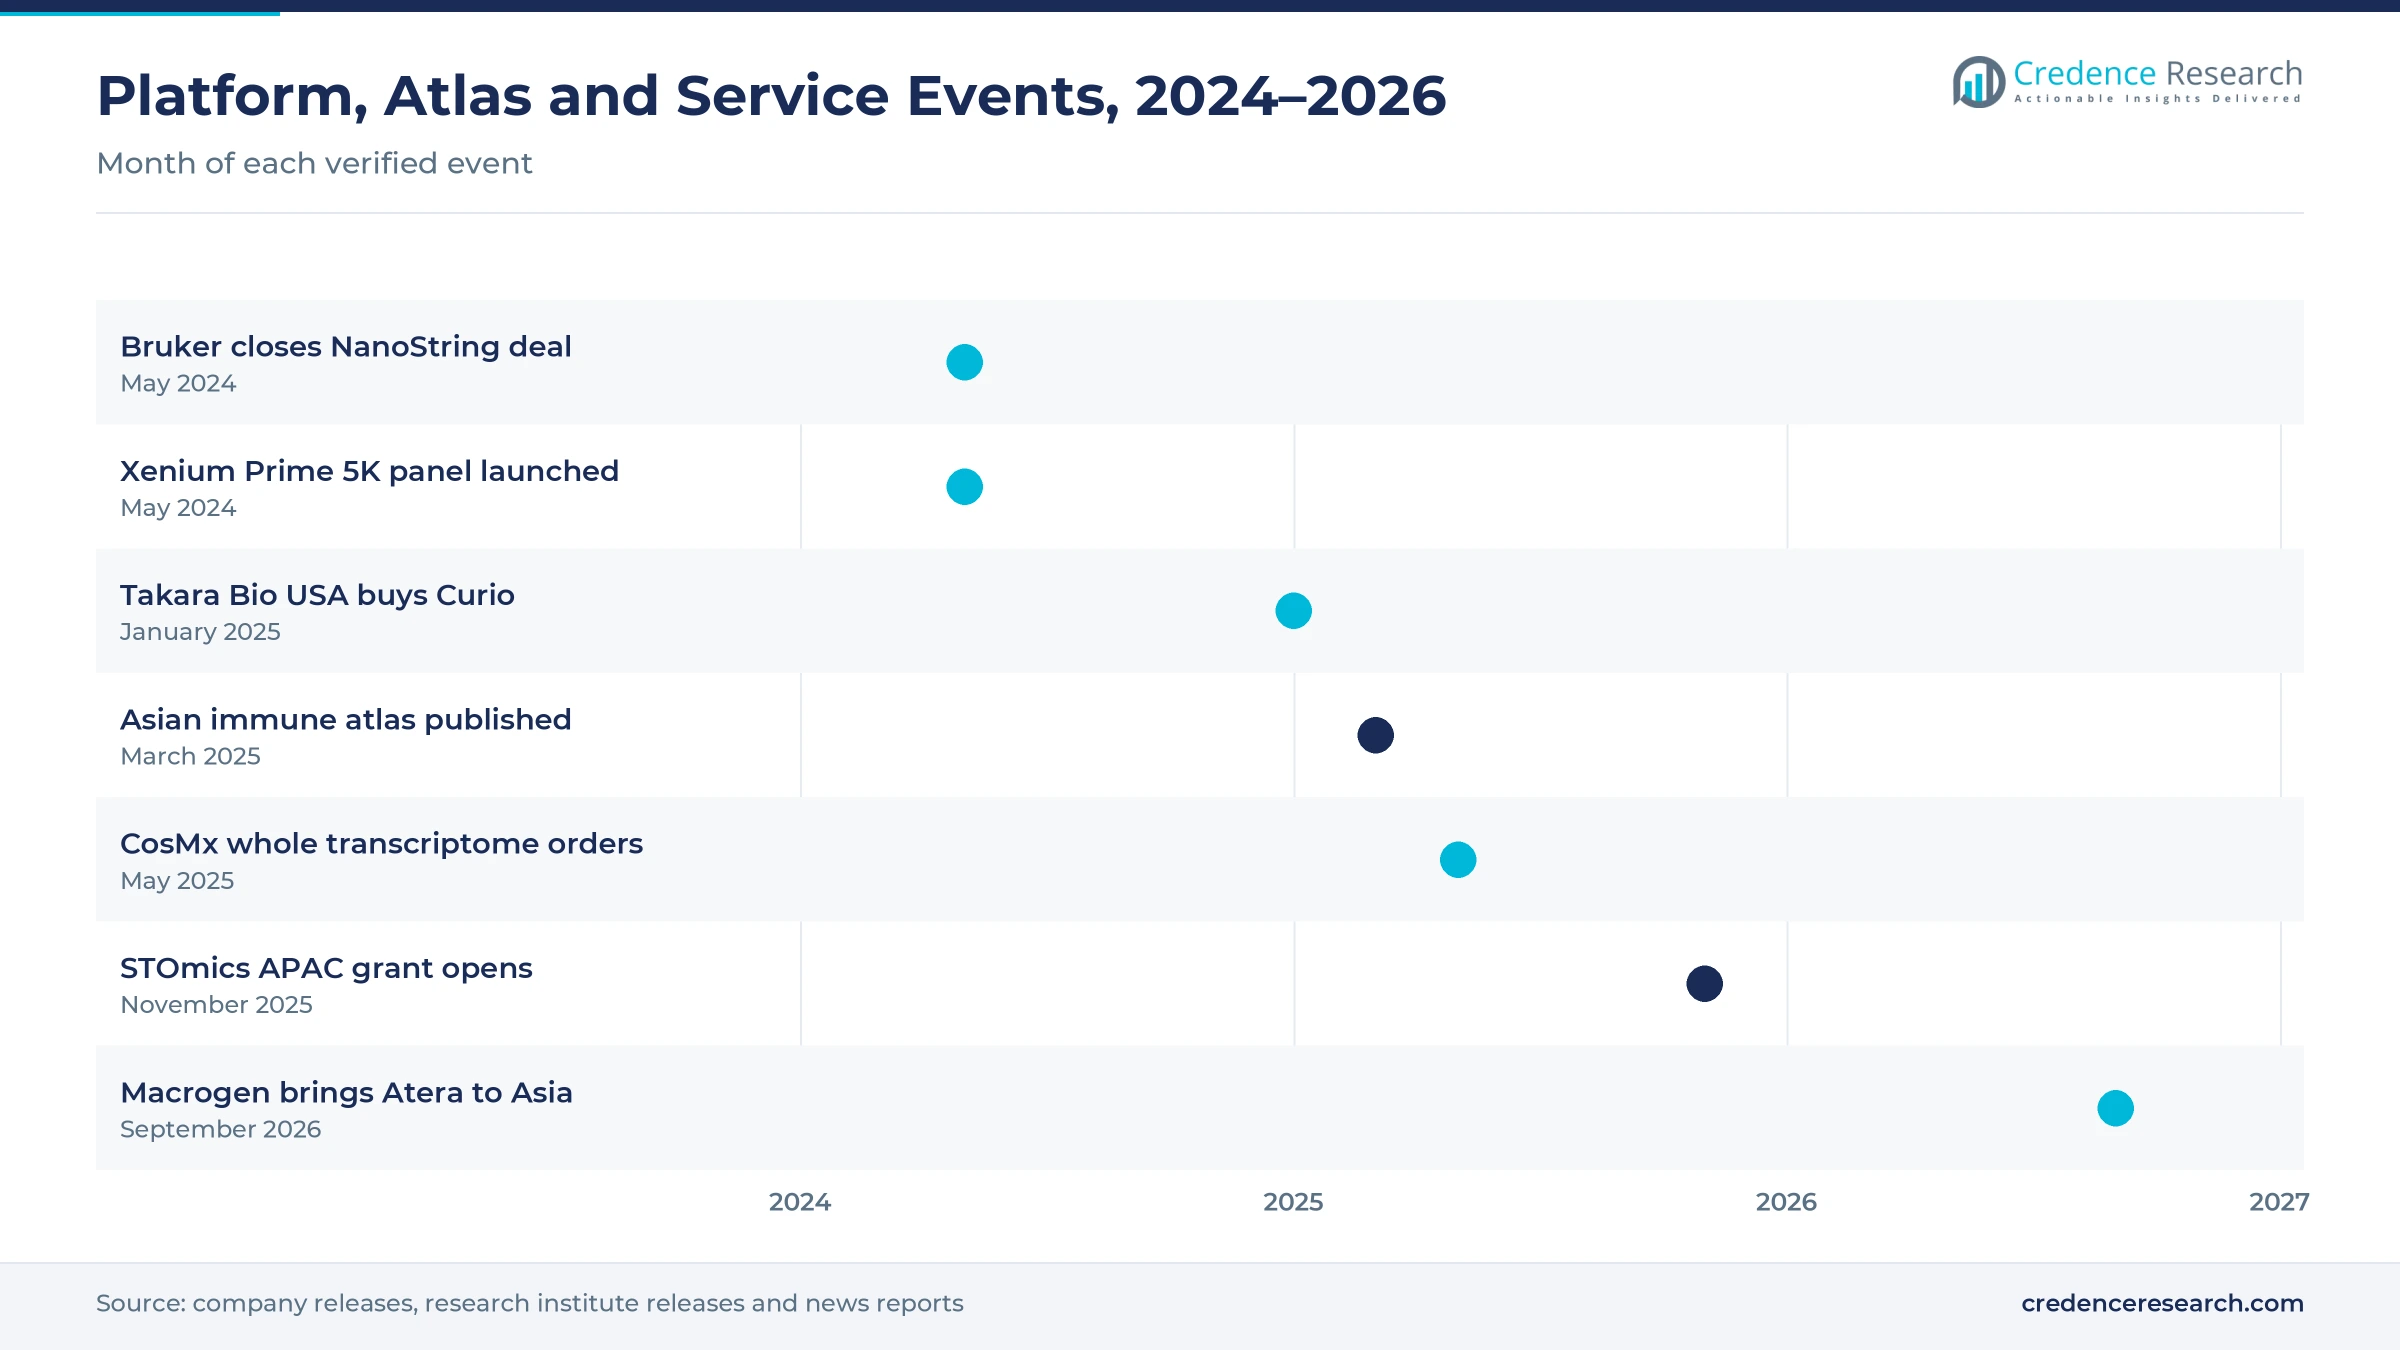
Many laboratories in the region own sequencers but lack imaging systems, which makes kit-only tissue mapping attractive. Takara Bio USA, a subsidiary of Japan-based Takara Bio, bought Curio Bioscience on Jan. 14, 2025, adding the Seeker and Trekker technologies. In February 2026, it said Trekker with an Illumina single-cell kit recovers more than 100,000 spatially placed nuclei per sample without special hardware. 10x Genomics also launched Visium HD 3 prime gene expression on May 13, 2025, for human, mouse, rat, primate and zebrafish tissue. These kits use standard next-generation sequencing runs, so spatial sequencing keeps a 40.0% share of 2025 value.
Can Southeast Asia and Australia open new installed bases?
Institutes in Singapore, Thailand and Australia join regional atlas programs but hold far fewer systems than Mainland China. WEHI in Australia ran a MERSCOPE system when Vizgen signed its regional distributors in October 2022. Thailand and India supplied donors to the Asian Immune Diversity Atlas, alongside Singapore, South Korea and Japan. Research spending reached 1.86% of GDP in Australia in 2021 and 1.81% in Singapore in 2022, according to World Bank data. The STOmics grant also targets Southeast Asian groups with pilot tests and kit discounts. As a result, the remaining APAC markets grow at 18.31% a year, ahead of Mainland China.
Is there room for growth in drug developer tumor studies?
Tissue maps can show which immune cells reach a tumor and why some patients respond, which gives drug developers a reason to fund more studies. Macrogen aimed its Atera webinar in September 2026 at pharma and biotech staff, with topics such as tumor microenvironment analysis and immuno-oncology response prediction. Its CosMx service already offers a 100-plex RNA immuno-oncology panel and a 64-plex protein panel. Bruker's CosMx Whole Transcriptome assay, which reads about 19,000 gene targets, gives these studies a whole-tissue view. In turn, oncology holds a 42.0% share of 2025 value, and pharmaceutical and biotechnology companies are set to buy more studies from service laboratories.
Capital cost, data skills and sample quality slow uptake
How do high system prices limit smaller institutes?
Imaging platforms need capital budgets that many university departments cannot raise in one year. Universities outside the largest cities often share a single system across several groups. As a result, slides wait in queues and projects take longer to finish. Vendors respond with service partnerships, reagent rental plans and pilot grants, while institutes pool funds into core facilities that serve a whole campus.
Why do data volumes strain analysis skills?
A single whole transcriptome slide can produce hundreds of gigabytes of images and counts for each project. Many biology groups lack staff who can align cells, label cell types and test spatial patterns. In turn, raw data can sit unused for months after a run. Vendors respond with cloud analysis packages and AI cell segmentation, while institutes train bioinformatics staff and share pipelines across projects.
How does sample quality affect assay results?
RNA in archived tissue blocks breaks down with age, heat and poor storage conditions over many years. Hospitals in the region fix and store tissue in different ways, which makes results harder to compare across sites. As a result, studies may need repeat runs or extra quality checks before analysis. Service laboratories respond with strict sample rules on section thickness, block age and storage temperature.
Why does platform diversity slow data comparison?
Each commercial system uses its own panels, chemistry, resolution and file formats for results. A consortium that mixes imaging and sequencing methods must harmonize results before it can pool samples. In turn, multicountry atlas projects can take longer and cost more to complete. Consortia respond with shared reference tissues, common cell type labels and open data standards that let groups compare results across platforms.
Mainland China leads while South Korea grows fastest
| Country | Value, 2025 (USD million) | Share, 2025 | CAGR, 2026–2035 |
|---|---|---|---|
| Mainland China | 35.5 | 50.3% | 18.21% |
| Remaining APAC Markets | 23.3 | 33.0% | 18.31% |
| Japan | 8.4 | 11.9% | 17.11% |
| South Korea | 3.4 | 4.8% | 18.81% |
Why does Mainland China hold half of regional value?
Mainland China held a 50.3% share of 2025 value and grows at 18.21% a year, because the country hosts the developer of Stereo-seq and the largest public atlas programs. Chinese teams used Stereo-seq to map 264 cell types across 143 regions of the macaque cortex in a study published in July 2023. China also spent 2.58% of GDP on research in 2023, which supports steady institute purchases of chips, reagents and sequencing.
How does Japan support drug research demand?
Japan held an 11.9% share of 2025 value and grows at 17.11% a year, because its drug companies and national institutes run long research programs that use tissue profiling. RIKEN took part in the Asian Immune Diversity Atlas, and Japan spent 3.44% of GDP on research in 2023. Takara Bio, based in Shiga, now owns the Trekker and Seeker technologies, while PRIMETECH distributes MERSCOPE systems in the country.
Why is South Korea the fastest-growing country?
South Korea held a 4.8% share of 2025 value and grows fastest at 18.81% a year, because it has the highest research spending in the region and an active service sector. The country spent 4.94% of GDP on research in 2023. Macrogen runs Visium, GeoMx, Xenium and CosMx services from Korea, and its Songdo Global Genome Center, completed in June 2026, is the base for the new Atera service.
What shapes demand in the remaining APAC markets?
The remaining APAC markets held a 33.0% share of 2025 value and grow at 18.31% a year. Singapore hosts the Genome Institute of Singapore, which led the Asian Immune Diversity Atlas, and Hong Kong now has at least two laboratories that run Xenium. Australia adds demand from medical research institutes such as WEHI, while Thailand and India join regional atlas work.
Acquisitions, panels and service launches, 2024 to 2026
| Development | Status and market relevance |
|---|---|
| In May 2024, Bruker completed its acquisition of the NanoString business, including GeoMx, CosMx and AtoMx. | Brings two leading spatial platforms under one owner |
| In January 2025, Takara Bio USA bought Curio Bioscience and its Seeker and Trekker technologies. | Gives a Japanese parent a sequencing-based spatial line |
| In March 2025, the Asian Immune Diversity Atlas reported 1.2 million immune cells from 625 donors. | Creates an Asian reference for spatial immune studies |
| In November 2025, MGI Tech and STOmics opened a spatial grant program for Japan, South Korea and Southeast Asia. | Lowers the cost of first Stereo-seq pilots |
| In September 2026, Macrogen introduced the 10x Genomics Atera platform in Asia. | Adds whole transcriptome imaging capacity in South Korea |
Imaging, sequencing chips and same-slide protein readout
- In situ imaging reads RNA directly in tissue with cyclic probes, and panels now reach about 5,000 genes or near the whole transcriptome.
- Barcoded sequencing chips capture RNA on a slide with position codes, which lets labs read tissue maps on sequencers they already own.
- Digital spatial profiling measures RNA or protein in chosen tissue regions, which suits pathology studies on archived blocks.
- Same-slide multiomics adds protein panels to RNA readout in the same cell, which links cell identity to cell state.
Need a Custom Version of This Report?
Tailor the scope, geography, or segments to your exact requirements.
- Custom geography or segment scope
- Direct access to our analyst team
Platform owners compete on plex, area and service reach
Competition combines global platform owners with a strong Chinese sequencing-based supplier and regional service laboratories. 10x Genomics sells Visium and Xenium systems and kits, and its platforms reach Korean buyers through Macrogen services. Bruker owns GeoMx and CosMx after its 2024 NanoString purchase, while STOmics sells Stereo-seq chips and runs grant programs across the region. Vizgen sells MERSCOPE through distributors in China, Japan, South Korea and Australia, and Takara Bio adds instrument-free Trekker kits. Bio-Techne competes in targeted RNA and protein imaging with RNAscope and COMET. Companies compete on plex, tissue area per run, turnaround and local support rather than on price alone. Service laboratories such as Macrogen and Omics Empower compete on turnaround, and Macrogen quotes about six weeks for Xenium projects and about five weeks for CosMx projects.
Which platform owners and service labs lead APAC?
| Company | Type | Role in the market |
|---|---|---|
| 10x Genomics | Platform owner | Sells Visium and Xenium; Atera offered in Korea via Macrogen |
| Bruker | Platform owner | Owns GeoMx and CosMx; launched CosMx Whole Transcriptome |
| STOmics | Platform owner | Sells Stereo-seq; runs an APAC spatial grant program |
| Macrogen | Service laboratory | Runs Visium, GeoMx, Xenium and CosMx services in Korea |
| Vizgen | Platform owner | Sells MERSCOPE through Asia-Pacific distributors |
| Takara Bio | Kit supplier | Owns Trekker and Seeker after buying Curio Bioscience |
| Bio-Techne | Assay supplier | Sells RNAscope and Lunaphore COMET for RNA and protein imaging |
Credence Research view on Asia-Pacific tissue profiling
Credence Research's view is that Asia-Pacific demand for tissue profiling will grow quickly because panels are larger, atlas networks are wider and service laboratories make studies easier to buy. Spatial sequencing remains the largest technology, while same-slide RNA and protein assays grow fastest. Mainland China keeps about half of regional value, and South Korea grows fastest among the named countries. However, system prices, data skills and sample quality will slow uptake in smaller institutes. Companies that pair high plex with local service and analysis support should gain share fastest.
How the regional tissue profiling estimate was built
The report uses 2025 as the base year on a calendar basis, and market values come from the Credence Research model. That model combines research spending statistics, atlas program data, product launch information and service capacity disclosed by companies. Segment splits, country shares and country growth rates are Credence Research estimates. Sources used are official statistics, research institute releases, company releases, news reports and company websites, and no interviews or surveys were used.
Translational research carries demand to 2035
The APAC spatial genomics and transcriptomics market is expected to reach USD 403.9 million by 2035, an 18.15% CAGR during 2026–2035, as larger panels and service access widen use. Growth should stay strong through 2028 while whole transcriptome imaging and same-slide protein assays spread to more laboratories. After that, consumables and service contracts will carry more growth as the installed base matures. Wider hospital research use would raise this outlook, while tighter research budgets would lower it. Companies with local service partners and strong analysis tools are expected to gain the most.
Frequently Asked Questions
How big is the APAC spatial genomics and transcriptomics market?
Which technology leads regional demand?
Which country leads the regional market?
Why do academic institutes hold the largest end-user share?
How does service-based access affect regional demand?
What role do higher-plex panels play?
Who are the leading companies in the region?
What are the main challenges for buyers?
Table of Content
Chapter 1 Market Segmentation
- 1.1 Segmentation Framework
- 1.1.1 Product and Service Classification
- 1.1.2 Application and End-Use Classification
- 1.1.3 Technology and Solution Classification
- 1.1.4 Customer and Distribution Channel Classification
- 1.1.5 Geographic Segmentation
- 1.1.6 Market Segment Definitions and Boundaries
- 1.2 By Product Type
- 1.2.1 Instruments and Bundled Software
- 1.2.2 Capture and Preparation Consumables
- 1.2.3 Detection and Readout Consumables
- 1.3 By Application
- 1.3.1 Oncology
- 1.3.2 Neuroscience
- 1.3.3 Developmental Biology
- 1.3.4 Immunology and Cross-Disease Research
- 1.4 By End User
- 1.4.1 Academic and Public Research Institutes
- 1.4.2 Pharmaceutical and Biotechnology Companies
- 1.4.3 Contract Research and Service Laboratories
- 1.4.4 Hospital Research Laboratories
- 1.5 By Technology
- 1.5.1 In Situ Imaging
- 1.5.2 Spatial Sequencing
- 1.5.3 Digital Spatial Profiling
- 1.5.4 Targeted and Multimodal Assays
- 1.6 By Country
- 1.6.1 Mainland China
- 1.6.2 Japan
- 1.6.3 South Korea
- 1.6.4 Remaining APAC Markets
Chapter 2 Introduction
- 2.1 Report Objectives and Scope
- 2.2 Product Definition and Industry Terminology
- 2.3 Market Inclusions and Exclusions
- 2.4 Research Process
- 2.4.1 Primary Research and Expert Interviews
- 2.4.2 Secondary Research and Source Review
- 2.4.3 Top-Down and Bottom-Up Estimation
- 2.4.4 Data Triangulation and Verification
- 2.5 Market Size Measurement Basis
- 2.5.1 2025: USD 70.5 million → 2035: USD 403.9 million
- 2.6 Historical and Forecast Reference Periods
- 2.6.1 Historical Period: 2018-2025
- 2.6.2 Base Year: 2025
- 2.6.3 Forecast Period: 2025-2035
- 2.7 Research Assumptions and Limitations
Chapter 3 Executive Summary
- 3.1 Market Snapshot and Key Findings
- 3.2 Base-Year Market Size, 2025
- 3.3 Forecast Market Size, 2035
- 3.4 Revenue and Volume Growth Outlook
- 3.5 Key Demand and Supply Indicators
- 3.6 Leading Market Segments
- 3.7 Fastest-Growing Market Opportunities
- 3.8 Regional Performance Highlights
- 3.9 Technology and Industry Transformation
- 3.10 Competitive Landscape Summary
- 3.11 Analyst View and Strategic Implications
Chapter 4 APAC Spatial Genomics and Transcriptomics Market Trends and Developments
- 4.1 Historical Industry Development, 2018-2025
- 4.2 Recent Market Trends and Developments
- 4.3 Demand and Customer Behavior Trends
- 4.4 Technology and Product Innovation
- 4.5 Artificial Intelligence, Automation and Digitalization
- 4.6 Local Manufacturing and Supply Chain Realignment
- 4.7 Industry Partnerships, Mergers and Acquisitions
- 4.8 Sustainability and Circular Economy Developments
- 4.9 Government and Private Sector Investment Trends
- 4.10 Emerging Business Models and Commercialization
- 4.11 Industry Developments and Announcements
Chapter 5 APAC Spatial Genomics and Transcriptomics Market Production, Supply and Demand Analysis
- 5.1 Demand Trend and Consumption Analysis, 2018-2025
- 5.2 Demand Forecast, 2025-2035
- 5.3 Production and Output Trend, 2018-2025
- 5.4 Production and Output Forecast, 2025-2035
- 5.5 Installed Capacity and Capacity Utilization
- 5.6 Company-Wise Production Plants and Statistics
- 5.6.1 Installed Production Capacity
- 5.6.2 Actual Production
- 5.6.3 Planned Capacity and Expansion Targets
- 5.7 Supply Chain Structure and Procurement Trends
- 5.8 Supply-Demand Gap and Bottlenecks
- 5.9 Import Dependence and Sourcing Structure
- 5.10 Contract Manufacturing and Outsourcing
- 5.11 Regional Supply and Demand Concentration
Chapter 6 APAC Spatial Genomics and Transcriptomics Market Pricing Analysis
- 6.1 Pricing Structure and Measurement
- 6.2 Historical Pricing Trends, 2018-2025
- 6.3 Pricing Outlook, 2025-2035
- 6.4 Average Selling Price and Unit Economics
- 6.5 Pricing by Product and Market Segment
- 6.6 Geographic Pricing Differences
- 6.7 Key Input, Energy, Labor and Logistics Costs
- 6.8 Contract Pricing and Purchasing Models
- 6.9 Pricing Sensitivity and Competitive Positioning
- 6.10 Price, Margin and Profitability Implications
Chapter 7 APAC Spatial Genomics and Transcriptomics Market Dynamics
- 7.1 Market Growth Drivers
- 7.1.1 Demand-Side Drivers
- 7.1.2 Technology and Innovation Drivers
- 7.1.3 Infrastructure and Investment Drivers
- 7.1.4 Regulatory and Policy Drivers
- 7.2 Market Restraints
- 7.2.1 Cost and Affordability Constraints
- 7.2.2 Technology and Adoption Barriers
- 7.2.3 Supply Chain and Operational Constraints
- 7.3 Market Challenges
- 7.3.1 Competitive Pressure and Margin Erosion
- 7.3.2 Skills, Infrastructure and Implementation Gaps
- 7.4 Emerging Market Opportunities
- 7.5 Market Dynamics Impact and Time-Horizon Assessment
Chapter 8 APAC Spatial Genomics and Transcriptomics Value Chain Analysis
- 8.1 Industry Value Chain Overview
- 8.2 Upstream Suppliers and Critical Inputs
- 8.3 Technology and Component Providers
- 8.4 Manufacturing or Service Delivery
- 8.5 Distribution, Channel Partners and Integrators
- 8.6 Downstream Applications and End Users
- 8.7 Value Addition and Profit Pools
- 8.8 Vertical Integration and Outsourcing
- 8.9 Supplier Concentration and Risk
- 8.10 Supply Chain Localization and Resilience
Chapter 9 APAC Spatial Genomics and Transcriptomics Market Regulations and Policies
- 9.1 Relevant Laws, Standards and Compliance Frameworks
- 9.2 Product, Service, Safety and Quality Requirements
- 9.3 Government Policies, Incentives and Subsidies
- 9.4 Imports, Exports and Trade Barriers
- 9.5 Public Procurement and Local Content Requirements
- 9.6 Environmental and Sustainability Compliance
- 9.7 Upcoming Policy Changes and Market Implications
Chapter 10 APAC Spatial Genomics and Transcriptomics Market Hotspots and Opportunities
- 10.1 Market Opportunity Mapping and Growth Hotspots
- 10.2 High-Growth Applications and Customer Groups
- 10.3 Underserved Markets and White-Space Opportunities
- 10.4 Emerging Technology and Product Opportunities
- 10.5 New Capacity and Investment Hotspots
- 10.6 Market Entry and Expansion Opportunities
- 10.7 Distribution and Partnership Opportunities
- 10.8 Near-Term and Long-Term Commercial Potential
- 10.9 Opportunity Attractiveness and Execution Risks
Chapter 11 APAC Spatial Genomics and Transcriptomics Market Outlook, 2025-2035
- 11.1 Market Size and Analysis
- 11.1.1 Revenue (Market Measurement: 2025: USD 70.5 million → 2035: USD 403.9 million)
- 11.1.2 Market Volume and Quantity Sold
- 11.1.3 Historical Market Size, 2018-2025
- 11.1.4 Base-Year Market Size, 2025
- 11.2 Market Forecast, 2025-2035
- 11.2.1 Revenue Forecast to 2035
- 11.2.2 Volume Forecast to 2035
- 11.2.3 CAGR and Year-on-Year Growth
- 11.2.4 Incremental Revenue Opportunity
- 11.3 Forecast Assumptions and Scenario Analysis
- 11.3.1 Base-Case Forecast
- 11.3.2 Optimistic and Conservative Scenarios
- 11.3.3 Technology, Pricing and Policy Sensitivities
- 11.4 Market Attractiveness and Growth Outlook
Chapter 12 APAC Spatial Genomics and Transcriptomics Market Segmentation and Outlook
- 12.1 Segmentation Summary and Market Shares, 2025
- 12.2 Largest and Fastest-Growing Segments
- 12.3 By Product Type - Market Size and Forecast, 2025-2035
- 12.3.1 Segment Definition and Scope
- 12.3.2 Historical Market Size, 2018-2025
- 12.3.3 Revenue Forecast, 2025-2035
- 12.3.4 Volume Forecast, 2025-2035
- 12.3.5 Base-Year Market Share, 2025
- 12.3.6 Segment CAGR and Growth Drivers
- 12.3.7 Subsegment Market Size and Forecast
- 12.3.7.1 Instruments and Bundled Software
- 12.3.7.2 Capture and Preparation Consumables
- 12.3.7.3 Detection and Readout Consumables
- 12.3.8 Subsegment Pricing and Adoption Trends
- 12.3.9 Leading Suppliers and Competition
- 12.3.10 Regional Demand and Opportunities
- 12.4 By Application - Market Size and Forecast, 2025-2035
- 12.4.1 Segment Definition and Scope
- 12.4.2 Historical Market Size, 2018-2025
- 12.4.3 Revenue Forecast, 2025-2035
- 12.4.4 Volume Forecast, 2025-2035
- 12.4.5 Base-Year Market Share, 2025
- 12.4.6 Segment CAGR and Growth Drivers
- 12.4.7 Subsegment Market Size and Forecast
- 12.4.7.1 Oncology
- 12.4.7.2 Neuroscience
- 12.4.7.3 Developmental Biology
- 12.4.7.4 Immunology and Cross-Disease Research
- 12.4.8 Subsegment Pricing and Adoption Trends
- 12.4.9 Leading Suppliers and Competition
- 12.4.10 Regional Demand and Opportunities
- 12.5 By End User - Market Size and Forecast, 2025-2035
- 12.5.1 Segment Definition and Scope
- 12.5.2 Historical Market Size, 2018-2025
- 12.5.3 Revenue Forecast, 2025-2035
- 12.5.4 Volume Forecast, 2025-2035
- 12.5.5 Base-Year Market Share, 2025
- 12.5.6 Segment CAGR and Growth Drivers
- 12.5.7 Subsegment Market Size and Forecast
- 12.5.7.1 Academic and Public Research Institutes
- 12.5.7.2 Pharmaceutical and Biotechnology Companies
- 12.5.7.3 Contract Research and Service Laboratories
- 12.5.7.4 Hospital Research Laboratories
- 12.5.8 Subsegment Pricing and Adoption Trends
- 12.5.9 Leading Suppliers and Competition
- 12.5.10 Regional Demand and Opportunities
- 12.6 By Technology - Market Size and Forecast, 2025-2035
- 12.6.1 Segment Definition and Scope
- 12.6.2 Historical Market Size, 2018-2025
- 12.6.3 Revenue Forecast, 2025-2035
- 12.6.4 Volume Forecast, 2025-2035
- 12.6.5 Base-Year Market Share, 2025
- 12.6.6 Segment CAGR and Growth Drivers
- 12.6.7 Subsegment Market Size and Forecast
- 12.6.7.1 In Situ Imaging
- 12.6.7.2 Spatial Sequencing
- 12.6.7.3 Digital Spatial Profiling
- 12.6.7.4 Targeted and Multimodal Assays
- 12.6.8 Subsegment Pricing and Adoption Trends
- 12.6.9 Leading Suppliers and Competition
- 12.6.10 Regional Demand and Opportunities
- 12.7 By Country - Market Size and Forecast, 2025-2035
- 12.7.1 Segment Definition and Scope
- 12.7.2 Historical Market Size, 2018-2025
- 12.7.3 Revenue Forecast, 2025-2035
- 12.7.4 Volume Forecast, 2025-2035
- 12.7.5 Base-Year Market Share, 2025
- 12.7.6 Segment CAGR and Growth Drivers
- 12.7.7 Subsegment Market Size and Forecast
- 12.7.7.1 Mainland China
- 12.7.7.2 Japan
- 12.7.7.3 South Korea
- 12.7.7.4 Remaining APAC Markets
- 12.7.8 Subsegment Pricing and Adoption Trends
- 12.7.9 Leading Suppliers and Competition
- 12.7.10 Regional Demand and Opportunities
- 12.8 Segment Growth Comparison
- 12.9 Segment Attractiveness and Priority Matrix
Chapter 13 APAC Spatial Genomics and Transcriptomics End-Use and Application Market Outlook
- 13.1 End-Use Industry and Customer Demand Structure
- 13.2 Leading Applications and Customer Groups
- 13.3 End-Use Market Size, Share and Forecast
- 13.4 Major End-Use Industry Deep Dives
- 13.4.1 Customer Requirements and Use Cases
- 13.4.2 Demand and Replacement Cycles
- 13.4.3 Technical and Regulatory Considerations
- 13.4.4 Purchasing and Procurement Models
- 13.4.5 Leading Vendors and Distribution Channels
- 13.4.6 Forecast and Commercial Opportunities
- 13.5 Emerging Applications and Cross-Segment Demand
- 13.6 End-Use Industry Investment Priorities
Chapter 14 APAC Spatial Genomics and Transcriptomics Geographic Market Outlook, 2025-2035
- 14.1 Regional Market Size and Country-Level Shares, 2025
- 14.2 Country Market Size Comparison, 2025
- 14.3 Country Market Forecasts, 2025-2035
- 14.4 Subregional Industrial and Demand Clusters
- 14.5 Intra-Regional Pricing and Cost Differences
- 14.6 Cross-Border Trade and Supply Networks
- 14.7 Regional Supply and Demand Balances
- 14.8 Country Opportunity Comparison and Prioritization
Note: Every listed country is covered on the structure shown under the first country.
Chapter 15 APAC Spatial Genomics and Transcriptomics Technology, Innovation and Sustainability Outlook
- 15.1 Technology Landscape and Maturity
- 15.2 Product, Process and Service Innovation
- 15.3 AI, Automation and Digital Tools in the Industry
- 15.4 Technology Adoption and Performance Benchmarking
- 15.5 Innovation Pipeline and R&D Investment
- 15.6 Patent and Intellectual Property Trends
- 15.7 Energy Efficiency and Resource Management
- 15.8 Sustainability, Recycling and Circularity
- 15.9 Technology Roadmap, 2025-2035
- 15.10 Risks of Obsolescence and Technology Substitution
Chapter 16 APAC Spatial Genomics and Transcriptomics Market Key Strategic Imperatives
- 16.1 Growth and Market Entry Priorities
- 16.2 High-Return Products and Segments
- 16.3 Pricing, Profitability and Cost Optimization
- 16.4 Technology Investment and Product Differentiation
- 16.5 Supply Chain Localization and Resilience
- 16.6 Distribution and Customer Acquisition
- 16.7 Partnership, Acquisition and Capacity Strategy
- 16.8 Regional Expansion Priorities
- 16.9 Short-, Medium- and Long-Term Actions
Chapter 17 Competition Outlook
- 17.1 Industry Competition Characteristics
- 17.2 Market Structure and Concentration
- 17.3 Market Share and Competitive Positioning, 2025
- 17.4 Company-Wise Revenue and Product Benchmarking
- 17.5 Production and Service Capacity Benchmarking
- 17.6 Technology, Pricing and Differentiation
- 17.7 Regional Footprint and Distribution Strength
- 17.8 Mergers, Acquisitions and Strategic Alliances
- 17.9 New Entrants and Competitive Threats
- 17.10 Porter's Five Forces and Industry Attractiveness
- 17.11 Competitive Outlook, 2025-2035
Chapter 18 Company Profiles
- 18.1 Company Coverage and Selection Criteria
- 18.2 10x Genomics
- 18.2.1 Business Description
- 18.2.2 Company Ownership and Geographic Presence
- 18.2.3 Product and Service Portfolio
- 18.2.4 Manufacturing and Operating Footprint
- 18.2.5 Production Capacity and Expansion Plans
- 18.2.6 Financial Performance and Investment
- 18.2.7 Market Share and Competitive Position
- 18.2.8 Technology and Innovation Capabilities
- 18.2.9 Strategic Alliances or Partnerships
- 18.2.10 Recent Developments
- 18.2.11 Growth Strategy and Outlook
- 18.3 Bruker
- 18.4 STOmics
- 18.5 Macrogen
- 18.6 Thermo Fisher Scientific
- 18.7 Bio-Techne
- 18.8 Vizgen
- 18.9 Takara Bio
- 18.10 LC-Bio
- 18.11 Cloud-Seq
- 18.12 Other Relevant Market Participants
Note: Every listed company is profiled on the structure shown under the first company. The company list is preliminary and may change based on research findings, market developments, data availability and client requirements.
Chapter 19 Disclaimer
- 19.1 Research and Forecast Disclaimer
- 19.2 Data Source and Estimation Limitations
Note: The depth of individual sections depends on data availability for this market. Volume, capacity, trade and other unit-based metrics are included where applicable.

