
Multiplex Biomarker Imaging Market Overview:
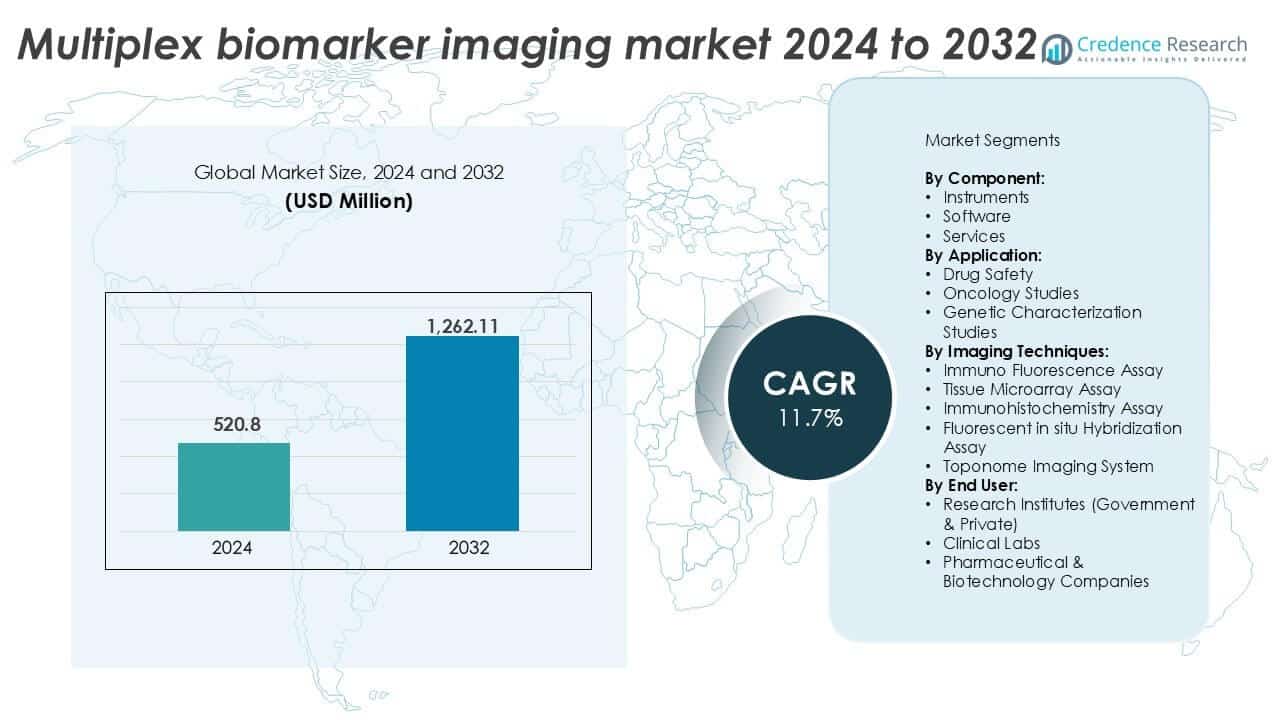
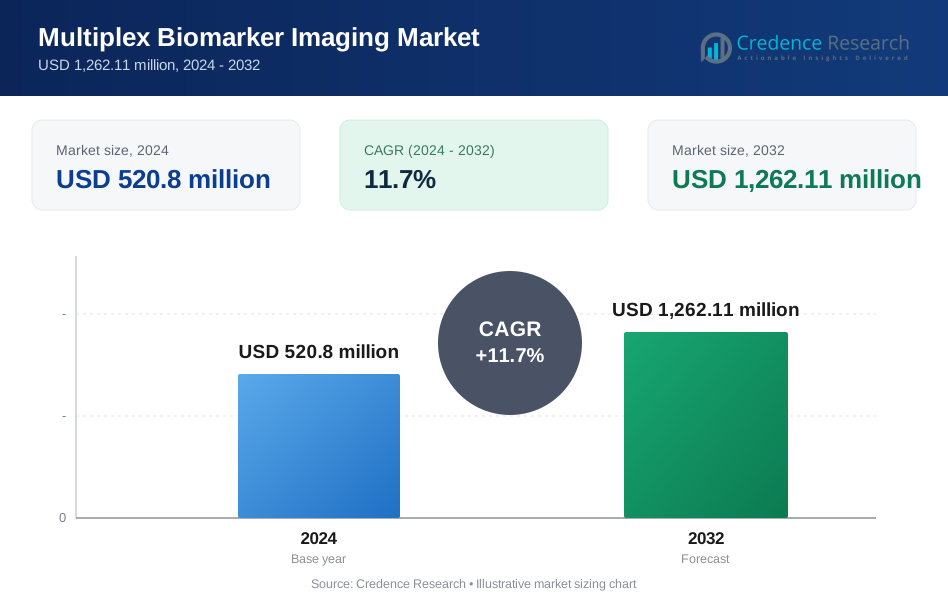
The Multiplex Biomarker Imaging Market size was valued at USD 520.8 million in 2024 and is anticipated to reach USD 1,262.11 million by 2032, at a CAGR of 11.7% during the forecast period.
| REPORT ATTRIBUTE | DETAILS |
|---|---|
| Historical Period | 2020-2023 |
| Base Year | 2024 |
| Forecast Period | 2025-2032 |
| Multiplex Biomarker Imaging Market Size 2024 | USD 520.8 million |
| Multiplex Biomarker Imaging Market, CAGR | 11.7% |
| Multiplex Biomarker Imaging Market Size 2032 | USD 1,262.11 million |
The multiplex biomarker imaging market is led by key players such as Thermo Fisher Scientific, Bio-Rad Laboratories, PerkinElmer, Illumina, and F. Hoffmann-La Roche. These companies offer advanced imaging platforms, multiplex assay kits, and integrated software solutions that support high-resolution spatial profiling and biomarker analysis. U.S.-based firms dominate through strong R&D capabilities and established distribution networks. European players like Merck KGaA and Leica Biosystems also maintain significant presence, particularly in histopathology-based imaging systems. North America leads the global market with over 40% share, driven by strong clinical research infrastructure, funding support, and early adoption of digital pathology and precision oncology tools. Europe follows with close to 30% share, while Asia-Pacific is emerging rapidly due to expanding biopharma sectors and research investments.
Multiplex Biomarker Imaging Market Insights
- The Multiplex Biomarker Imaging Market was valued at USD 520.8 million in 2024 and is projected to reach USD 1,262.11 million by 2032, growing at a CAGR of 11.7%.
- Rising demand for spatial biology in oncology and drug discovery programs is fueling strong adoption of multiplex imaging platforms.
- AI-powered image analysis and growing use in neurodegenerative and infectious disease research are driving new applications.
- Key players such as Thermo Fisher Scientific, Bio-Rad, and Merck KGaA compete through platform innovation, antibody portfolios, and partnerships with academic institutions.
- North America leads with over 40% share, followed by Europe at 30%, while Asia-Pacific is the fastest-growing. Instruments dominate the component segment, and oncology studies hold the largest share by application.
Multiplex Biomarker Imaging Market Segmentation Analysis:
By Component
Instruments dominate the multiplex biomarker imaging market, accounting for the largest share due to their central role in high-throughput and high-resolution analysis. Advanced imaging systems enable precise spatial profiling and multiplex detection, which is essential in translational and clinical research. The demand for instruments is driven by continuous innovation in optics, automation, and real-time data acquisition. Software is growing steadily with the increasing complexity of image analysis, while services gain traction for offering outsourced imaging solutions, especially among small research labs and biotechnology startups seeking cost-effective operations.
- For instance, Akoya Biosciences’ Phenoptics platform enables simultaneous detection of up to 8 protein markers on a single tissue section using tyramide signal amplification.
By Application
Oncology studies lead the market by application, contributing the highest revenue share. This dominance is due to the rising global cancer burden and the need for detailed tumor microenvironment profiling. Multiplex imaging allows researchers to identify co-expression of multiple biomarkers in cancer tissues, supporting drug discovery and immunotherapy development. Drug safety applications also hold a notable share, as multiplexing helps assess toxicity responses at the molecular level. Genetic characterization studies are emerging, particularly in developmental biology and rare disease research, where spatial gene expression mapping is critical for understanding disease mechanisms.
- For instance, NanoString’s GeoMx Digital Spatial Profiler measures over 1,800 RNA targets per tissue section in cancer studies.
By Imaging Techniques
Immuno Fluorescence Assay holds the largest share among imaging techniques, driven by its widespread use, high sensitivity, and compatibility with multiple biomarker detection in tissue samples. Immunohistochemistry follows, used extensively in pathology labs. Meanwhile, research institutes both government and private represent the dominant end-user segment, due to strong academic adoption and research funding. Pharmaceutical and biotechnology companies also contribute significantly, especially in clinical trial imaging and biomarker validation phases. Clinical labs are expanding usage as multiplex technologies gradually integrate into advanced diagnostic workflows.
Multiplex Biomarker Imaging Market Key Growth Drivers
Rising Demand for Spatial Biology in Oncology Research
Multiplex biomarker imaging plays a vital role in advancing spatial biology, particularly in cancer research. Researchers increasingly rely on spatial resolution to understand tumor heterogeneity, immune cell infiltration, and biomarker co-localization within tissue sections. This technique enables comprehensive profiling of the tumor microenvironment, aiding the development of targeted immunotherapies and combination treatments. With the growing adoption of immuno-oncology approaches, pharmaceutical and biotechnology companies are investing in high-plex imaging tools to improve biomarker discovery and patient stratification. Clinical research organizations and academic centers are also expanding their use of spatial imaging for translational studies. As precision medicine initiatives grow globally, especially in the U.S., Europe, and China, demand for high-content spatial imaging platforms continues to rise. These solutions support both preclinical and clinical phases, driving sustained instrument and software adoption across oncology-focused research programs.
- For instance, NanoString’s GeoMx DSP enables simultaneous measurement of over 1,800 RNA targets or more than 100 protein targets from a single tissue section with spatial indexing.
Increasing Investments in Biomarker Discovery and Drug Development
Pharmaceutical and biotechnology firms are expanding biomarker discovery programs to improve drug development efficiency and regulatory success. Multiplex biomarker imaging supports this by offering simultaneous visualization of multiple molecular targets in a single tissue sample, preserving spatial context. This capability is essential for identifying predictive biomarkers, validating target engagement, and monitoring pharmacodynamic responses. As drug pipelines become more targeted and personalized, companies integrate imaging platforms early in development to reduce failure rates and optimize clinical trial design. Government and private research funding agencies also support biomarker research as part of precision medicine and rare disease initiatives. With this momentum, demand for instruments, reagents, and image analysis tools is increasing. Regulatory bodies are recognizing multiplex assays in companion diagnostic development, further strengthening the market outlook. Continued funding and partnerships between academia and industry enhance innovation and product accessibility.
- For instance, Akoya Biosciences’ PhenoCycler-Fusion system supports detection of more than 100 protein markers on a single slide using cyclic immunofluorescence.
Expansion of Advanced Imaging Infrastructure in Academic and Research Institutions
Universities and research hospitals are investing in advanced imaging core facilities to support multi-disciplinary studies involving immunology, neuroscience, oncology, and regenerative medicine. These facilities are equipping themselves with high-resolution multiplex imaging systems, which offer subcellular detail and multiplexed detection across large tissue areas. Government grants and public-private research collaborations fund infrastructure development, particularly in North America and Europe. As academic institutions adopt digital pathology and spatial omics workflows, demand for integrated multiplex imaging tools and analytical software is increasing. Training programs and open-access research data also accelerate adoption across global academic communities. The availability of standardized protocols and validated antibodies further enhances research quality and reproducibility. These advancements enable high-impact publications and translational research outcomes, encouraging long-term institutional investment in multiplex biomarker imaging platforms. This infrastructure expansion fuels steady market growth, particularly in the instruments and software segments.
Multiplex Biomarker Imaging Market Key Trends & Opportunities
Integration of AI and Image Analysis Platforms
Artificial intelligence (AI) and machine learning tools are transforming multiplex biomarker image analysis by enabling faster, more accurate interpretation of complex datasets. As imaging outputs increase in volume and dimensionality, traditional manual analysis becomes impractical. AI platforms automate image segmentation, object detection, and spatial relationship mapping, improving workflow efficiency and reproducibility. Companies are launching AI-powered software that integrates seamlessly with multiplex imaging systems, allowing end-users to process high-content data in real time. For example, deep learning algorithms can identify tumor-immune cell interactions and classify tissue phenotypes across large datasets. This trend is especially beneficial in clinical research and pathology, where precise, scalable analysis supports biomarker validation and diagnostic development. The integration of AI also opens opportunities for cloud-based data sharing, collaborative studies, and large-scale bioinformatics research, enhancing the value proposition of multiplex biomarker imaging across industries.
- For instance, PathAI’s AISight platform processes whole-slide images exceeding 100,000 cells per tissue section and supports multi-marker spatial analysis for oncology research.
Growing Adoption in Neurodegenerative and Infectious Disease Research
Beyond oncology, multiplex biomarker imaging is gaining traction in neuroscience and infectious disease applications. In neurodegenerative disease research, scientists use high-plex imaging to examine protein aggregates, glial activation, and neuroinflammation within brain tissues. This helps characterize disease progression in conditions such as Alzheimer’s and Parkinson’s. Similarly, infectious disease researchers use spatial imaging to study host-pathogen interactions at the cellular level, including viral infiltration patterns and immune responses. The COVID-19 pandemic accelerated the adoption of tissue-based imaging tools to study lung pathology and immune modulation. These expanding applications create new commercial opportunities for imaging system manufacturers and reagent providers. Academic research centers and public health labs continue to integrate multiplex workflows into broader disease research programs. As knowledge of disease mechanisms deepens, demand for comprehensive, spatially resolved biomarker profiling will grow across multiple therapeutic areas.
Multiplex Biomarker Imaging Market Key Challenges
High Cost of Instruments and Operational Complexity
Multiplex biomarker imaging systems are capital-intensive, with high upfront costs for instruments, reagents, and associated software. Many systems also require specialized infrastructure, including dark rooms, cooling systems, and high-end computing for image processing. This limits access for small- to mid-sized laboratories and restricts adoption in low- and middle-income regions. In addition to equipment expenses, the operational complexity of running multiplex assays—such as antibody validation, protocol optimization, and data interpretation—requires skilled personnel and extended training. These barriers reduce market penetration, especially in clinical settings where cost efficiency and turnaround time are critical. Although vendors are offering bundled services and leasing options, affordability remains a key hurdle. Simplifying workflows and reducing cost per test through multiplexing innovations will be essential for broader market expansion.
Standardization and Reproducibility Issues in Multi-Site Studies
Despite growing adoption, multiplex biomarker imaging faces challenges in standardization across laboratories and studies. Variability in sample preparation, antibody performance, staining protocols, and image acquisition parameters can lead to inconsistent results. This is particularly problematic in multi-site clinical trials or collaborative research projects, where reproducibility is critical. Lack of harmonized guidelines for multiplex assay design, data normalization, and quality control impacts confidence in clinical validation. Furthermore, differences in imaging platform specifications and software tools add complexity to cross-study comparisons. Regulatory bodies require high assay consistency for companion diagnostic approval, making standardization a priority. Industry consortia, such as those developing standard operating procedures and open-source analysis platforms, are working to address these gaps. However, continued effort in protocol harmonization, proficiency testing, and collaborative benchmarking will be required to fully overcome this challenge.
Multiplex Biomarker Imaging Market Regional Analysis
North America
North America holds the largest share in the multiplex biomarker imaging market, accounting for over 40% of global revenue. This dominance is driven by advanced healthcare infrastructure, strong presence of key market players, and high research funding. The U.S. leads regional growth, supported by government-backed cancer research programs and widespread adoption of digital pathology tools. Academic institutes and biopharmaceutical companies invest heavily in high-plex imaging systems for oncology and immunology research. Growing clinical trial activity and regulatory support for biomarker-based diagnostics further strengthen demand. Continuous innovation and partnerships fuel long-term regional leadership in both instruments and software segments.
Europe
Europe captures nearly 30% of the global multiplex biomarker imaging market, driven by robust academic research and expanding precision medicine initiatives. Countries such as Germany, the U.K., and France lead adoption due to well-established biopharma sectors and government-backed healthcare reforms. EU programs supporting cancer diagnostics and digital pathology are creating opportunities for platform deployment in hospitals and research institutes. The region benefits from strong collaborations between universities and industry players. Growth is also supported by increasing use of multiplex imaging in neurology and infectious disease research. Continued focus on standardization and AI integration enhances market maturity across the region.
Asia-Pacific
Asia-Pacific holds approximately 20% market share and is the fastest-growing region in the multiplex biomarker imaging market. China, Japan, South Korea, and Australia drive growth due to rising investment in life sciences, expanding biotechnology sectors, and increased research collaborations. Governments across the region support precision medicine and translational research through funding and infrastructure development. Pharmaceutical companies in China and India are adopting multiplex platforms for drug discovery and target validation. Rising cancer incidence and demand for early diagnostics fuel market expansion. The shift toward AI-driven imaging and adoption of digital pathology accelerate regional uptake, especially in academic and hospital-based labs.
Latin America
Latin America accounts for a modest market share of around 5%, but shows steady growth potential driven by improving research infrastructure and rising healthcare investment. Brazil and Mexico lead adoption due to expanding oncology research and the presence of regional biotech hubs. Public-private collaborations and government initiatives in cancer control support the integration of multiplex imaging in academic and clinical environments. Budget constraints and limited access to high-end platforms remain barriers; however, the introduction of cost-effective imaging tools and training programs is improving accessibility. Gradual awareness of biomarker-based diagnostics is expected to support long-term regional growth.
Middle East & Africa
The Middle East & Africa hold the smallest share in the multiplex biomarker imaging market, under 5%, mainly due to limited infrastructure and funding challenges. However, countries like the UAE, Saudi Arabia, and South Africa are investing in healthcare modernization and research capabilities. Rising prevalence of chronic diseases, especially cancer, is prompting demand for advanced diagnostic technologies. Academic collaborations with European and North American institutions help introduce imaging tools into regional labs. Government healthcare reforms and private investments are gradually improving market access. While adoption is slow, long-term growth is expected as awareness and digital infrastructure improve across key markets.
Multiplex Biomarker Imaging Market Segmentations:
By Component:
- Instruments
- Software
- Services
By Application:
- Drug Safety
- Oncology Studies
- Genetic Characterization Studies
By Imaging Techniques:
- Immuno Fluorescence Assay
- Tissue Microarray Assay
- Immunohistochemistry Assay
- Fluorescent in situ Hybridization Assay
- Toponome Imaging System
By End User:
- Research Institutes (Government & Private)
- Clinical Labs
- Pharmaceutical & Biotechnology Companies
By Geography:
- North America
- U.S.
- Canada
- Mexico
- Europe
- Germany
- France
- U.K.
- Italy
- Spain
- Rest of Europe
- Asia Pacific
- China
- Japan
- India
- South Korea
- South-east Asia
- Rest of Asia Pacific
- Latin America
- Brazil
- Argentina
- Rest of Latin America
- Middle East & Africa
- GCC Countries
- South Africa
- Rest of the Middle East and Africa
Competitive Landscape
The multiplex biomarker imaging market features a competitive landscape marked by technological innovation, strategic partnerships, and product expansion by key players. Companies like Thermo Fisher Scientific, Bio-Rad Laboratories, and PerkinElmer lead the market with comprehensive imaging platforms, reagents, and software tools tailored for high-plex analysis. European firms such as Merck KGaA and Leica Biosystems focus on histology-integrated imaging systems, enhancing clinical and research applications. Firms including Abcam and Enzo Biochem offer validated antibodies and assay kits critical for multiplex assay reliability. Illumina and Roche support genomics-linked spatial profiling solutions, bridging molecular data and tissue context. Players such as Revvity and MESO SCALE DIAGNOSTICS strengthen the market with scalable imaging platforms and multiplex immunoassays. Strategic moves include acquisitions, R&D investments, and integration of AI-based image analysis software. Collaboration with academic institutions and biopharma companies accelerates innovation and global reach. The market remains dynamic, with players competing on precision, throughput, scalability, and ease of integration.
Key Player Analysis
- Revvity (U.S.)
- Abcam Limited (U.K.)
- ToposNomos GmbH (Germany)
- EKF Diagnostics Holdings plc (U.K.)
- MESO SCALE DIAGNOSTICS, LLC. (U.S.)
- F. Hoffmann-La Roche Ltd. (Switzerland)
- Enzo Biochem Inc. (U.S.)
- Leica Biosystems Nussloch GmbH (Germany)
- Illumina, Inc. (U.S.)
- Merck KGaA (Germany)
- Bio-Rad Laboratories, Inc. (U.S.)
- PerkinElmer (U.S.)
- Thermo Fisher Scientific Inc. (U.S.)
Recent Developments
- In December 2024, ZEISS announced a partnership with Mindpeak, a leader in AI-driven pathology solutions, to co-develop an integrated Multiplex Immunofluorescence (mIF) platform tailored for pathologists working in research, diagnostics, and clinical settings. Leveraging Mindpeak’s expertise in AI-based tissue image analysis particularly its clinically validated algorithms alongside ZEISS’s advanced imaging instruments and software, the collaboration aims to unify both companies’ technologies into a comprehensive solution. This joint effort is designed to deliver greater value to users while addressing the needs of diverse market segments
- In 2024, llumina Inc. announced that part of their latest research would be presented at the American Society of Clinical Oncology (ASCO) Annual Meeting in Chicago from May 31 to June 4. Highlights include data from several studies in partnership with Labcorp, demonstrating additional evidence to support the use of comprehensive genomic profiling (CGP) over single gene testing (SGT) and the most recent data supporting the development of Illumina's molecular residual disease (MRD) assay, which is currently underway in collaboration with major In all, Illumina had 14 abstracts accepted for the conference.
- In 2024, Merck intends to purchase Mirus Bio for USD 600 million. Mirus Bio, based in Madison, Wisconsin, focuses on the development and sale of transfection reagents. Transfection reagents, including Mirus Bio's TransIT-VirusGEN®, help genetic material enter cells. The compounds are essential in the creation of viral vectors for cell and gene therapies.
- In January 2023, Agilent Technologies announced a strategic partnership with Akoya Biosciences to develop multiplex immunohistochemistry (mIHC) diagnostic solutions and commercialize end-to-end workflow systems for tissue biomarker analysis in clinical research. The collaboration integrates Agilent’s Dako Omnis autostaining instrument with Akoya’s PhenoImager HT imaging platform, creating a comprehensive solution for multiplex chromogenic and immunofluorescent assays. This partnership aims to support companion diagnostics and enable biopharma companies to accelerate biomarker discovery and patient stratification in precision cancer therapeutics.
Report Coverage
The research report offers an in-depth analysis based on Component, Application, Imaging Techniques, End-User and Geography. It details leading market players, providing an overview of their business, product offerings, investments, revenue streams, and key applications. Additionally, the report includes insights into the competitive environment, SWOT analysis, current market trends, as well as the primary drivers and constraints. Furthermore, it discusses various factors that have driven market expansion in recent years. The report also explores market dynamics, regulatory scenarios, and technological advancements that are shaping the industry. It assesses the impact of external factors and global economic changes on market growth. Lastly, it provides strategic recommendations for new entrants and established companies to navigate the complexities of the market.
Future Outlook
- Demand for spatial biology tools will continue to rise across oncology and immunology research.
- Integration of AI and machine learning will improve image analysis speed and accuracy.
- Multiplex imaging will expand into clinical diagnostics alongside research applications.
- Companies will focus on developing simplified, scalable, and user-friendly imaging platforms.
- Collaborations between industry and academic research centers will drive innovation.
- Adoption in neurodegenerative and infectious disease research will gain momentum.
- Regulatory support for companion diagnostics using multiplex assays will strengthen.
- Emerging markets will show increased investment in imaging infrastructure and training.
- Cloud-based platforms will support remote data analysis and cross-site collaborations.
- Standardization of assay protocols and software workflows will improve reproducibility.
Request a Free Sample
Fill in your details and we'll send you a free sample report.
- Sample data tables & charts
- Research methodology
Need a Custom Version of This Report?
Tailor the scope, geography, or segments to your exact requirements.
- Custom geography or segment scope
- Direct access to our analyst team
Frequently Asked Questions
What is the current market size for the Multiplex biomarker imaging market, and what is its projected size in 2032?
At what Compound Annual Growth Rate is the Multiplex biomarker imaging market projected to grow between 2024 and 2032?
Which Multiplex biomarker imaging market segment held the largest share in 2024?
What are the primary factors fueling the growth of the Multiplex biomarker imaging market?
Who are the leading companies in the Multiplex biomarker imaging market?
Which region commanded the largest share of the Multiplex biomarker imaging market in 2024?
Table of Content
Chapter 1. Report Introduction
- 1.1 Report Description & Purpose
- 1.1.1 Report Title & Market Definition
- 1.1.2 Unique Selling Propositions (USP) & Key Differentiators
- 1.1.3 Value Proposition for Stakeholders
- 1.2 Research Objectives
- 1.2.1 Market Sizing Objectives (Volume & Revenue)
- 1.2.2 Segmentation Objectives
- 1.2.3 Competitive Intelligence Objectives
- 1.2.4 Forecast & Scenario Objectives
- 1.3 Report Scope
- 1.3.1 Multiplex Biomarker Imaging Scope – Types & Subtypes Covered
- 1.3.2 Geographic Scope – Regions & Countries Covered
- 1.3.3 Historical Period, Base Year & Forecast Period (2024; forecast to 2032)
- 1.3.4 Inclusions & Exclusions
- 1.4 HS Code & Classification Framework
- 1.5 Currency, Units & Pricing Basis
- 1.6 Target Stakeholders
- 1.7 Limitations & Assumptions
Chapter 2. Executive Summary
- 2.1 Global Multiplex Biomarker Imaging Market Snapshot
- 2.1.1 Market Size – Historical (2024) & Forecast (2024-2032) (2024: USD 520.8 million → 2032: USD 1,262.11 million)
- 2.1.2 Volume & Revenue – Global Totals
- 2.1.3 Key Market Highlights – Top Five Facts
- 2.2 Multiplex Biomarker Imaging Market Segmentation Snapshot
- 2.2.1 Market Split by Region – 2024 vs. 2032
- 2.3 Competitive Snapshot
- 2.3.1 Top 10 Players by Revenue Share – 2024
- 2.3.2 Top 10 Players by Volume Share – 2024
- 2.3.3 Recent Strategic Developments (18-Month Summary)
- 2.4 Key Investment Highlights & Strategic Conclusions
Chapter 3. Multiplex Biomarker Imaging Market Dynamics & Industry Analysis
- 3.1 Market Overview & Context
- 3.1.1 Multiplex Biomarker Imaging Market Position in the Broader Automotive Value Chain
- 3.1.2 OEM vs. Replacement Market Dynamics
- 3.1.3 Market Maturity & Development Stage by Region
- 3.2 Multiplex Biomarker Imaging Market Drivers
- 3.3 Multiplex Biomarker Imaging Market Restraints & Challenges
- 3.4 Multiplex Biomarker Imaging Market Opportunities
- 3.5 Porter's Five Forces Analysis
- 3.5.1 Threat of New Entrants
- 3.5.2 Bargaining Power of Suppliers
- 3.5.3 Bargaining Power of Buyers
- 3.5.4 Threat of Substitutes
- 3.5.5 Competitive Rivalry – Intensity Assessment
- 3.6 Multiplex Biomarker Imaging Value Chain Analysis
- 3.6.1 Upstream – Raw Material/Input Suppliers
- 3.6.1.1 Raw Material/Input 1
- 3.6.1.2 Raw Material/Input 2
- 3.6.1.3 Raw Material/Input 3
- 3.6.2 Midstream – Production/Manufacturing/Service Delivery
- 3.6.2.1 Production/Process Overview
- 3.6.2.2 Key Facility Locations & Capacity by Manufacturer
- 3.6.3 Downstream – Distribution & End Consumer
- 3.6.3.1 Primary Channel – B2B/OEM
- 3.6.3.2 Secondary Channels – Dealer, Retail, Online, Direct
- 3.6.4 Value Chain Profitability Analysis
- 3.6.1 Upstream – Raw Material/Input Suppliers
- 3.7 PESTEL Analysis
- 3.7.1 Political Factors
- 3.7.2 Economic Factors
- 3.7.3 Social Factors
- 3.7.4 Technological Factors
- 3.7.5 Environmental Factors
- 3.7.6 Legal Factors
- 3.8 Multiplex Biomarker Imaging Supply Chain Analysis
- 3.8.1 Raw Material/Input Supply Risk Assessment
- 3.8.2 Manufacturing Concentration Risk (Geographic Exposure)
- 3.8.3 Trade Disruption Impact Analysis
- 3.9 Regulatory & Policy Landscape
Note: The regulatory and policy landscape section covers regulations based on their applicability to the market, Multiplex Biomarker Imaging category, geography, and scope of the study. Only regulatory frameworks with a material impact on operations, compliance, trade, sustainability, or market access are analyzed in detail.
Chapter 4. Key Investment Pockets & Opportunity Analysis
- 4.1 Multiplex Biomarker Imaging Market Attractiveness Analysis
- 4.1.1 By Region – Investment Attractiveness Matrix (Volume × CAGR)
- 4.2 Absolute Revenue Growth Opportunity
- 4.2.1 By Region – Absolute USD Growth Through 2032
- 4.3 Incremental Volume Opportunity
- 4.3.1 By Region – Incremental Volume Through 2032
- 4.3.2 Segment – Incremental Volume
- 4.4 Emerging Submarket Opportunity Deep Dive (Subject to Applicability)
- 4.5 Emerging Market Opportunity Scorecards
- 4.5.1 United States
- 4.5.2 Europe
- 4.5.3 Asia
- 4.5.4 Middle East & Africa
Note: Emerging Market Opportunity Scorecards will be included based on relevance and strategic importance. Regions listed are indicative and may vary depending on data availability and market dynamics.
Chapter 5. Multiplex Biomarker Imaging Import-Export Analysis & Trade Flows
- 5.1 Global Trade Overview
- 5.1.1 Global Export Value by Country (2024)
- 5.1.2 Global Export Volume by Country (2024)
- 5.1.3 Global Import Value by Country (2024)
- 5.1.4 Global Import Volume by Country (2024)
- 5.1.5 Net Trade Balance by Country (2024)
- 5.2 Export Analysis – Segment
- 5.2.1 Type 1 (HS Code)
- 5.2.2 Type 2 (HS Code)
- 5.2.3 Type 3 (HS Code)
- 5.2.4 Type 4 (HS Code)
- 5.2.5 Type 5 (HS Code)
- 5.3 Import Analysis – Segment
- 5.3.1 Type 1 (HS Code)
- 5.3.2 Type 2 (HS Code)
- 5.3.3 Type 3 (HS Code)
- 5.3.4 Type 4 (HS Code)
- 5.3.5 Type 5 (HS Code)
- 5.4 Average Unit Trade Prices
- 5.4.1 Average Export Price – Segment & Country
- 5.4.2 Average Import Price – Segment & Source Country
- 5.4.3 Price Trends (2024)
- 5.5 Key Trade Route Analysis
- 5.5.1 Trade Route 1
- 5.5.2 Trade Route 2
- 5.5.3 Trade Route 3
- 5.5.4 Trade Route 4
- 5.5.5 Trade Route 5
- 5.6 Trade Policy Impact Assessment
- 5.6.1 US Anti-Dumping & Section 301 Tariffs
- 5.6.2 EU Customs Union Impact
- 5.6.3 Major Free Trade Agreements
- 5.6.4 USMCA Rules of Origin
Note: Trade policy analysis will be included only where relevant to the Multiplex Biomarker Imaging market.
Chapter 6. Competitive Landscape & Company Benchmarking
- 6.1 Multiplex Biomarker Imaging Market Concentration & Structure
- 6.1.1 Herfindahl-Hirschman Index (HHI) – vs. 2024
- 6.1.2 Tier 1, Tier 2 & Tier 3 Market Structure
- 6.1.3 Global, Regional & Local Player Dynamics
- 6.2 Multiplex Biomarker Imaging Market Share Analysis – 2024
- 6.2.1 Global Revenue Share by Company
- 6.2.2 Global Volume Share by Company
- 6.2.3 Regional Revenue Share
- 6.2.4 Market Share Evolution ( vs. 2024)
- 6.2.5 OEM Segment Share by Company
- 6.2.6 Replacement Segment Share by Company
- 6.3 Production/Delivery Capacity & Facility Analysis
- 6.3.1 Global Installed Capacity
- 6.3.2 Capacity Utilization Rates
- 6.3.3 Production/Output Volume
- 6.3.4 Facility Locations & Capacity Map
- 6.3.5 Planned Capacity Additions
- 6.4 Multiplex Biomarker Imaging Competitive Benchmarking Matrix
- 6.4.1 Revenue, Volume, CAGR & Profitability Comparison
- 6.4.2 Channel Revenue Mix
- 6.4.3 Geographic Revenue Exposure
- 6.4.4 R&D Intensity
- 6.4.5 Sustainability Maturity
- 6.5 Strategic Developments in Multiplex Biomarker Imaging (Last 24 Months)
- 6.5.1 Mergers, Acquisitions & Divestments
- 6.5.2 New Multiplex Biomarker Imaging Launches
- 6.5.3 Facility Expansions
- 6.5.4 Strategic Alliances, Joint Ventures & Partnerships
- 6.5.5 Distribution Expansion & Market Entry
- 6.5.6 Sustainability & ESG Initiatives
- 6.6 Competitive Strategy Mapping
- 6.6.1 Leader, Challenger, Follower & Niche Classification
- 6.6.2 Pricing Strategy Comparison
- 6.6.3 Channel Strategy Matrix
Note: Strategic developments are included based on their materiality and the availability of reliable information.
Chapter 7. Global Multiplex Biomarker Imaging Market – By Distribution Channel
- 7.1 Segment Overview
- 7.1.1 Volume & Revenue Split by Channel (2024 & 2032)
- 7.1.2 Channel Mix Evolution (2024-2032)
Chapter 8. Regional Market Analysis – Global Overview
- 8.1 Global Regional Overview
- 8.1.1 Regional Volume Share
- 8.1.2 Regional Revenue Share
- 8.1.3 Regional Volume by Region
- 8.1.4 Regional Revenue by Region
- 8.1.5 Regional Forecast Through 2032
- 8.2 Cross-Regional Segment Analysis
- 8.2.1 By Distribution Channel
- 8.2.2 By Brand/Price Tier
Chapter 9. North America Multiplex Biomarker Imaging Market
- 9.1 United States
- 9.2 Canada
- 9.3 Mexico
Chapter 10. Europe Multiplex Biomarker Imaging Market
- 10.1 Germany
- 10.2 France
- 10.3 Italy
- 10.4 United Kingdom
- 10.5 Spain
- 10.6 Poland
- 10.7 Russia
- 10.8 Netherlands
- 10.9 Belgium
- 10.10 Sweden
- 10.11 Denmark
- 10.12 Norway
- 10.13 Rest of Europe
Chapter 11. Asia Pacific Multiplex Biomarker Imaging Market
- 11.1 China
- 11.2 India
- 11.3 Japan
- 11.4 South Korea
- 11.5 Thailand
- 11.6 Indonesia
- 11.7 Vietnam
- 11.8 Malaysia
- 11.9 Australia
- 11.10 Rest of Asia Pacific
Chapter 12. Latin America Multiplex Biomarker Imaging Market
- 12.1 Brazil
- 12.2 Argentina
- 12.3 Colombia
- 12.4 Chile
- 12.5 Rest of Latin America
Chapter 13. Middle East Multiplex Biomarker Imaging Market
- 13.1 Saudi Arabia
- 13.2 United Arab Emirates
- 13.3 Turkey
- 13.4 Israel
- 13.5 Iran
- 13.6 Rest of the Middle East
Chapter 14. Africa Multiplex Biomarker Imaging Market
- 14.1 South Africa
- 14.2 Egypt
- 14.3 Nigeria
- 14.4 Morocco
- 14.5 Rest of Africa
Chapter 15. Multiplex Biomarker Imaging Company Profiles
- 15.1 [Company 01]
- 15.1.1 Company Overview
- 15.1.2 Key Management Personnel
- 15.1.3 Products & Services Portfolio
- 15.1.4 Financial Performance
- 15.1.5 Key Market Focus & Geographic Presence
- 15.1.6 Recent Developments & Strategic Initiatives
Note: The company profile list is preliminary and may change based on research findings, market developments, data availability, and client requirements.
Chapter 16. Appendices
- Appendix A – List of Abbreviations & Acronyms
- Appendix B – Industry Classification Code Reference – Full Series
- Appendix C – Production & Capacity Data Tables
- Appendix D – End-Use & Demand Base Tables
- Appendix E – Consumption & Replacement Rate Assumptions
- Appendix F – ASP Reference Tables
- Appendix G – Manufacturing & Facility Database
- Appendix H – Import-Export Data Tables
- Appendix I – Regulatory Summary Tables
- Appendix J – Primary Research Participant List (Anonymized)
- Appendix K – Primary Research Questionnaire Framework
- Appendix L – Data Sources & Bibliography
- Appendix M – Market Size Divergence & Source Comparison
Chapter 17. Research Methodology
- 17.1 Research Framework & Philosophy
- 17.2 Secondary Research – Sources, Hierarchy & Data Extraction
- 17.3 Data Modeling – Bottom-Up & Top-Down Market Sizing
- 17.4 Primary Research – Stakeholder Framework, LOI & Sample Sizes
- 17.5 Forecast Methodology – Regression, Scenario & Sensitivity Analysis
- 17.6 Quality Control – Four-Layer Validation Framework
- 17.7 Limitations & Standard Assumptions
- 17.8 Disclaimer
