
Withdrawal rules and online volume push firms to fix returns
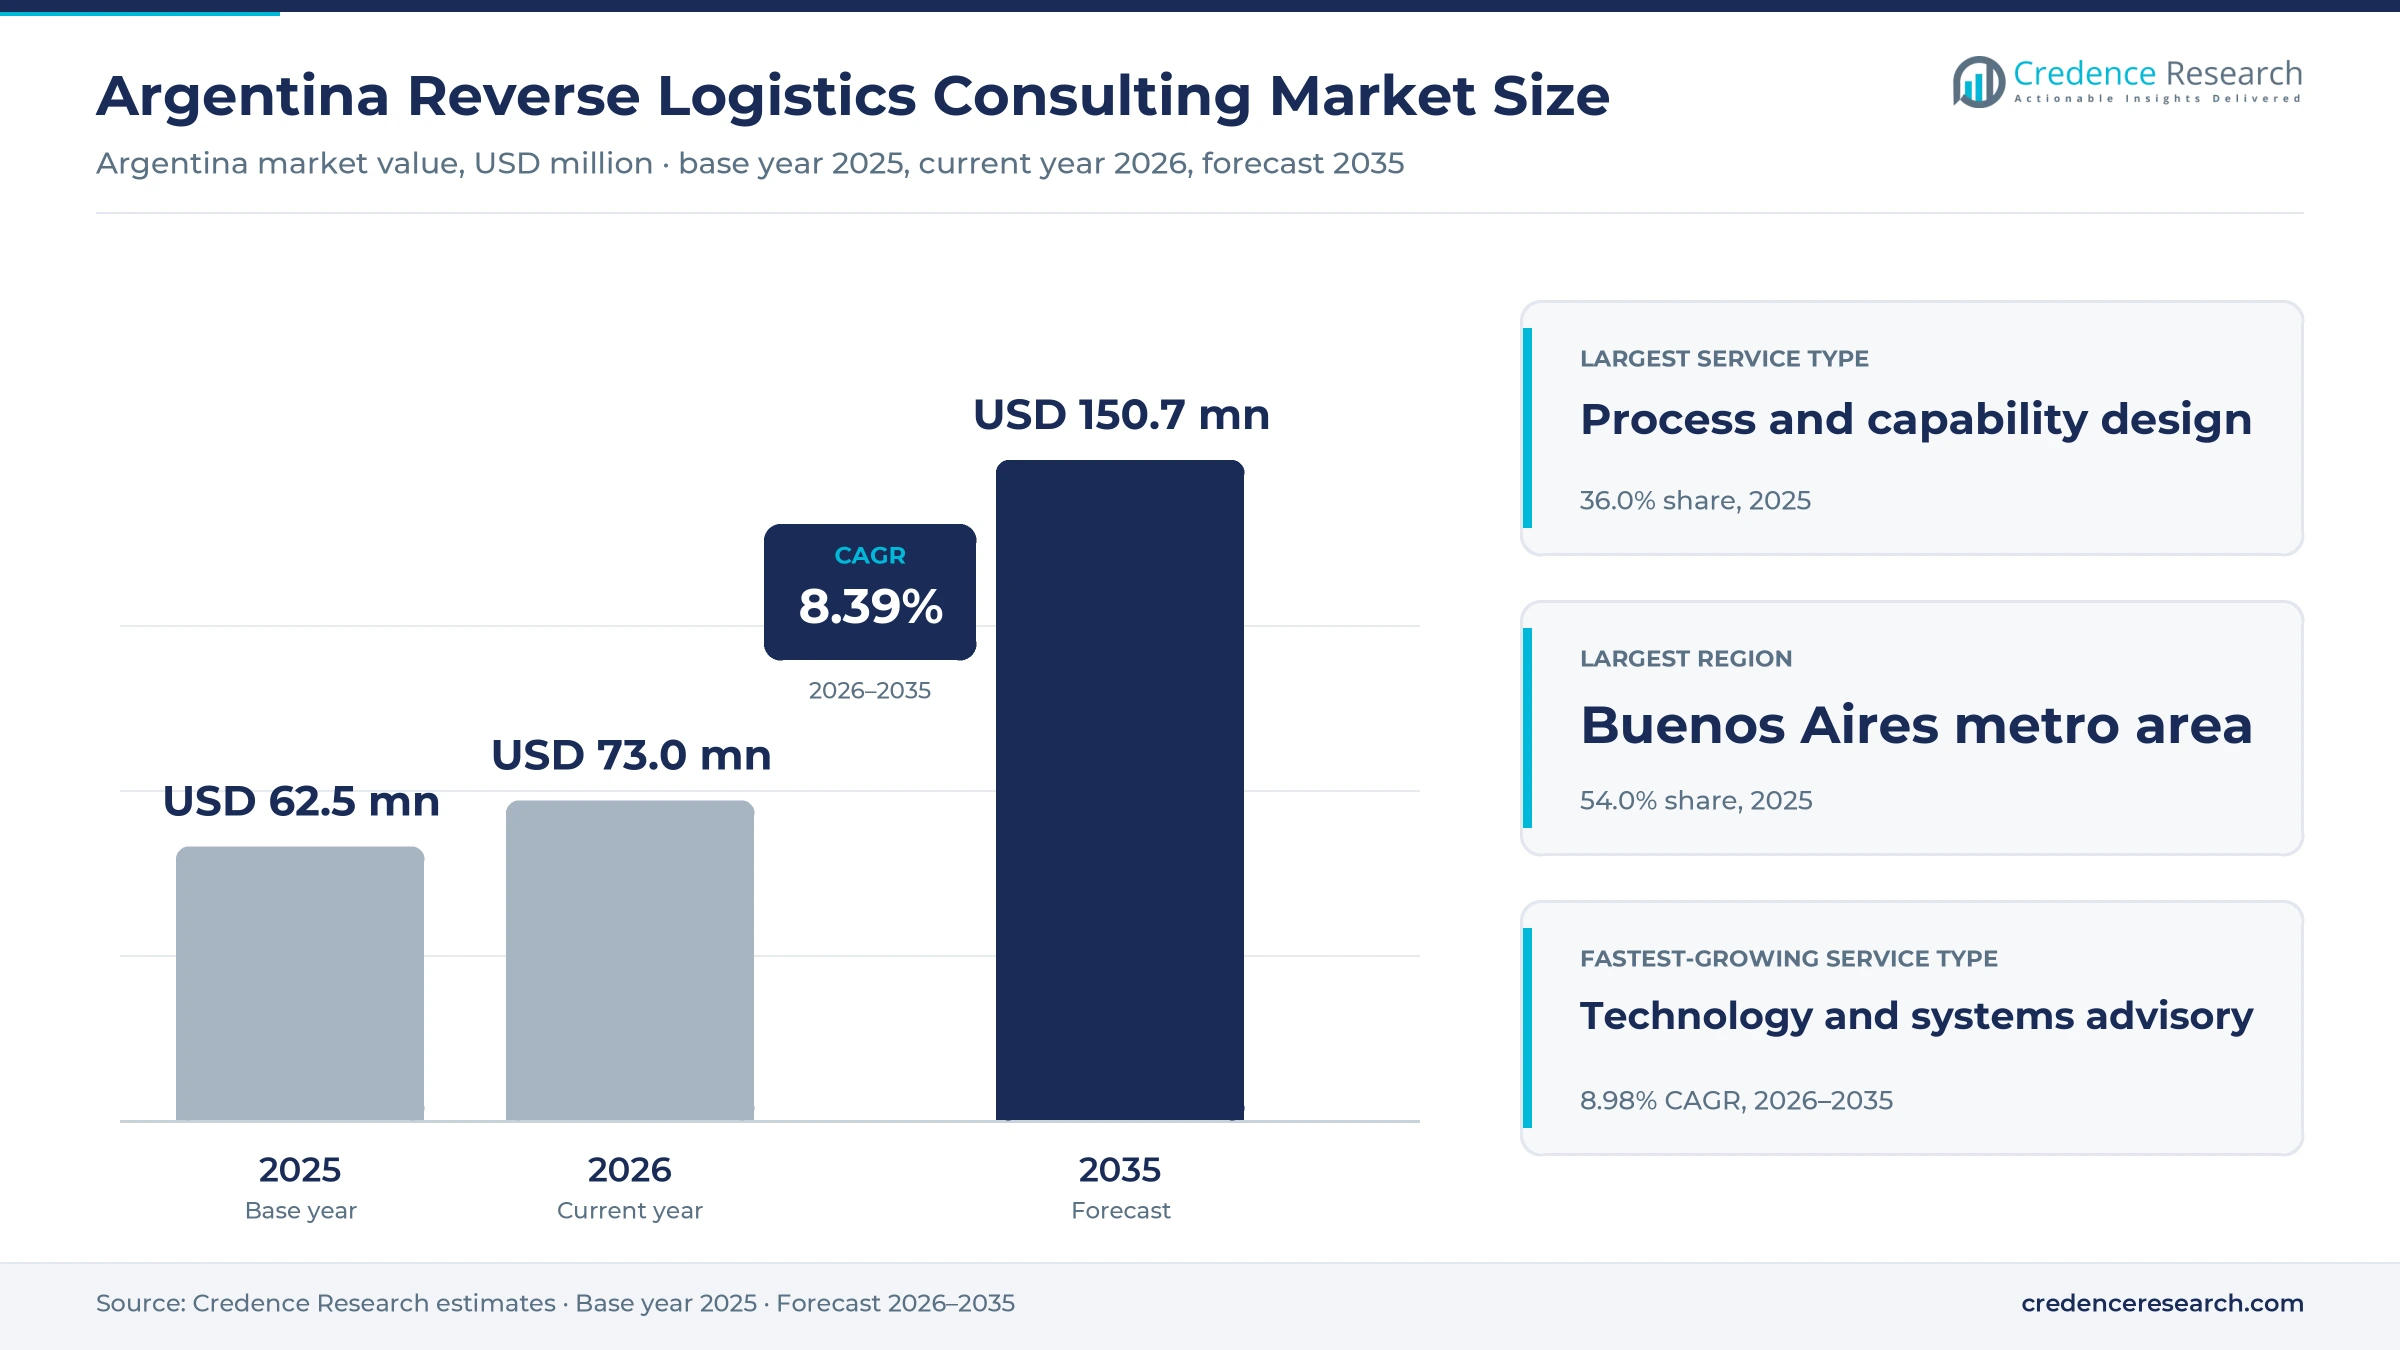
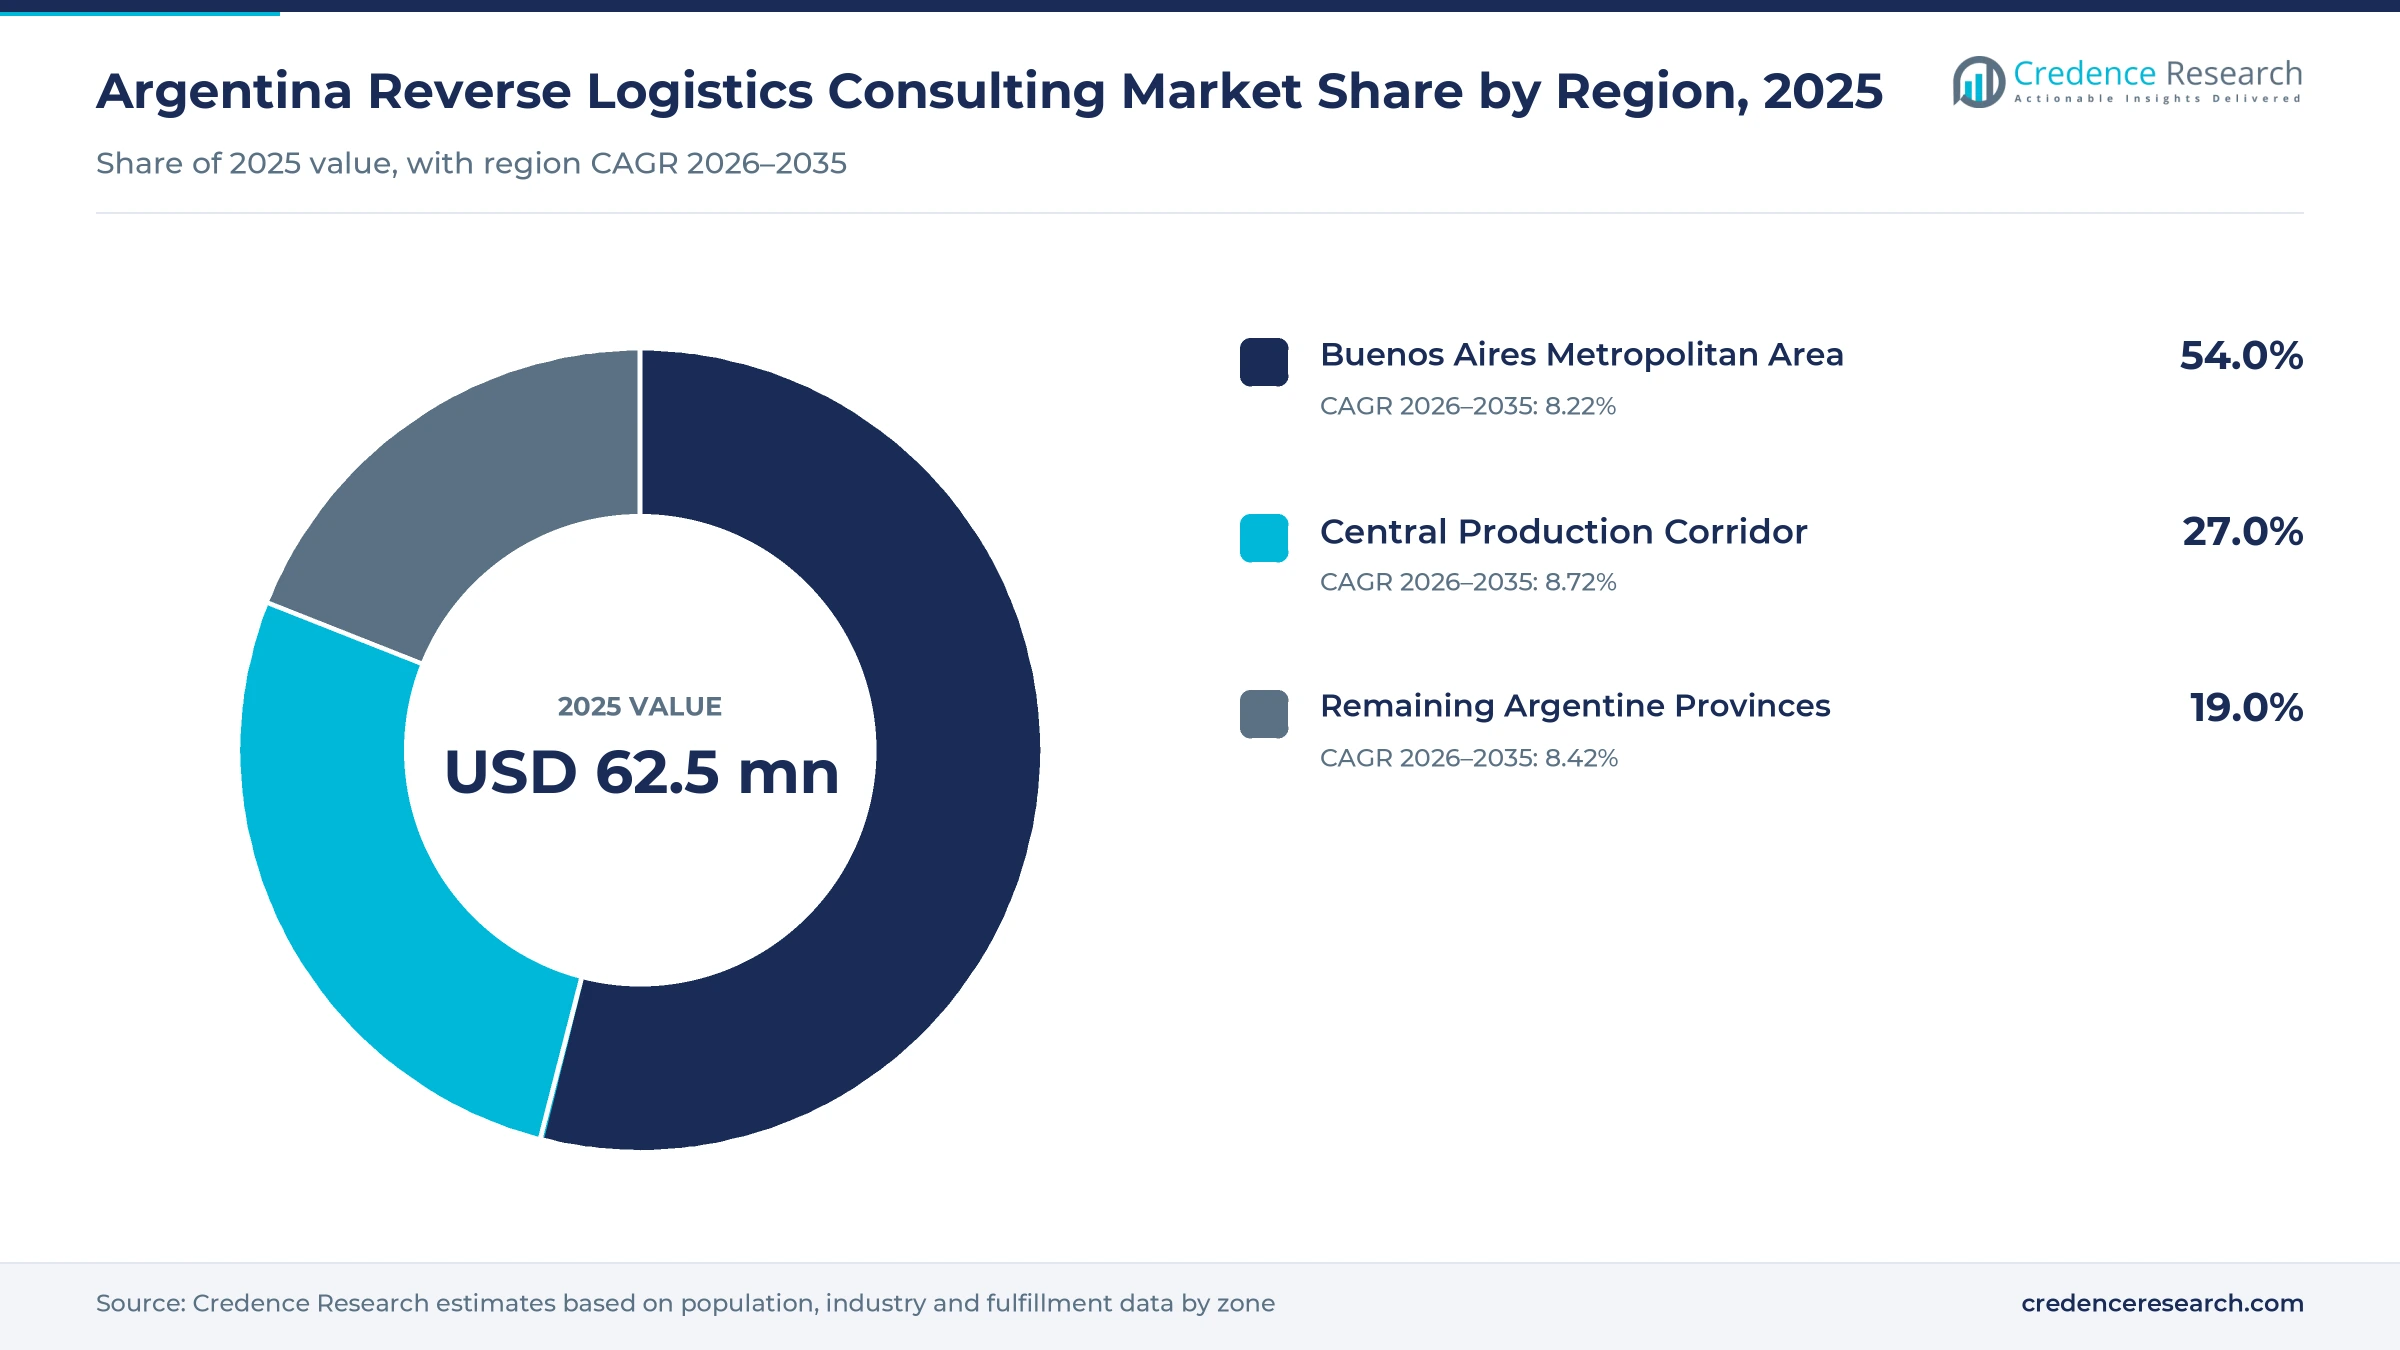
The Argentina reverse logistics consulting market was valued at USD 62.5 million in 2025 and is projected to increase from USD 73.0 million in 2026 to USD 150.7 million by 2035, registering a CAGR of 8.39% during 2026–2035. Spending comes from retailers, marketplaces, manufacturers, drug distributors and agricultural input suppliers that hire advisers to design return flows, select systems, redesign networks and meet take-back and consumer rules. The Buenos Aires Metropolitan Area held the largest regional share, 54.0% in 2025, because corporate head offices, marketplace fulfillment centers and most online buyers sit around the capital. The Central Production Corridor is the fastest-growing region at 8.72% a year, as Córdoba and Santa Fe add inland storage capacity and factory return flows. A national rule published on Sept. 4, 2025, rewrote the withdrawal button obligation for online sellers and added a service cancellation button, which raised compliance work for every company that sells at a distance.
Which returns advisory services are counted in this estimate?
The estimate measures what companies operating in Argentina pay external advisers to plan and improve the flow of goods back from customers, stores and distributors. It counts returns process and capability design, technology and systems advisory, strategy and network design, and circularity and compliance advice, sold as fixed projects, retainers or outcome-linked contracts.
The estimate excludes the physical transport, warehousing and refurbishing of returned goods, software licenses bought without advisory work, and the in-house cost of company returns teams. The value chain runs from global advisory networks and logistics operators with advisory units through technology partners to retailers, marketplaces, factories and distributors across the country.
Argentina Reverse Logistics Consulting Market Insights
- The Argentina reverse logistics consulting market was valued at USD 62.5 million in 2025 and is projected to reach USD 150.7 million by 2035, registering a CAGR of 8.39% during 2026–2035.
- The Buenos Aires Metropolitan Area held a 54.0% share of 2025 value, because head offices, marketplace hubs and most online buyers are concentrated there.
- Returns process and capability design led with a 36.0% share of 2025 value, as companies first need clear rules for receiving, grading and refunding returned goods.
- Online retail in Argentina moved 645 million units in 2025, up more than 28% on the year, which raised the volume of goods that sellers must take back.
- Technology and systems advisory grows fastest at 8.98% a year during 2026–2035, as returns portals, traceability data and warehouse systems are linked.
Process design leads while systems advisory grows fastest
Why does process design take the largest advisory budget?
Based on service type, the market is categorized into returns process and capability design, technology and systems advisory, strategy and network design, and circularity and compliance advisory. Returns Process and Capability Design led with a 36.0% share of 2025 value, because most companies start by setting grading, refund and restocking rules. Technology and Systems Advisory grows fastest at 8.98% a year, as buyers connect return portals with order and warehouse systems.
Which industries buy the most returns advice?
Based on end-use industry, the market is categorized into retail and electronic commerce, manufacturing and automotive, pharmaceutical and healthcare, and electronics and agrifood. Retail and Electronic Commerce led with a 41.0% share of 2025 value, because online sellers face the highest return counts and the withdrawal button rule. Retail and Electronic Commerce also grows fastest at 8.69% a year, as marketplace volume keeps rising.
How does company size shape advisory spending?
Based on customer type, the market is categorized into large enterprise buyers, medium enterprise buyers and small enterprise buyers. Large Enterprise Buyers led with a 58.0% share of 2025 value, because national retailers, automakers and drug distributors run multi-site return networks. Small Enterprise Buyers grow fastest at 9.07% a year, as smaller online sellers buy short advisory packages to meet consumer rules.
Why do fixed-fee projects still dominate contracts?
Based on revenue model, the market is categorized into fixed-fee projects, recurring advisory retainers and outcome-linked contracts. Fixed-Fee Projects led with a 55.0% share of 2025 value, because buyers facing high inflation prefer a set scope and price. Outcome-Linked Contracts grow fastest at 9.25% a year, as advisers tie part of their fees to lower return costs and faster refunds.
| Segment Group | Leading Sub-segment | Share, 2025 | Fastest-growing Sub-segment | CAGR, 2026–2035 |
|---|---|---|---|---|
| By Service Type | Returns Process and Capability Design | 36.0% | Technology and Systems Advisory | 8.98% |
| By End-Use Industry | Retail and Electronic Commerce | 41.0% | Retail and Electronic Commerce | 8.69% |
| By Customer Type | Large Enterprise Buyers | 58.0% | Small Enterprise Buyers | 9.07% |
| By Revenue Model | Fixed-Fee Projects | 55.0% | Outcome-Linked Contracts | 9.25% |
Request a Free Sample
Fill in your details and we'll send you a free sample report.
- Sample data tables & charts
- Research methodology
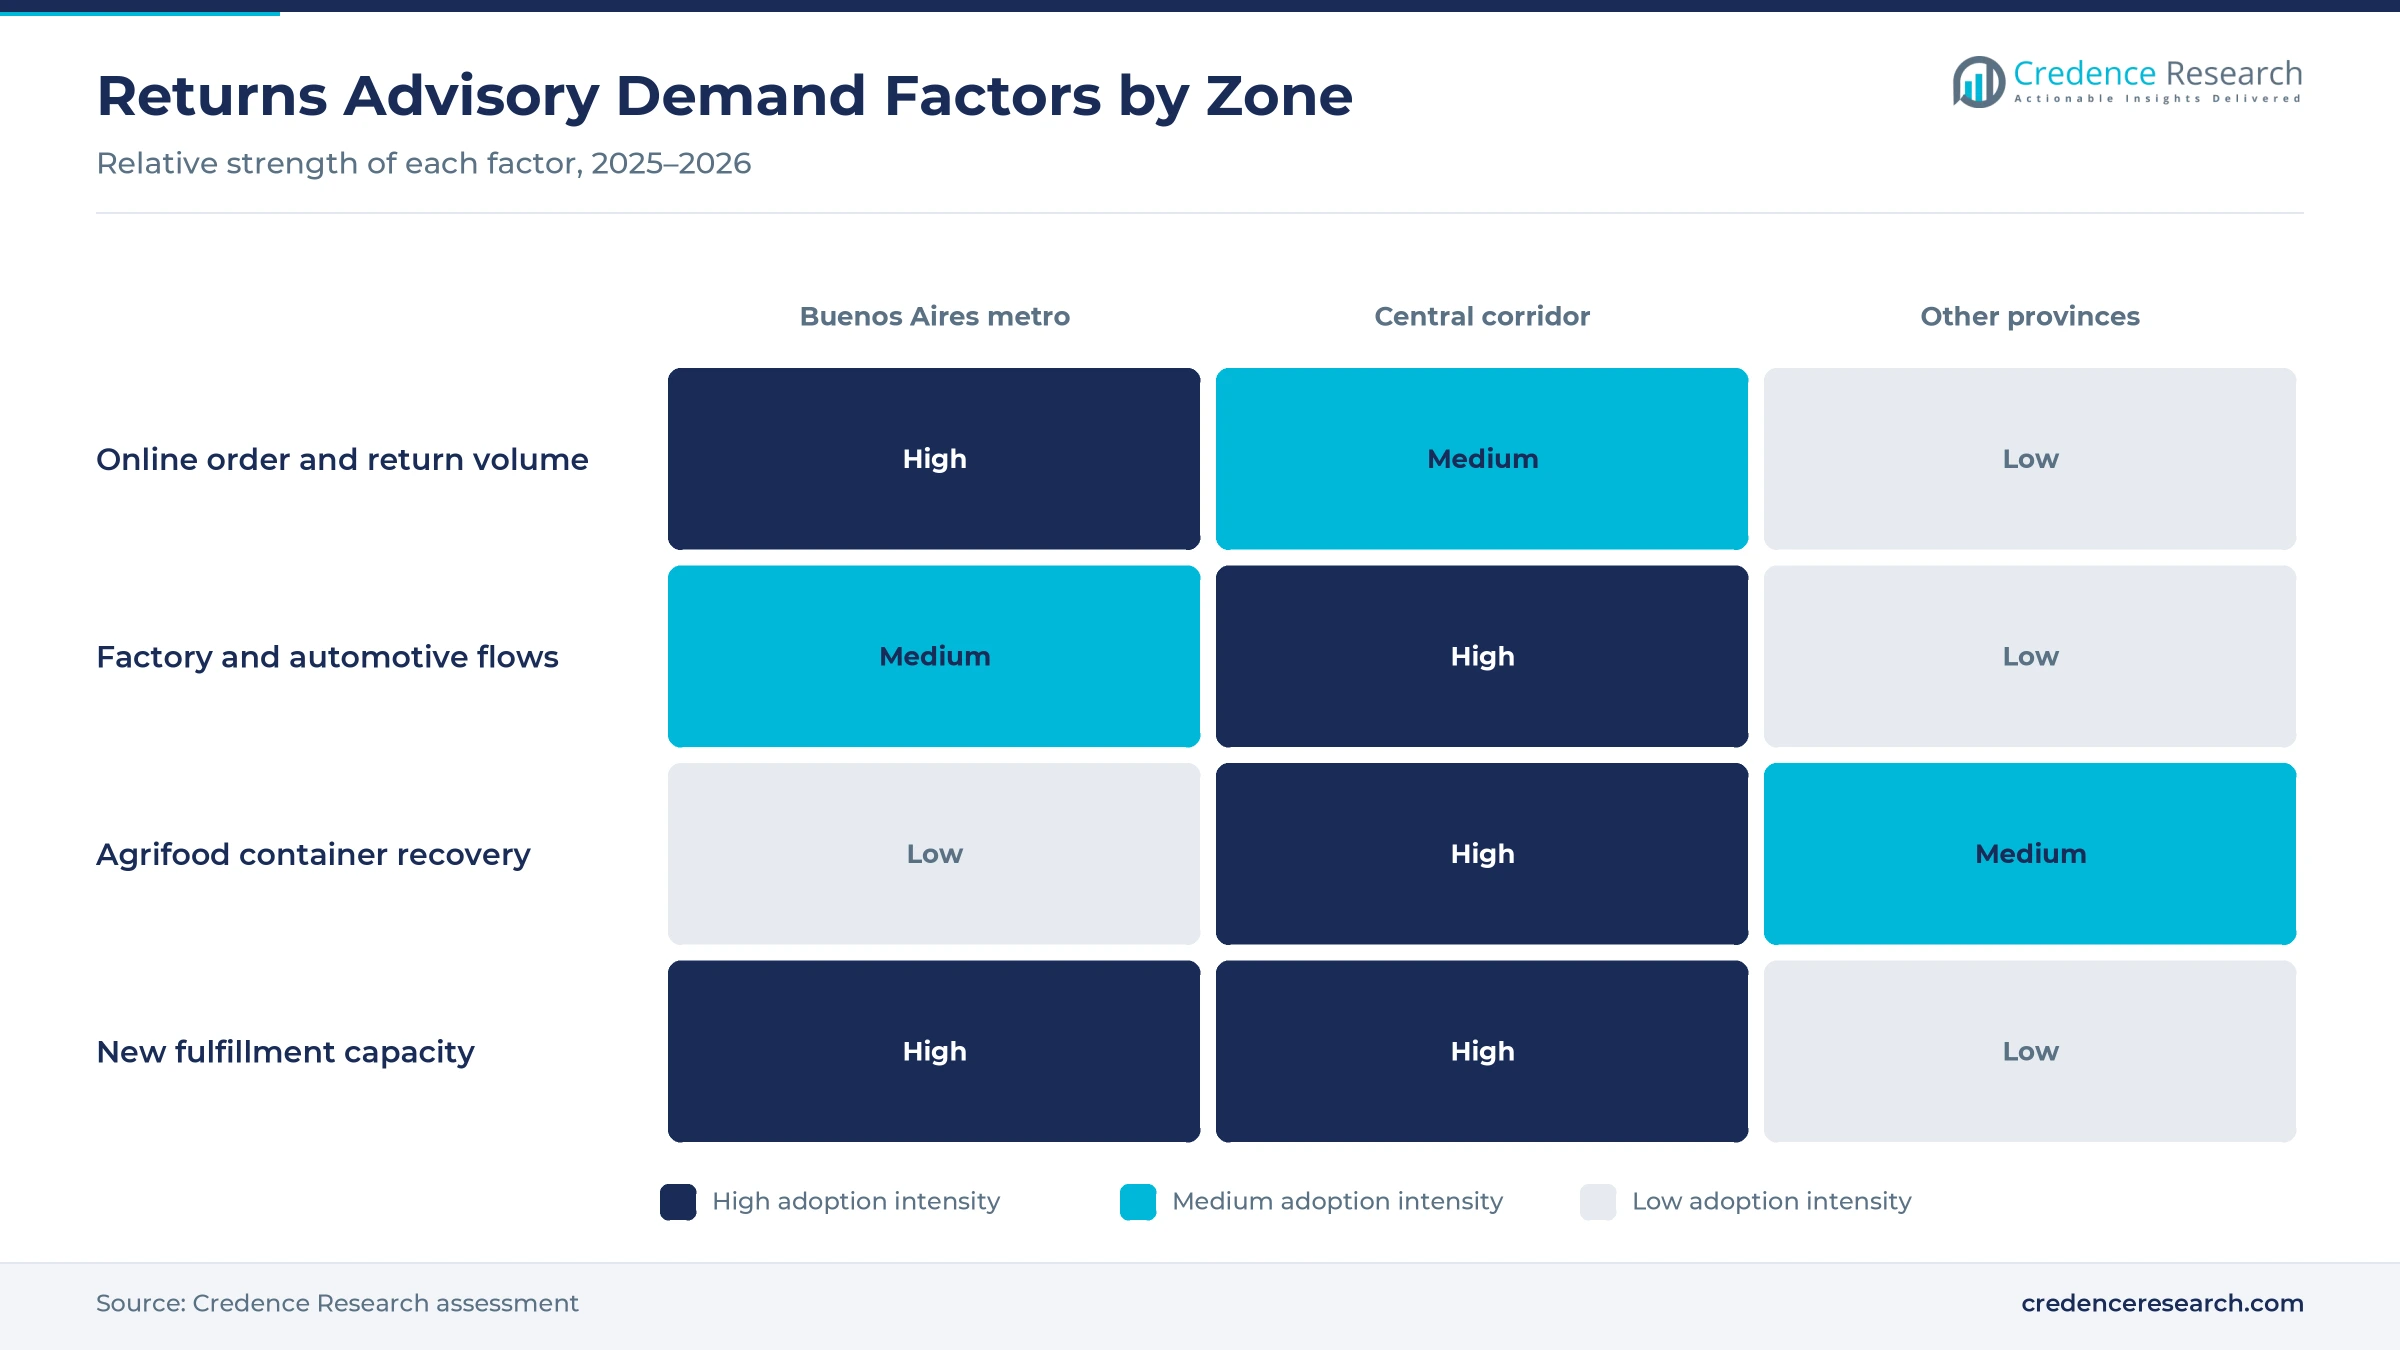
Online volume, withdrawal rules and systems drive demand
How does online sales growth push firms to formalize returns?
Larger online volumes turn informal return handling into a measurable cost, so retailers and brands hire advisers to set grading, refund and restocking rules. The Argentine Chamber of Electronic Commerce measured online sales of ARS 35.3 trillion in 2025, a nominal rise of 60% against annual inflation of 31%, according to Revista Mercado. Units sold climbed more than 28% to 645 million, while orders rose only 3%, which means more items in each order that may come back. Mercado Libre lets eligible buyers start express returns within 30 days of receipt, and sellers get three business days to inspect the item, according to Ámbito. As a result, retail and electronic commerce holds 41.0% of 2025 value.
Why do consumer withdrawal rules raise compliance work?
Consumer law gives online buyers a right to cancel, which forces sellers to build a clear and costless path for goods to come back. Under Article 34 of Law 24,240, buyers have 10 calendar days from delivery or contract to withdraw, according to the consumer office of the Mendoza government. Resolution 424/2020 made a withdrawal button mandatory on sales websites from Oct. 5, 2020. Disposition 954/2025, published on Sept. 4, 2025, replaced that resolution and added a service cancellation button, with a code due within 24 hours, according to law firm Allende & Brea. In turn, sellers hire advisers to map refunds, pickups and evidence, which supports 36.0% of spending for process design.
How do systems integration needs lift decision support work?
Return decisions now depend on data from order platforms, carriers and warehouses, so companies pay advisers to connect these systems and set rules for each returned item. About 89.7% of Argentines used the internet in 2024, according to the World Bank, which keeps online orders and return requests high. Mercado Libre opened a Don Torcuato center in June 2026 that handles up to 1.5 million packages a month, with peaks of 60,000 shipments a day, according to Noticias NQN. Drug distributors must also record a unique identifier for each unit under national traceability rules. As a result, technology and systems advisory grows fastest at 8.98% a year.
Why does the courier import regime add cross-border returns?
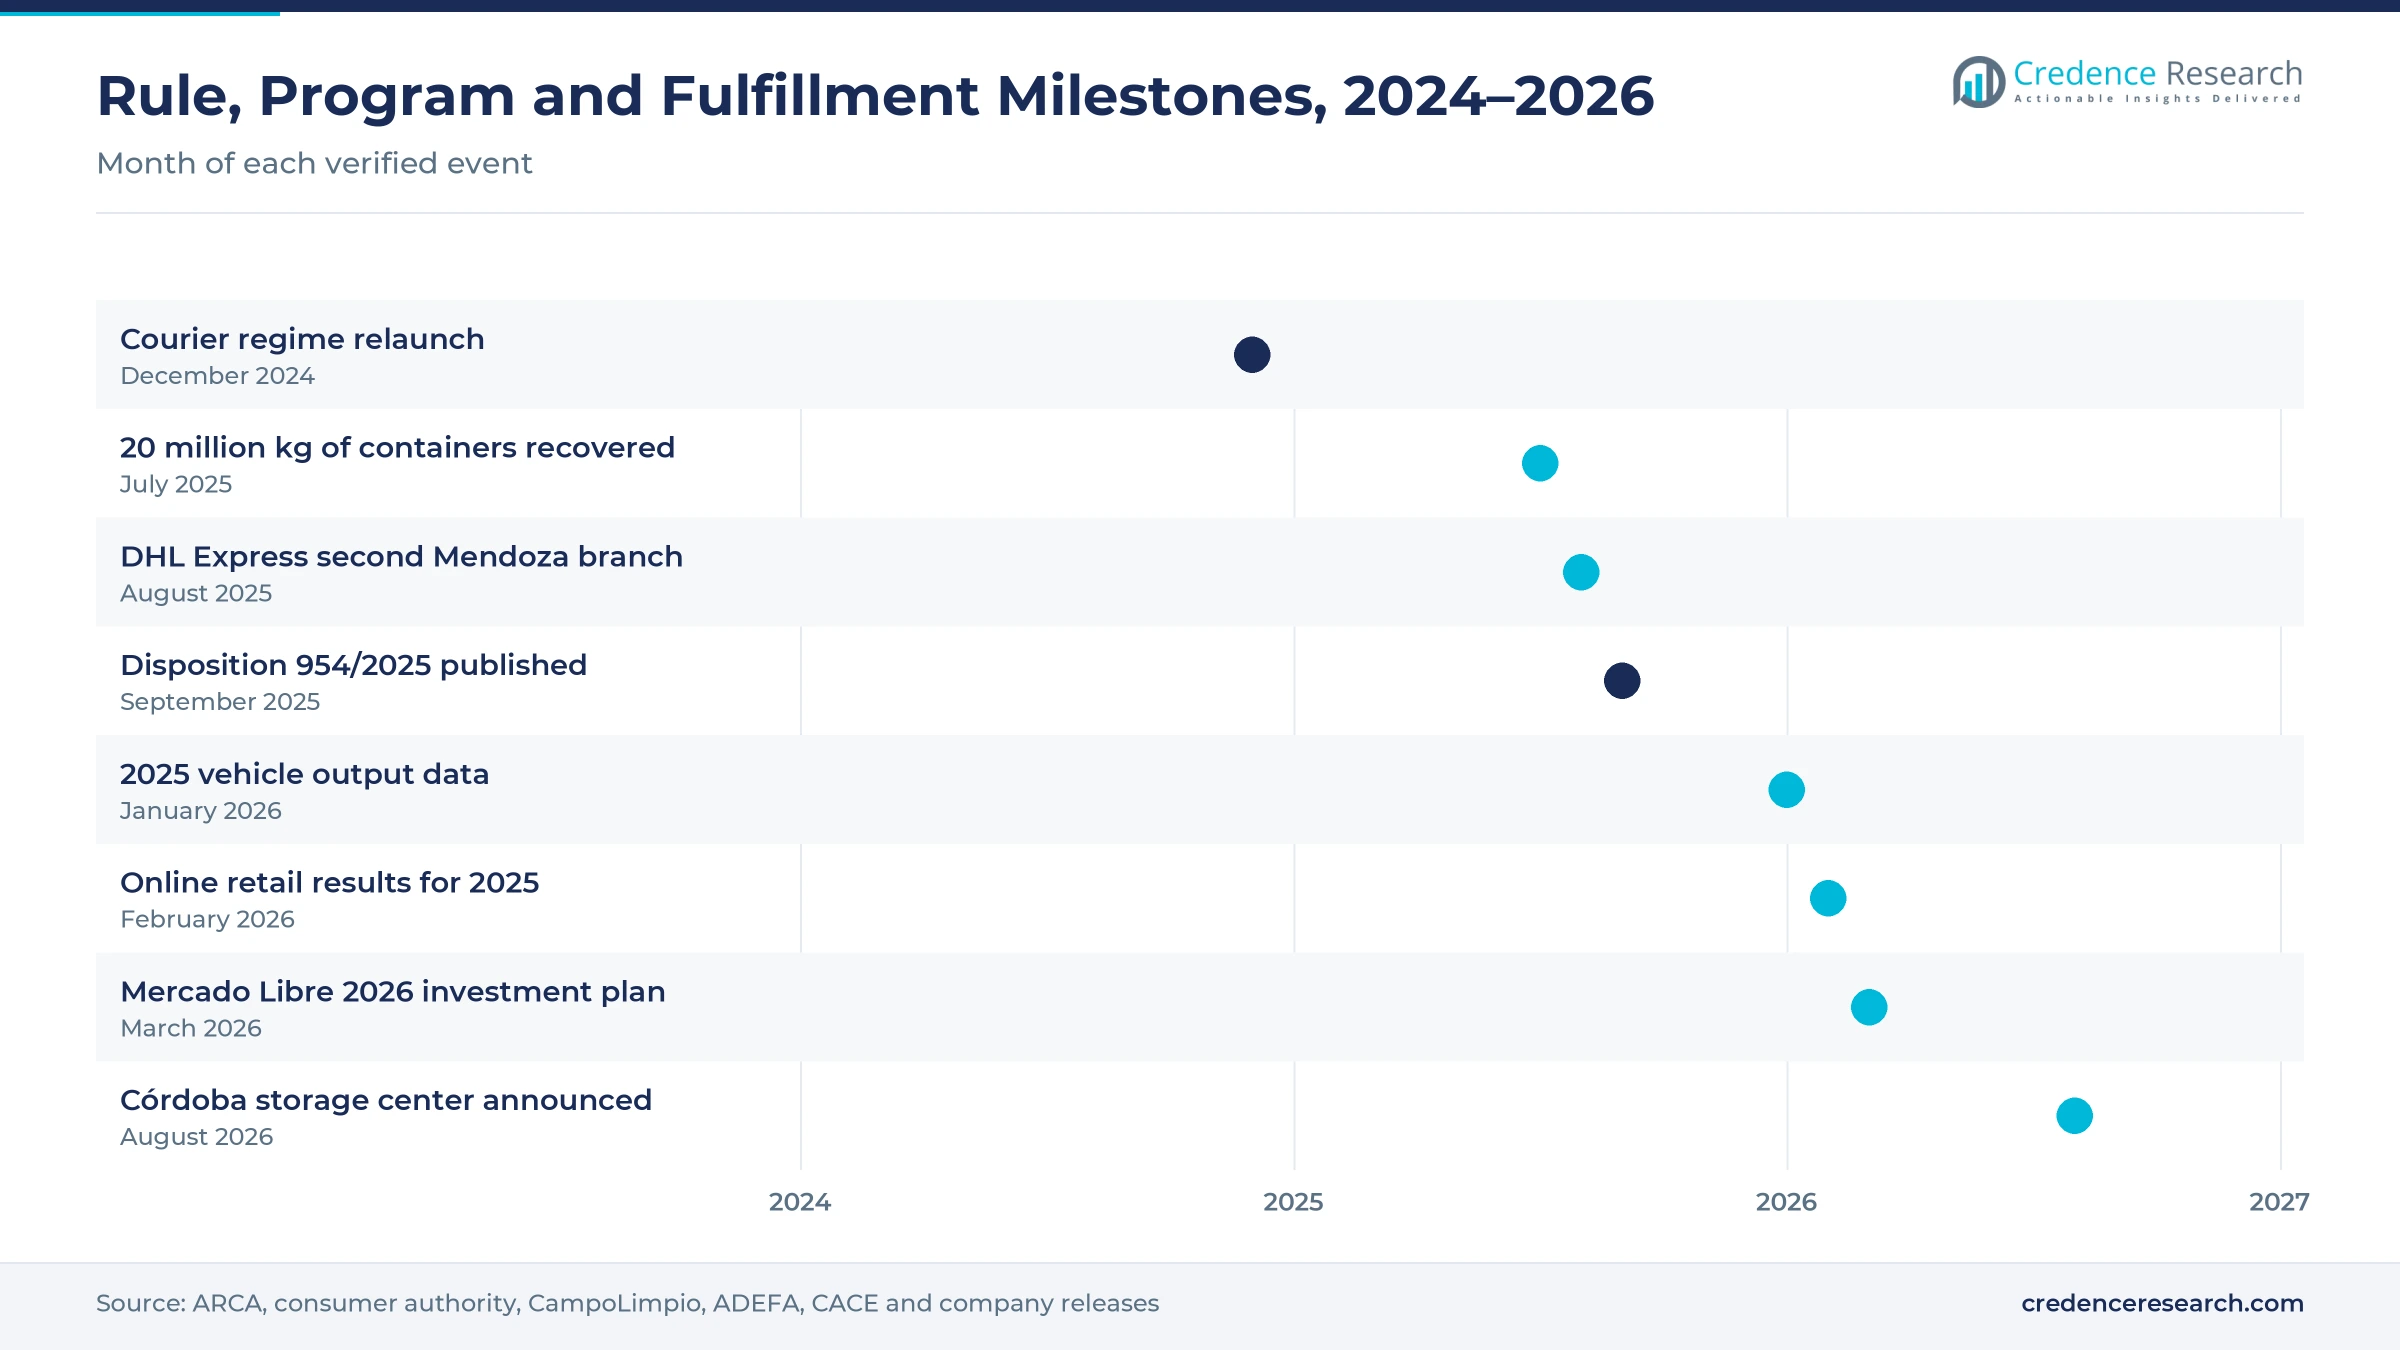
Looser rules for small imports bring more foreign goods into Argentine homes, which creates costly returns that sellers and couriers must plan in advance. General Resolution 5608/2024 from the tax and customs authority ARCA raised the courier limit to USD 3,000 FOB per shipment from USD 1,000, according to law firm Marval O'Farrell Mairal in December 2024. Decree 1065/2024 also exempted the first five personal shipments a year up to USD 400 FOB from import duties. Courier imports reached about USD 894 million in 2025, and USD 518 million in January to May 2026, up 113.2%, according to INDEC data reported by El Litoral. In turn, network design work for cross-border flows gains weight.
Circularity duties and inland fulfillment reshape returns
How is the shift toward circularity duties changing returns?
Producer responsibility rules are moving returned and discarded goods from disposal to recovery, which opens advisory work on collection points, grading and recycling partners. Argentina generated 517,000 metric tons of electronic waste in 2022, or 11.4 kilograms per person, according to a presentation published by the International Telecommunication Union. The same document says only 5% to 10% is recycled, and that of the devices left on public land about 60% end up in open dumps. Buenos Aires province regulates electronic waste through Law 14,321, and national household waste rules adding producer responsibility were regulated in November 2022. As a result, circularity and compliance advisory grows faster than the market average.
Why does the rise of inland fulfillment hubs matter?
Marketplaces are moving storage closer to inland buyers, which shortens return trips and creates new network design questions for sellers outside the capital. Mercado Libre chose Estación Juárez Celman in Córdoba for a 60,000 square meter storage center that will hold up to 6 million products, according to El Economista on Aug. 10, 2026. The USD 91 million site is its first storage center in the interior and its fifth in the country, due to open at the end of 2027. It will supply last-mile depots in the center, northwest and northeast. In turn, the Central Production Corridor gains share against the capital zone through 2035.
Can agrochemical container recovery open new advisory work?
Agricultural input makers already run a national take-back system, which gives advisers a model to extend to other farm and industrial packaging. Law 27,279 assigns shared and extended responsibility for empty phytosanitary containers to every link in the supply chain. The CampoLimpio association, which groups more than 110 manufacturers, passed 20 million kilograms of recovered containers in July 2025, according to Agrofy News. Its collection network grew from seven centers in 2019 to 92 centers in 22 provinces, and collection has grown about 30% a year over three years. As a result, electronics and agrifood buyers fund route, center and traceability design.
Is there room for advice on medicine traceability and returns?
Drug traceability rules give distributors detailed data on every unit, which creates an opening to design faster returns, withdrawals and expiry handling. Resolution 435/2011 of the Ministry of Health requires laboratories, distributors, logistics operators, pharmacies and health facilities to track listed medicines from production or import to the patient. Each unit must carry a unique identifier, and the National Administration of Drugs, Food and Medical Technology enforces the system. The resolution also cites an earlier rule expecting distributors to support market withdrawals and returns through traceability. Because large distributors run these systems, Large Enterprise Buyers hold 58.0% of 2025 value.
Inflation, weak factory output and fragmented rules
How does high inflation complicate advisory budgets?
Rapid price changes make multi-month advisory budgets hard to approve, which pushes buyers toward short scopes and fixed prices. Annual inflation was 31% in 2025, according to the Argentine Chamber of Electronic Commerce, while the average online ticket rose 55% to ARS 143,128. As a result, fixed-fee projects hold 55.0% of 2025 value, and advisers must review rates often to protect margins. Retainers spread costs over time, but buyers sign them only when prices look stable for several quarters.
Why does weak factory output slow industrial demand?
Lower vehicle output reduces the parts, packaging and warranty flows that automakers ask advisers to redesign. Argentina produced 490,876 vehicles in 2025, down 3.1% from 2024, according to automaker association ADEFA as reported by El Economista. Vehicle exports also fell 10.8% to 280,589 units over the same year. In turn, manufacturing and automotive buyers postpone network studies, and their share of spending slips through 2035. Exporting plants that keep running may still fund smaller studies on packaging and warranty return loops.
How do fragmented waste rules raise project costs?
Argentina lacks one unified framework for electronic waste, so each province can set different duties for collection and treatment. Buenos Aires province has its own law and registry for electronic waste managers, while national rules address hazardous and universal special waste separately. As a result, national sellers need province-by-province advice, which lengthens projects and raises costs for medium enterprise buyers. A single national framework would simplify this work, but the legal framework remains split across jurisdictions.
Why do limited budgets hold back smaller merchants?
Many online merchants still handle returned parcels by hand and cannot pay for formal process studies. The Argentine Chamber of Electronic Commerce said provincial gross receipts taxes prevent many merchants from shipping to other locations, according to iProUP. This limits the scale that small sellers need to justify paid advice. In turn, advisers sell short packages and templates to these buyers rather than full redesign projects, often through marketplace or carrier partner programs.
Buenos Aires leads while the central corridor grows fastest
| Region | Value, 2025 (USD million) | Share, 2025 | CAGR, 2026–2035 |
|---|---|---|---|
| Buenos Aires Metropolitan Area | 33.8 | 54.0% | 8.22% |
| Central Production Corridor | 16.9 | 27.0% | 8.72% |
| Remaining Argentine Provinces | 11.9 | 19.0% | 8.42% |
Head offices and fast delivery keep the capital zone ahead
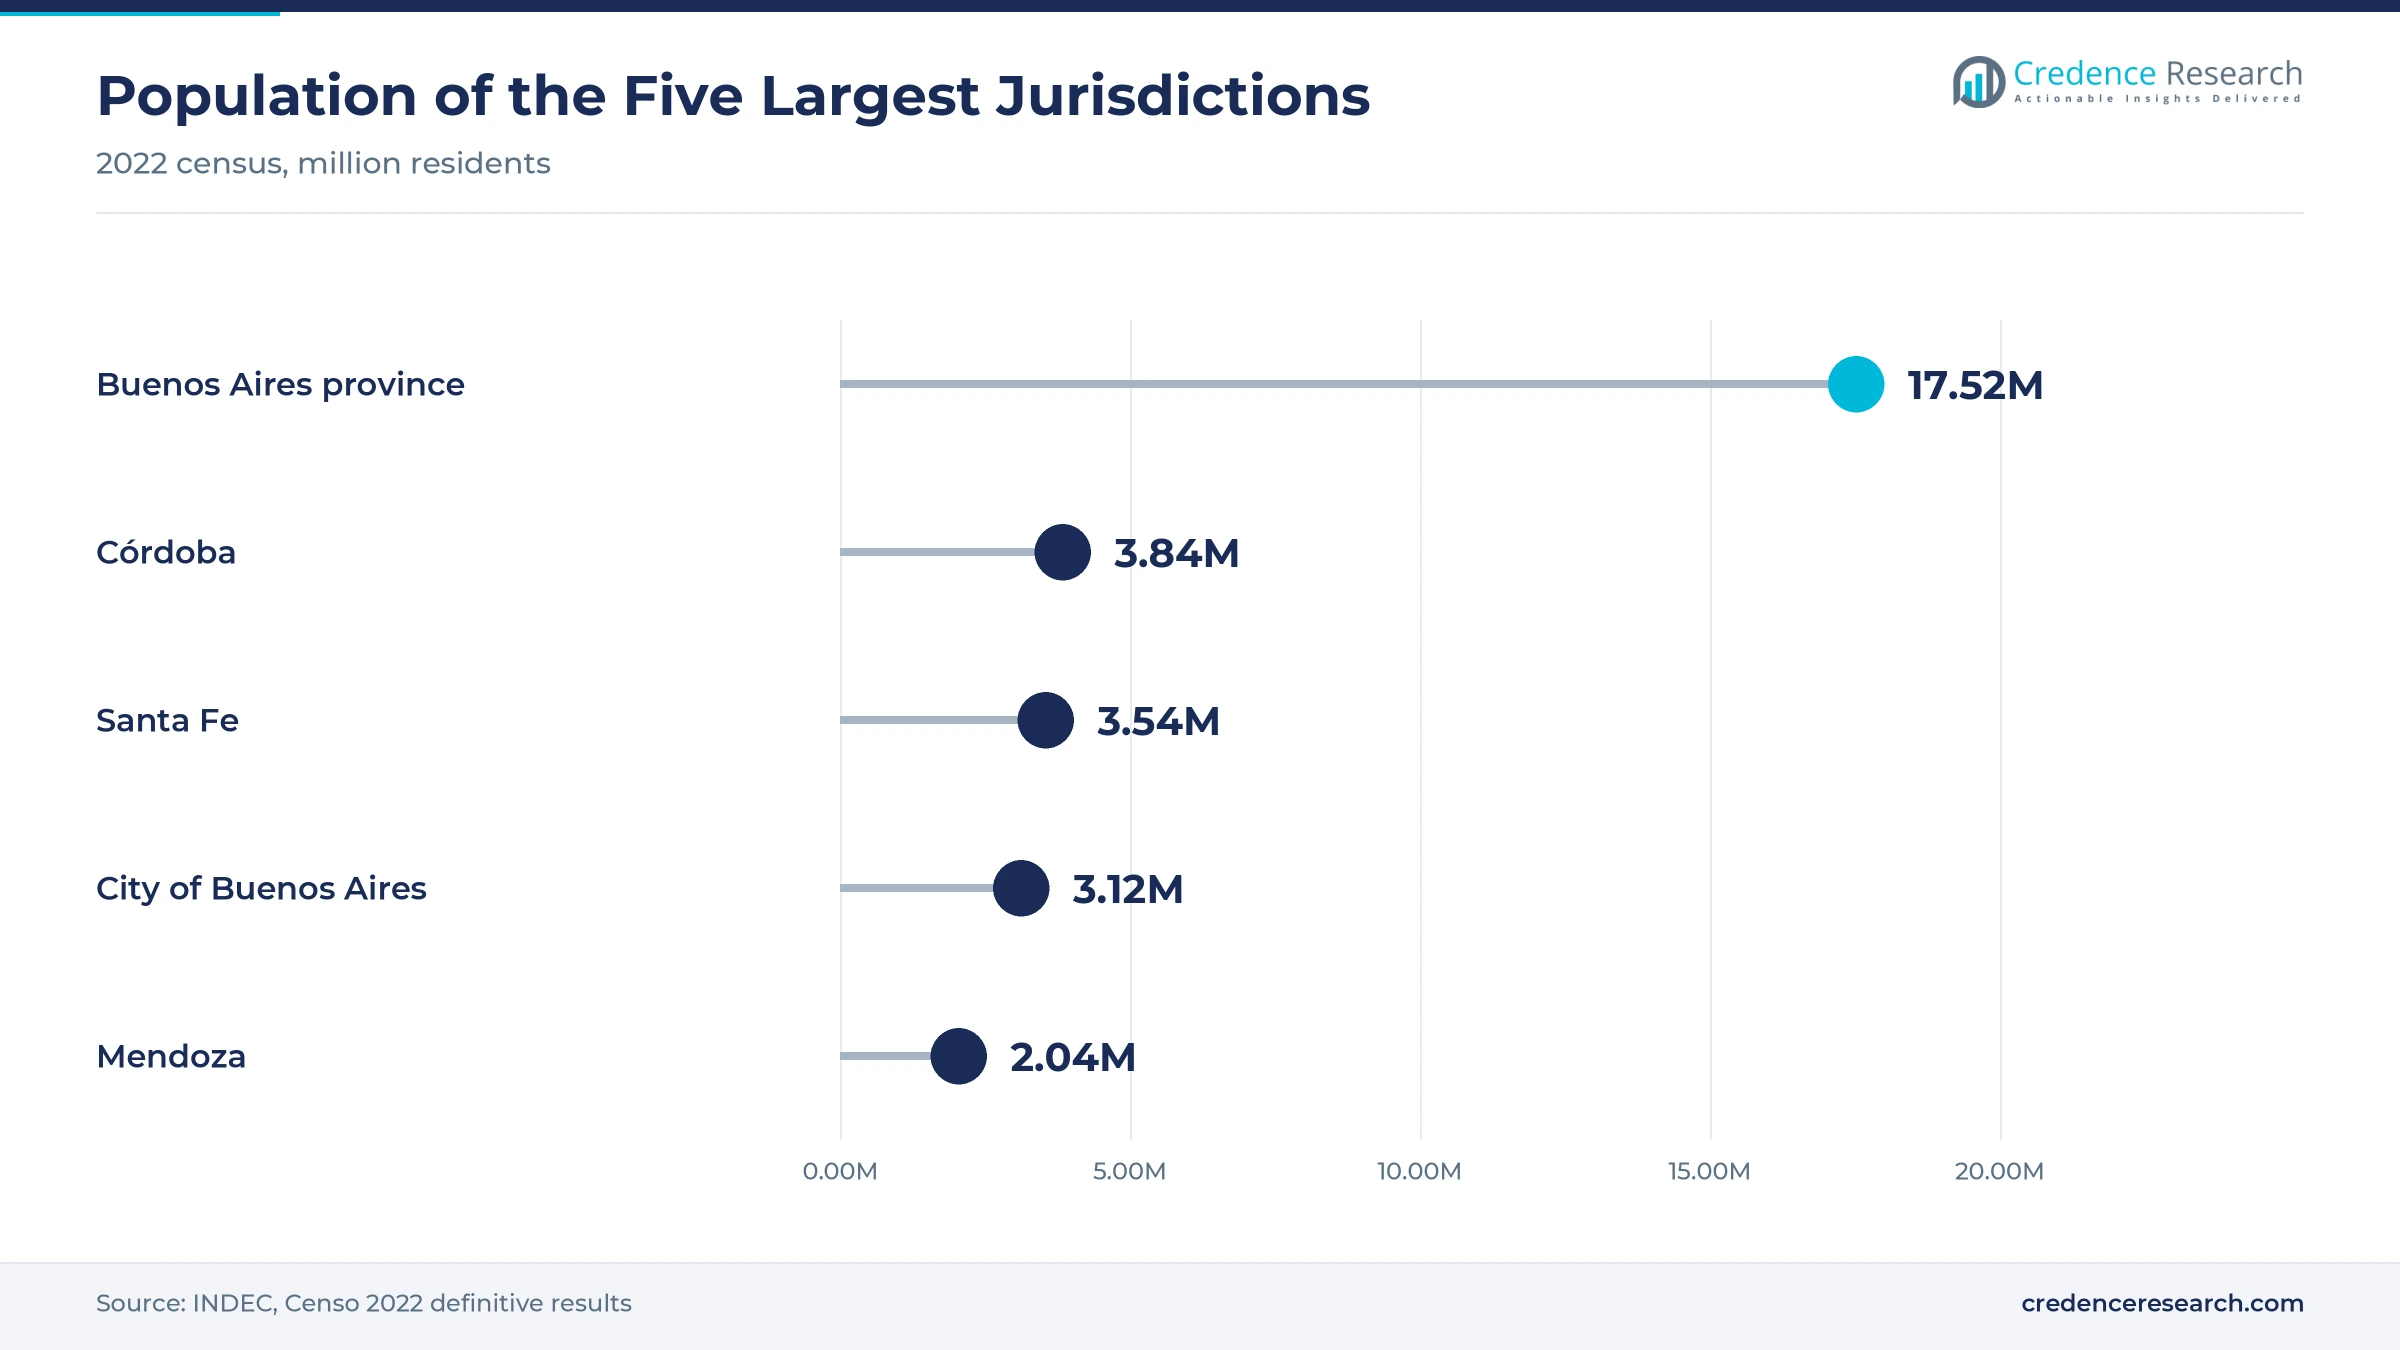
The Buenos Aires Metropolitan Area held a 54.0% share of 2025 value and grows at 8.22% a year. The City of Buenos Aires counted 3.12 million residents in the 2022 census, and Buenos Aires province, which surrounds it, counted 17.52 million. Mercado Libre added an 11,000 square meter center in Don Torcuato in June 2026, and some apps already deliver in about two hours in the metro area. As a result, the zone keeps the largest share while growing slightly below the national rate.
Córdoba and Santa Fe add inland storage and plant flows
The Central Production Corridor held a 27.0% share of 2025 value and grows fastest at 8.72% a year. Córdoba counted 3.84 million residents in the 2022 census and Santa Fe counted 3.54 million, more than twice the population of the City of Buenos Aires. Deloitte Argentina keeps offices in Rosario and Córdoba besides Buenos Aires. Mercado Libre's planned storage center near Córdoba city will serve depots across the interior, which shifts return flows inland through 2035.
How do the remaining provinces add advisory demand?
The Remaining Argentine Provinces held a 19.0% share of 2025 value and grow at 8.42% a year. Mendoza counted 2.04 million residents in the 2022 census, the fourth-largest provincial population. DHL Express opened its second Mendoza branch in August 2025, offering international e-commerce solutions to local exporters, according to Revista Mercado. In turn, exporters and agrifood shippers in these provinces buy targeted advice on export returns and container recovery.
Rule changes and fulfillment investments, 2024–2026
| Development | Status and market relevance |
|---|---|
| In December 2024, ARCA relaunched the courier regime under General Resolution 5608/2024, raising the value limit per shipment to USD 3,000. | Expands cross-border shipments and their returns |
| In July 2025, the CampoLimpio association passed 20 million kilograms of recovered agrochemical containers in Argentina. | Shows the scale of producer take-back programs |
| In September 2025, Disposition 954/2025 replaced Resolution 424/2020 and added a service cancellation button for online sellers. | Raises withdrawal compliance work for sellers |
| In March 2026, Mercado Libre said it would invest USD 3.4 billion in Argentina during 2026, partly in new storage centers. | Expands fulfillment capacity and return volume |
| In August 2026, Mercado Libre chose Córdoba province for a USD 91 million storage center due to open at the end of 2027. | Moves fulfillment and return flows inland |
Return portals, traceability data and network models
- Return portals and refund engines record withdrawal requests, issue codes and trigger pickups, which advisers connect to order systems and warehouse management systems so that each item is graded and restocked faster.
- Unit-level traceability data follows serial or lot codes from the factory to the buyer, which lets drug distributors and device sellers plan withdrawals and route items toward refurbished electronics channels or recyclers.
- Network and cost models compare collection points, hubs and carrier options across provinces, which helps companies decide where returned goods should be inspected, repaired or sent to electronic waste management partners.
Need a Custom Version of This Report?
Tailor the scope, geography, or segments to your exact requirements.
- Custom geography or segment scope
- Direct access to our analyst team
Global advisory networks compete with logistics operators
Competition centers on global advisory networks with local practices and on logistics operators that sell design work alongside freight and storage. Deloitte Argentina reports more than 1,100 professionals and 95 partners, with offices in Buenos Aires, Rosario and Córdoba. EY Argentina lists supply chain and operations among its local consulting services, and KPMG Argentina offers a consulting line within its advisory practice. Accenture runs an Argentine supply chain practice that recruits locally for planning, logistics and after-sales work. Kuehne+Nagel sold its domestic contract logistics business, with three storage centers and 230 staff, to Tasa Logística in October 2020 to focus on foreign trade, according to El Cronista. Automakers and parts suppliers also link their returns studies with parts remanufacturing programs and warranty recovery. Advisers compete on industry depth, systems skills and proof of lower return costs.
Which advisers are active in Argentine returns work?
| Company | Type | Role in the market |
|---|---|---|
| Deloitte Argentina | Advisory network | More than 1,100 professionals with offices in Buenos Aires, Rosario and Córdoba |
| EY Argentina | Advisory network | Lists supply chain and operations among its Argentine consulting services |
| KPMG Argentina | Advisory network | Runs a consulting line within its Argentine advisory practice |
| Accenture Argentina | Technology consultancy | Recruits locally for its supply chain practice in Argentina |
| Kuehne+Nagel Argentina | Logistics operator | Freight forwarding and foreign trade operator after selling its domestic contract logistics in 2020 |
Credence Research view on returns advisory in Argentina
Credence Research's view is that Argentine returns advisory will grow faster than physical logistics spending, because withdrawal rules, marketplace scale and producer responsibility duties all reward companies that manage returns as a process rather than an exception. Online sellers need clear refund and pickup rules, drug distributors can use traceability data for faster withdrawals, and input makers already run national container recovery. Advisers that combine systems skills, province-level rule knowledge and outcome-linked fees should gain the most from the Argentina reverse logistics consulting opportunity through 2035.
How the Argentine returns advisory estimate was built
The report uses 2025 as the base year on a calendar basis, and market values come from the Credence Research model. That model combines official population and internet use statistics, online retail and vehicle output data from trade bodies, consumer and health regulations, electronic waste data published by the International Telecommunication Union and company announcements. Segment splits and zone shares and growth rates are Credence Research estimates built from population, industrial output and fulfillment capacity by zone. Sources used are official statistics, regulations, trade body releases, legal publications and company releases, and Credence Research conducted no interviews or surveys of its own for this report.
Systems work and inland hubs lead growth to 2035
Spending is expected to reach USD 150.7 million by 2035, an 8.39% CAGR during 2026–2035, as companies treat returns as a regulated, data-driven process. Growth should come from technology and systems advisory, outcome-linked contracts, small enterprise buyers and the Central Production Corridor. Steadier prices would help buyers sign longer retainers, while renewed inflation or weaker factory output would delay industrial projects. Firms that link returns design with planning software and provincial waste rules are expected to gain share as Argentine return volumes grow.
Frequently Asked Questions
How big is the Argentina reverse logistics consulting market?
Which service type leads Argentine returns advisory?
Which region leads the Argentine market?
How do withdrawal rules affect online sellers in Argentina?
How fast is Argentine online retail volume growing?
Why does electronic waste matter for returns advisory?
Which companies are active in the Argentine market?
What are the main challenges for returns advisers?
Table of Content
Chapter 1 Market Segmentation
- 1.1 Segmentation Framework
- 1.1.1 Product and Service Classification
- 1.1.2 Application and End-Use Classification
- 1.1.3 Technology and Solution Classification
- 1.1.4 Customer and Distribution Channel Classification
- 1.1.5 Geographic Segmentation
- 1.1.6 Market Segment Definitions and Boundaries
- 1.2 By Service Type
- 1.2.1 Returns Process and Capability Design
- 1.2.2 Technology and Systems Advisory
- 1.2.3 Strategy and Network Design
- 1.2.4 Circularity and Compliance Advisory
- 1.3 By End-Use Industry
- 1.3.1 Retail and Electronic Commerce
- 1.3.2 Manufacturing and Automotive
- 1.3.3 Pharmaceutical and Healthcare
- 1.3.4 Electronics and Agrifood
- 1.4 By Customer Type
- 1.4.1 Large Enterprise Buyers
- 1.4.2 Medium Enterprise Buyers
- 1.4.3 Small Enterprise Buyers
- 1.5 By Revenue Model
- 1.5.1 Fixed-Fee Projects
- 1.5.2 Recurring Advisory Retainers
- 1.5.3 Outcome-Linked Contracts
Chapter 2 Introduction
- 2.1 Report Objectives and Scope
- 2.2 Product Definition and Industry Terminology
- 2.3 Market Inclusions and Exclusions
- 2.4 Research Process
- 2.4.1 Primary Research and Expert Interviews
- 2.4.2 Secondary Research and Source Review
- 2.4.3 Top-Down and Bottom-Up Estimation
- 2.4.4 Data Triangulation and Verification
- 2.5 Market Size Measurement Basis
- 2.5.1 2025: USD 62.5 million → 2035: USD 150.7 million
- 2.6 Historical and Forecast Reference Periods
- 2.6.1 Historical Period: 2018-2025
- 2.6.2 Base Year: 2025
- 2.6.3 Forecast Period: 2025-2035
- 2.7 Research Assumptions and Limitations
Chapter 3 Executive Summary
- 3.1 Market Snapshot and Key Findings
- 3.2 Base-Year Market Size, 2025
- 3.3 Forecast Market Size, 2035
- 3.4 Revenue and Volume Growth Outlook
- 3.5 Key Demand and Supply Indicators
- 3.6 Leading Market Segments
- 3.7 Fastest-Growing Market Opportunities
- 3.8 Regional Performance Highlights
- 3.9 Technology and Industry Transformation
- 3.10 Competitive Landscape Summary
- 3.11 Analyst View and Strategic Implications
Chapter 4 Argentina Reverse Logistics Consulting Market Trends and Developments
- 4.1 Historical Industry Development, 2018-2025
- 4.2 Recent Market Trends and Developments
- 4.3 Demand and Customer Behavior Trends
- 4.4 Technology and Product Innovation
- 4.5 Artificial Intelligence, Automation and Digitalization
- 4.6 Local Manufacturing and Supply Chain Realignment
- 4.7 Industry Partnerships, Mergers and Acquisitions
- 4.8 Sustainability and Circular Economy Developments
- 4.9 Government and Private Sector Investment Trends
- 4.10 Emerging Business Models and Commercialization
- 4.11 Industry Developments and Announcements
Chapter 5 Argentina Reverse Logistics Consulting Market Supply and Demand Analysis
- 5.1 Demand Trend and Consumption Analysis, 2018-2025
- 5.2 Demand Forecast, 2025-2035
- 5.3 Supply Chain Structure and Procurement Trends
- 5.4 Supply-Demand Gap and Bottlenecks
- 5.5 Import Dependence and Sourcing Structure
- 5.6 Regional Supply and Demand Concentration
Chapter 6 Argentina Reverse Logistics Consulting Market Pricing Analysis
- 6.1 Pricing Structure and Measurement
- 6.2 Historical Pricing Trends, 2018-2025
- 6.3 Pricing Outlook, 2025-2035
- 6.4 Pricing by Product and Market Segment
- 6.5 Geographic Pricing Differences
- 6.6 Key Input, Energy, Labor and Logistics Costs
- 6.7 Contract Pricing and Purchasing Models
- 6.8 Pricing Sensitivity and Competitive Positioning
- 6.9 Price, Margin and Profitability Implications
Chapter 7 Argentina Reverse Logistics Consulting Market Dynamics
- 7.1 Market Growth Drivers
- 7.1.1 Demand-Side Drivers
- 7.1.2 Technology and Innovation Drivers
- 7.1.3 Infrastructure and Investment Drivers
- 7.1.4 Regulatory and Policy Drivers
- 7.2 Market Restraints
- 7.2.1 Cost and Affordability Constraints
- 7.2.2 Technology and Adoption Barriers
- 7.2.3 Supply Chain and Operational Constraints
- 7.3 Market Challenges
- 7.3.1 Competitive Pressure and Margin Erosion
- 7.3.2 Skills, Infrastructure and Implementation Gaps
- 7.4 Emerging Market Opportunities
- 7.5 Market Dynamics Impact and Time-Horizon Assessment
Chapter 8 Argentina Reverse Logistics Consulting Value Chain Analysis
- 8.1 Industry Value Chain Overview
- 8.2 Upstream Suppliers and Critical Inputs
- 8.3 Technology and Component Providers
- 8.4 Manufacturing or Service Delivery
- 8.5 Distribution, Channel Partners and Integrators
- 8.6 Downstream Applications and End Users
- 8.7 Value Addition and Profit Pools
- 8.8 Vertical Integration and Outsourcing
- 8.9 Supplier Concentration and Risk
- 8.10 Supply Chain Localization and Resilience
Chapter 9 Argentina Reverse Logistics Consulting Market Regulations and Policies
- 9.1 Relevant Laws, Standards and Compliance Frameworks
- 9.2 Product, Service, Safety and Quality Requirements
- 9.3 Government Policies, Incentives and Subsidies
- 9.4 Imports, Exports and Trade Barriers
- 9.5 Public Procurement and Local Content Requirements
- 9.6 Data Protection, AI and Cybersecurity Compliance
- 9.7 Upcoming Policy Changes and Market Implications
Chapter 10 Argentina Reverse Logistics Consulting Market Hotspots and Opportunities
- 10.1 Market Opportunity Mapping and Growth Hotspots
- 10.2 High-Growth Applications and Customer Groups
- 10.3 Underserved Markets and White-Space Opportunities
- 10.4 Emerging Technology and Product Opportunities
- 10.5 New Capacity and Investment Hotspots
- 10.6 Market Entry and Expansion Opportunities
- 10.7 Distribution and Partnership Opportunities
- 10.8 Near-Term and Long-Term Commercial Potential
- 10.9 Opportunity Attractiveness and Execution Risks
Chapter 11 Argentina Reverse Logistics Consulting Market Outlook, 2025-2035
- 11.1 Market Size and Analysis
- 11.1.1 Revenue (Market Measurement: 2025: USD 62.5 million → 2035: USD 150.7 million)
- 11.1.2 Historical Market Size, 2018-2025
- 11.1.3 Base-Year Market Size, 2025
- 11.2 Market Forecast, 2025-2035
- 11.2.1 Revenue Forecast to 2035
- 11.2.2 CAGR and Year-on-Year Growth
- 11.2.3 Incremental Revenue Opportunity
- 11.3 Forecast Assumptions and Scenario Analysis
- 11.3.1 Base-Case Forecast
- 11.3.2 Optimistic and Conservative Scenarios
- 11.3.3 Technology, Pricing and Policy Sensitivities
- 11.4 Market Attractiveness and Growth Outlook
Chapter 12 Argentina Reverse Logistics Consulting Market Segmentation and Outlook
- 12.1 Segmentation Summary and Market Shares, 2025
- 12.2 Largest and Fastest-Growing Segments
- 12.3 By Service Type - Market Size and Forecast, 2025-2035
- 12.3.1 Segment Definition and Scope
- 12.3.2 Historical Market Size, 2018-2025
- 12.3.3 Revenue Forecast, 2025-2035
- 12.3.4 Base-Year Market Share, 2025
- 12.3.5 Segment CAGR and Growth Drivers
- 12.3.6 Subsegment Market Size and Forecast
- 12.3.6.1 Returns Process and Capability Design
- 12.3.6.2 Technology and Systems Advisory
- 12.3.6.3 Strategy and Network Design
- 12.3.6.4 Circularity and Compliance Advisory
- 12.3.7 Subsegment Pricing and Adoption Trends
- 12.3.8 Leading Suppliers and Competition
- 12.3.9 Regional Demand and Opportunities
- 12.4 By End-Use Industry - Market Size and Forecast, 2025-2035
- 12.4.1 Segment Definition and Scope
- 12.4.2 Historical Market Size, 2018-2025
- 12.4.3 Revenue Forecast, 2025-2035
- 12.4.4 Base-Year Market Share, 2025
- 12.4.5 Segment CAGR and Growth Drivers
- 12.4.6 Subsegment Market Size and Forecast
- 12.4.6.1 Retail and Electronic Commerce
- 12.4.6.2 Manufacturing and Automotive
- 12.4.6.3 Pharmaceutical and Healthcare
- 12.4.6.4 Electronics and Agrifood
- 12.4.7 Subsegment Pricing and Adoption Trends
- 12.4.8 Leading Suppliers and Competition
- 12.4.9 Regional Demand and Opportunities
- 12.5 By Customer Type - Market Size and Forecast, 2025-2035
- 12.5.1 Segment Definition and Scope
- 12.5.2 Historical Market Size, 2018-2025
- 12.5.3 Revenue Forecast, 2025-2035
- 12.5.4 Base-Year Market Share, 2025
- 12.5.5 Segment CAGR and Growth Drivers
- 12.5.6 Subsegment Market Size and Forecast
- 12.5.6.1 Large Enterprise Buyers
- 12.5.6.2 Medium Enterprise Buyers
- 12.5.6.3 Small Enterprise Buyers
- 12.5.7 Subsegment Pricing and Adoption Trends
- 12.5.8 Leading Suppliers and Competition
- 12.5.9 Regional Demand and Opportunities
- 12.6 By Revenue Model - Market Size and Forecast, 2025-2035
- 12.6.1 Segment Definition and Scope
- 12.6.2 Historical Market Size, 2018-2025
- 12.6.3 Revenue Forecast, 2025-2035
- 12.6.4 Base-Year Market Share, 2025
- 12.6.5 Segment CAGR and Growth Drivers
- 12.6.6 Subsegment Market Size and Forecast
- 12.6.6.1 Fixed-Fee Projects
- 12.6.6.2 Recurring Advisory Retainers
- 12.6.6.3 Outcome-Linked Contracts
- 12.6.7 Subsegment Pricing and Adoption Trends
- 12.6.8 Leading Suppliers and Competition
- 12.6.9 Regional Demand and Opportunities
- 12.7 Segment Growth Comparison
- 12.8 Segment Attractiveness and Priority Matrix
Chapter 13 Argentina Reverse Logistics Consulting End-Use and Application Market Outlook
- 13.1 End-Use Industry and Customer Demand Structure
- 13.2 Leading Applications and Customer Groups
- 13.3 End-Use Market Size, Share and Forecast
- 13.4 Major End-Use Industry Deep Dives
- 13.4.1 Customer Requirements and Use Cases
- 13.4.2 Demand and Replacement Cycles
- 13.4.3 Technical and Regulatory Considerations
- 13.4.4 Purchasing and Procurement Models
- 13.4.5 Leading Vendors and Distribution Channels
- 13.4.6 Forecast and Commercial Opportunities
- 13.5 Emerging Applications and Cross-Segment Demand
- 13.6 End-Use Industry Investment Priorities
Chapter 14 Argentina Reverse Logistics Consulting Geographic Market Outlook, 2025-2035
- 14.1 Domestic Market Distribution and Demand Clusters
- 14.2 State- or Province-Wise Market Size and Forecast, 2025-2035
- 14.3 City and Metropolitan Market Outlook
- 14.4 Industrial, Manufacturing and Commercial Clusters
- 14.5 Geographic Concentration of Key End Users
- 14.6 Local Pricing and Purchasing Differences
- 14.7 Domestic Production Facilities and Capacity Map
- 14.8 Local Infrastructure and Project Pipeline
- 14.9 State-Level Policy and Incentive Differences
- 14.10 Subnational Investment Hotspots and Opportunities
- 14.11 Distribution and Logistics Networks
- 14.12 Domestic Competitive Footprint
Chapter 15 Argentina Reverse Logistics Consulting Technology, Innovation and Sustainability Outlook
- 15.1 Technology Landscape and Maturity
- 15.2 Product, Process and Service Innovation
- 15.3 AI, Automation and Digital Tools in the Industry
- 15.4 Technology Adoption and Performance Benchmarking
- 15.5 Innovation Pipeline and R&D Investment
- 15.6 Energy Efficiency and Resource Management
- 15.7 Sustainability, Recycling and Circularity
- 15.8 Technology Roadmap, 2025-2035
- 15.9 Risks of Obsolescence and Technology Substitution
Chapter 16 Argentina Reverse Logistics Consulting Market Key Strategic Imperatives
- 16.1 Growth and Market Entry Priorities
- 16.2 High-Return Products and Segments
- 16.3 Pricing, Profitability and Cost Optimization
- 16.4 Technology Investment and Product Differentiation
- 16.5 Supply Chain Localization and Resilience
- 16.6 Distribution and Customer Acquisition
- 16.7 Partnership, Acquisition and Capacity Strategy
- 16.8 Regional Expansion Priorities
- 16.9 Short-, Medium- and Long-Term Actions
Chapter 17 Competition Outlook
- 17.1 Industry Competition Characteristics
- 17.2 Market Structure and Concentration
- 17.3 Market Share and Competitive Positioning, 2025
- 17.4 Company-Wise Revenue and Product Benchmarking
- 17.5 Production and Service Capacity Benchmarking
- 17.6 Technology, Pricing and Differentiation
- 17.7 Regional Footprint and Distribution Strength
- 17.8 Mergers, Acquisitions and Strategic Alliances
- 17.9 New Entrants and Competitive Threats
- 17.10 Porter's Five Forces and Industry Attractiveness
- 17.11 Competitive Outlook, 2025-2035
Chapter 18 Company Profiles
- 18.1 Company Coverage and Selection Criteria
- 18.2 Accenture Argentina
- 18.2.1 Business Description
- 18.2.2 Company Ownership and Geographic Presence
- 18.2.3 Product and Service Portfolio
- 18.2.4 Manufacturing and Operating Footprint
- 18.2.5 Financial Performance and Investment
- 18.2.6 Market Share and Competitive Position
- 18.2.7 Technology and Innovation Capabilities
- 18.2.8 Strategic Alliances or Partnerships
- 18.2.9 Recent Developments
- 18.2.10 Growth Strategy and Outlook
- 18.3 Deloitte Argentina
- 18.4 EY Argentina
- 18.5 PwC Argentina
- 18.6 McKinsey & Company Argentina
- 18.7 Boston Consulting Group Argentina
- 18.8 DHL Supply Chain Argentina
- 18.9 Kuehne+Nagel Argentina
- 18.10 KPMG Argentina
- 18.11 Paradigma
- 18.12 Other Relevant Market Participants
Note: Every listed company is profiled on the structure shown under the first company. The company list is preliminary and may change based on research findings, market developments, data availability and client requirements.
Chapter 19 Disclaimer
- 19.1 Research and Forecast Disclaimer
- 19.2 Data Source and Estimation Limitations
Note: The depth of individual sections depends on data availability for this market. Volume, capacity, trade and other unit-based metrics are included where applicable.

