
Food exports and retail stock levels set warehouse demand
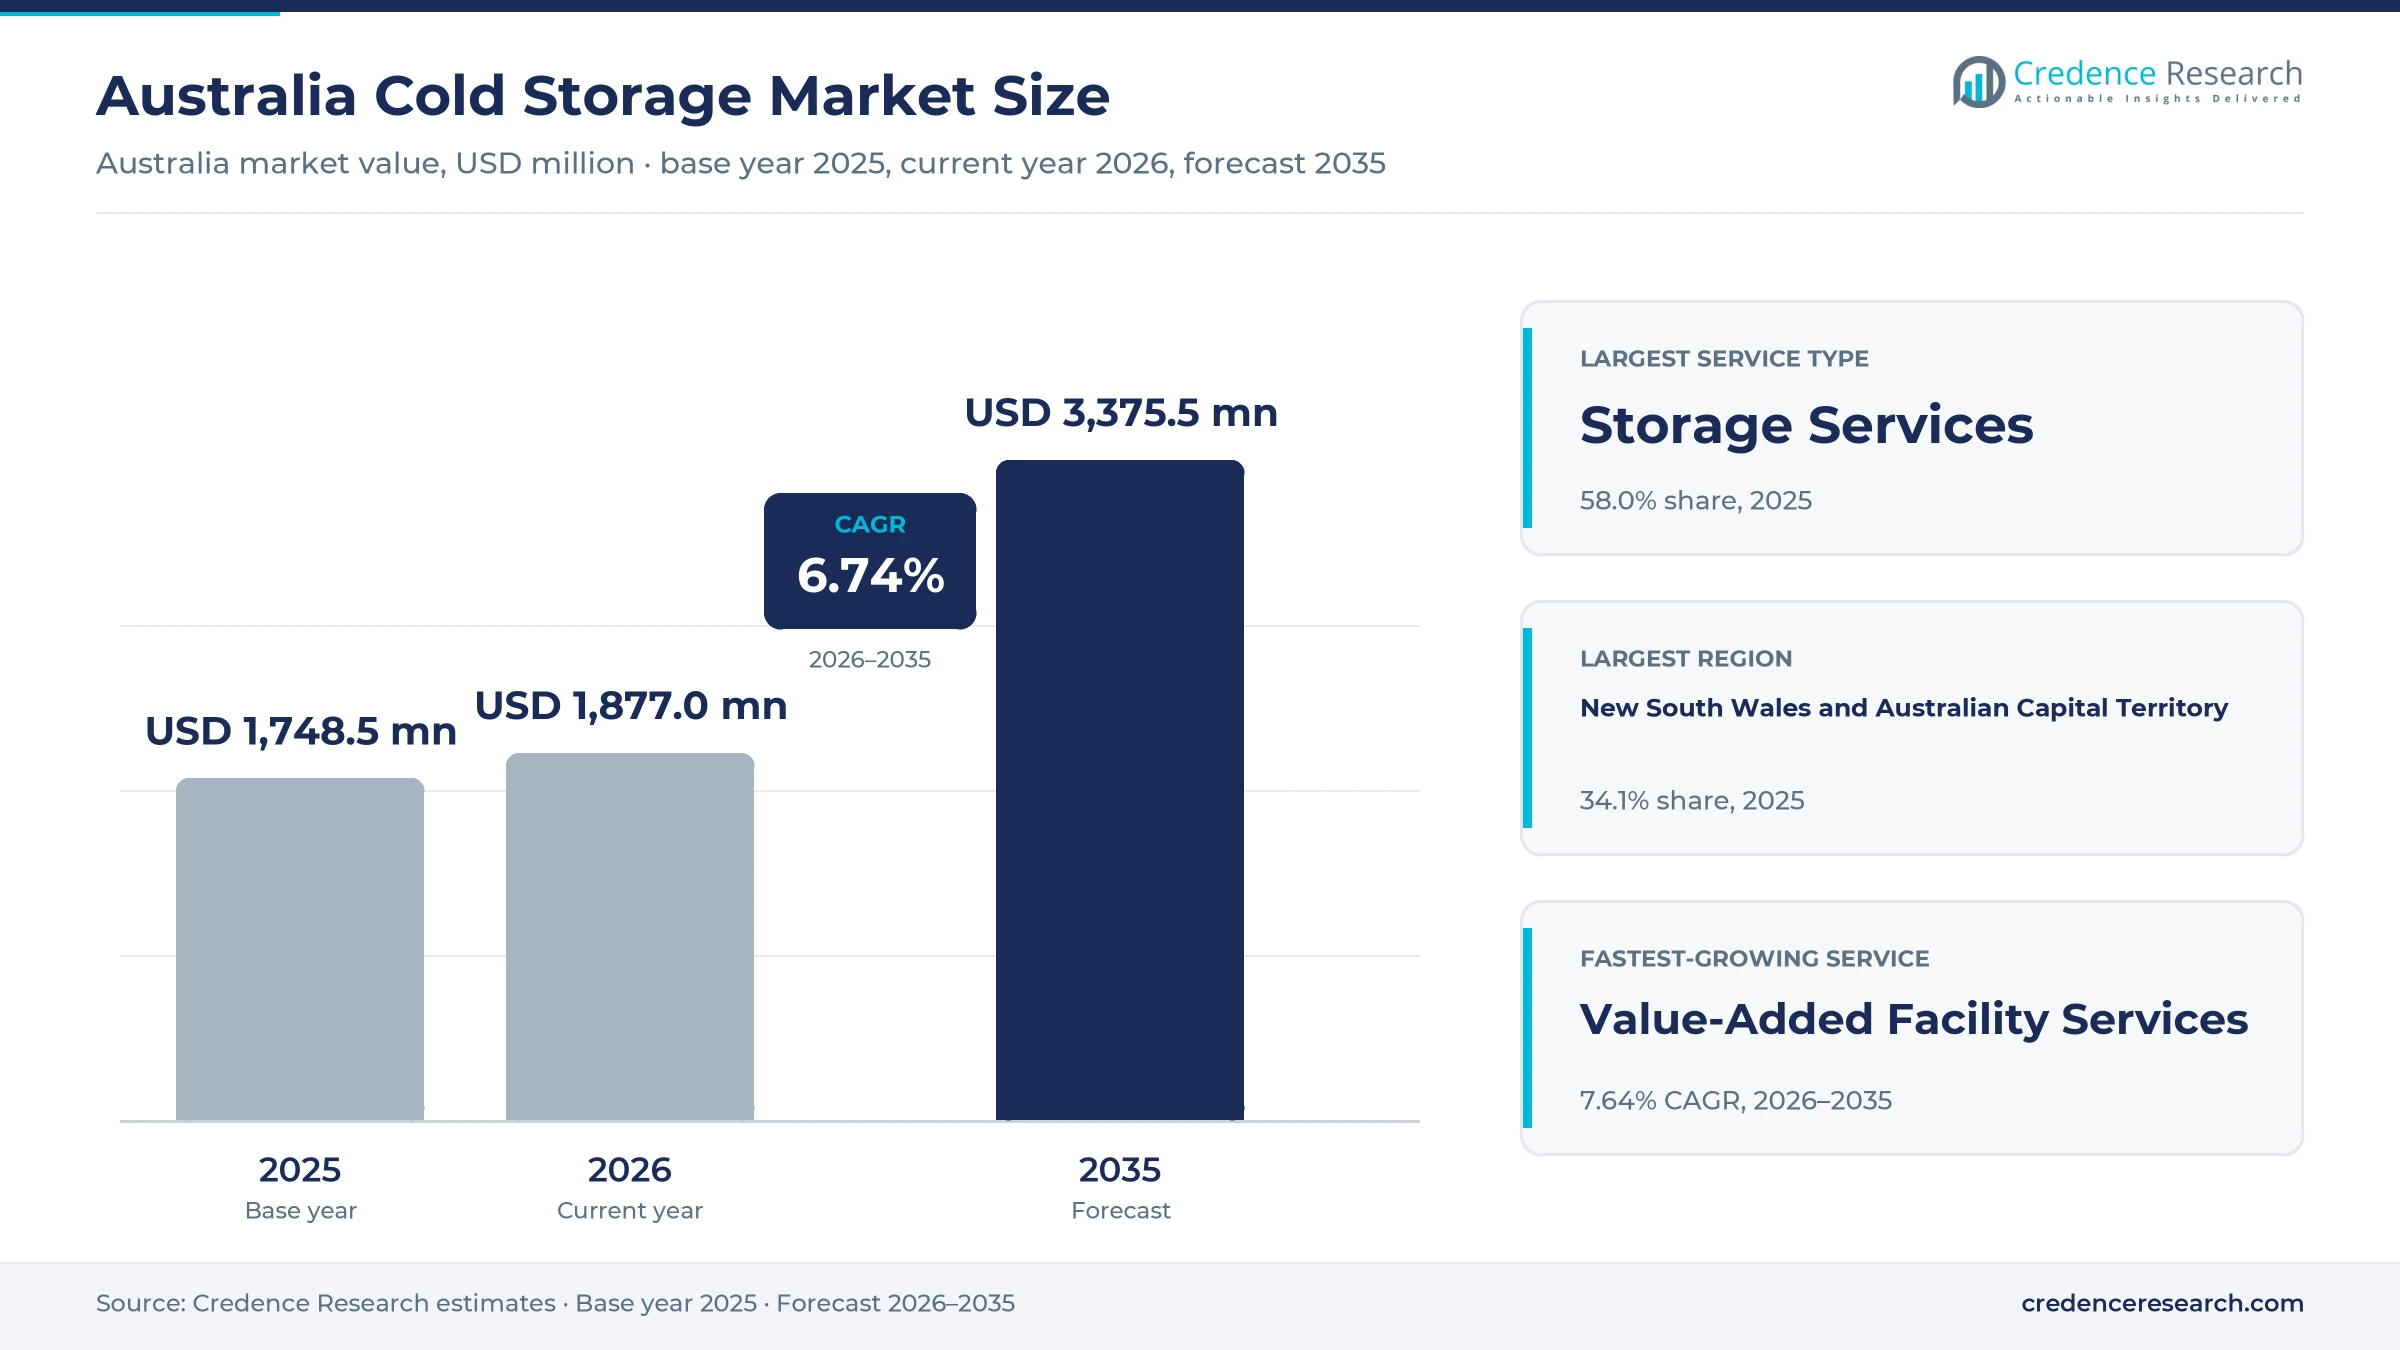
The Australia cold storage market was valued at USD 1.75 billion in 2025 and is projected to increase from USD 1.88 billion in 2026 to USD 3.38 billion by 2035, registering a CAGR of 6.74% during 2026–2035. Demand comes from meat, dairy, seafood, produce and frozen food producers, supermarket chains, importers and medicine distributors that need chilled and frozen space close to ports and capital cities. New South Wales and the Australian Capital Territory held the largest regional share, 34.1% in 2025, because Sydney is the largest consumer base and gains several new automated sites. The same zone is also the fastest-growing region at 7.12% a year, as new frozen warehouses open in western Sydney during 2025 and 2026. At the same time, operators are replacing older manual rooms with tall automated freezers that hold far more pallets on the same land and use less labor per pallet moved.
Which temperature-controlled warehouse services does the estimate cover?
The estimate measures the value of chilled, frozen and controlled ambient warehouse services sold to buyers in Australia. It counts storage fees, pallet handling, blast freezing, tempering, labeling, repacking and export preparation, whether services run in shared-user buildings, dedicated sites or on a customer's own premises under a management contract.
The estimate excludes refrigerated trucking revenue, refrigeration equipment sales and the rooms that retailers and processors own and run themselves. The value chain runs from developers and refrigeration contractors through warehouse operators to producers, importers, retailers and distributors that rent space by the pallet, by the room or under longer reserved contracts.
Australia Cold Storage Market Insights
- The Australia cold storage market was valued at USD 1.75 billion in 2025 and is projected to reach USD 3.38 billion by 2035, registering a CAGR of 6.74% during 2026–2035.
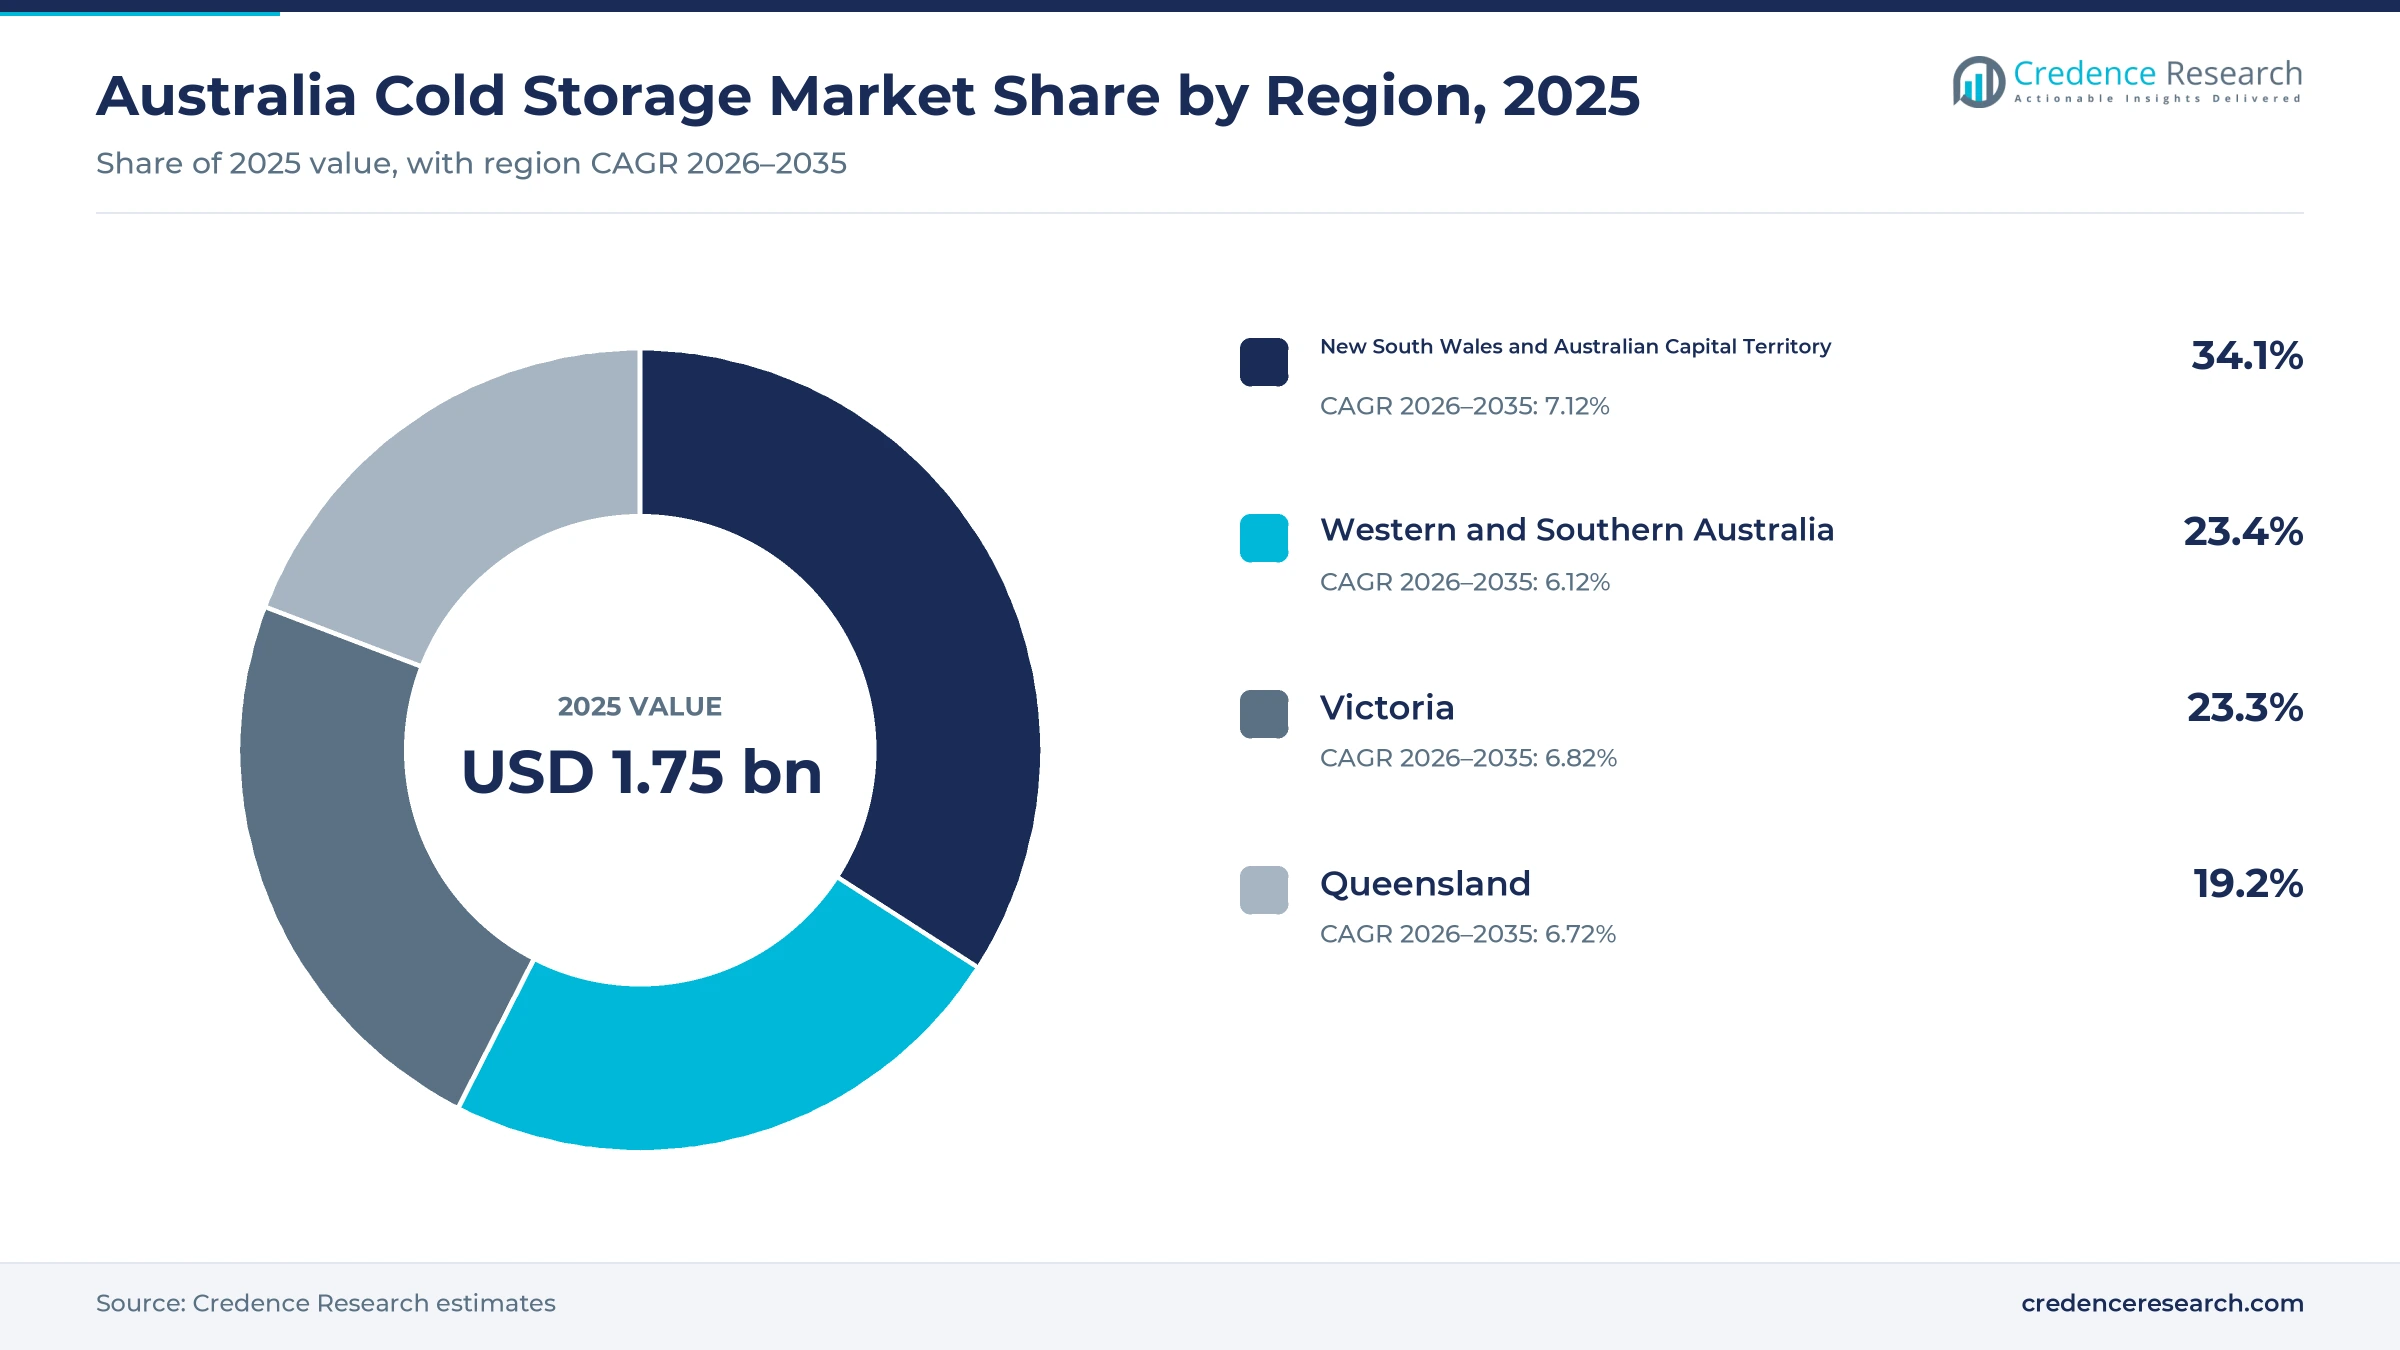
- New South Wales and the Australian Capital Territory held a 34.1% share of 2025 value, because Sydney combines the largest population with new automated freezer projects.
- Storage services led with a 58.0% share of 2025 value, because pallet rent remains the core charge in nearly every temperature-controlled contract.
- Lineage reported 31 temperature-controlled warehouses in Australia with 501,000 pallet positions at Dec. 31, 2025, which makes it the largest network in the country.
- Value-added facility services grow fastest at 7.64% a year during 2026–2035, as retailers and exporters push labeling, repacking and certification work into warehouses.
Storage services lead while value-added work grows fastest
Why do storage services hold the largest value?
Based on service type, the market is categorized into storage services, handling services, blast-freezing services and value-added facility services. Storage Services led with a 58.0% share of 2025 value, because pallet rent for chilled and frozen space forms the base of every contract. Value-Added Facility Services grow fastest at 7.64% a year, as retailers and exporters move labeling, repacking and document work into warehouses.
How does food and beverage anchor demand?
Based on end-use industry, the market is categorized into food and beverage, pharmaceutical and healthcare, and specialty non-food products. Food and Beverage led with 81.0% of 2025 value, because meat, dairy, seafood, produce and frozen meals fill most pallet positions. Pharmaceutical and Healthcare grows fastest at 8.02% a year, as vaccines, biologics and clinical supplies need monitored space with tight temperature ranges.
Why do shared-user sites remain the main model?
Based on delivery model, the market is categorized into shared-user warehousing, dedicated warehousing and managed on-site warehousing. Shared-User Warehousing led with a 56.0% share of 2025 value, because most producers rent space in multi-client buildings near ports and cities. Dedicated Warehousing grows fastest at 7.32% a year, as large food brands commit whole automated chambers to single customers.
Which buyers rent the most chilled and frozen space?
Based on customer type, the market is categorized into product owners, retail buyers, trade intermediaries and logistics contractors. Product Owners led with a 52.0% share of 2025 value, because processors and food brands hold stock between plants and customers. Retail Buyers grow fastest at 7.24% a year, as supermarket chains hold more stock and outsource frozen buffers.
| Segment Group | Leading Sub-segment | Share, 2025 | Fastest-growing Sub-segment | CAGR, 2026–2035 |
|---|---|---|---|---|
| By Service Type | Storage Services | 58.0% | Value-Added Facility Services | 7.64% |
| By End-Use Industry | Food and Beverage | 81.0% | Pharmaceutical and Healthcare | 8.02% |
| By Delivery Model | Shared-User Warehousing | 56.0% | Dedicated Warehousing | 7.32% |
| By Customer Type | Product Owners | 52.0% | Retail Buyers | 7.24% |
Request a Free Sample
Fill in your details and we'll send you a free sample report.
- Sample data tables & charts
- Research methodology
Food flows, automation and tighter rules lift capacity use
How do food inventory and export flows fill capacity?
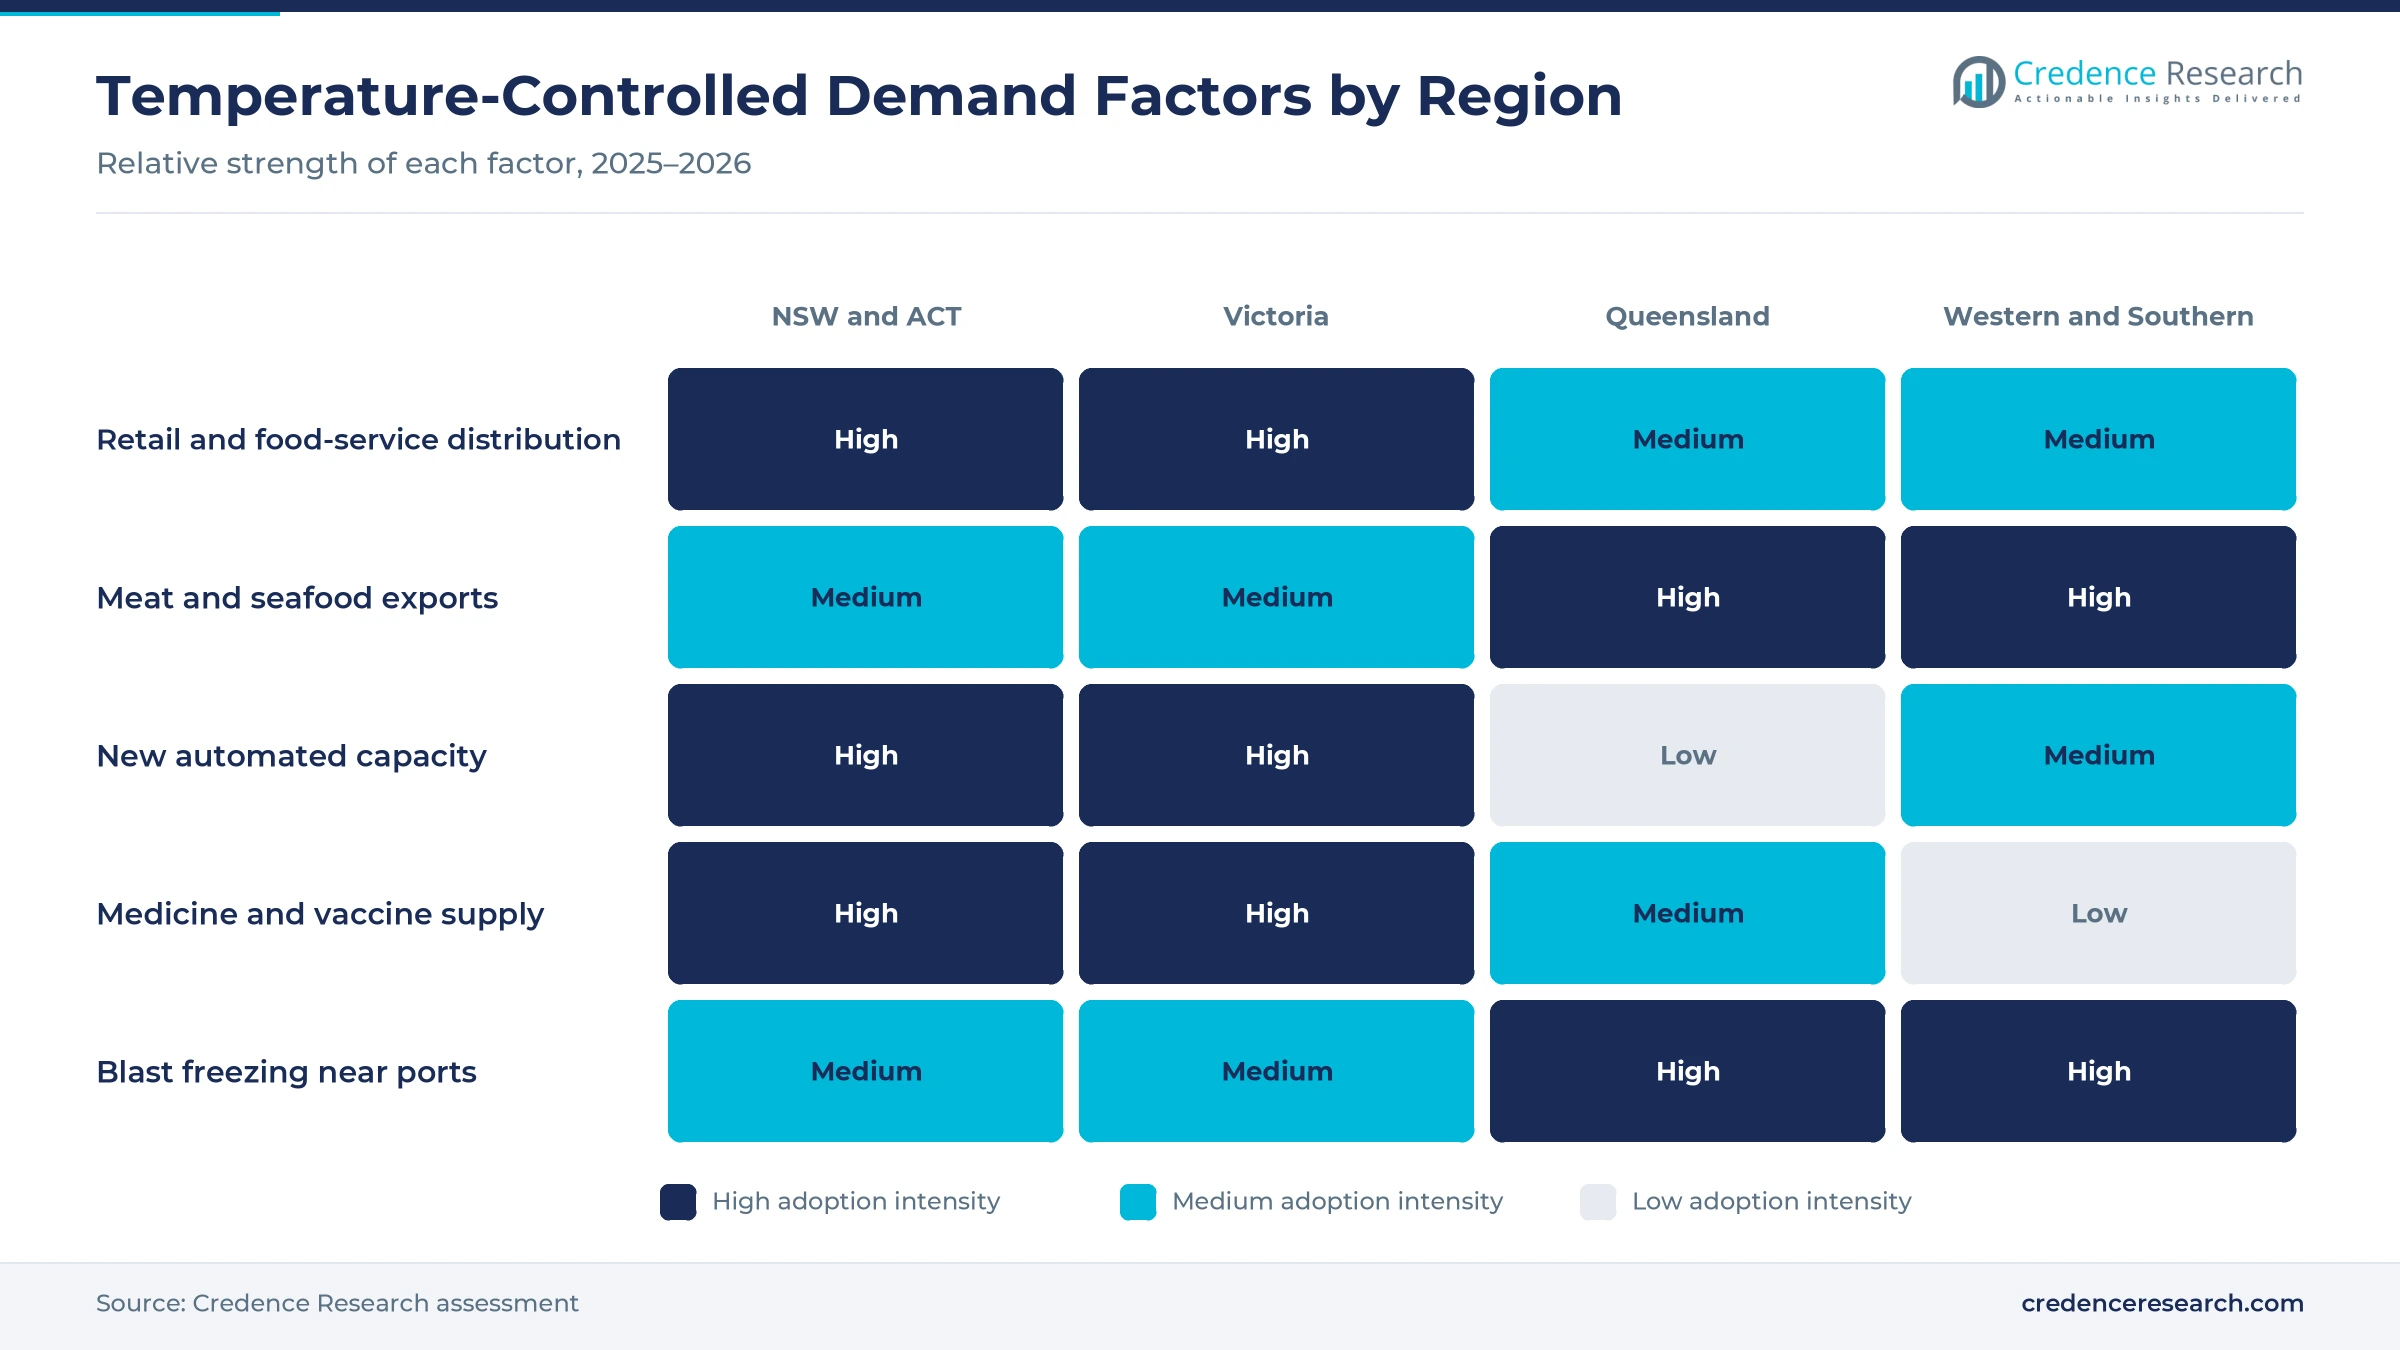
Australia exports a large share of its meat, dairy and seafood, and every shipment passes through chilled or frozen space before it reaches a port. The Australian Bureau of Agricultural and Resource Economics and Sciences forecast agricultural exports of A$74.6 billion in 2025–26 and beef and live cattle exports of A$16.4 billion. The same outlook put gross agricultural output at A$94.7 billion and horticulture exports at A$4.7 billion, up 8%. Americold's Asia-Pacific head told Food Processing that customers had moved from just-in-time to just-in-case stock holding, which keeps pallets in warehouses longer. As a result, food and beverage holds 81.0% of 2025 value, with export meat processing as a steady source of frozen volume.
Why does automated capacity renewal lift supply?
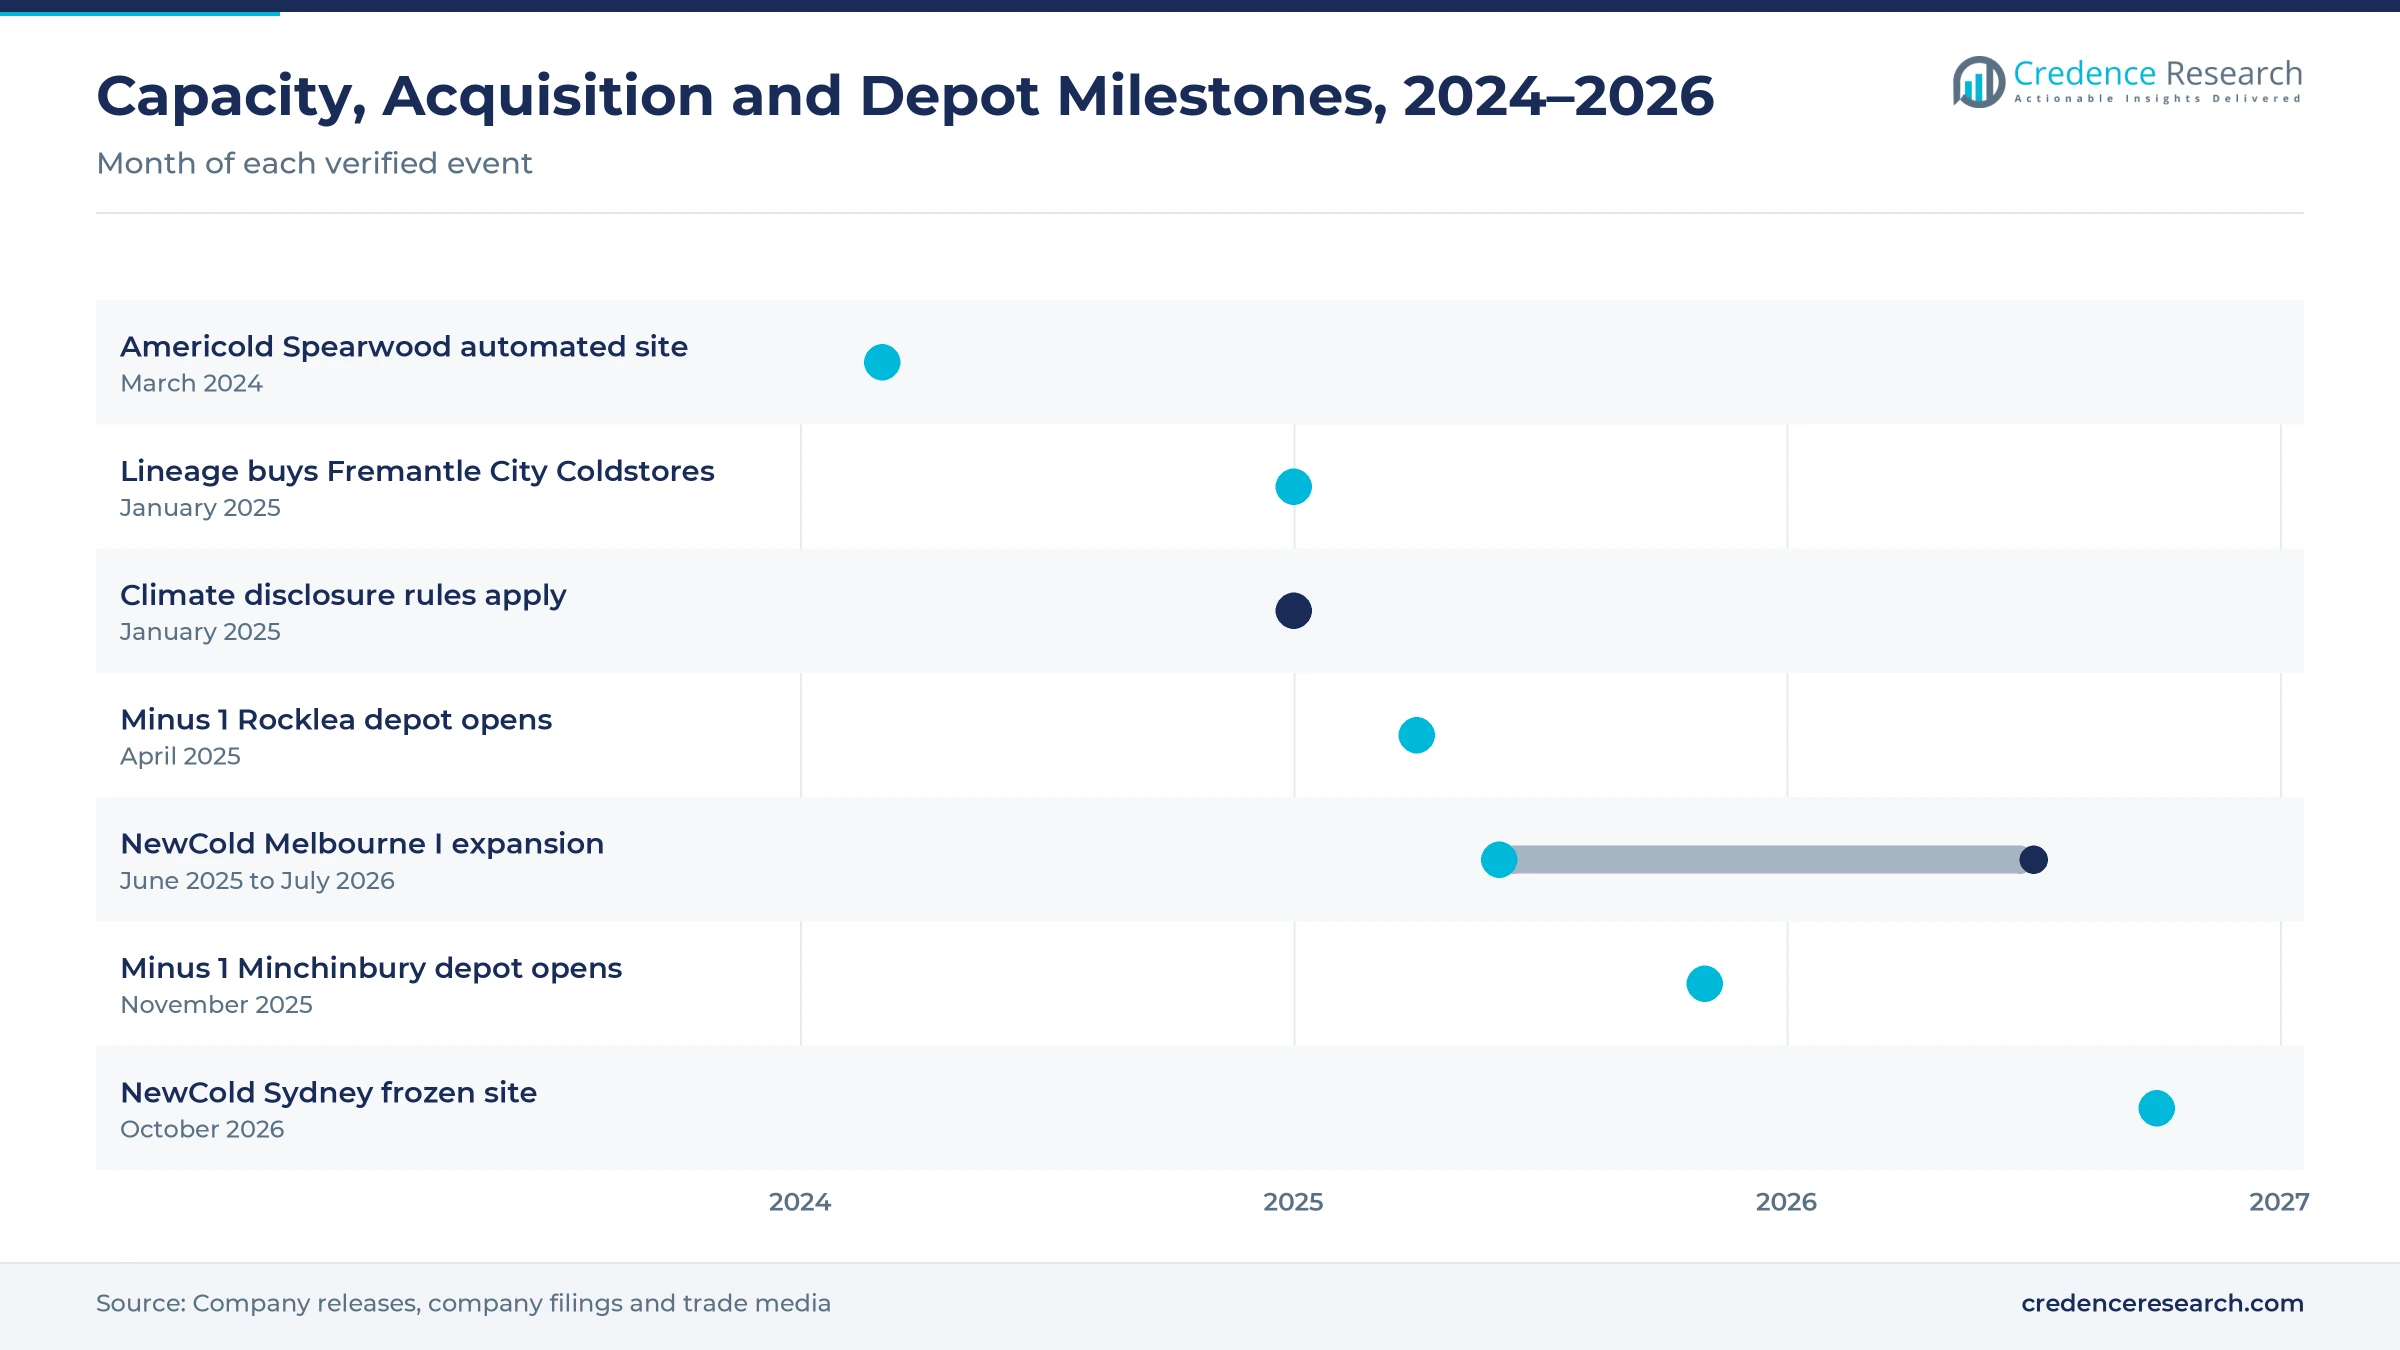
Operators are replacing older manual rooms with tall automated freezers, which add far more pallets on the same land and cut labor per movement. NewCold said on June 2, 2025 that its Melbourne I expansion adds 80,000 frozen pallet positions and lifts the site to 405,000 positions by July 2026. The same release set a new Sydney site with 100,000 frozen positions to begin operations by October 2026. Americold opened an automated storage and retrieval building at Spearwood in Western Australia in March 2024 that doubled capacity at that site, Food Processing reported. In turn, dedicated warehousing grows at 7.32% a year, as brands reserve whole chambers in these sites built around automated retrieval systems.
How does compliance-intensive customer demand shape use?
Food and medicine buyers face strict temperature rules, which pushes them toward operators that can prove control and keep records. Food Standards Australia New Zealand says that cold potentially hazardous food must be kept at 5°C or colder under Standard 3.2.2. The Department of Health National Vaccine Storage Guidelines require vaccines to stay between +2°C and +8°C. Lineage lists Department of Agriculture, Fisheries and Forestry import and export certification across its Victoria, New South Wales, Queensland and western and southern sites. As a result, pharmaceutical and healthcare grows at 8.02% a year, the fastest end-use industry, as monitored space with audit trails becomes a basic requirement for clinical and vaccine supply.
Why do retail distribution upgrades raise outsourced demand?
Supermarket chains are rebuilding their distribution networks, which changes how much frozen and chilled stock they hold with outside operators. Woolworths Group opened its Moorebank regional distribution center in western Sydney on Nov. 13, 2025, completing a A$1.3 billion precinct of 75,000 square meters. NewCold's Truganina precinct serves Peters as its national distribution point and holds about 95,000 pallets for Lactalis, CommercialRealEstate.com.au reported in September 2026. Minus 1 opened a Minchinbury depot in November 2025 with a freezer for more than 10,000 pallets and 19 loading docks, Trailer Magazine reported. In turn, retail buyers grow at 7.24% a year, the fastest customer type, as chains outsource frozen buffers.
Chilled growth, linked transport and export freezing
How is the shift toward chilled demand changing sites?
Operators now design new space for chilled and ambient flows alongside deep frozen storage, because chilled food consumption is rising faster. NewCold said on May 7, 2026 that recent market analysis shows chilled consumption growing faster than frozen, while ambient storage is also gaining importance. NewCold's Melbourne II site already runs five temperature zones, CommercialRealEstate.com.au reported. Minus 1's Rocklea depot in Brisbane opened in April 2025 with 5,000 spaces across freezer, chiller and ambient zones. As a result, handling services grow faster than pure storage, because chilled stock turns quickly and needs more picking, cross-docking and order assembly per pallet held.
Why is the rise of linked transport and warehousing notable?
Customers increasingly want one operator to store, consolidate and deliver chilled and frozen goods, which joins warehouse and fleet businesses. NewCold acquired Karras, a refrigerated transport company founded in 1976, and has put newly branded trucks and trailers into service. Lineage bought Auscold Logistics in Adelaide in December 2021, adding more than 70 temperature-controlled trucks to its South Australian warehouses. Minus 1 built its Rocklea depot with more than 4,000 square meters of parking for A-double and B-triple trucks. In turn, logistics contractors buy more overflow space, and integrated operators link storage with refrigerated transport contracts.
Can port-side blast freezing open new export work?
Meat and seafood exporters need fast freezing and certified space close to container terminals, which creates room for port-side specialists. Lineage acquired Fremantle City Coldstores in January 2025, adding more than 8,000 pallet positions and six blast cells with almost 250,000 kilograms of capacity less than 10 kilometers from Fremantle Port. Lineage also runs blast freezing at its Cannon Hill and Hemmant sites near the Port of Brisbane. Americold offers blast freezing and export services for the meat sector in Queensland and Western Australia. As a result, blast-freezing services gain export volume as wild-catch and farmed seafood shippers seek certified space.
Is there an opening in low-emission refrigeration?
Refrigerant rules, climate reporting and power costs now favor efficient buildings, which gives newer sites an edge with large food brands. Australia began a phase-down of hydrofluorocarbon imports on Jan. 1, 2018, with quotas falling to 15% of the baseline by Jan. 1, 2036, according to a government factsheet. Americold said in its 2025 annual filing that its Australian business must begin complying with mandatory climate-related financial disclosure rules in 2025. Lineage notes rooftop solar at Fremantle City Coldstores, and Americold cites solar panels across its Australian sites. In turn, operators that retrofit natural refrigerants and solar can win reserved-capacity contracts from brands with emission targets.
Power costs, refrigerant rules and build costs weigh
How do electricity costs pressure margins?
Refrigeration runs day and night, so power is one of the largest operating costs for every freezer and chiller operator. As a result, price spikes in the national electricity market can erode margins on fixed-rate contracts quickly. Operators respond with rooftop solar, better insulation and supply contracts with price caps. Even so, older manual stores with weak insulation and aging compressors carry the highest exposure, and they often lose tenants to newer, more efficient buildings during contract renewals.
Why does the refrigerant transition add cost?
The hydrofluorocarbon phase-down steadily cuts the supply of common synthetic refrigerants, which raises service and top-up costs for older plants. In turn, owners of aging stores face expensive conversions to ammonia, carbon dioxide or newer blends. Operators respond by scheduling refrigeration plant upgrades alongside planned expansions. Smaller independent stores often lack the capital for these upgrades, so some of them may exit the market or sell their sites to larger operators.
How do land and build costs slow new supply?
Freezer buildings cost far more per square meter than dry warehouses, because they need insulated panels, heavy floors and large refrigeration plants. As a result, only operators with long anchor contracts can justify new automated buildings in Sydney and Melbourne. Industrial land near ports and major motorways is also scarce and expensive in both cities. Developers respond with staged builds and preleasing to anchor tenants, which delays new capacity for smaller importers and producers that need only a few hundred pallets.
Why do labor and safety needs strain manual sites?
Work in freezers at minus 20°C or lower is physically hard, which makes recruitment and retention difficult for manual operators. In turn, staff shortages slow receiving and dispatch during seasonal peaks such as harvest and holiday periods. Operators respond with automation, shorter shifts and better protective clothing for frozen chambers. Manual sites still compete for the same skilled forklift and inventory workers as automated rivals, which keeps wage pressure high in western Sydney and Melbourne.
New South Wales leads and adds the most new capacity
| Region | Value, 2025 (USD billion) | Share, 2025 | CAGR, 2026–2035 |
|---|---|---|---|
| New South Wales and Australian Capital Territory | 0.60 | 34.1% | 7.12% |
| Western and Southern Australia | 0.41 | 23.4% | 6.12% |
| Victoria | 0.41 | 23.3% | 6.82% |
| Queensland | 0.34 | 19.2% | 6.72% |
Why do New South Wales and the ACT hold the top share?
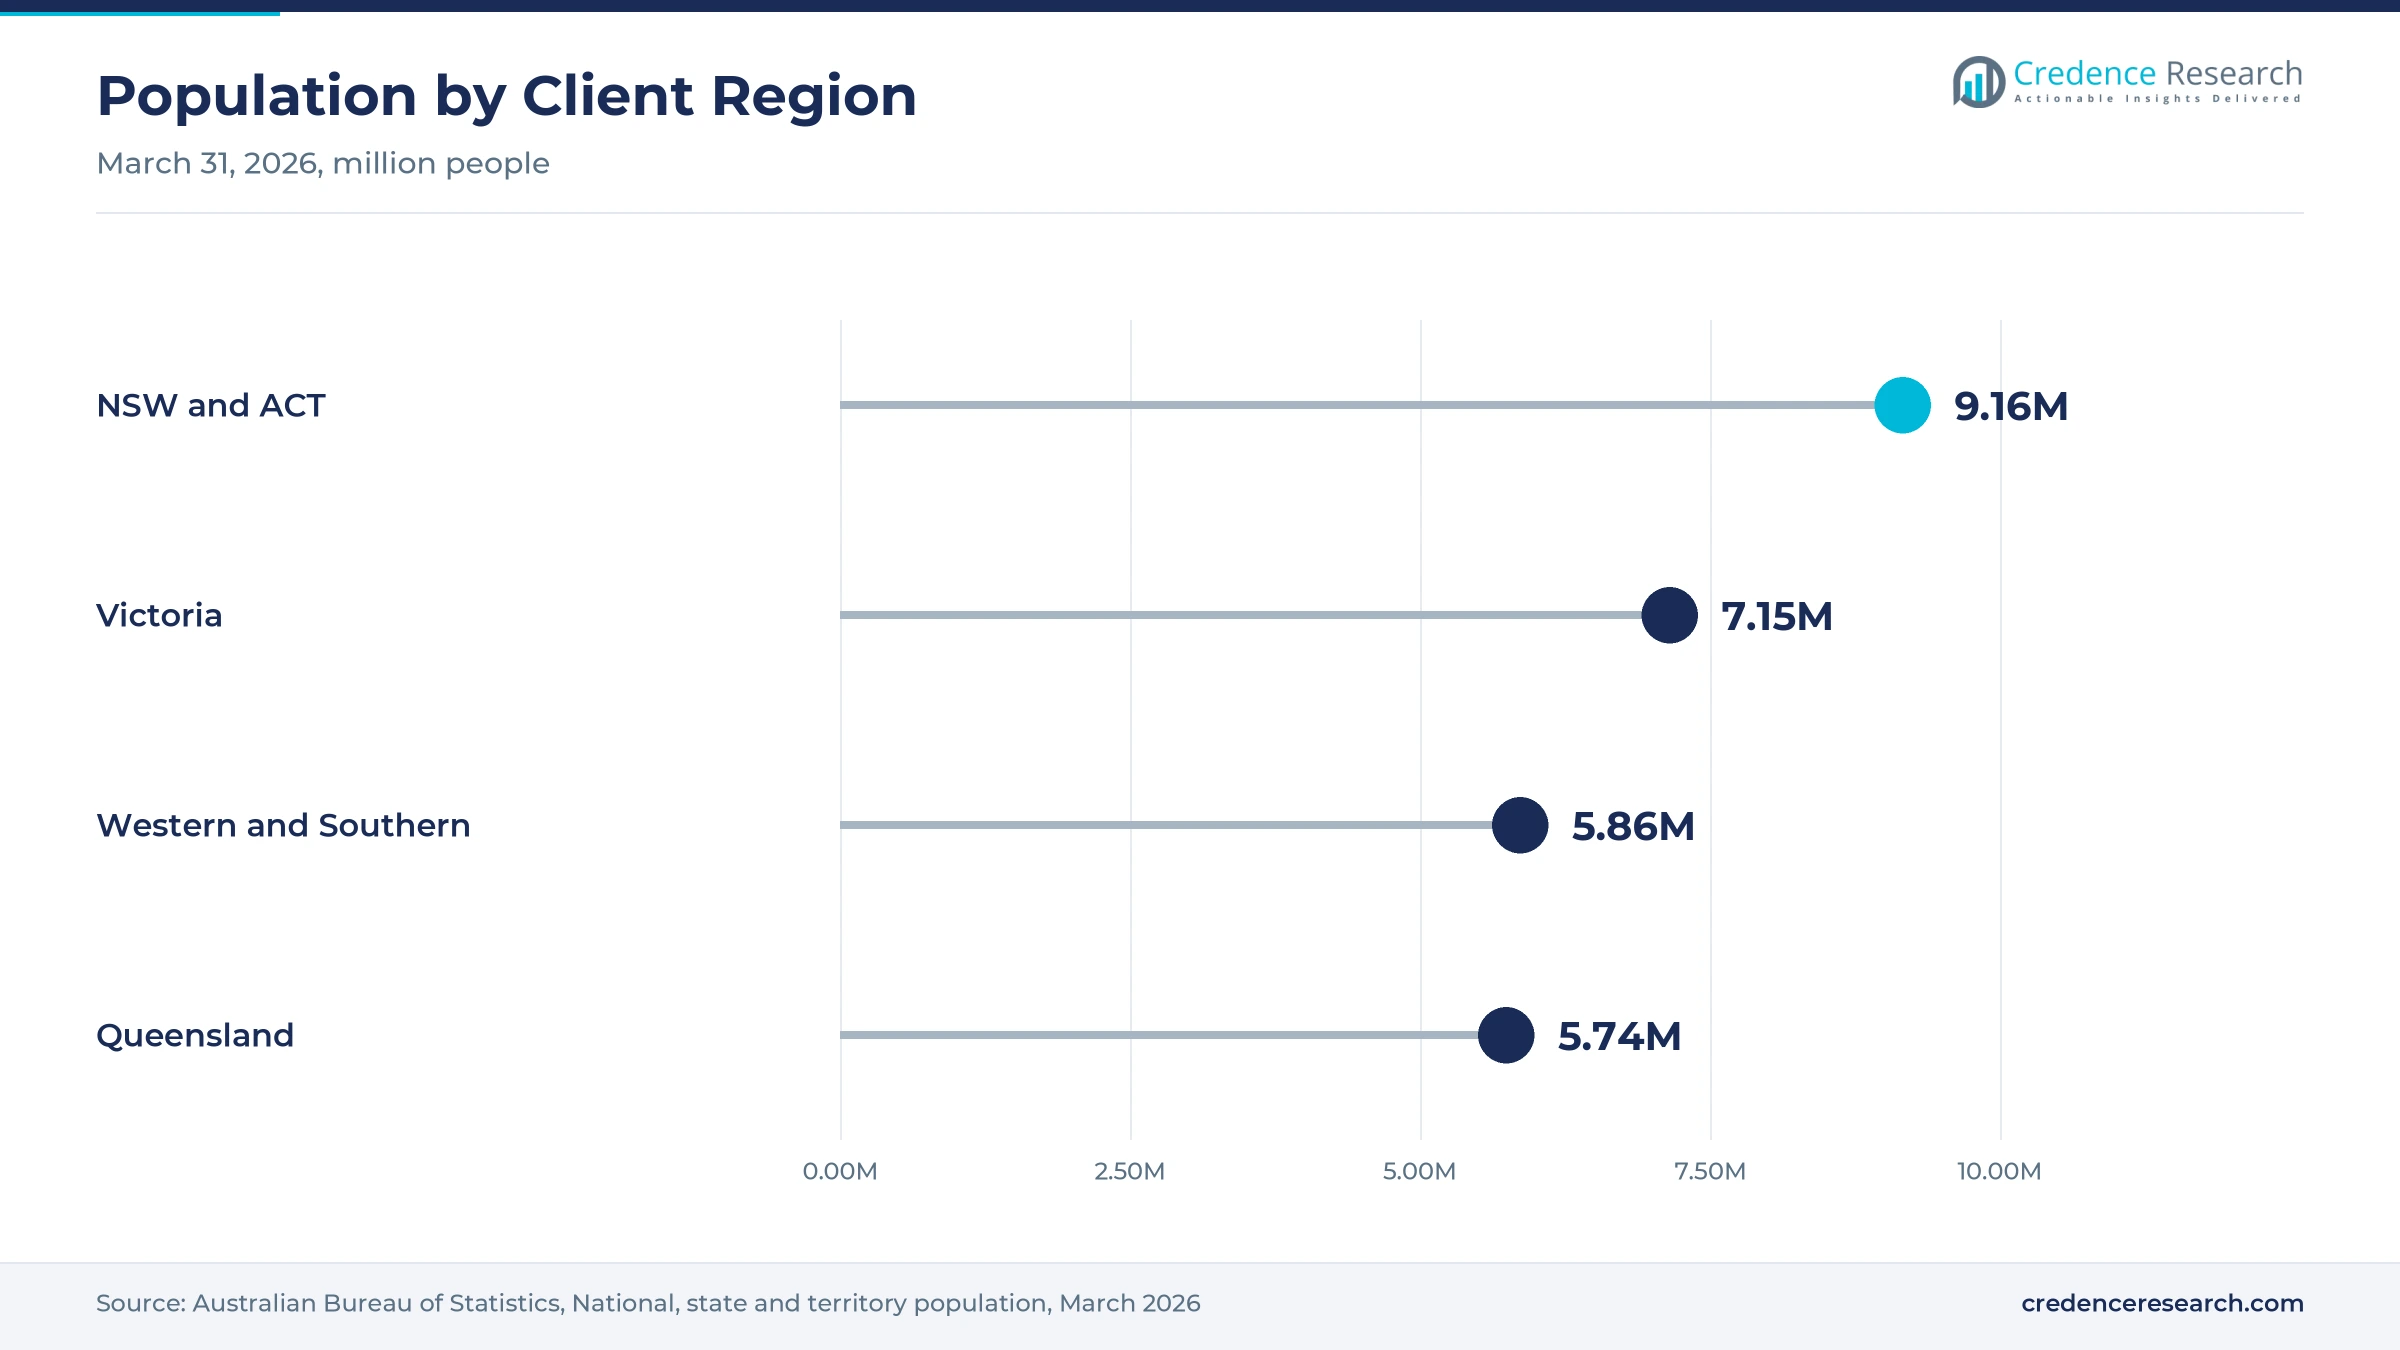
New South Wales and the Australian Capital Territory held a 34.1% share of 2025 value and grow fastest at 7.12% a year, because Sydney is the largest consumer base. The zone had 9.16 million residents at March 31, 2026, according to the Australian Bureau of Statistics. NewCold is building a 100,000-pallet frozen site at Marsden Park, and Minus 1 opened its Minchinbury depot in November 2025. As a result, western Sydney adds the most new automated frozen capacity in the country.
Western and Southern Australia anchors port-side export storage
Western and Southern Australia held a 23.4% share of 2025 value and grows at 6.12% a year, because meat, seafood and grain-fed livestock exporters need port-side space. Lineage runs seven facilities in Western and South Australia with more than 70,000 pallet positions. Americold doubled capacity at Spearwood near Fremantle Port in March 2024. In this report, the zone covers Western Australia, South Australia, Tasmania and the Northern Territory, so demand spreads across several smaller cities.
Why is Victoria a frozen food distribution hub?
Victoria held a 23.3% share of 2025 value and grows at 6.82% a year, because Melbourne's western suburbs host national frozen food distribution. NewCold's Melbourne I site at Truganina was set to reach 405,000 pallet positions by July 2026, according to the company. Its new freezer section runs at minus 23°C with reduced oxygen levels for fire suppression. In turn, Victoria serves frozen potato, ice cream and dairy brands that ship from Melbourne to every state.
How does Queensland support port and produce flows?
Queensland held a 19.2% share of 2025 value and grows at 6.72% a year, because beef exports and tropical produce need chilled and frozen space near Brisbane. Lineage operates four sites within 20 kilometers of the Port of Brisbane with more than 84,000 pallet positions. Americold lifted its Queensland capacity to more than 70,000 pallets after acquiring a site at Ormeau. As a result, Queensland combines export freezing with growing supply to the south-east population corridor.
Automated builds, port acquisitions and new depots
| Development | Status and market relevance |
|---|---|
| In March 2024, Americold opened an automated temperature-controlled building at Spearwood in Western Australia. | Doubles capacity at the site with blast freezing and export certification near Fremantle Port |
| In January 2025, Lineage acquired Fremantle City Coldstores in Western Australia. | Adds more than 8,000 pallet positions and six blast cells for meat and seafood customers |
| In April 2025, Minus 1 opened a depot at Rocklea in Brisbane. | Adds 5,000 spaces across freezer, chiller and ambient zones with 10 docks |
| In June 2025, NewCold announced its Melbourne I expansion and a new Sydney facility. | Adds 80,000 frozen positions in Melbourne and 100,000 in Sydney by 2026 |
| In November 2025, Minus 1 opened its Minchinbury depot in western Sydney. | Adds a freezer for more than 10,000 pallets and 19 loading docks |
High-bay automation, low-oxygen fire safety and monitoring
- High-bay automated freezers stack pallets up to 40 meters high with cranes, which lifts capacity on scarce land and removes most manual work in frozen chambers.
- Low-oxygen fire suppression keeps oxygen below the level that supports combustion, which protects tall automated freezers where sprinklers are hard to use.
- Natural refrigerant plants use ammonia or carbon dioxide instead of synthetic gases, which reduces exposure to the import phase-down and lowers emissions.
- Inventory and temperature monitoring gives customers real-time visibility of stock and room conditions, which supports food safety, vaccine and export audits.
Need a Custom Version of This Report?
Tailor the scope, geography, or segments to your exact requirements.
- Custom geography or segment scope
- Direct access to our analyst team
Global operators and regional specialists compete on scale
Competition combines global operators with large automated networks and regional specialists that serve local producers, importers and retailers. Lineage, which entered Australia in 2019, reported 31 warehouses in the country with 136 million cubic feet of space at Dec. 31, 2025, in its annual filing with U.S. regulators. Americold reported 11 Australian warehouses with 63 million cubic feet and about 222,000 average pallet positions in its own 2025 filing. NewCold competes with very tall automated buildings anchored by large frozen food brands in Melbourne and soon Sydney. Minus 1 combines depots with its own fleet in Brisbane and Sydney. Smaller operators compete on location, flexible terms and service for importers that need fewer pallets than global operators prefer.
Which operators run the largest temperature-controlled networks?
| Company | Type | Role in the market |
|---|---|---|
| Lineage | Global warehouse operator | Runs 31 Australian warehouses with port-side blast freezing |
| Americold | Global warehouse operator | Runs 11 Australian warehouses including automated Spearwood |
| NewCold | Automated warehouse operator | Runs the Truganina precinct and builds a Sydney frozen site |
| Minus 1 | Storage and transport operator | Runs depots at Rocklea in Brisbane and Minchinbury in Sydney |
Credence Research view on temperature-controlled capacity
Credence Research's view is that Australian temperature-controlled warehouse demand will grow steadily because food exports, retail stock holding and medicine supply all need more certified chilled and frozen space. Storage services remain the largest service type, while value-added services grow fastest as customers move labeling and repacking into warehouses. New South Wales and the Australian Capital Territory gain most from new automated sites in western Sydney. Operators that combine automated capacity, linked transport and efficient refrigeration should win the most reserved-capacity contracts by 2035.
How the national warehouse estimate was built
The report uses 2025 as the base year on a calendar basis, and market values come from the Credence Research model. That model combines government agricultural outlooks, official population statistics, regulator guidance, company annual filings and company releases. Segment splits and regional growth rates are Credence Research estimates, while regional shares follow the client split. Sources used are government pages, regulator pages, company filings, trade media and company websites, and no interviews or surveys were used.
Automated frozen capacity and chilled demand drive growth
The Australia cold storage market is expected to reach USD 3.38 billion by 2035, a 6.74% CAGR during 2026–2035, as food exporters, retailers and medicine distributors keep adding chilled and frozen volume. Growth should be strongest in value-added services, pharmaceutical and healthcare storage and New South Wales, because these areas gain most from new automated sites and tighter compliance. Power costs, the refrigerant phase-down and high build costs could slow some projects, while solar, natural refrigerants and staged automation should ease expansion for well-funded operators.
Frequently Asked Questions
How big is the Australia cold storage market?
Which service type leads temperature-controlled warehouse spending?
Which region leads the market?
How do food exports support demand?
How is automation changing capacity?
Why is pharmaceutical storage growing fastest?
Who are the leading companies in the market?
What are the main challenges for operators?
Table of Content
Chapter 1 Market Segmentation
- 1.1 Segmentation Framework
- 1.1.1 Product and Service Classification
- 1.1.2 Application and End-Use Classification
- 1.1.3 Technology and Solution Classification
- 1.1.4 Customer and Distribution Channel Classification
- 1.1.5 Geographic Segmentation
- 1.1.6 Market Segment Definitions and Boundaries
- 1.2 By Service Type
- 1.2.1 Storage Services
- 1.2.2 Handling Services
- 1.2.3 Blast-Freezing Services
- 1.2.4 Value-Added Facility Services
- 1.3 By End-Use Industry
- 1.3.1 Food and Beverage
- 1.3.2 Pharmaceutical and Healthcare
- 1.3.3 Specialty Non-Food Products
- 1.4 By Delivery Model
- 1.4.1 Shared-User Warehousing
- 1.4.2 Dedicated Warehousing
- 1.4.3 Managed On-Site Warehousing
- 1.5 By Customer Type
- 1.5.1 Product Owners
- 1.5.2 Retail Buyers
- 1.5.3 Trade Intermediaries
- 1.5.4 Logistics Contractors
Chapter 2 Introduction
- 2.1 Report Objectives and Scope
- 2.2 Product Definition and Industry Terminology
- 2.3 Market Inclusions and Exclusions
- 2.4 Research Process
- 2.4.1 Primary Research and Expert Interviews
- 2.4.2 Secondary Research and Source Review
- 2.4.3 Top-Down and Bottom-Up Estimation
- 2.4.4 Data Triangulation and Verification
- 2.5 Market Size Measurement Basis
- 2.5.1 2025: USD 1.75 billion → 2035: USD 3.38 billion
- 2.6 Historical and Forecast Reference Periods
- 2.6.1 Historical Period: 2018-2025
- 2.6.2 Base Year: 2025
- 2.6.3 Forecast Period: 2025-2035
- 2.7 Research Assumptions and Limitations
Chapter 3 Executive Summary
- 3.1 Market Snapshot and Key Findings
- 3.2 Base-Year Market Size, 2025
- 3.3 Forecast Market Size, 2035
- 3.4 Revenue and Volume Growth Outlook
- 3.5 Key Demand and Supply Indicators
- 3.6 Leading Market Segments
- 3.7 Fastest-Growing Market Opportunities
- 3.8 Regional Performance Highlights
- 3.9 Technology and Industry Transformation
- 3.10 Competitive Landscape Summary
- 3.11 Analyst View and Strategic Implications
Chapter 4 Australia Cold Storage Market Trends and Developments
- 4.1 Historical Industry Development, 2018-2025
- 4.2 Recent Market Trends and Developments
- 4.3 Demand and Customer Behavior Trends
- 4.4 Technology and Product Innovation
- 4.5 Artificial Intelligence, Automation and Digitalization
- 4.6 Local Manufacturing and Supply Chain Realignment
- 4.7 Industry Partnerships, Mergers and Acquisitions
- 4.8 Sustainability and Circular Economy Developments
- 4.9 Government and Private Sector Investment Trends
- 4.10 Emerging Business Models and Commercialization
- 4.11 Industry Developments and Announcements
Chapter 5 Australia Cold Storage Market Production, Supply and Demand Analysis
- 5.1 Demand Trend and Consumption Analysis, 2018-2025
- 5.2 Demand Forecast, 2025-2035
- 5.3 Production and Output Trend, 2018-2025
- 5.4 Production and Output Forecast, 2025-2035
- 5.5 Installed Capacity and Capacity Utilization
- 5.6 Company-Wise Production Plants and Statistics
- 5.6.1 Installed Production Capacity
- 5.6.2 Actual Production
- 5.6.3 Planned Capacity and Expansion Targets
- 5.7 Supply Chain Structure and Procurement Trends
- 5.8 Supply-Demand Gap and Bottlenecks
- 5.9 Import Dependence and Sourcing Structure
- 5.10 Contract Manufacturing and Outsourcing
- 5.11 Regional Supply and Demand Concentration
Chapter 6 Australia Cold Storage Market Pricing Analysis
- 6.1 Pricing Structure and Measurement
- 6.2 Historical Pricing Trends, 2018-2025
- 6.3 Pricing Outlook, 2025-2035
- 6.4 Average Selling Price and Unit Economics
- 6.5 Pricing by Product and Market Segment
- 6.6 Geographic Pricing Differences
- 6.7 Key Input, Energy, Labor and Logistics Costs
- 6.8 Contract Pricing and Purchasing Models
- 6.9 Pricing Sensitivity and Competitive Positioning
- 6.10 Price, Margin and Profitability Implications
Chapter 7 Australia Cold Storage Market Dynamics
- 7.1 Market Growth Drivers
- 7.1.1 Demand-Side Drivers
- 7.1.2 Technology and Innovation Drivers
- 7.1.3 Infrastructure and Investment Drivers
- 7.1.4 Regulatory and Policy Drivers
- 7.2 Market Restraints
- 7.2.1 Cost and Affordability Constraints
- 7.2.2 Technology and Adoption Barriers
- 7.2.3 Supply Chain and Operational Constraints
- 7.3 Market Challenges
- 7.3.1 Competitive Pressure and Margin Erosion
- 7.3.2 Skills, Infrastructure and Implementation Gaps
- 7.4 Emerging Market Opportunities
- 7.5 Market Dynamics Impact and Time-Horizon Assessment
Chapter 8 Australia Cold Storage Value Chain Analysis
- 8.1 Industry Value Chain Overview
- 8.2 Upstream Suppliers and Critical Inputs
- 8.3 Technology and Component Providers
- 8.4 Manufacturing or Service Delivery
- 8.5 Distribution, Channel Partners and Integrators
- 8.6 Downstream Applications and End Users
- 8.7 Value Addition and Profit Pools
- 8.8 Vertical Integration and Outsourcing
- 8.9 Supplier Concentration and Risk
- 8.10 Supply Chain Localization and Resilience
Chapter 9 Australia Cold Storage Market Regulations and Policies
- 9.1 Relevant Laws, Standards and Compliance Frameworks
- 9.2 Product, Service, Safety and Quality Requirements
- 9.3 Government Policies, Incentives and Subsidies
- 9.4 Imports, Exports and Trade Barriers
- 9.5 Public Procurement and Local Content Requirements
- 9.6 Environmental and Sustainability Compliance
- 9.7 Upcoming Policy Changes and Market Implications
Chapter 10 Australia Cold Storage Market Hotspots and Opportunities
- 10.1 Market Opportunity Mapping and Growth Hotspots
- 10.2 High-Growth Applications and Customer Groups
- 10.3 Underserved Markets and White-Space Opportunities
- 10.4 Emerging Technology and Product Opportunities
- 10.5 New Capacity and Investment Hotspots
- 10.6 Market Entry and Expansion Opportunities
- 10.7 Distribution and Partnership Opportunities
- 10.8 Near-Term and Long-Term Commercial Potential
- 10.9 Opportunity Attractiveness and Execution Risks
Chapter 11 Australia Cold Storage Market Outlook, 2025-2035
- 11.1 Market Size and Analysis
- 11.1.1 Revenue (Market Measurement: 2025: USD 1.75 billion → 2035: USD 3.38 billion)
- 11.1.2 Market Volume and Quantity Sold
- 11.1.3 Historical Market Size, 2018-2025
- 11.1.4 Base-Year Market Size, 2025
- 11.2 Market Forecast, 2025-2035
- 11.2.1 Revenue Forecast to 2035
- 11.2.2 Volume Forecast to 2035
- 11.2.3 CAGR and Year-on-Year Growth
- 11.2.4 Incremental Revenue Opportunity
- 11.3 Forecast Assumptions and Scenario Analysis
- 11.3.1 Base-Case Forecast
- 11.3.2 Optimistic and Conservative Scenarios
- 11.3.3 Technology, Pricing and Policy Sensitivities
- 11.4 Market Attractiveness and Growth Outlook
Chapter 12 Australia Cold Storage Market Segmentation and Outlook
- 12.1 Segmentation Summary and Market Shares, 2025
- 12.2 Largest and Fastest-Growing Segments
- 12.3 By Service Type - Market Size and Forecast, 2025-2035
- 12.3.1 Segment Definition and Scope
- 12.3.2 Historical Market Size, 2018-2025
- 12.3.3 Revenue Forecast, 2025-2035
- 12.3.4 Volume Forecast, 2025-2035
- 12.3.5 Base-Year Market Share, 2025
- 12.3.6 Segment CAGR and Growth Drivers
- 12.3.7 Subsegment Market Size and Forecast
- 12.3.7.1 Storage Services
- 12.3.7.2 Handling Services
- 12.3.7.3 Blast-Freezing Services
- 12.3.7.4 Value-Added Facility Services
- 12.3.8 Subsegment Pricing and Adoption Trends
- 12.3.9 Leading Suppliers and Competition
- 12.3.10 Regional Demand and Opportunities
- 12.4 By End-Use Industry - Market Size and Forecast, 2025-2035
- 12.4.1 Segment Definition and Scope
- 12.4.2 Historical Market Size, 2018-2025
- 12.4.3 Revenue Forecast, 2025-2035
- 12.4.4 Volume Forecast, 2025-2035
- 12.4.5 Base-Year Market Share, 2025
- 12.4.6 Segment CAGR and Growth Drivers
- 12.4.7 Subsegment Market Size and Forecast
- 12.4.7.1 Food and Beverage
- 12.4.7.2 Pharmaceutical and Healthcare
- 12.4.7.3 Specialty Non-Food Products
- 12.4.8 Subsegment Pricing and Adoption Trends
- 12.4.9 Leading Suppliers and Competition
- 12.4.10 Regional Demand and Opportunities
- 12.5 By Delivery Model - Market Size and Forecast, 2025-2035
- 12.5.1 Segment Definition and Scope
- 12.5.2 Historical Market Size, 2018-2025
- 12.5.3 Revenue Forecast, 2025-2035
- 12.5.4 Volume Forecast, 2025-2035
- 12.5.5 Base-Year Market Share, 2025
- 12.5.6 Segment CAGR and Growth Drivers
- 12.5.7 Subsegment Market Size and Forecast
- 12.5.7.1 Shared-User Warehousing
- 12.5.7.2 Dedicated Warehousing
- 12.5.7.3 Managed On-Site Warehousing
- 12.5.8 Subsegment Pricing and Adoption Trends
- 12.5.9 Leading Suppliers and Competition
- 12.5.10 Regional Demand and Opportunities
- 12.6 By Customer Type - Market Size and Forecast, 2025-2035
- 12.6.1 Segment Definition and Scope
- 12.6.2 Historical Market Size, 2018-2025
- 12.6.3 Revenue Forecast, 2025-2035
- 12.6.4 Volume Forecast, 2025-2035
- 12.6.5 Base-Year Market Share, 2025
- 12.6.6 Segment CAGR and Growth Drivers
- 12.6.7 Subsegment Market Size and Forecast
- 12.6.7.1 Product Owners
- 12.6.7.2 Retail Buyers
- 12.6.7.3 Trade Intermediaries
- 12.6.7.4 Logistics Contractors
- 12.6.8 Subsegment Pricing and Adoption Trends
- 12.6.9 Leading Suppliers and Competition
- 12.6.10 Regional Demand and Opportunities
- 12.7 Segment Growth Comparison
- 12.8 Segment Attractiveness and Priority Matrix
Chapter 13 Australia Cold Storage End-Use and Application Market Outlook
- 13.1 End-Use Industry and Customer Demand Structure
- 13.2 Leading Applications and Customer Groups
- 13.3 End-Use Market Size, Share and Forecast
- 13.4 Major End-Use Industry Deep Dives
- 13.4.1 Customer Requirements and Use Cases
- 13.4.2 Demand and Replacement Cycles
- 13.4.3 Technical and Regulatory Considerations
- 13.4.4 Purchasing and Procurement Models
- 13.4.5 Leading Vendors and Distribution Channels
- 13.4.6 Forecast and Commercial Opportunities
- 13.5 Emerging Applications and Cross-Segment Demand
- 13.6 End-Use Industry Investment Priorities
Chapter 14 Australia Cold Storage Geographic Market Outlook, 2025-2035
- 14.1 Domestic Market Distribution and Demand Clusters
- 14.2 State- or Province-Wise Market Size and Forecast, 2025-2035
- 14.3 City and Metropolitan Market Outlook
- 14.4 Industrial, Manufacturing and Commercial Clusters
- 14.5 Geographic Concentration of Key End Users
- 14.6 Local Pricing and Purchasing Differences
- 14.7 Domestic Production Facilities and Capacity Map
- 14.8 Local Infrastructure and Project Pipeline
- 14.9 State-Level Policy and Incentive Differences
- 14.10 Subnational Investment Hotspots and Opportunities
- 14.11 Distribution and Logistics Networks
- 14.12 Domestic Competitive Footprint
Chapter 15 Australia Cold Storage Technology, Innovation and Sustainability Outlook
- 15.1 Technology Landscape and Maturity
- 15.2 Product, Process and Service Innovation
- 15.3 AI, Automation and Digital Tools in the Industry
- 15.4 Technology Adoption and Performance Benchmarking
- 15.5 Innovation Pipeline and R&D Investment
- 15.6 Patent and Intellectual Property Trends
- 15.7 Energy Efficiency and Resource Management
- 15.8 Sustainability, Recycling and Circularity
- 15.9 Technology Roadmap, 2025-2035
- 15.10 Risks of Obsolescence and Technology Substitution
Chapter 16 Australia Cold Storage Market Key Strategic Imperatives
- 16.1 Growth and Market Entry Priorities
- 16.2 High-Return Products and Segments
- 16.3 Pricing, Profitability and Cost Optimization
- 16.4 Technology Investment and Product Differentiation
- 16.5 Supply Chain Localization and Resilience
- 16.6 Distribution and Customer Acquisition
- 16.7 Partnership, Acquisition and Capacity Strategy
- 16.8 Regional Expansion Priorities
- 16.9 Short-, Medium- and Long-Term Actions
Chapter 17 Competition Outlook
- 17.1 Industry Competition Characteristics
- 17.2 Market Structure and Concentration
- 17.3 Market Share and Competitive Positioning, 2025
- 17.4 Company-Wise Revenue and Product Benchmarking
- 17.5 Production and Service Capacity Benchmarking
- 17.6 Technology, Pricing and Differentiation
- 17.7 Regional Footprint and Distribution Strength
- 17.8 Mergers, Acquisitions and Strategic Alliances
- 17.9 New Entrants and Competitive Threats
- 17.10 Porter's Five Forces and Industry Attractiveness
- 17.11 Competitive Outlook, 2025-2035
Chapter 18 Company Profiles
- 18.1 Company Coverage and Selection Criteria
- 18.2 Lineage
- 18.2.1 Business Description
- 18.2.2 Company Ownership and Geographic Presence
- 18.2.3 Product and Service Portfolio
- 18.2.4 Manufacturing and Operating Footprint
- 18.2.5 Production Capacity and Expansion Plans
- 18.2.6 Financial Performance and Investment
- 18.2.7 Market Share and Competitive Position
- 18.2.8 Technology and Innovation Capabilities
- 18.2.9 Strategic Alliances or Partnerships
- 18.2.10 Recent Developments
- 18.2.11 Growth Strategy and Outlook
- 18.3 NewCold
- 18.4 Americold
- 18.5 Minus 1
- 18.6 Laverton Cold Storage
- 18.7 Austco Polar Cold Storage
- 18.8 Evercold Cold Storage
- 18.9 Melbourne Cold Storage
- 18.10 Subzero Cold Stores
- 18.11 Cold Xpress
- 18.12 Other Relevant Market Participants
Note: Every listed company is profiled on the structure shown under the first company. The company list is preliminary and may change based on research findings, market developments, data availability and client requirements.
Chapter 19 Disclaimer
- 19.1 Research and Forecast Disclaimer
- 19.2 Data Source and Estimation Limitations
Note: The depth of individual sections depends on data availability for this market. Volume, capacity, trade and other unit-based metrics are included where applicable.

