
Grain trucks, open skies and parcels shape mobility
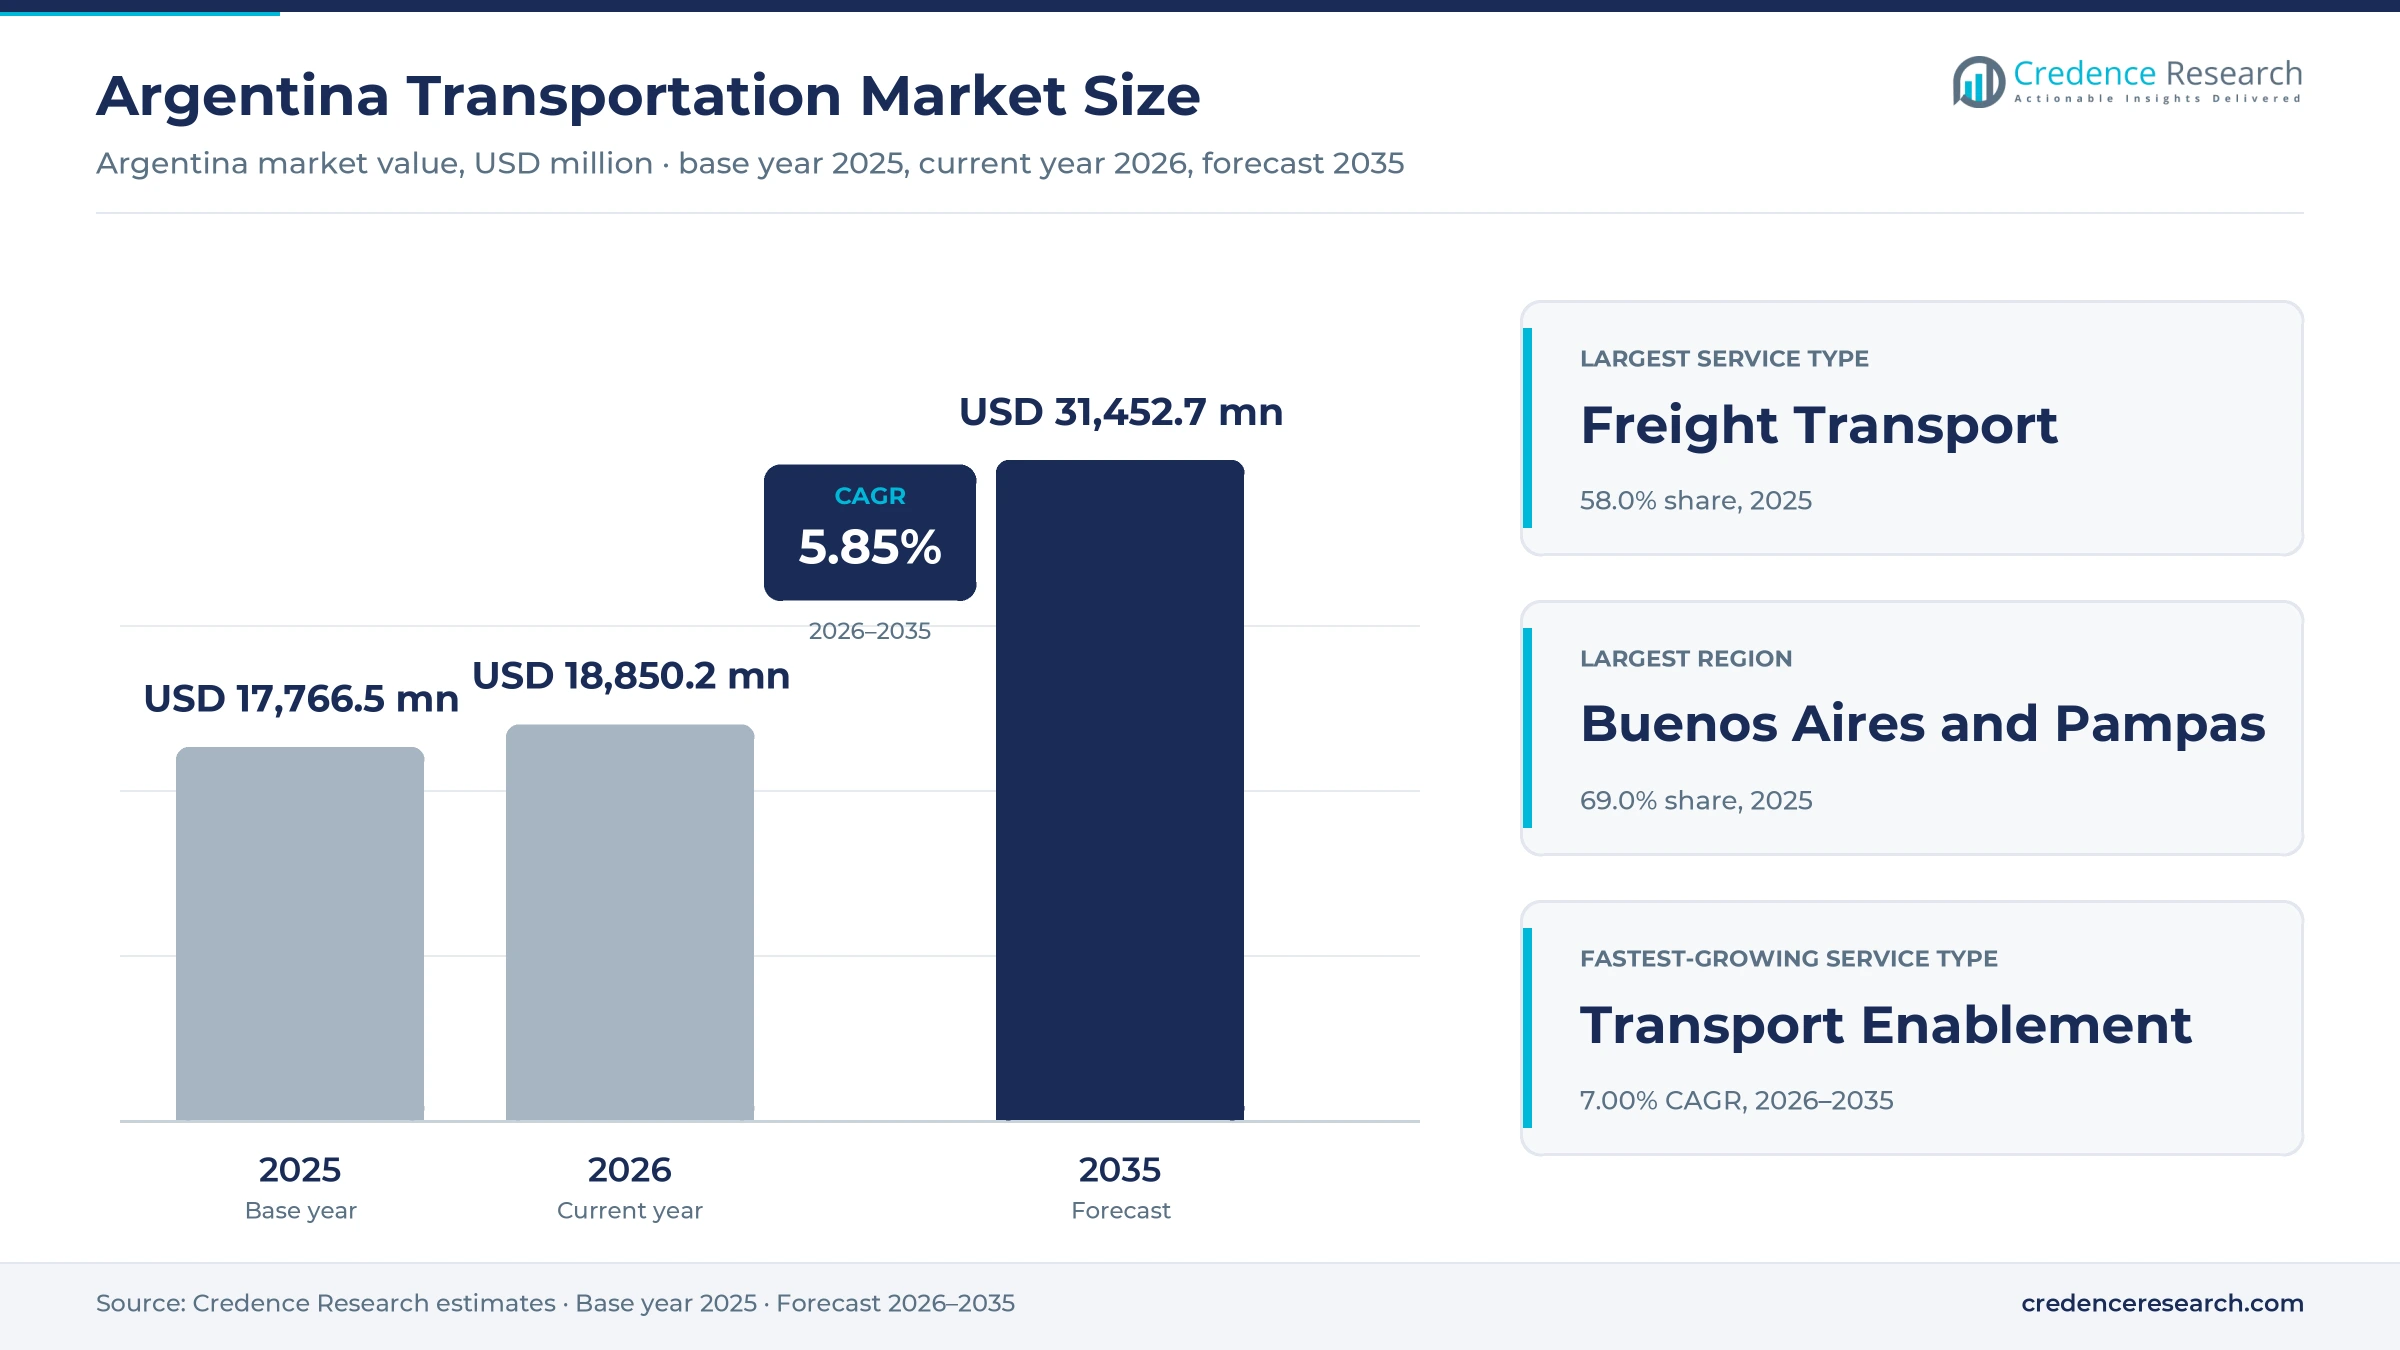
The Argentina transportation market was valued at USD 17.77 billion in 2025 and is projected to increase from USD 18.85 billion in 2026 to USD 31.45 billion by 2035, registering a CAGR of 5.85% during 2026–2035. Demand comes from grain exporters that move harvests to the Paraná River terminals, from households that ride buses, trains and the Buenos Aires subway every day, and from travelers on a domestic air network opened to new carriers. Buenos Aires and Pampas held the largest regional share, 69.0% in 2025, because the region holds most of the population, the export ports and the main parcel hubs. Patagonia is the fastest-growing region at 6.75% a year, as energy activity in Neuquén lifts heavy freight and air travel. In turn, the policy landscape is changing quickly, because the national government is resetting freight rail concessions and has opened air and long-distance bus services to new operators.
What does the national estimate include and leave out?
The estimate measures spending on freight and passenger services in Argentina. It counts road, rail, air and river freight carried for shippers, parcel and courier deliveries, urban and long-distance bus services, commuter rail and subway fares, and domestic and international flights sold in the country, plus enabling services such as terminal handling, fleet contracting and ticketing.
The estimate excludes vehicle and aircraft sales, fuel sold to private motorists and the construction of roads, tracks and ports. The value chain runs from infrastructure holders and concessionaires through carriers, parcel networks and booking channels to the households, companies and public authorities that buy each trip or shipment.
Argentina Transportation Market Insights
- The Argentina transportation market was valued at USD 17.77 billion in 2025 and is projected to reach USD 31.45 billion by 2035, registering a CAGR of 5.85% during 2026–2035.
- Buenos Aires and Pampas held a 69.0% share of 2025 value, because the region concentrates population, the Gran Rosario ports and the main parcel hubs.
- Freight Transport led service types with a 58.0% share of 2025 value, because grain, industrial cargo and parcels move mostly by truck over long distances.
- Argentine airports handled 50,646,921 passengers in 2025, a national record, after the government opened domestic and international routes to new carriers.
- A resolution published Aug. 20, 2026 opened bidding for 7,594 km of the Belgrano, San Martín and Urquiza freight lines under a 50-year concession.
Freight services lead while enablement services grow fastest
Why does freight carry the largest share of spending?
Based on service type, the market is categorized into Passenger Transport, Freight Transport and Transport Enablement. Freight Transport led with a 58.0% share of 2025 value, because grain, industrial cargo and parcels travel long distances by truck to ports and cities. Transport Enablement grows fastest at 7.00% a year, as automated hubs, ramp handling and booking platforms gain new private operators.
Which uses of mobility generate the most value?
Based on application, the market is categorized into Daily Mobility, Intercity Travel and Merchandise Distribution. Merchandise Distribution led with a 55.0% share of 2025 value, because harvest flows, retail restocking and online orders keep trucks moving all year. Intercity Travel grows fastest at 6.74% a year, as new low-cost routes and deregulated long-distance buses widen travel options.
Who pays for most freight and passenger services?
Based on customer type, the market is categorized into Households, Enterprise Buyers and Public Authorities. Enterprise Buyers led with a 57.0% share of 2025 value, because grain traders, retailers and manufacturers buy most truck, rail and barge capacity under term contracts. Enterprise Buyers also grow fastest at 5.93% a year, as exporters, parcel shippers and energy operators contract more freight capacity for harvest peaks, online orders and shale field supply.
How do operators earn revenue from each trip or load?
Based on revenue model, the market is categorized into Transaction-Based Revenue, Contract-Based Revenue and Concession-Based Revenue. Transaction-Based Revenue led with a 52.0% share of 2025 value, because tickets, fares and parcel shipments are paid one at a time. Transaction-Based Revenue grows fastest at 6.10% a year, as airlines and parcel carriers sell more trips and shipments through digital channels.
| Segment Group | Leading Sub-segment | Share, 2025 | Fastest-growing Sub-segment | CAGR, 2026–2035 |
|---|---|---|---|---|
| By Service Type | Freight Transport | 58.0% | Transport Enablement | 7.00% |
| By Application | Merchandise Distribution | 55.0% | Intercity Travel | 6.74% |
| By Customer Type | Enterprise Buyers | 57.0% | Enterprise Buyers | 5.93% |
| By Revenue Model | Transaction-Based Revenue | 52.0% | Transaction-Based Revenue | 6.10% |
Request a Free Sample
Fill in your details and we'll send you a free sample report.
- Sample data tables & charts
- Research methodology
Record flights, grain corridors and parcel hubs lift demand
How is open-skies aviation widening intercity travel?
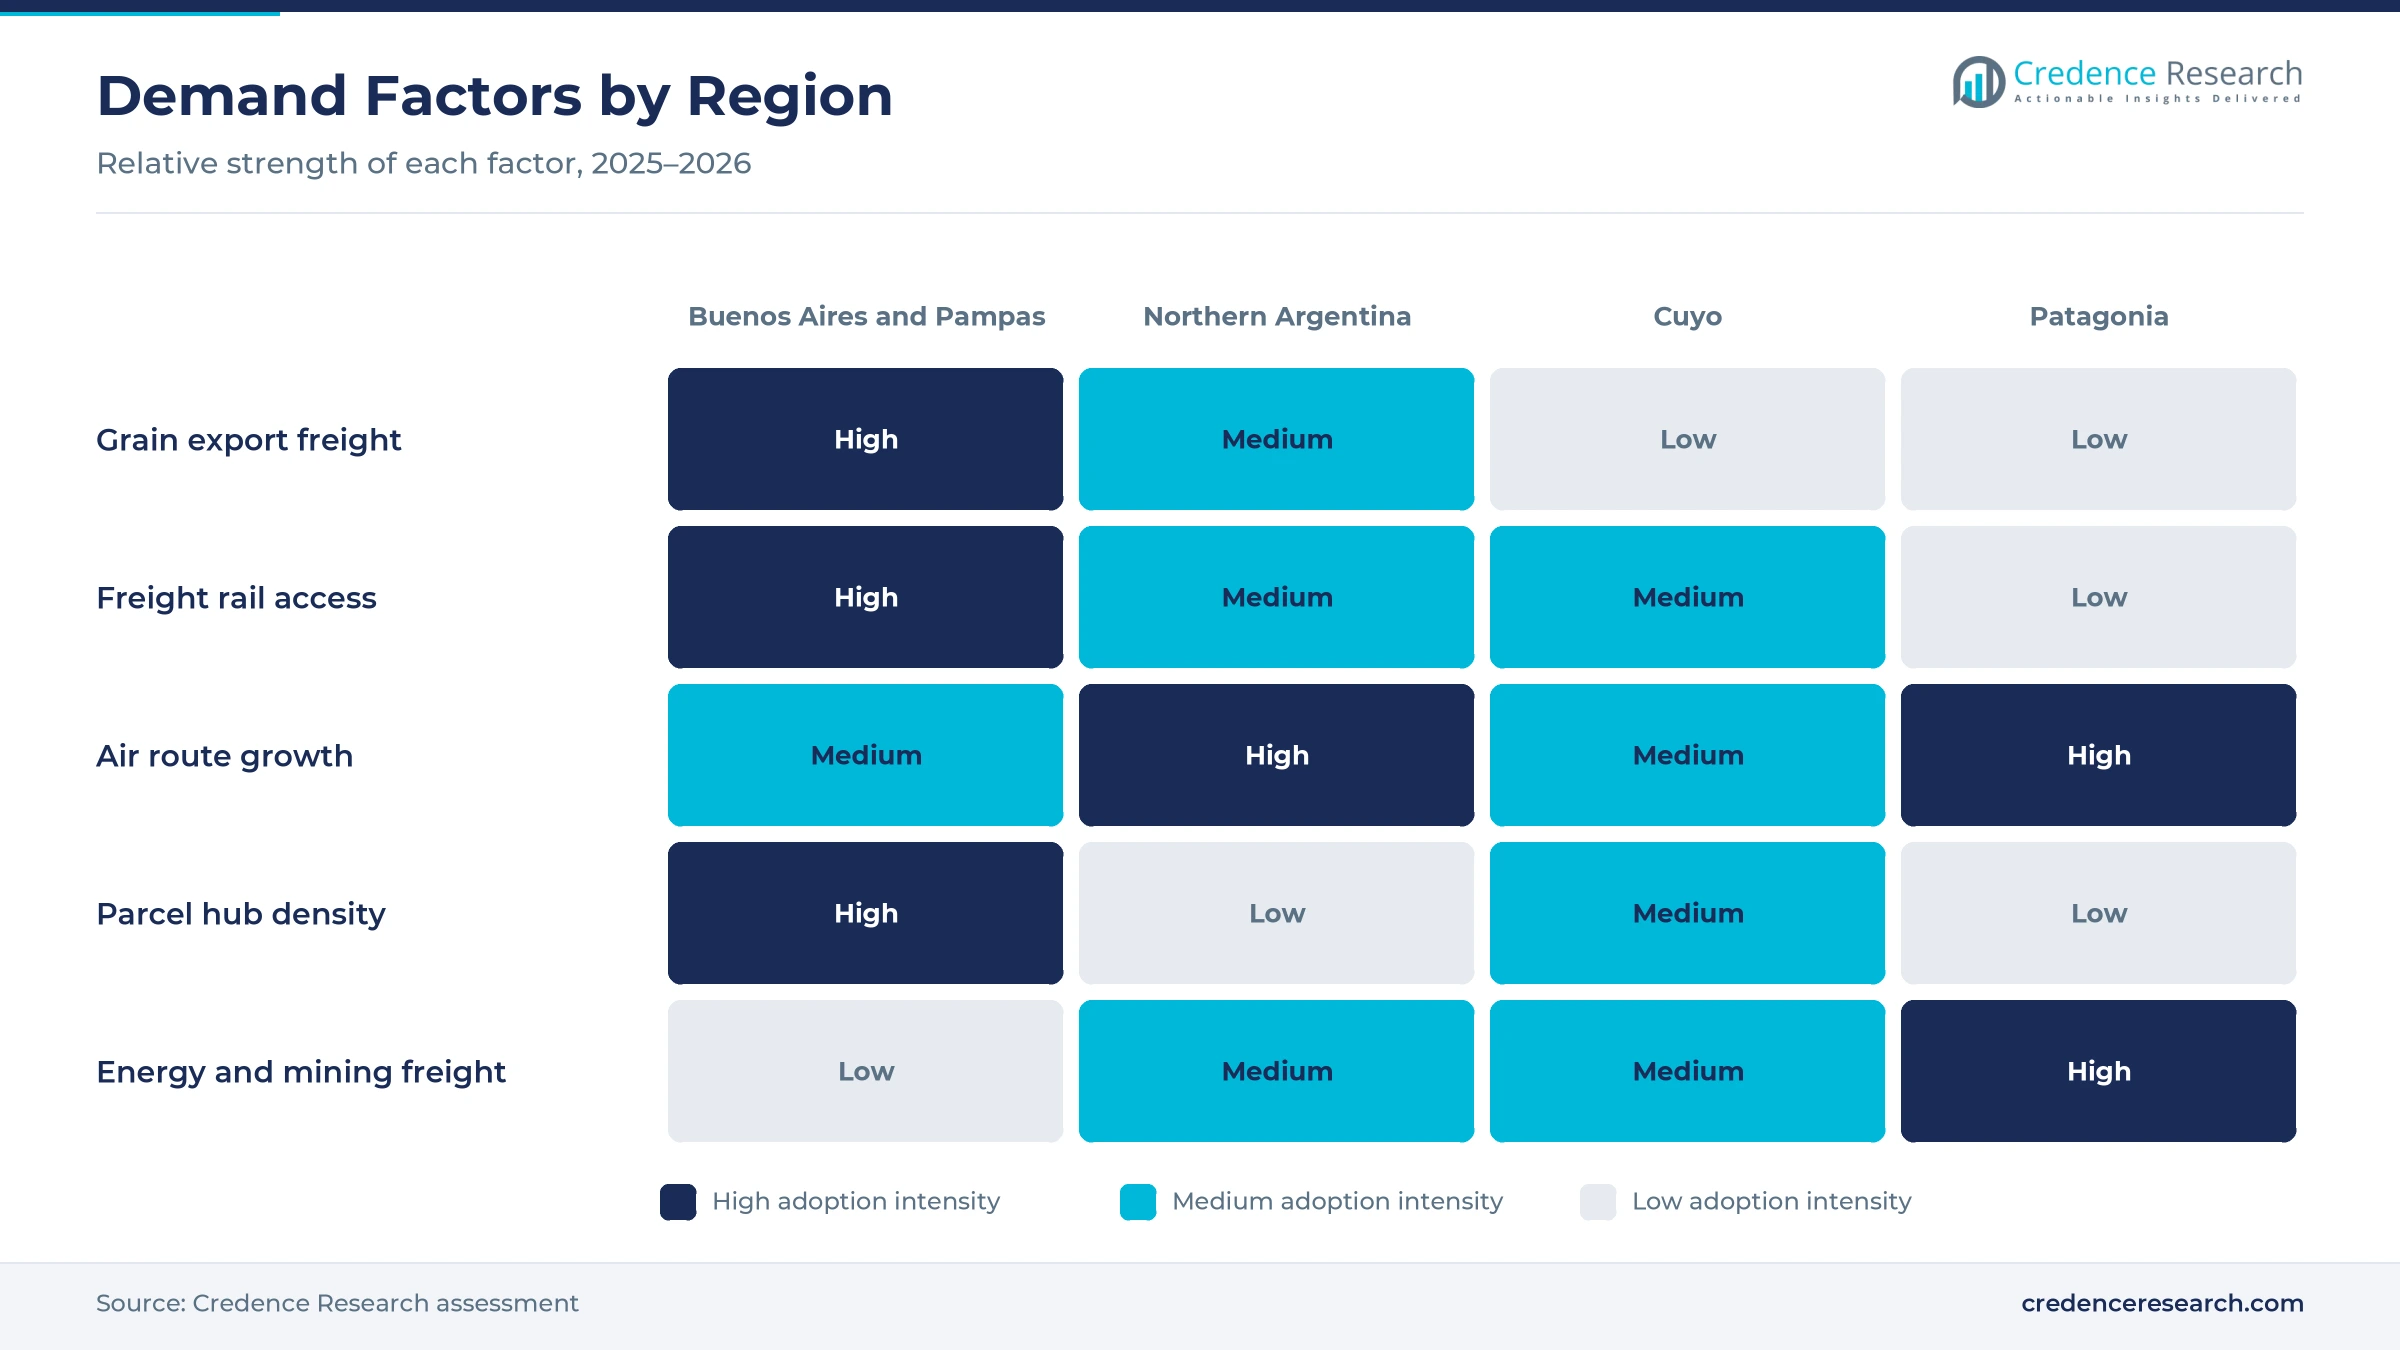
Air travel has become the main growth engine for long-distance trips, because new carriers can now enter routes with short approval procedures. Decree 599/2024, reported by Ámbito on July 10, 2024, deregulated fares, opened ramp handling to more providers and set incentives for new routes. Argentine airports then handled 50,646,921 passengers in 2025, 12% more than in 2024, according to the national civil aviation administration. Aerolíneas Argentinas held 54% of domestic traffic at the end of 2025, while JetSMART reached 25% and Flybondi 19%, Ámbito reported. As a result, Intercity Travel grows fastest among applications at 6.74% a year during 2026–2035.
Why do grain export corridors anchor freight demand?
Grain exports create the heaviest freight flows in the country, because harvests must travel hundreds of kilometers from farms to river terminals. Just under 1 million grain trucks entered Gran Rosario in the first half of 2025, up 8% from a year earlier, according to the Rosario Board of Trade. Trains moved more than 3.4 million metric tons of grain toward the same ports, while about 3.79 million metric tons arrived on more than 2,500 barges. About 80% of national exports move along the Paraná waterway that serves these terminals, El Economista reported on June 19, 2026. Because trucks carry most of these loads, Freight Transport held 58.0% of 2025 value.
How does parcel network digitization lift delivery volumes?
Online retail has turned parcel networks into a fast-growing freight channel, because buyers expect deliveries within a day or two. The Argentine e-commerce chamber CACE counted 253 million purchase orders and 645 million units sold in 2025, and 37% of deliveries arrived in under 24 hours. Andreani invested USD 30 million to automate its General Pacheco hub, which now sorts 26,000 packages an hour, iProfesional reported on April 29, 2026. In December 2025, COC Global Enterprise became the majority shareholder of OCA, which runs 760 service points and more than 3,500 vehicles. These upgrades lift demand for courier, express and parcel services nationwide.
Why do economic recovery and energy activity add freight?
A return to economic growth is lifting cargo and business travel, because factories, mines and oil fields are moving more inputs again. Gross domestic product grew 4.4% in 2025 after a 1.3% fall in 2024, according to the World Bank. Andreani is buying 40 articulated bitrain trucks to serve mining and oil and gas operations in Patagonia, iProfesional reported in April 2026. Domestic traffic at Neuquén airport, the gateway to the Vaca Muerta shale area, rose 22% in 2025, according to the civil aviation administration. As a result, Patagonian freight lanes add heavy truck and air demand faster than the national average.
Rail concession resets and digital fares reshape operations
Why is freight rail shifting to open-access concessions?
The national government is rewriting freight rail contracts so that third-party trains can share the main grain lines. Decree 478/2025, published July 18, 2025, let the transport secretariat adjust concessions and consider extensions of up to 10 years. Resolution 39/2025 then extended the Nuevo Central Argentino concession on the Mitre network to December 2032, and it required an open-access plan for other operators, iProfesional reported. Ferroexpreso Pampeano received a revocable extension to April 30, 2027, while only 2,339 km of its 5,119 km network remain active. As a result, concession-based revenue is being reset as freight contracts move to open-access terms.
How are digital fares and passenger data on the rise?
Urban and intercity operators are moving fare payment and passenger records onto digital systems, which cuts cash handling and speeds inspections. The Buenos Aires subway carried 193,053,591 paid passengers in 2025, and Emova added QR payment, its own app and 80 self-service terminals. Decree 883/2024, reported by Chequeado on Oct. 7, 2024, replaced bus route concessions with a public registry that lets carriers start operating within 5 working days. In December 2025, the CNRT created a single web platform for passenger lists, which carriers file before departure. In turn, daily mobility operators gain faster boarding, lower cash handling and better ridership data.
Is Belgrano Cargas privatization an opening for investors?
The sale of the state freight railway creates the largest rail investment opening in decades for operators and grain shippers. Resolution 1350/2026, published Aug. 20, 2026, opened a tender for 7,594 km of track in 16 provinces across the Belgrano, San Martín and Urquiza lines, Perfil reported. Winners receive a 50-year concession with open access, mandatory investment plans and an option to buy the existing rolling stock. Bidders that invest at least USD 200 million in track renewal can seek the RIGI investment incentive regime, and offers open on Nov. 11, 2026. In turn, 6.15% annual growth in Northern Argentina reflects better rail access to the ports.
Is the interior the next opening for international carriers?
Provincial airports now give airlines room to grow outside the crowded Buenos Aires gateways, as more travelers skip the capital on trips abroad. In 2025, 2,156,442 passengers flew abroad from the interior without passing through Buenos Aires, 38% more than in 2024, according to the civil aviation administration. Authorities approved 63 new domestic and international connections that year, and international traffic at Salta grew 61% while Córdoba grew 54%. JetSMART scheduled a daily Aeroparque to San Salvador de Jujuy route from Oct. 1, 2026, which takes its domestic network to 15 destinations. As a result, provincial airports should keep growth in domestic aviation ahead of the national average.
Road dependence and short concession terms test operators
How does heavy road dependence raise freight costs?
Trucks carry most grain and consumer cargo, which leaves shippers exposed to fuel prices, road damage and harvest peaks. Rail moved more than 3.4 million metric tons of grain toward Gran Rosario in the first half of 2025, down 8% from a year earlier, while truck arrivals rose. As a result, port access roads become congested during harvest months. Shippers respond by booking rail and barge capacity earlier and by asking concessionaires to invest in port access tracks.
Why do short concession extensions slow rail investment?
Several freight rail operators work under temporary extensions, which makes long-term track and wagon investment hard to justify. Ferroexpreso Pampeano received its fifth extension in May 2026, and it can be revoked at any time without compensation. Ferrosur Roca operates under a one-year extension granted in September 2025 while a new contract scheme is designed. In turn, operators defer purchases until the new contracts and the Belgrano Cargas award set clearer terms.
Why has subway ridership not returned to earlier levels?
Urban rail ridership remains below its pre-pandemic peak, which limits fare revenue for operators and the city. The Buenos Aires subway carried 326.4 million paying passengers in 2019, according to iProfesional, compared with about 193 million in 2025. As a result, public authorities must keep funding maintenance while fares rise toward cost. Operators respond with digital payment, extended late-night service for events and better service reliability to win back riders.
How do concentrated airports and waterway tolls add risk?
Traffic depends on a small number of gateways, which makes airlines and exporters vulnerable to congestion and fee changes. Aeroparque handled more than double the domestic traffic of the next airport in December 2025, while the Paraná waterway carries about 80% of national exports, El Economista reported. The new waterway concession sets a toll that starts at USD 3.80 per net registered ton and rises as dredging works advance. Shippers therefore plan for higher river costs over the concession term.
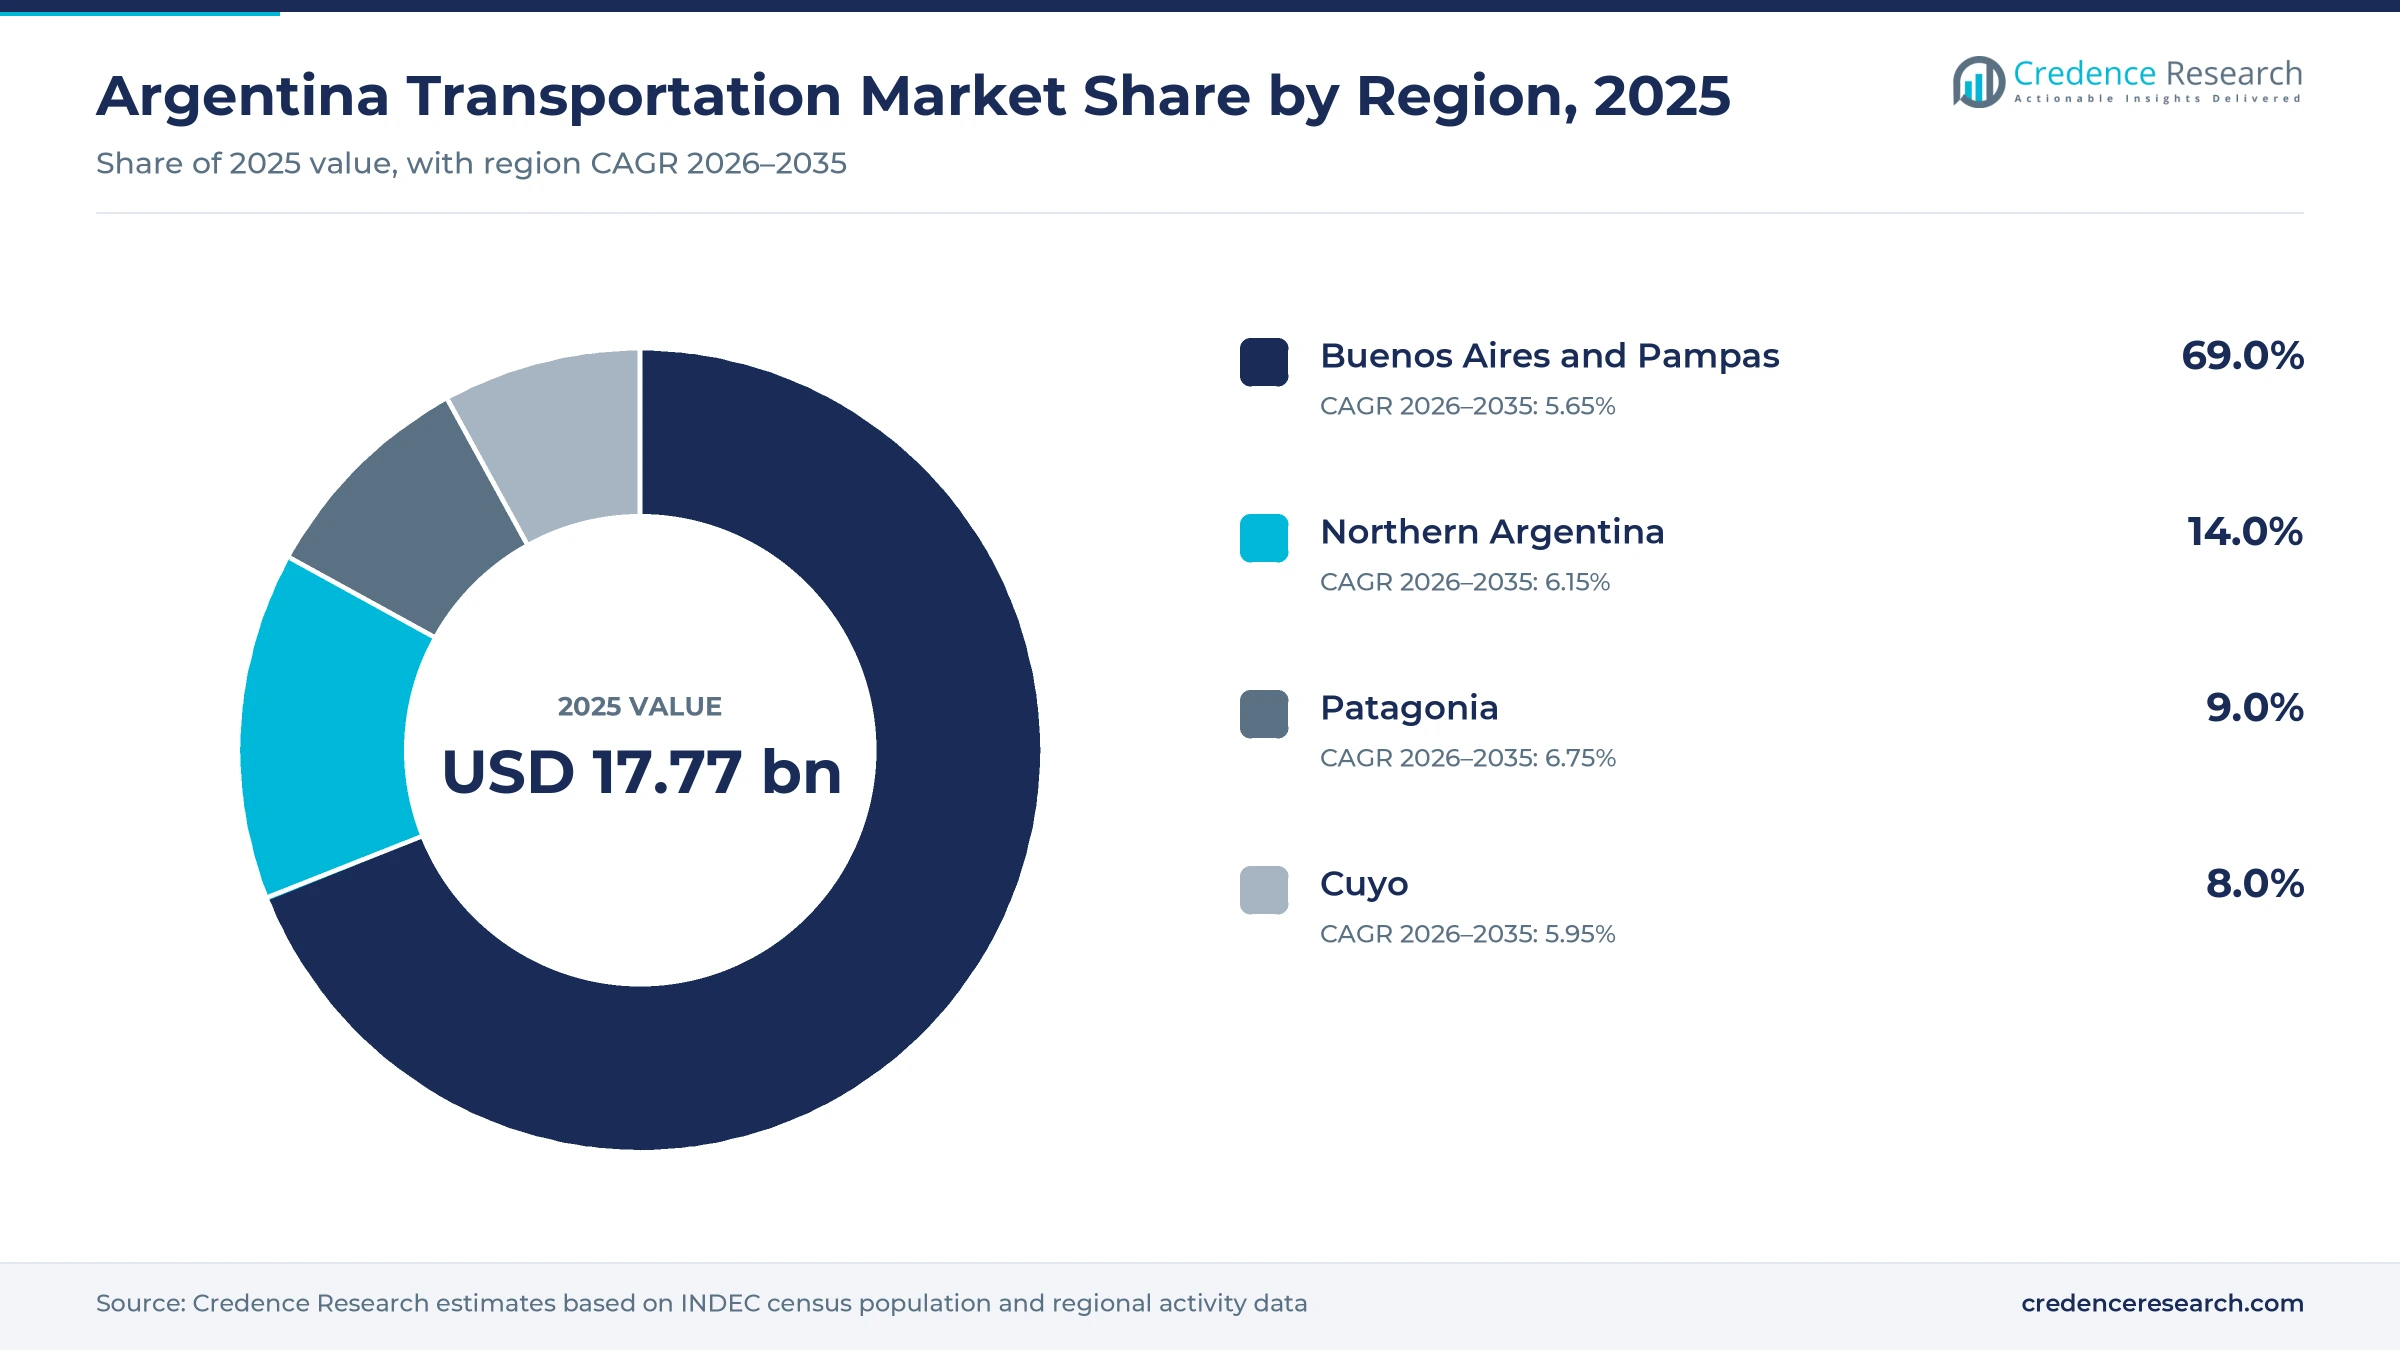
Buenos Aires and Pampas lead while Patagonia grows fastest
| Region | Value, 2025 (USD billion) | Share, 2025 | CAGR, 2026–2035 |
|---|---|---|---|
| Buenos Aires and Pampas | 12.26 | 69.0% | 5.65% |
| Northern Argentina | 2.49 | 14.0% | 6.15% |
| Patagonia | 1.60 | 9.0% | 6.75% |
| Cuyo | 1.42 | 8.0% | 5.95% |
Why does the core grain and port belt hold the largest share?
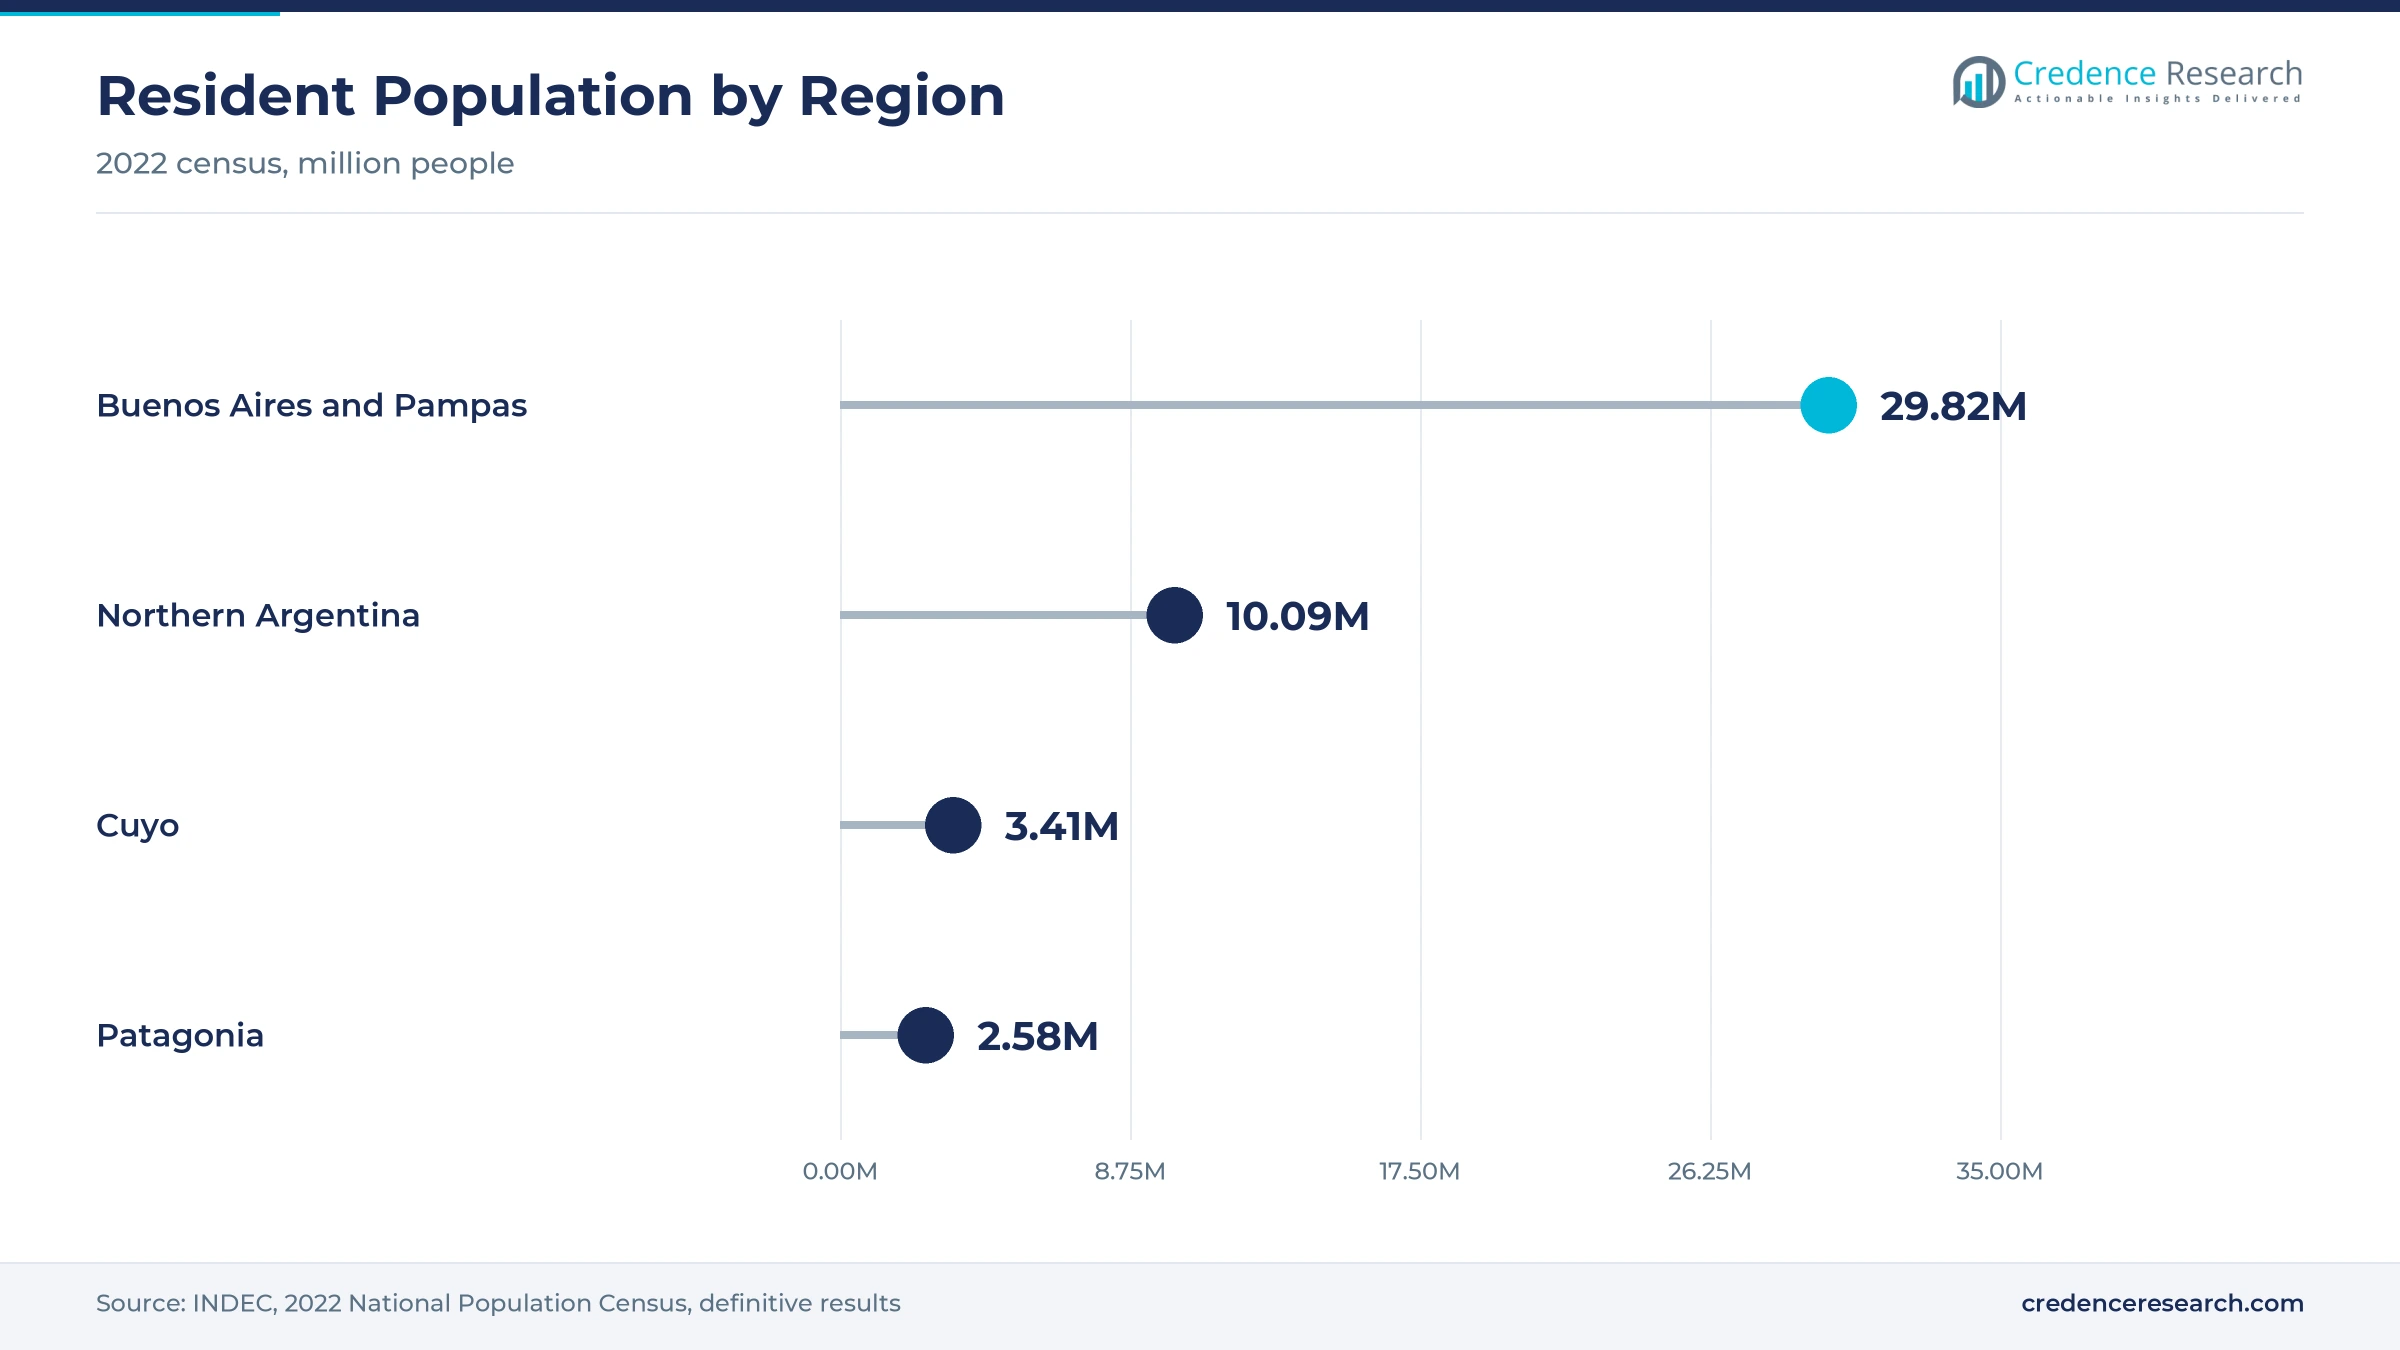
Buenos Aires and Pampas held 69.0% of 2025 value and grow at 5.65% a year, because the region holds the capital, the Gran Rosario terminals and the core grain belt. The region, which combines Buenos Aires, Córdoba, Santa Fe, Entre Ríos and La Pampa, had about 29.82 million residents in the 2022 census. Andreani runs its main automated parcel hub in General Pacheco, while subway and commuter rail serve daily trips. In turn, the region will keep the largest share even as other regions grow faster.
How does Northern Argentina gain from rail and new routes?
Northern Argentina held a 14.0% share of 2025 value and grows at 6.15% a year, as the Belgrano freight line and new air routes improve access. The ten northwest and northeast provinces had about 10.09 million residents in the 2022 census. International traffic at Salta grew 61% in 2025, and domestic traffic at Termas de Río Hondo rose 82%. As a result, rail privatization and route launches support faster growth in this region than in the core.
Why is Patagonia growing fastest in freight and travel?
Patagonia held a 9.0% share of 2025 value and grows fastest at 6.75% a year, because shale oil, mining and tourism need heavy trucks and long flights. The five southern provinces had about 2.58 million residents in the 2022 census, yet distances between towns are the longest in the country. Flybondi launched flights from Córdoba to Ushuaia and El Calafate in December 2025. In turn, Neuquén and the tourist gateways add freight and passenger demand faster than population alone suggests.
What shapes freight and travel demand in Cuyo?
Cuyo held 8.0% of 2025 value and grows at 5.95% a year, as wine, mining and cross-border trade with Chile move by road and air. Mendoza, San Juan and San Luis had about 3.41 million residents in the 2022 census. GOL began flying a Mendoza to Rio de Janeiro route in January 2026, and Mendoza gained a new route to Aruba that month. As a result, Cuyo adds international travel demand while freight stays tied to the Andean corridor to Chile.
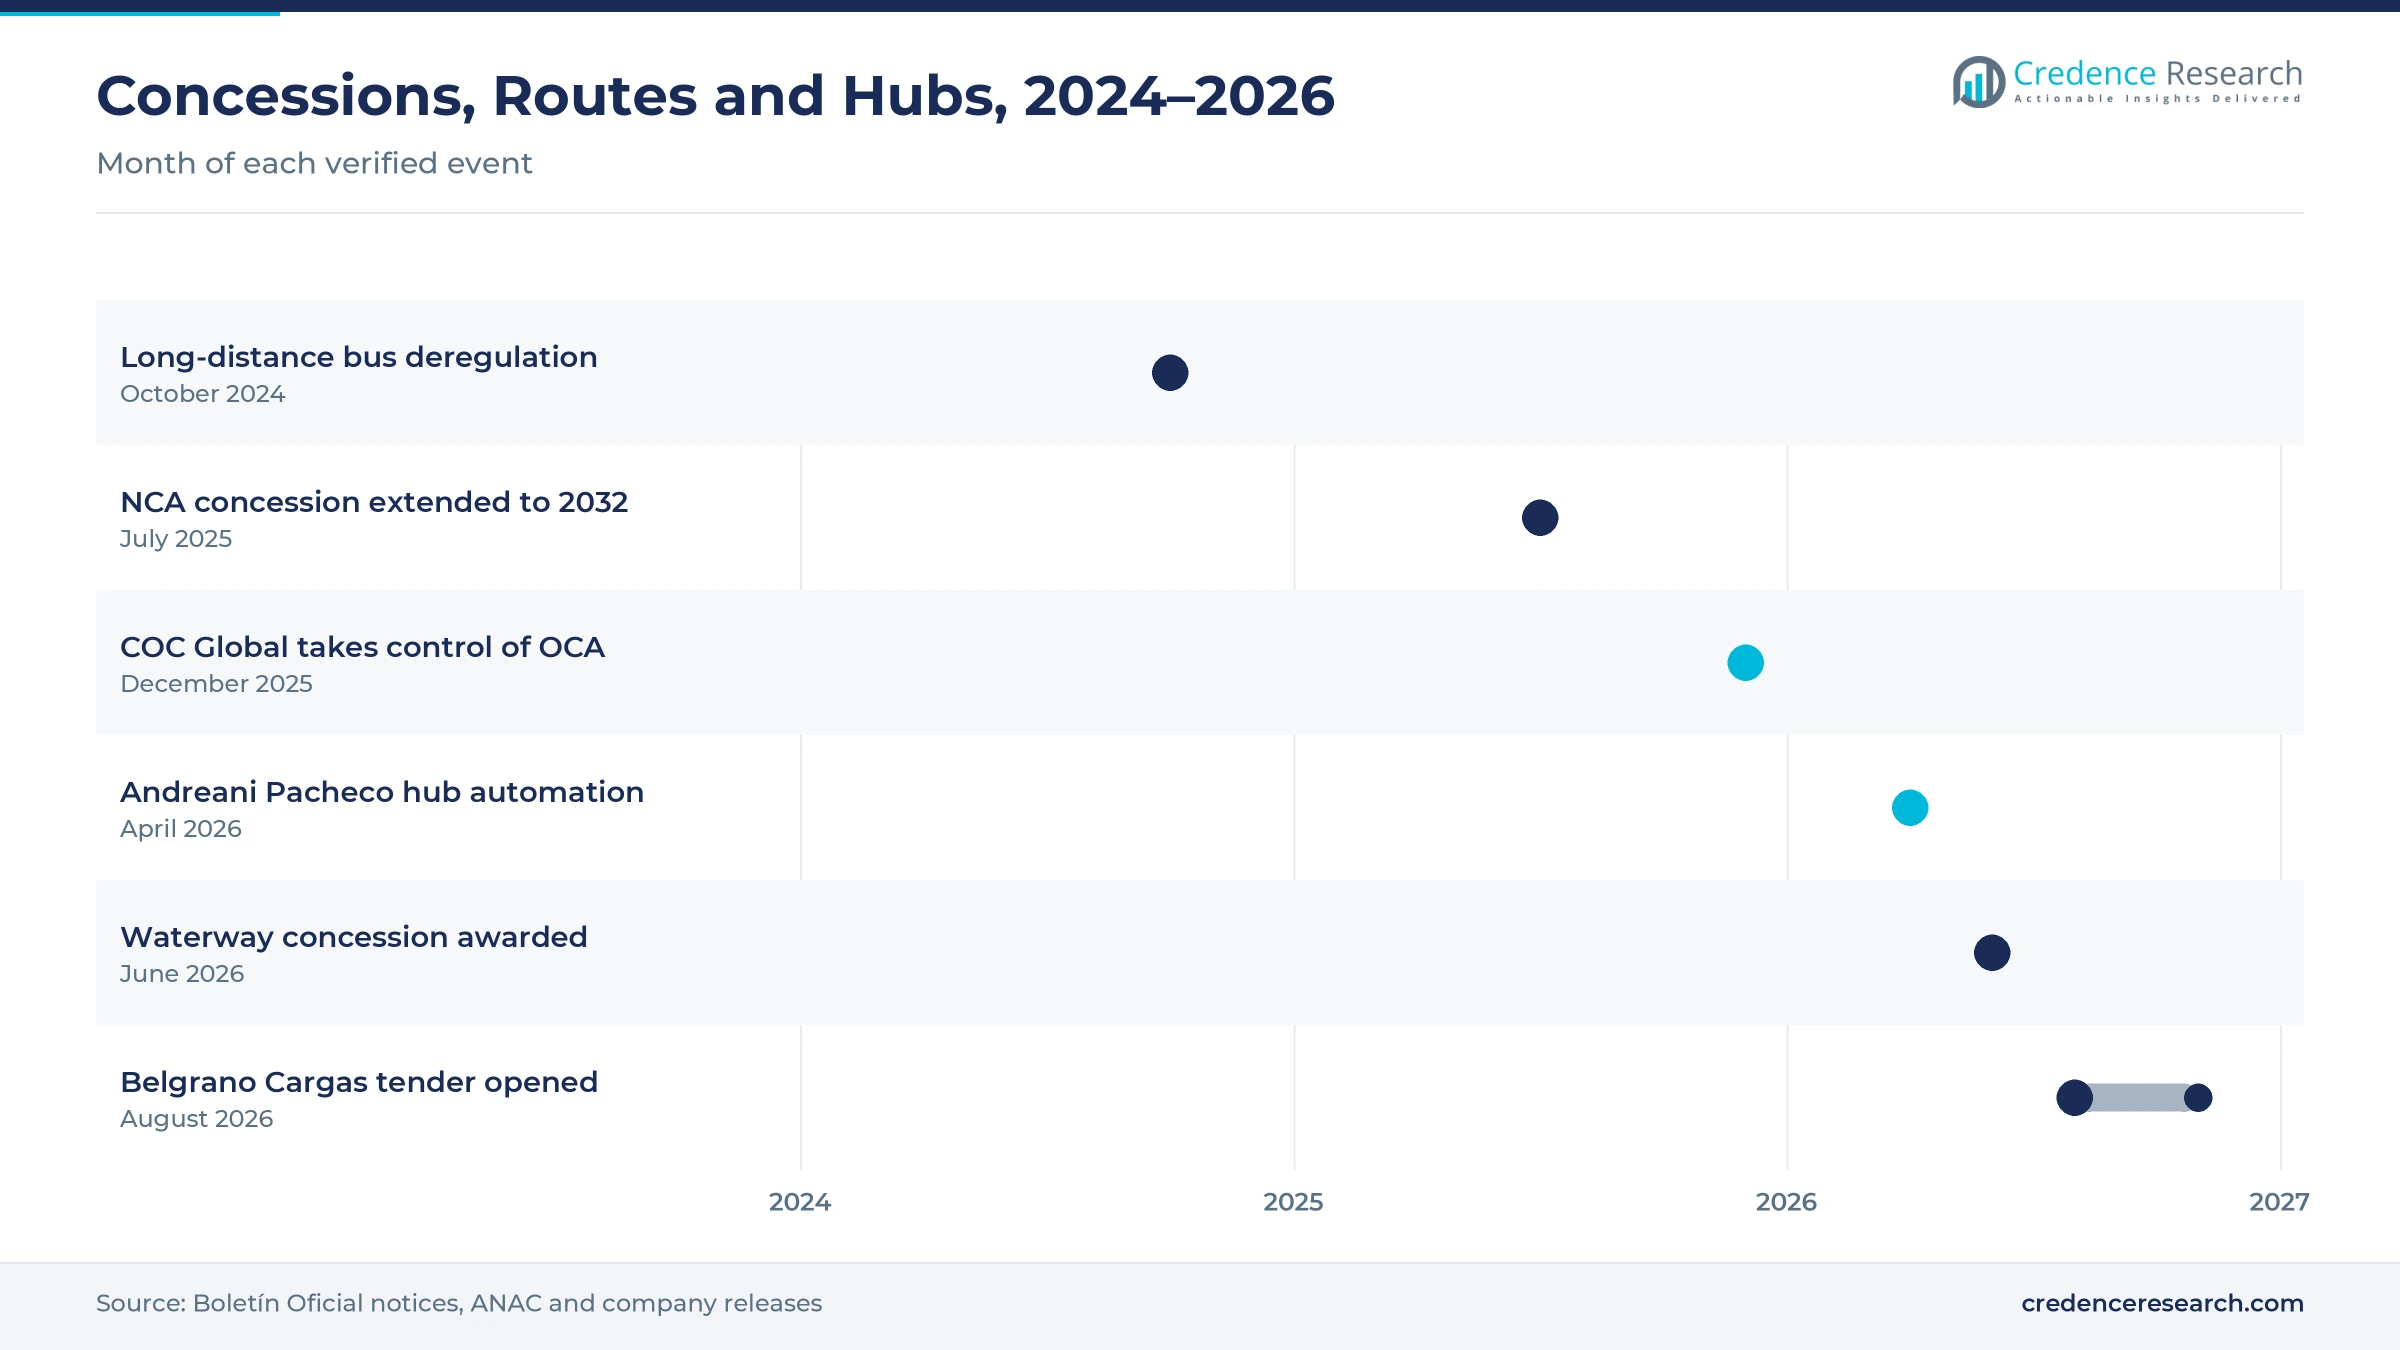
Concessions, airline routes and hub upgrades, 2024–2026
| Development | Status and market relevance |
|---|---|
| In October 2024, Decree 883/2024 replaced long-distance bus route concessions with a public registry and let carriers set fares, routes and schedules. | Opened intercity bus services to new operators |
| In July 2025, Resolution 39/2025 extended the Nuevo Central Argentino freight concession to December 2032 and required an open-access plan for other operators. | Set the model for renewed freight rail contracts |
| In December 2025, COC Global Enterprise became the majority shareholder of OCA, which runs 760 service points and more than 3,500 vehicles. | Brought a parcel network under the owner of Flybondi |
| In April 2026, Andreani completed a USD 30 million automation of its General Pacheco hub, which sorts 26,000 packages an hour. | Raised national parcel sorting capacity |
| In August 2026, Resolution 1350/2026 opened a 50-year concession tender for 7,594 km of the Belgrano, San Martín and Urquiza freight lines. | Offers open Nov. 11, 2026 |
Sorting automation, QR fares and digital passenger lists
- Automated parcel sortation cuts handling time at large hubs, where Andreani reduced receiving and sorting from two days to under four hours after automating its General Pacheco site.
- QR fare payment lets subway riders pay without cards or cash, and Emova added interoperable QR terminals and turnstiles on the Premetro in 2025.
- Digital passenger lists replace paper records on intercity buses, because the CNRT web platform receives passenger data before each departure.
- Track authorization systems manage shared crossings, such as the Pino to San Lorenzo junction near Rosario where trains of different gauges run under a track use authorization regime.
Need a Custom Version of This Report?
Tailor the scope, geography, or segments to your exact requirements.
- Custom geography or segment scope
- Direct access to our analyst team
Airlines, parcel carriers and rail concessions compete
Competition is split across air, parcel, rail and urban services, and each mode has a small group of leaders. Aerolíneas Argentinas remains the largest domestic carrier, and it carried 12,781,016 passengers in 2025 with an 83% load factor. JetSMART Argentina and Flybondi compete on low fares and new provincial routes. Andreani and OCA lead parcel delivery, while CEVA Logistics Argentina won a July 2022 contract for inbound parts logistics at the Volkswagen Argentina plant in Córdoba. Nuevo Central Argentino, Ferroexpreso Pampeano and Ferrosur Roca hold freight rail concessions, and Emova runs the Buenos Aires subway. Rivals compete on network reach, schedule reliability, digital booking and price, while rail operators compete for the Belgrano Cargas award. Because shippers also buy last-mile delivery and warehousing, carriers with hubs and urban fleets gain more value from each customer.
Which carriers and concessionaires lead each mode?
| Company | Type | Role in the market |
|---|---|---|
| Aerolíneas Argentinas | State-owned airline | Largest domestic carrier with 54% of domestic traffic at the end of 2025 |
| JetSMART Argentina | Low-cost airline | Airbus A320 and A321 operator with 15 domestic destinations by October 2026 |
| Flybondi | Low-cost airline | Low-fare carrier that added Córdoba routes to Ushuaia and El Calafate in December 2025 |
| Andreani | Parcel and logistics carrier | Automated General Pacheco hub sorting 26,000 packages an hour |
| OCA | Private mail and parcel carrier | 760 service points and more than 3,500 vehicles |
| CEVA Logistics Argentina | Contract logistics provider | Won a July 2022 inbound parts contract at the Volkswagen transmission plant in Córdoba |
| Nuevo Central Argentino | Freight rail concessionaire | Mitre network freight concession extended to December 2032 |
| Ferroexpreso Pampeano | Freight rail concessionaire | Rosario to Bahía Blanca grain corridor, extended to April 2027 |
| Ferrosur Roca | Freight rail concessionaire | Roca line freight services under a one-year extension from September 2025 |
| Emova | Urban rail operator | Buenos Aires subway operator that carried 193 million paid passengers in 2025 |
Credence Research view on Argentine freight and travel
Credence Research's view is that Argentina transportation spending will grow steadily because grain exports, online retail and open air routes all add volume at the same time. Freight services remain the largest value pool, while enabling services such as automated hubs and ramp handling add the fastest growth. Operators that secure long rail concessions, provincial air routes and automated parcel capacity should gain share. Short concession terms and road congestion will slow growth, while the rail tender could unlock new investment in freight forwarding and port access.
How the national freight and travel estimate was built
The report uses 2025 as the base year on a calendar basis, and market values come from the Credence Research model. That model combines civil aviation traffic data, port arrival statistics, census population, e-commerce statistics, concession and tender documents, and company disclosures. Segment splits and regional shares and growth rates are Credence Research estimates. Sources used are government regulators, official statistics, trade bodies, news reports and company publications, and no interviews or surveys were used.
Rail privatization and open skies carry growth to 2035
Value across the Argentina transportation market is expected to reach USD 31.45 billion by 2035, a 5.85% CAGR during 2026–2035, as rail privatization, open skies and parcel automation widen capacity. Growth should be strongest in Patagonia, where energy activity and long distances lift heavy freight and air travel. Freight services will keep the largest share, while enabling services gain ground as new operators buy handling and booking services. A successful Belgrano Cargas award would shift some grain from road to rail, while delays would keep trucks dominant. Operators with hubs, concessions and provincial routes should gain the most.
Frequently Asked Questions
How big is the Argentina transportation market?
Which service type leads freight and passenger spending?
Which region leads freight and passenger spending in Argentina?
How many air passengers did Argentina handle in 2025?
What is happening with the Belgrano Cargas freight railway?
How does grain reach the Gran Rosario ports?
Which companies lead freight and passenger services in Argentina?
What are the main challenges for Argentine carriers?
Table of Content
Chapter 1 Market Segmentation
- 1.1 Segmentation Framework
- 1.1.1 Product and Service Classification
- 1.1.2 Application and End-Use Classification
- 1.1.3 Technology and Solution Classification
- 1.1.4 Customer and Distribution Channel Classification
- 1.1.5 Geographic Segmentation
- 1.1.6 Market Segment Definitions and Boundaries
- 1.2 By Service Type
- 1.2.1 Freight Transport
- 1.2.2 Passenger Transport
- 1.2.3 Transport Enablement
- 1.3 By Application
- 1.3.1 Merchandise Distribution
- 1.3.2 Daily Mobility
- 1.3.3 Intercity Travel
- 1.4 By Customer Type
- 1.4.1 Enterprise Buyers
- 1.4.2 Households
- 1.4.3 Public Authorities
- 1.5 By Revenue Model
- 1.5.1 Transaction-Based Revenue
- 1.5.2 Contract-Based Revenue
- 1.5.3 Concession-Based Revenue
Chapter 2 Introduction
- 2.1 Report Objectives and Scope
- 2.2 Product Definition and Industry Terminology
- 2.3 Market Inclusions and Exclusions
- 2.4 Research Process
- 2.4.1 Primary Research and Expert Interviews
- 2.4.2 Secondary Research and Source Review
- 2.4.3 Top-Down and Bottom-Up Estimation
- 2.4.4 Data Triangulation and Verification
- 2.5 Market Size Measurement Basis
- 2.5.1 2025: USD 17.77 billion → 2035: USD 31.45 billion
- 2.6 Historical and Forecast Reference Periods
- 2.6.1 Historical Period: 2018-2025
- 2.6.2 Base Year: 2025
- 2.6.3 Forecast Period: 2025-2035
- 2.7 Research Assumptions and Limitations
Chapter 3 Executive Summary
- 3.1 Market Snapshot and Key Findings
- 3.2 Base-Year Market Size, 2025
- 3.3 Forecast Market Size, 2035
- 3.4 Revenue and Volume Growth Outlook
- 3.5 Key Demand and Supply Indicators
- 3.6 Leading Market Segments
- 3.7 Fastest-Growing Market Opportunities
- 3.8 Regional Performance Highlights
- 3.9 Technology and Industry Transformation
- 3.10 Competitive Landscape Summary
- 3.11 Analyst View and Strategic Implications
Chapter 4 Argentina Transportation Market Trends and Developments
- 4.1 Historical Industry Development, 2018-2025
- 4.2 Recent Market Trends and Developments
- 4.3 Demand and Customer Behavior Trends
- 4.4 Technology and Product Innovation
- 4.5 Artificial Intelligence, Automation and Digitalization
- 4.6 Local Manufacturing and Supply Chain Realignment
- 4.7 Industry Partnerships, Mergers and Acquisitions
- 4.8 Sustainability and Circular Economy Developments
- 4.9 Government and Private Sector Investment Trends
- 4.10 Emerging Business Models and Commercialization
- 4.11 Industry Developments and Announcements
Chapter 5 Argentina Transportation Market Production, Supply and Demand Analysis
- 5.1 Demand Trend and Consumption Analysis, 2018-2025
- 5.2 Demand Forecast, 2025-2035
- 5.3 Production and Output Trend, 2018-2025
- 5.4 Production and Output Forecast, 2025-2035
- 5.5 Installed Capacity and Capacity Utilization
- 5.6 Company-Wise Production Plants and Statistics
- 5.6.1 Installed Production Capacity
- 5.6.2 Actual Production
- 5.6.3 Planned Capacity and Expansion Targets
- 5.7 Supply Chain Structure and Procurement Trends
- 5.8 Supply-Demand Gap and Bottlenecks
- 5.9 Import Dependence and Sourcing Structure
- 5.10 Contract Manufacturing and Outsourcing
- 5.11 Regional Supply and Demand Concentration
Chapter 6 Argentina Transportation Market Pricing Analysis
- 6.1 Pricing Structure and Measurement
- 6.2 Historical Pricing Trends, 2018-2025
- 6.3 Pricing Outlook, 2025-2035
- 6.4 Average Selling Price and Unit Economics
- 6.5 Pricing by Product and Market Segment
- 6.6 Geographic Pricing Differences
- 6.7 Key Input, Energy, Labor and Logistics Costs
- 6.8 Contract Pricing and Purchasing Models
- 6.9 Pricing Sensitivity and Competitive Positioning
- 6.10 Price, Margin and Profitability Implications
Chapter 7 Argentina Transportation Market Dynamics
- 7.1 Market Growth Drivers
- 7.1.1 Demand-Side Drivers
- 7.1.2 Technology and Innovation Drivers
- 7.1.3 Infrastructure and Investment Drivers
- 7.1.4 Regulatory and Policy Drivers
- 7.2 Market Restraints
- 7.2.1 Cost and Affordability Constraints
- 7.2.2 Technology and Adoption Barriers
- 7.2.3 Supply Chain and Operational Constraints
- 7.3 Market Challenges
- 7.3.1 Competitive Pressure and Margin Erosion
- 7.3.2 Skills, Infrastructure and Implementation Gaps
- 7.4 Emerging Market Opportunities
- 7.5 Market Dynamics Impact and Time-Horizon Assessment
Chapter 8 Argentina Transportation Value Chain Analysis
- 8.1 Industry Value Chain Overview
- 8.2 Upstream Suppliers and Critical Inputs
- 8.3 Technology and Component Providers
- 8.4 Manufacturing or Service Delivery
- 8.5 Distribution, Channel Partners and Integrators
- 8.6 Downstream Applications and End Users
- 8.7 Value Addition and Profit Pools
- 8.8 Vertical Integration and Outsourcing
- 8.9 Supplier Concentration and Risk
- 8.10 Supply Chain Localization and Resilience
Chapter 9 Argentina Transportation Market Regulations and Policies
- 9.1 Relevant Laws, Standards and Compliance Frameworks
- 9.2 Product, Service, Safety and Quality Requirements
- 9.3 Government Policies, Incentives and Subsidies
- 9.4 Imports, Exports and Trade Barriers
- 9.5 Public Procurement and Local Content Requirements
- 9.6 Environmental and Sustainability Compliance
- 9.7 Upcoming Policy Changes and Market Implications
Chapter 10 Argentina Transportation Market Hotspots and Opportunities
- 10.1 Market Opportunity Mapping and Growth Hotspots
- 10.2 High-Growth Applications and Customer Groups
- 10.3 Underserved Markets and White-Space Opportunities
- 10.4 Emerging Technology and Product Opportunities
- 10.5 New Capacity and Investment Hotspots
- 10.6 Market Entry and Expansion Opportunities
- 10.7 Distribution and Partnership Opportunities
- 10.8 Near-Term and Long-Term Commercial Potential
- 10.9 Opportunity Attractiveness and Execution Risks
Chapter 11 Argentina Transportation Market Outlook, 2025-2035
- 11.1 Market Size and Analysis
- 11.1.1 Revenue (Market Measurement: 2025: USD 17.77 billion → 2035: USD 31.45 billion)
- 11.1.2 Market Volume and Quantity Sold
- 11.1.3 Historical Market Size, 2018-2025
- 11.1.4 Base-Year Market Size, 2025
- 11.2 Market Forecast, 2025-2035
- 11.2.1 Revenue Forecast to 2035
- 11.2.2 Volume Forecast to 2035
- 11.2.3 CAGR and Year-on-Year Growth
- 11.2.4 Incremental Revenue Opportunity
- 11.3 Forecast Assumptions and Scenario Analysis
- 11.3.1 Base-Case Forecast
- 11.3.2 Optimistic and Conservative Scenarios
- 11.3.3 Technology, Pricing and Policy Sensitivities
- 11.4 Market Attractiveness and Growth Outlook
Chapter 12 Argentina Transportation Market Segmentation and Outlook
- 12.1 Segmentation Summary and Market Shares, 2025
- 12.2 Largest and Fastest-Growing Segments
- 12.3 By Service Type - Market Size and Forecast, 2025-2035
- 12.3.1 Segment Definition and Scope
- 12.3.2 Historical Market Size, 2018-2025
- 12.3.3 Revenue Forecast, 2025-2035
- 12.3.4 Volume Forecast, 2025-2035
- 12.3.5 Base-Year Market Share, 2025
- 12.3.6 Segment CAGR and Growth Drivers
- 12.3.7 Subsegment Market Size and Forecast
- 12.3.7.1 Freight Transport
- 12.3.7.2 Passenger Transport
- 12.3.7.3 Transport Enablement
- 12.3.8 Subsegment Pricing and Adoption Trends
- 12.3.9 Leading Suppliers and Competition
- 12.3.10 Regional Demand and Opportunities
- 12.4 By Application - Market Size and Forecast, 2025-2035
- 12.4.1 Segment Definition and Scope
- 12.4.2 Historical Market Size, 2018-2025
- 12.4.3 Revenue Forecast, 2025-2035
- 12.4.4 Volume Forecast, 2025-2035
- 12.4.5 Base-Year Market Share, 2025
- 12.4.6 Segment CAGR and Growth Drivers
- 12.4.7 Subsegment Market Size and Forecast
- 12.4.7.1 Merchandise Distribution
- 12.4.7.2 Daily Mobility
- 12.4.7.3 Intercity Travel
- 12.4.8 Subsegment Pricing and Adoption Trends
- 12.4.9 Leading Suppliers and Competition
- 12.4.10 Regional Demand and Opportunities
- 12.5 By Customer Type - Market Size and Forecast, 2025-2035
- 12.5.1 Segment Definition and Scope
- 12.5.2 Historical Market Size, 2018-2025
- 12.5.3 Revenue Forecast, 2025-2035
- 12.5.4 Volume Forecast, 2025-2035
- 12.5.5 Base-Year Market Share, 2025
- 12.5.6 Segment CAGR and Growth Drivers
- 12.5.7 Subsegment Market Size and Forecast
- 12.5.7.1 Enterprise Buyers
- 12.5.7.2 Households
- 12.5.7.3 Public Authorities
- 12.5.8 Subsegment Pricing and Adoption Trends
- 12.5.9 Leading Suppliers and Competition
- 12.5.10 Regional Demand and Opportunities
- 12.6 By Revenue Model - Market Size and Forecast, 2025-2035
- 12.6.1 Segment Definition and Scope
- 12.6.2 Historical Market Size, 2018-2025
- 12.6.3 Revenue Forecast, 2025-2035
- 12.6.4 Volume Forecast, 2025-2035
- 12.6.5 Base-Year Market Share, 2025
- 12.6.6 Segment CAGR and Growth Drivers
- 12.6.7 Subsegment Market Size and Forecast
- 12.6.7.1 Transaction-Based Revenue
- 12.6.7.2 Contract-Based Revenue
- 12.6.7.3 Concession-Based Revenue
- 12.6.8 Subsegment Pricing and Adoption Trends
- 12.6.9 Leading Suppliers and Competition
- 12.6.10 Regional Demand and Opportunities
- 12.7 Segment Growth Comparison
- 12.8 Segment Attractiveness and Priority Matrix
Chapter 13 Argentina Transportation End-Use and Application Market Outlook
- 13.1 End-Use Industry and Customer Demand Structure
- 13.2 Leading Applications and Customer Groups
- 13.3 End-Use Market Size, Share and Forecast
- 13.4 Major End-Use Industry Deep Dives
- 13.4.1 Customer Requirements and Use Cases
- 13.4.2 Demand and Replacement Cycles
- 13.4.3 Technical and Regulatory Considerations
- 13.4.4 Purchasing and Procurement Models
- 13.4.5 Leading Vendors and Distribution Channels
- 13.4.6 Forecast and Commercial Opportunities
- 13.5 Emerging Applications and Cross-Segment Demand
- 13.6 End-Use Industry Investment Priorities
Chapter 14 Argentina Transportation Geographic Market Outlook, 2025-2035
- 14.1 Domestic Market Distribution and Demand Clusters
- 14.2 State- or Province-Wise Market Size and Forecast, 2025-2035
- 14.3 City and Metropolitan Market Outlook
- 14.4 Industrial, Manufacturing and Commercial Clusters
- 14.5 Geographic Concentration of Key End Users
- 14.6 Local Pricing and Purchasing Differences
- 14.7 Domestic Production Facilities and Capacity Map
- 14.8 Local Infrastructure and Project Pipeline
- 14.9 State-Level Policy and Incentive Differences
- 14.10 Subnational Investment Hotspots and Opportunities
- 14.11 Distribution and Logistics Networks
- 14.12 Domestic Competitive Footprint
Chapter 15 Argentina Transportation Technology, Innovation and Sustainability Outlook
- 15.1 Technology Landscape and Maturity
- 15.2 Product, Process and Service Innovation
- 15.3 AI, Automation and Digital Tools in the Industry
- 15.4 Technology Adoption and Performance Benchmarking
- 15.5 Innovation Pipeline and R&D Investment
- 15.6 Patent and Intellectual Property Trends
- 15.7 Energy Efficiency and Resource Management
- 15.8 Sustainability, Recycling and Circularity
- 15.9 Technology Roadmap, 2025-2035
- 15.10 Risks of Obsolescence and Technology Substitution
Chapter 16 Argentina Transportation Market Key Strategic Imperatives
- 16.1 Growth and Market Entry Priorities
- 16.2 High-Return Products and Segments
- 16.3 Pricing, Profitability and Cost Optimization
- 16.4 Technology Investment and Product Differentiation
- 16.5 Supply Chain Localization and Resilience
- 16.6 Distribution and Customer Acquisition
- 16.7 Partnership, Acquisition and Capacity Strategy
- 16.8 Regional Expansion Priorities
- 16.9 Short-, Medium- and Long-Term Actions
Chapter 17 Competition Outlook
- 17.1 Industry Competition Characteristics
- 17.2 Market Structure and Concentration
- 17.3 Market Share and Competitive Positioning, 2025
- 17.4 Company-Wise Revenue and Product Benchmarking
- 17.5 Production and Service Capacity Benchmarking
- 17.6 Technology, Pricing and Differentiation
- 17.7 Regional Footprint and Distribution Strength
- 17.8 Mergers, Acquisitions and Strategic Alliances
- 17.9 New Entrants and Competitive Threats
- 17.10 Porter's Five Forces and Industry Attractiveness
- 17.11 Competitive Outlook, 2025-2035
Chapter 18 Company Profiles
- 18.1 Company Coverage and Selection Criteria
- 18.2 Aerolíneas Argentinas
- 18.2.1 Business Description
- 18.2.2 Company Ownership and Geographic Presence
- 18.2.3 Product and Service Portfolio
- 18.2.4 Manufacturing and Operating Footprint
- 18.2.5 Production Capacity and Expansion Plans
- 18.2.6 Financial Performance and Investment
- 18.2.7 Market Share and Competitive Position
- 18.2.8 Technology and Innovation Capabilities
- 18.2.9 Strategic Alliances or Partnerships
- 18.2.10 Recent Developments
- 18.2.11 Growth Strategy and Outlook
- 18.3 JetSMART Argentina
- 18.4 Flybondi
- 18.5 Andreani
- 18.6 OCA
- 18.7 CEVA Logistics Argentina
- 18.8 Nuevo Central Argentino
- 18.9 Ferroexpreso Pampeano
- 18.10 Ferrosur Roca
- 18.11 Emova
- 18.12 Other Relevant Market Participants
Note: Every listed company is profiled on the structure shown under the first company. The company list is preliminary and may change based on research findings, market developments, data availability and client requirements.
Chapter 19 Disclaimer
- 19.1 Research and Forecast Disclaimer
- 19.2 Data Source and Estimation Limitations
Note: The depth of individual sections depends on data availability for this market. Volume, capacity, trade and other unit-based metrics are included where applicable.

