
Medicine, food and climate rules push buyers to advisers
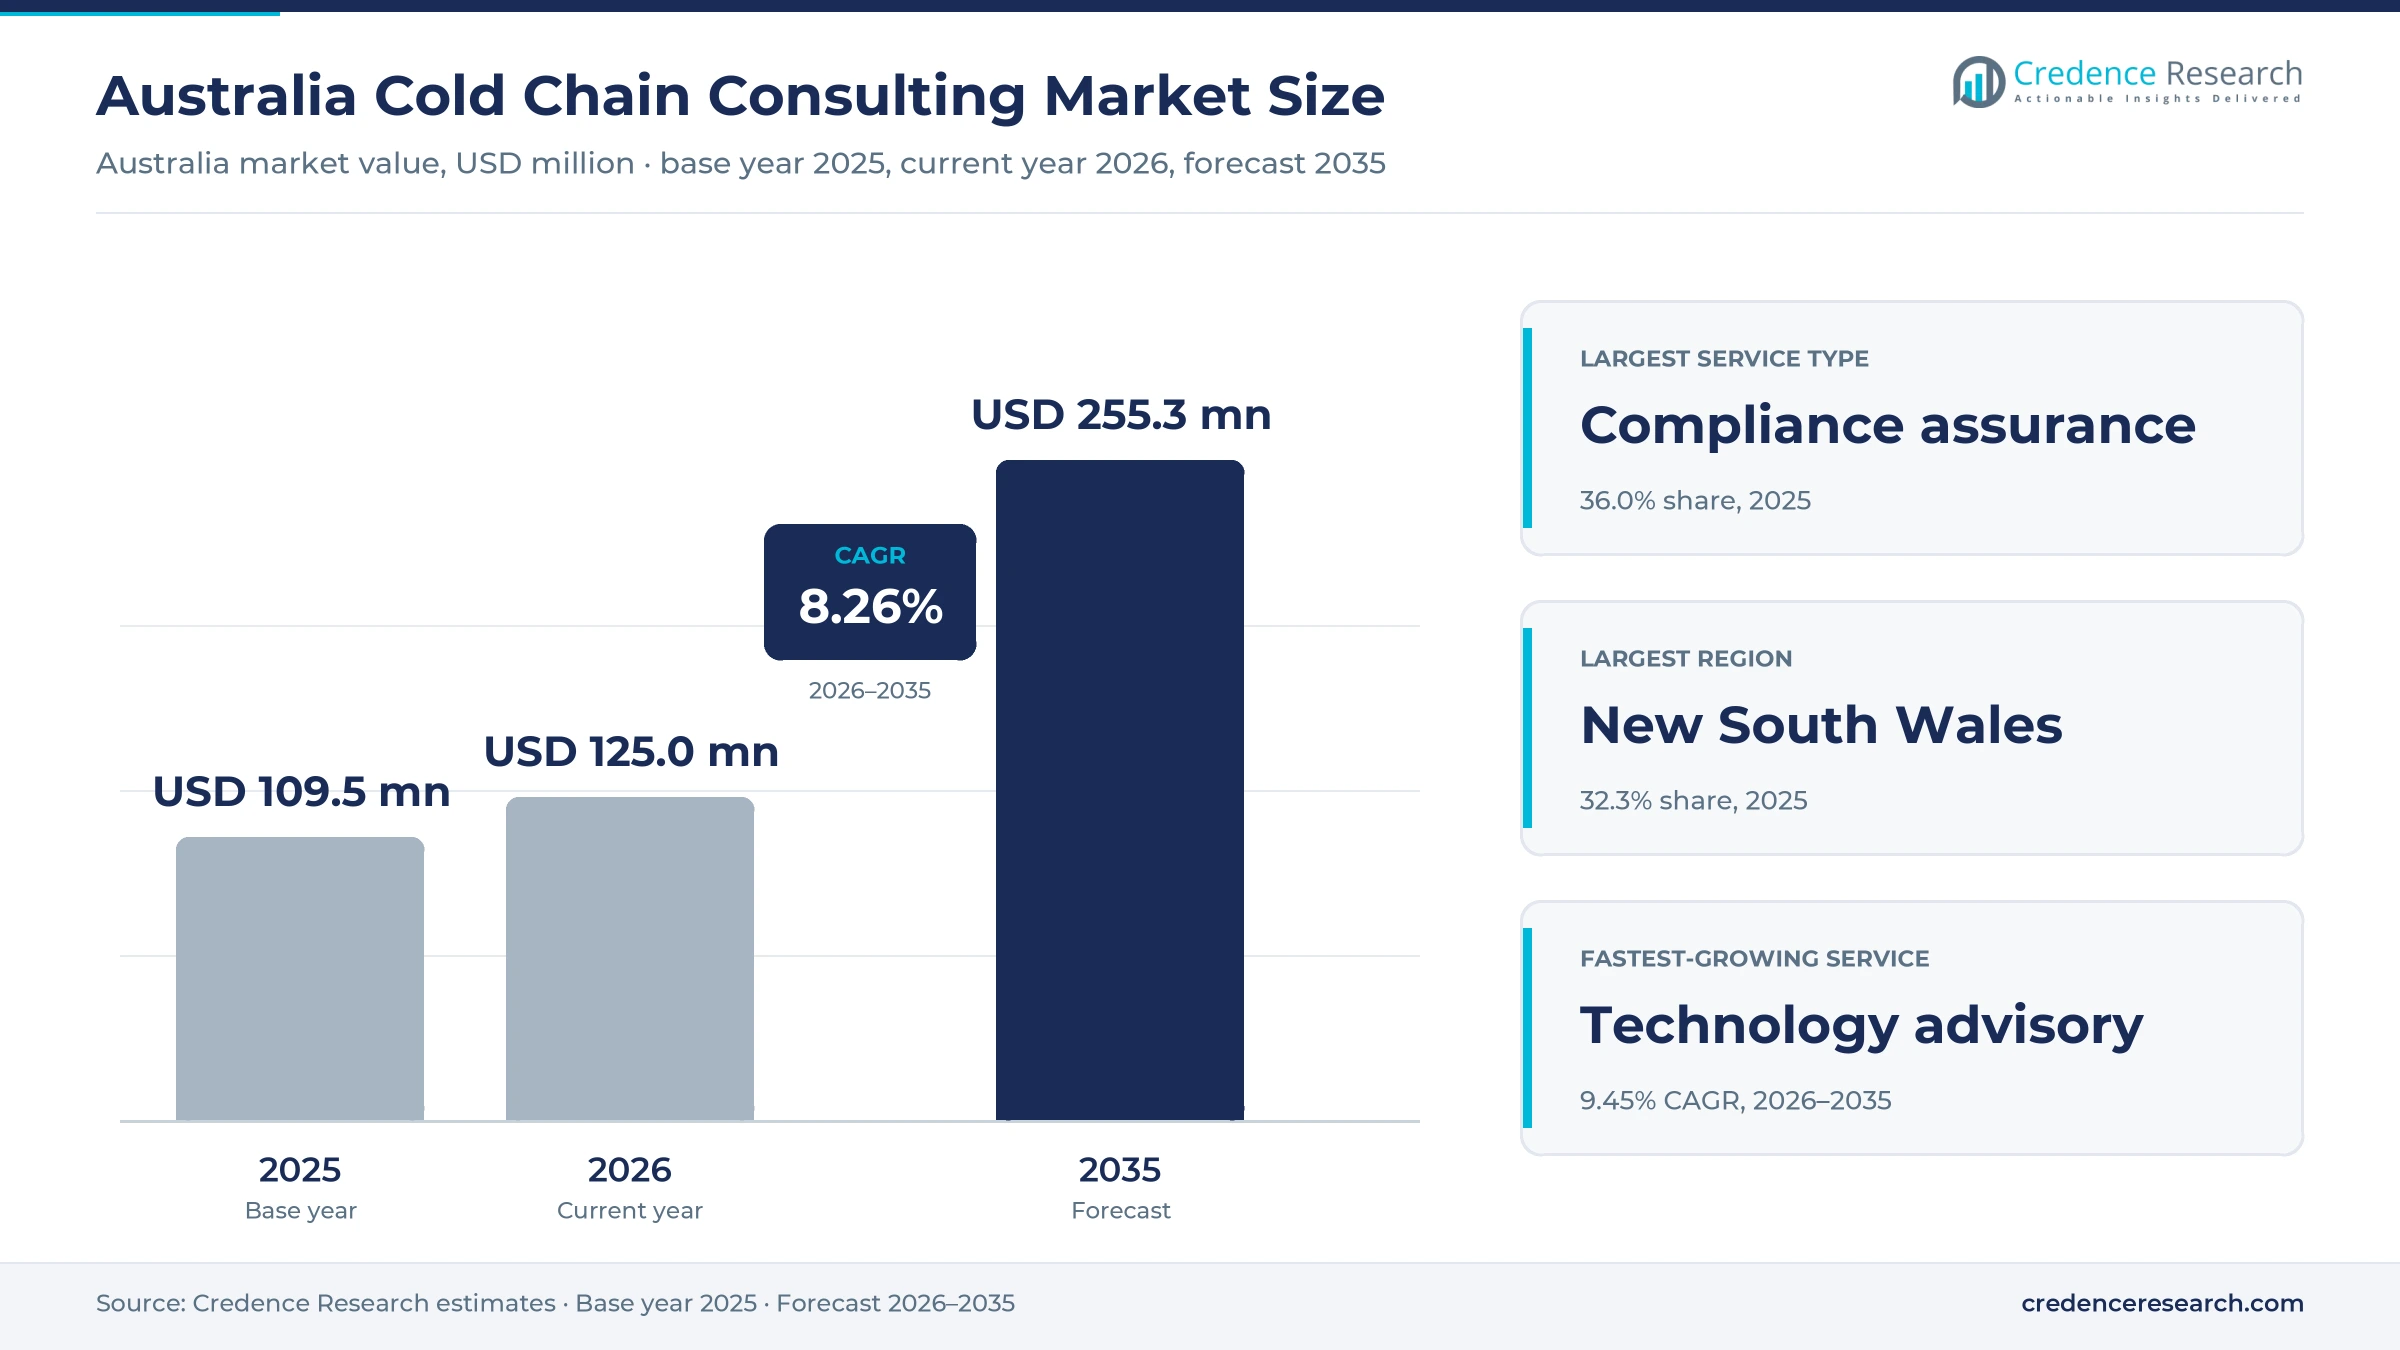
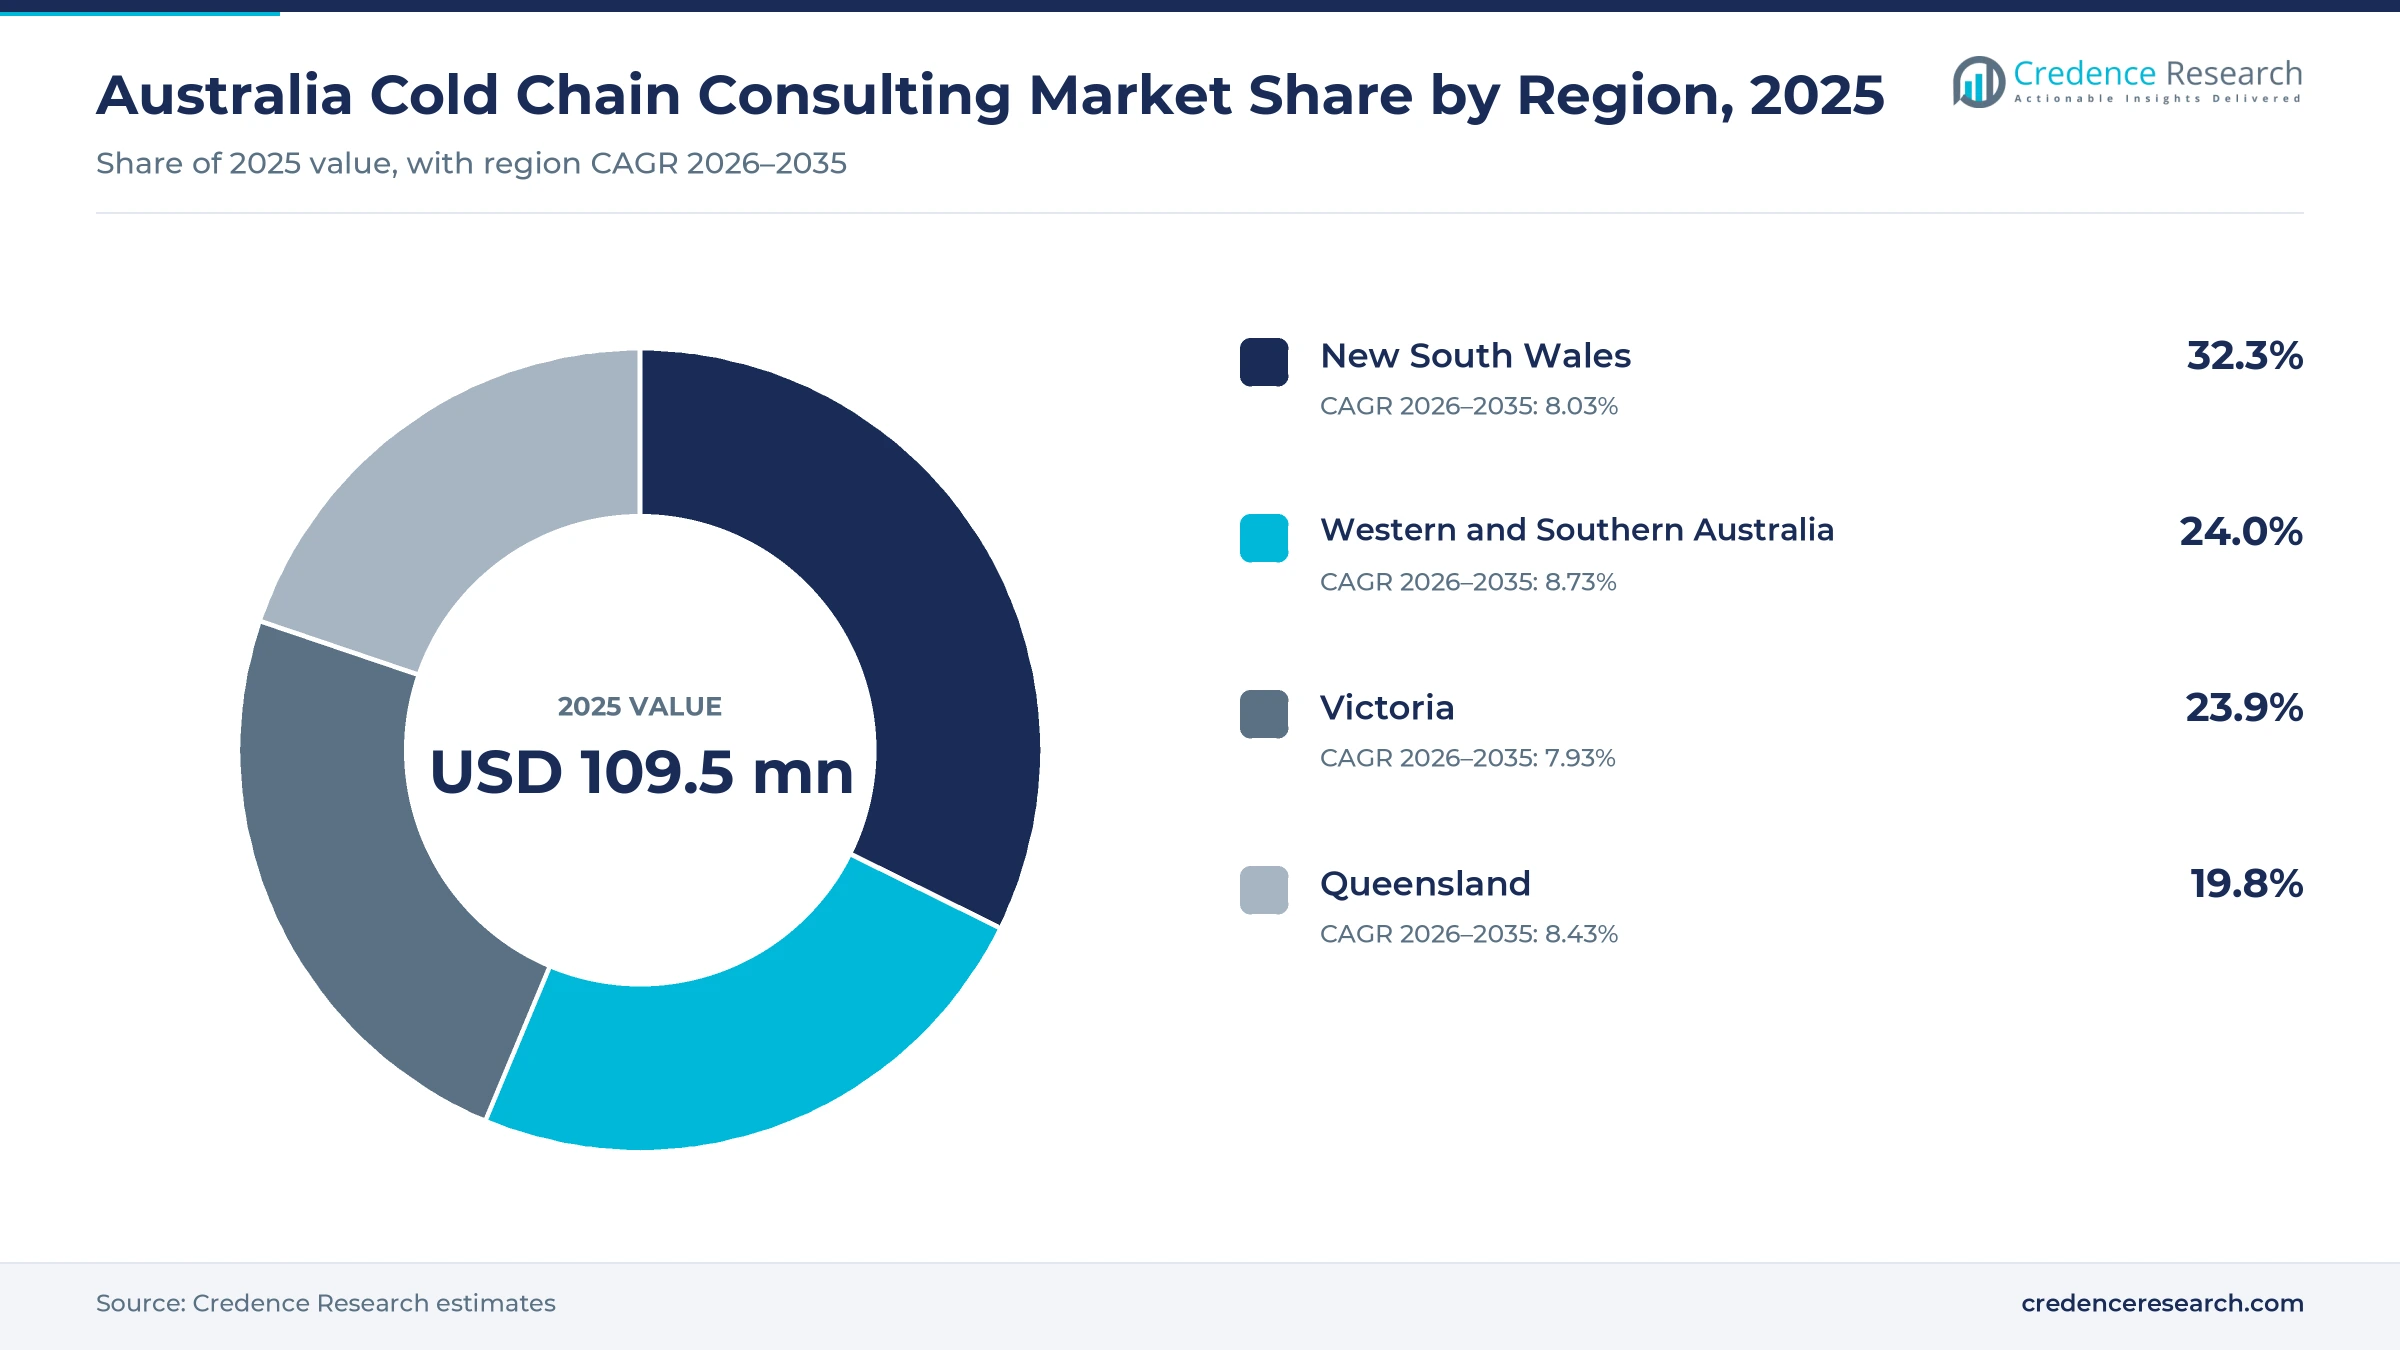
The Australia cold chain consulting market was valued at USD 109.5 million in 2025 and is projected to increase from USD 125.0 million in 2026 to USD 255.2 million by 2035, registering a CAGR of 8.26% during 2026–2035. Demand comes from pharmaceutical wholesalers, hospitals, food exporters, grocers and logistics operators that hire specialists to audit temperature control, design networks, select monitoring tools and plan emissions cuts. New South Wales held the largest regional share, 32.3% in 2025, because Sydney hosts most national grocery, medicine and freight headquarters. Western and Southern Australia is the fastest-growing region at 8.73% a year, as population growth and export activity add new cold stores. However, mandatory climate reporting changed the buyer brief from January 2025, because large groups must now count refrigeration energy, refrigerant leaks and freight emissions in their annual disclosures.
Which advisory services and fees does the estimate cover?
The estimate measures fees paid to consultants for temperature control audits, good distribution practice reviews, temperature mapping, network and facility design, monitoring technology advice and strategic planning for cold stores and refrigerated freight. Buyers include national and regional enterprises and public-sector health, food safety and procurement agencies across Australia.
The estimate excludes refrigeration equipment sales, packaging, storage and transport services, software licenses and in-house quality staff costs. The value chain runs from producers and manufacturers through warehouses, refrigerated fleets and retailers, while advisers check each handover point and help clients prove control to regulators, customers and auditors.
Australia Cold Chain Consulting Market Insights
- The Australia cold chain consulting market was valued at USD 109.5 million in 2025 and is projected to reach USD 255.2 million by 2035, registering a CAGR of 8.26% during 2026–2035.
- New South Wales held a 32.3% share of 2025 value, because Sydney concentrates national grocery, pharmaceutical and logistics headquarters that buy advisory work.
- Compliance assurance led with a 36.0% share of 2025 value, because buyers commission audits, mapping and training before they redesign networks.
- A national study put cold chain food loss at about 2.18 million metric tons a year, worth roughly A$3.8 billion at farm gate, which keeps loss prevention on client agendas.
- Technology advisory grows fastest at 9.45% a year during 2026–2035, as fleets test electric refrigeration and buyers link sensors with traceability data.
Compliance work leads while technology advice grows fastest
Why does compliance assurance earn the largest fee pool?
Based on service type, the market is categorized into compliance assurance, network design, technology advisory and strategic advisory. Compliance assurance led with a 36.0% share of 2025 value, because wholesalers, hospitals and food exporters must prove temperature control during audits. Technology advisory grows fastest at 9.45% a year, as clients select sensors, electric refrigeration and data platforms for their sites.
How do food exporters and medicine suppliers shape demand?
Based on end-use industry, the market is categorized into food production and export, pharmaceuticals and healthcare, grocery retail and cold-chain logistics. Food production and export led with a 34.0% share of 2025 value, because exporters move large perishable volumes over long distances. Pharmaceuticals and healthcare grows fastest at 8.93% a year, as medicine distribution rules tighten and biologic products need narrow temperature ranges.
Which buyers commission the most advisory work?
Based on customer type, the market is categorized into national enterprise buyers, regional enterprise buyers and public-sector buyers. National enterprise buyers led with a 54.0% share of 2025 value, because national grocers, wholesalers and freight groups run large multi-site programs. Regional enterprise buyers grow fastest at 9.06% a year, as mid-sized processors enter climate reporting and seek first-time advice.
Why is hybrid delivery gaining ground with clients?
Based on delivery model, the market is categorized into on-site delivery, remote delivery and hybrid delivery. On-site delivery led with a 52.0% share of 2025 value, because temperature mapping, audits and site design need advisers at the facility. Hybrid delivery grows fastest at 9.20% a year, as wireless monitoring lets advisers review data remotely between site visits.
| Segment Group | Leading Sub-segment | Share, 2025 | Fastest-growing Sub-segment | CAGR, 2026–2035 |
|---|---|---|---|---|
| By Service Type | Compliance assurance | 36.0% | Technology advisory | 9.45% |
| By End-Use Industry | Food production and export | 34.0% | Pharmaceuticals and healthcare | 8.93% |
| By Customer Type | National enterprise buyers | 54.0% | Regional enterprise buyers | 9.06% |
| By Delivery Model | On-site delivery | 52.0% | Hybrid delivery | 9.20% |
Request a Free Sample
Fill in your details and we'll send you a free sample report.
- Sample data tables & charts
- Research methodology
Medicine rules, food loss and climate laws lift demand
How does medicine distribution assurance lift demand?
Medicine distribution assurance lifts demand, because wholesalers, hospitals and clinics must prove that temperature-sensitive products stay within labeled limits from receipt to dispatch. National vaccine storage guidance requires vaccines to be held between +2°C and +8°C, which turns every refrigerator, cold room and shipper into a compliance point. The national regulator introduced version 16 of the PIC/S Guide to GMP from June 3, 2024, and gave manufacturers three months to adopt its new Annex 16, according to the Therapeutic Goods Administration. PharmOut supplies temperature mapping with its own equipment and calibration data, and cites guidance that refrigerators and cold rooms be mapped on installation and every year. As a result, pharmaceuticals and healthcare grow at 8.93% a year, the fastest end use during 2026–2035.
Why does food loss prevention drive audit spending?
Food loss prevention drives audit spending, because growers, processors and grocers lose stock and margin whenever product warms between farm, truck, dock and store. A government study published in May 2020 put cold chain food loss at about 2.18 million metric tons a year, worth roughly A$3.8 billion at farm gate, according to the national cold food chain study. Fruit and vegetables made up about 88% of that loss by mass, and the study linked much of the waste to poor temperature management during transfers. The same study counted about 262,900 walk-in cold rooms and 45,500 road transport refrigeration units, yet found no mandatory insulation standard for either. In turn, compliance assurance leads with 36.0% of 2025 value, because buyers commission audits, mapping and training first.
How does climate reporting readiness create new briefs?
Climate reporting readiness creates new briefs, because large food, grocery and logistics groups must now measure refrigeration energy, refrigerant leaks and freight emissions across their value chains. Parliament passed mandatory climate disclosure laws on Sept. 9, 2024, and Group 1 entities report for financial years starting on or after Jan. 1, 2025. The AASB S2 standard, issued Sept. 20, 2024, requires Scope 1, Scope 2 and Scope 3 emissions measured under the Greenhouse Gas Protocol, with 15 Scope 3 categories. Group 2 entities, which meet two of three tests such as A$200 million in revenue or more than 250 employees, join from July 1, 2026, which will expand the buyer pool. As a result, strategic advisory gains work on refrigerant transition, cold store energy and fleet decarbonization plans.
Why do export growth and produce safety rules add work?
Export growth and new produce safety rules add work, because exporters must keep product within temperature limits over long distances and prove control to buyers and regulators. Agriculture, fisheries and forestry exports reached A$75.6 billion in 2023-24, and about 70% of production is exported, according to national farm statistics. New national standards for berries, leafy vegetables and melons took effect on Feb. 12, 2025, and list the temperature of harvested leafy vegetables as a key risk. Globally, about 14% of food is lost between harvest and retail, according to the Food and Agriculture Organization, which keeps loss reduction high on export agendas. In turn, food production and export leads end uses with 34.0% of 2025 value, as meat, seafood and produce shippers seek audits.
Electric refrigeration and traceability reshape advice
How is the shift to electric refrigeration changing advice?
The shift to electric transport refrigeration is changing advisory work, because fleet owners need help sizing batteries, solar inputs and charging around long refrigerated routes. The Clean Energy Finance Corporation announced on May 18, 2026, that it would invest up to A$10 million to help deploy more than 100 Sunswap Endurance electric units across retail and logistics fleets. A three-day trial covered 1,671 kilometers between Sydney and Brisbane without en route charging and finished with 62% battery remaining. The same release noted that transport is the third-largest source of national emissions, at about 22% of the total. As a result, technology advisory grows at 9.45% a year, the fastest service type, as operators test new refrigerated transport options.
Why is the rise of digital traceability reshaping audits?
The rise of digital traceability is reshaping audits, because buyers want temperature, location and batch data linked to each pallet and carton. GS1 Australia co-convenes the National GS1 Traceability Advisory Group, which has more than 80 industry and government members. Its network of more than 100 solution providers supports standards-aligned traceability tools for food and agriculture. The national cold food chain study also recommended time-temperature integrators and refrigerated transport monitoring programs to improve record keeping. In turn, advisers link temperature monitoring systems with barcodes and registry data, which lets clients prove control during audits and recalls. As a result, hybrid delivery grows at 9.20% a year, as advisers review sensor data between site visits.
Can first-time climate reporters open a new client base?
First-time climate reporters can open a new client base, because many regional processors and distributors have never measured cold store energy or refrigerant emissions. Group 2 entities enter mandatory reporting on July 1, 2026, which brings a large wave of first-time reporters into the market. Group 3 entities follow from July 1, 2027, when two of three tests such as A$50 million in revenue or more than 100 employees apply. The AASB S2 standard converts emissions using 100-year values from the IPCC Sixth Assessment Report, which raises the stakes for refrigerant choices. As a result, regional enterprise buyers grow at 9.06% a year, the fastest customer type during 2026–2035, as they commission baseline studies.
Is there room for growth in fast-growing western states?
Fast-growing western states offer room for growth, because new cold stores and distribution centers need design, validation and mapping advice before they open. Australia's population reached about 27.5 million in March 2025 after 1.6% annual growth, according to national population data. Western Australia grew fastest at 2.3%, while Queensland and Victoria each grew 1.8%, which lifts grocery and medicine volumes. In turn, retailers and freight groups add sites in growth corridors, and each new site needs layout, temperature mapping and network modeling work. As a result, Western and Southern Australia gains the most new sites, while logistics advisory firms gain network design projects in these states.
Small budgets and thin expertise slow wider adoption
How do tight budgets limit advisory spending?
Tight budgets limit advisory spending, because many growers, small processors and independent pharmacies see temperature audits as a cost rather than an investment. As a result, these buyers often call advisers only after a breach, a failed audit or a customer complaint. Advisers respond with fixed-fee packages, remote reviews and shared training sessions, which lower the entry cost for small clients. This pressure eases as retailers and exporters push suppliers to prove control.
Why does a shortage of specialists slow projects?
A shortage of specialists slows projects, because few advisers combine refrigeration engineering, GxP quality and supply network skills in one person. In turn, clients wait longer for mapping, validation and design work during peak seasons and before audits. Consulting firms respond by training junior staff, using wireless loggers and partnering with equipment suppliers, which stretches scarce experts across more sites. This gap favors consulting firms that invest steadily in their own training programs.
How do voluntary standards create uneven practice?
Voluntary standards create uneven practice, because Australia has no mandatory insulation standard for walk-in cold rooms or refrigerated vehicles, and the voluntary truck standard has had limited effect. As a result, equipment quality and temperature performance vary widely between operators, which makes audits harder to benchmark. Advisers respond with site-specific mapping, clear acceptance limits and supplier checklists. This challenge also creates steady demand for independent reviews from outside specialists.
Why do long distances raise the cost of site work?
Long distances raise the cost of site work, because many farms, mines, clinics and regional depots sit far from the city offices where most advisers are based. In turn, travel time and accommodation add to every on-site audit or mapping study in remote areas. Advisers respond with remote data reviews, local partners and combined visits that cover several sites on one trip. This cost keeps on-site work concentrated in the eastern capitals.
Sydney buyers lead while western states grow fastest
| Region | Value, 2025 (USD million) | Share, 2025 | CAGR, 2026–2035 |
|---|---|---|---|
| New South Wales | 35.4 | 32.3% | 8.03% |
| Western and Southern Australia | 26.3 | 24.0% | 8.73% |
| Victoria | 26.2 | 23.9% | 7.93% |
| Queensland | 21.7 | 19.8% | 8.43% |
Why does new South Wales hold the top share?
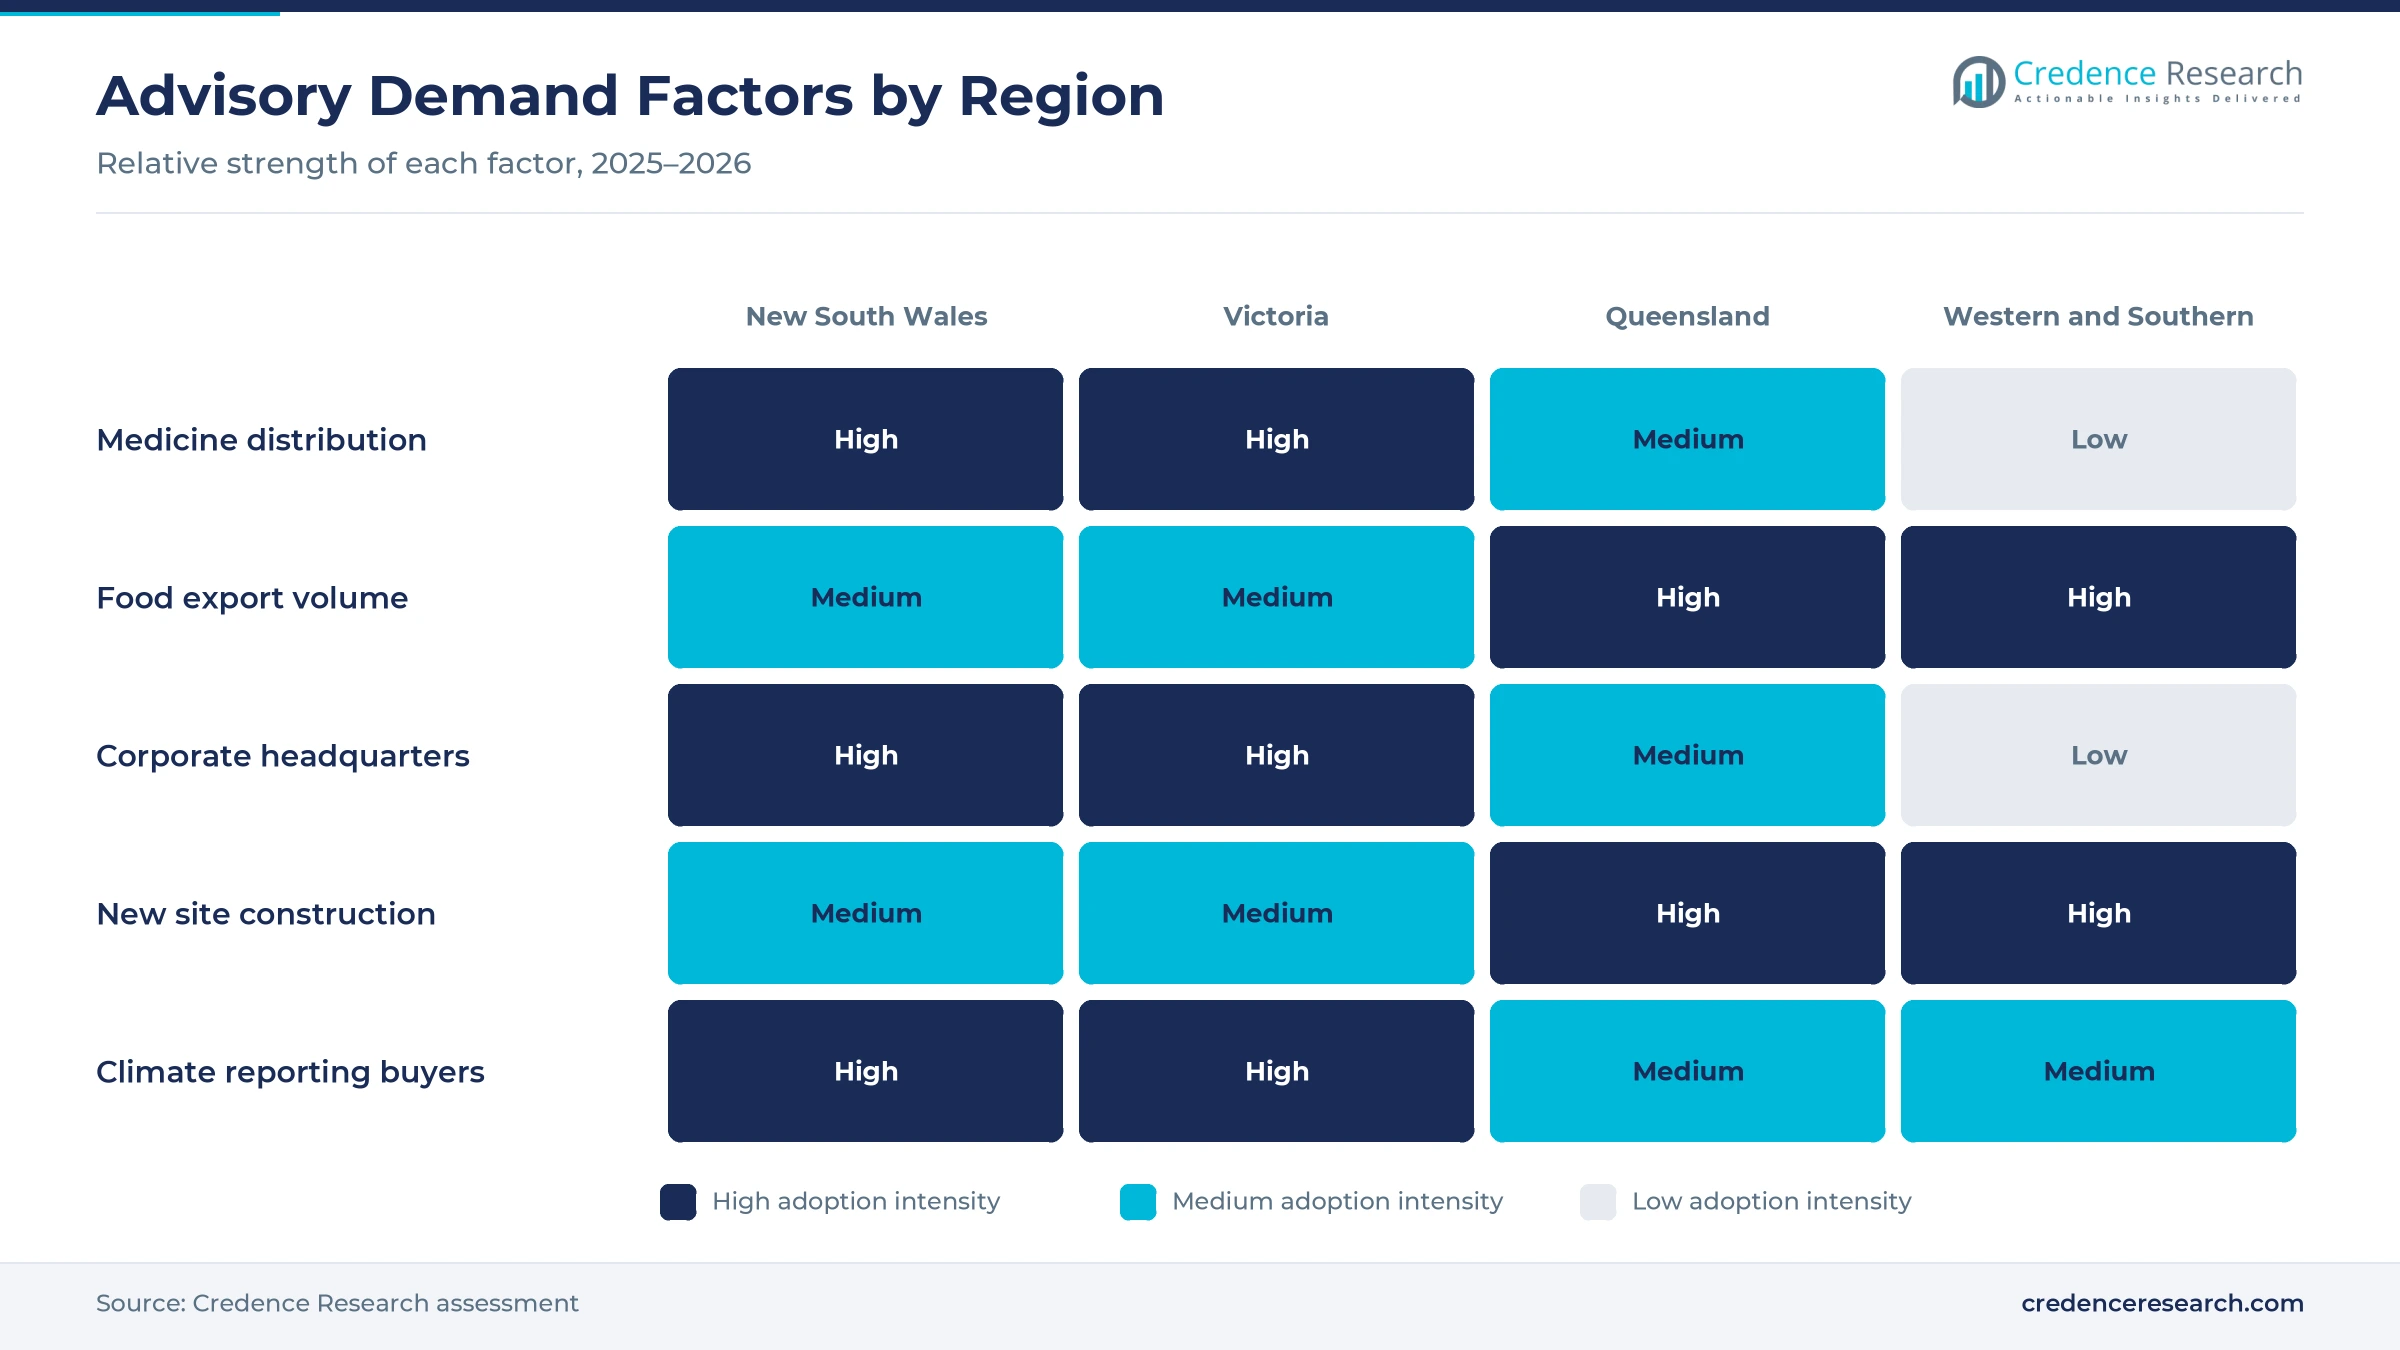
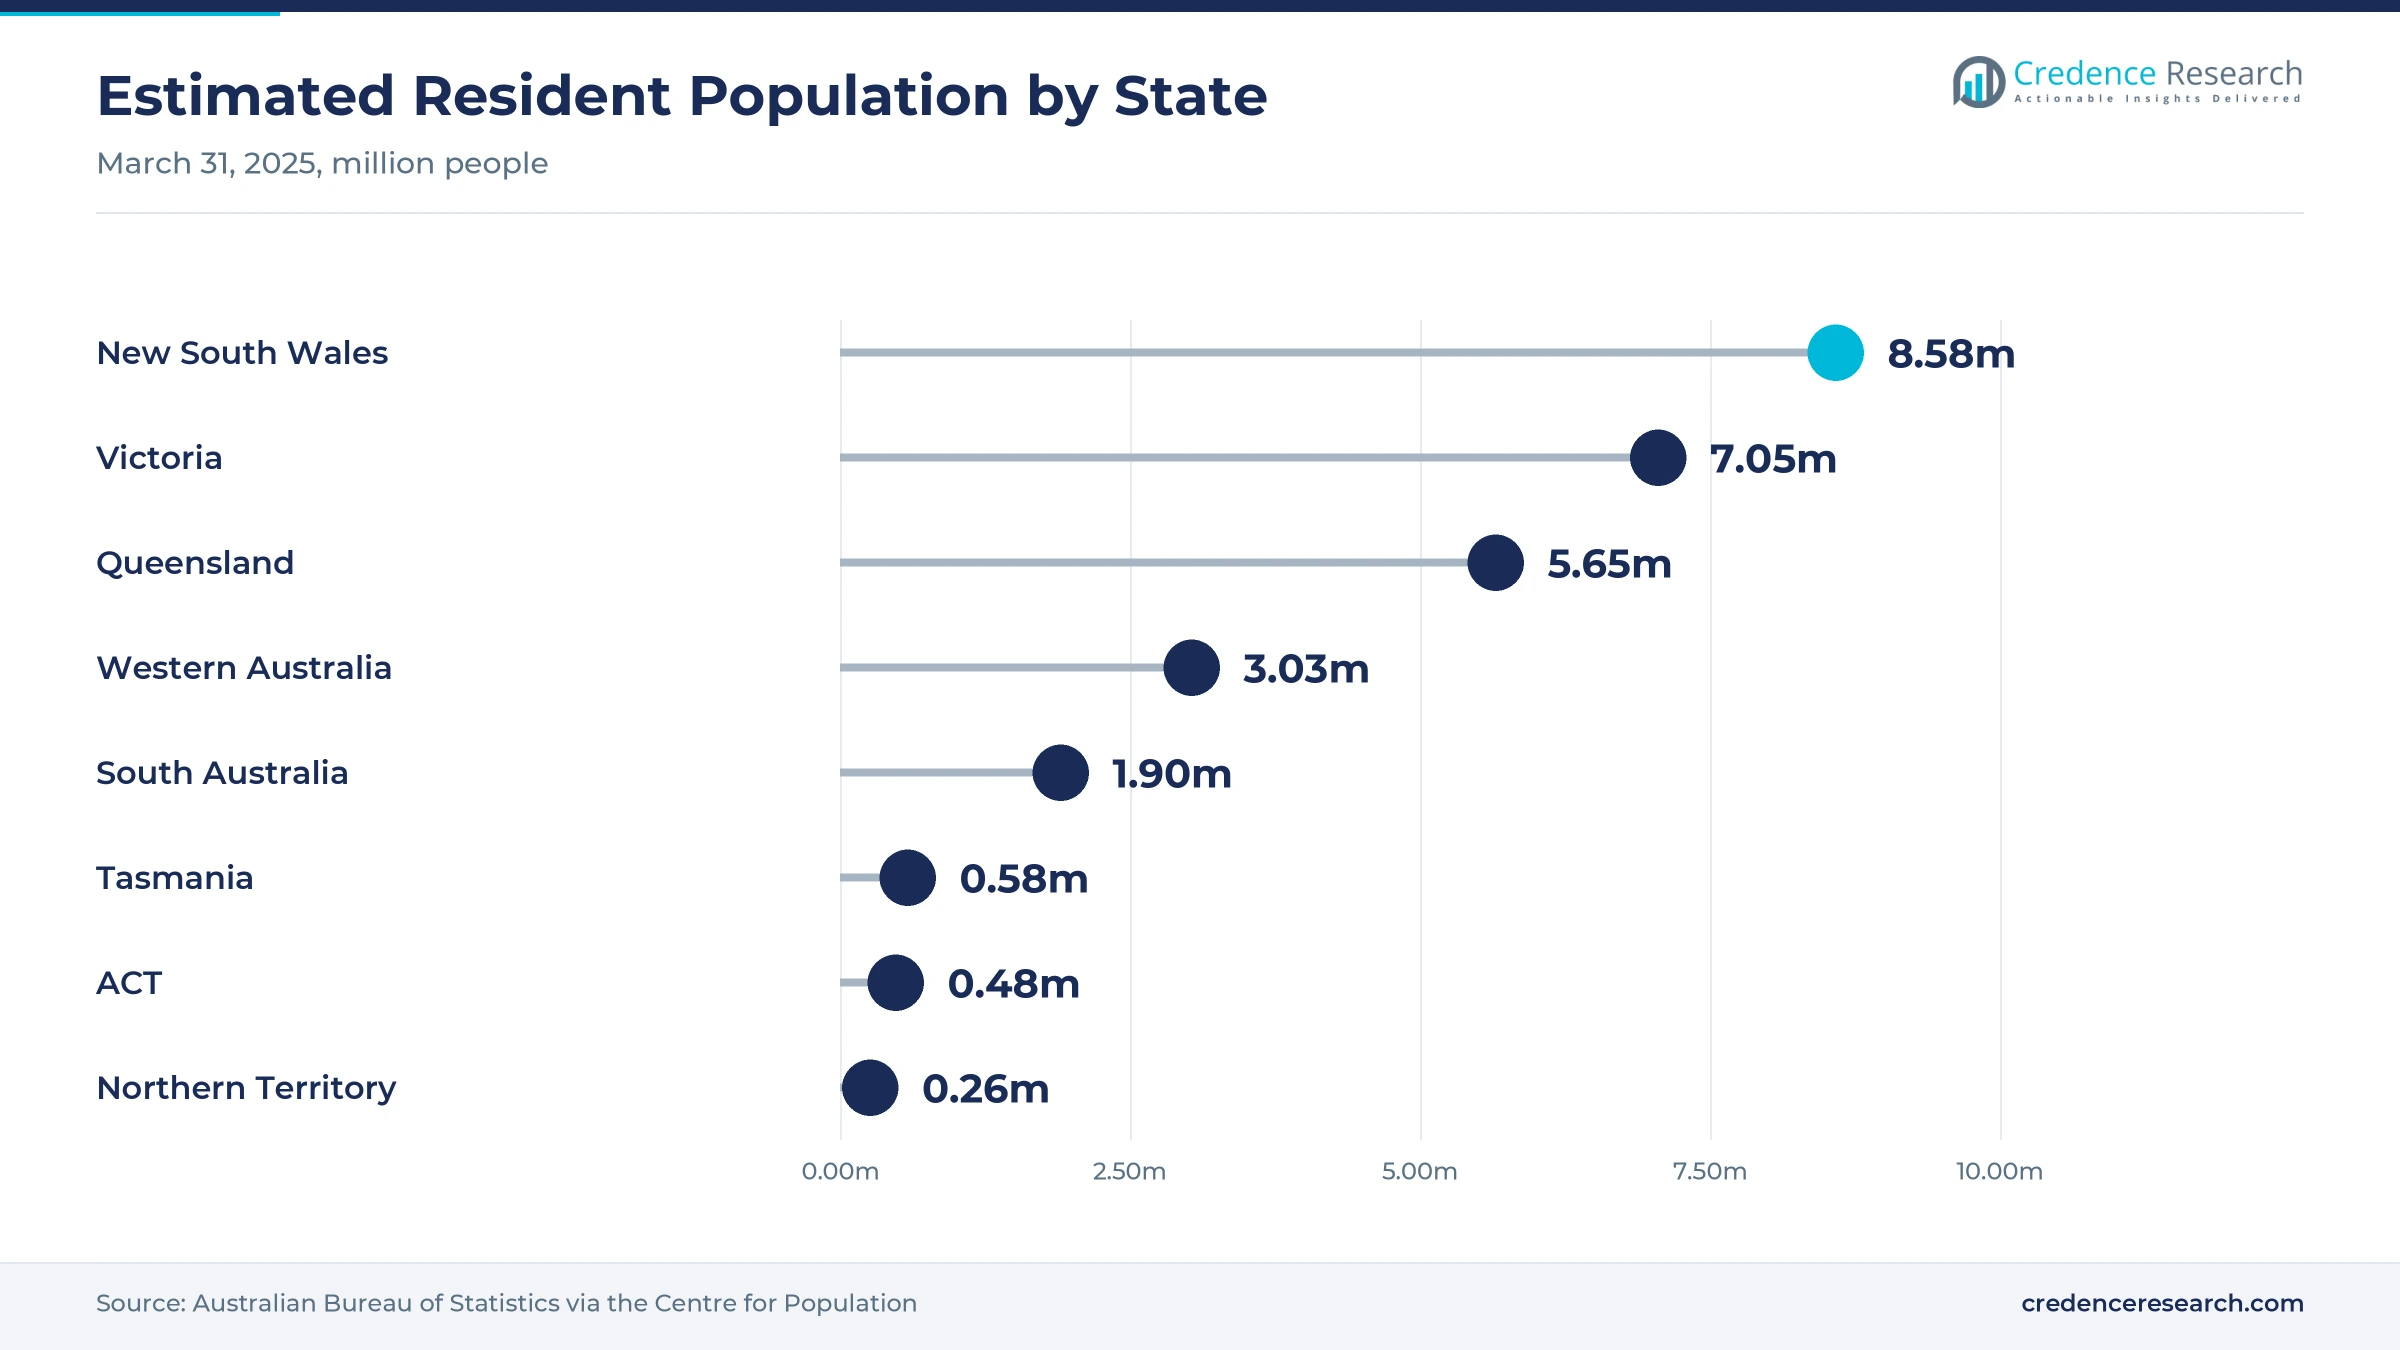
New South Wales held a 32.3% share of 2025 value and grows at 8.03% a year, because Sydney hosts many national grocery, pharmaceutical and logistics headquarters. The state had about 8.58 million residents in March 2025, the largest population of any state. Its buyers also run large distribution centers in western Sydney that serve customers across the eastern seaboard. As a result, the zone combines large multi-site programs with frequent audit and network design projects for national enterprise buyers.
How does Victoria support pharmaceutical advisory work?
Victoria held a 23.9% share of 2025 value and grows at 7.93% a year, because Melbourne hosts medicine makers, wholesalers and several GxP advisory firms. The state had about 7.05 million residents in March 2025, the second largest population of any state. CoolPac also runs packaging manufacturing and laboratory facilities in Doveton, which adds local validation capacity. In turn, Victoria generates steady temperature mapping, validation and training work for pharmaceutical and healthcare clients.
What drives cold chain advice in Queensland?
Queensland held a 19.8% share of 2025 value and grows at 8.43% a year, because horticulture, meat and seafood exporters rely on long refrigerated routes to ports and airports. The state had about 5.65 million residents in March 2025, the third largest population of any state. Leafy vegetable and melon producers must also register under the produce safety standards that took effect in February 2025. As a result, Queensland adds produce safety audits and network design work for food producers and exporters.
Why are western and Southern Australia growing fastest?
Western and Southern Australia held a 24.0% share of 2025 value and grow fastest at 8.73% a year. Western Australia grew 2.3% in the year to March 2025, the fastest rate of any state, and reached about 3.03 million residents. South Australia added about 1.90 million residents, and both states export grain, meat, wine and seafood. In turn, new cold stores and distribution sites in these states lift design and mapping work.
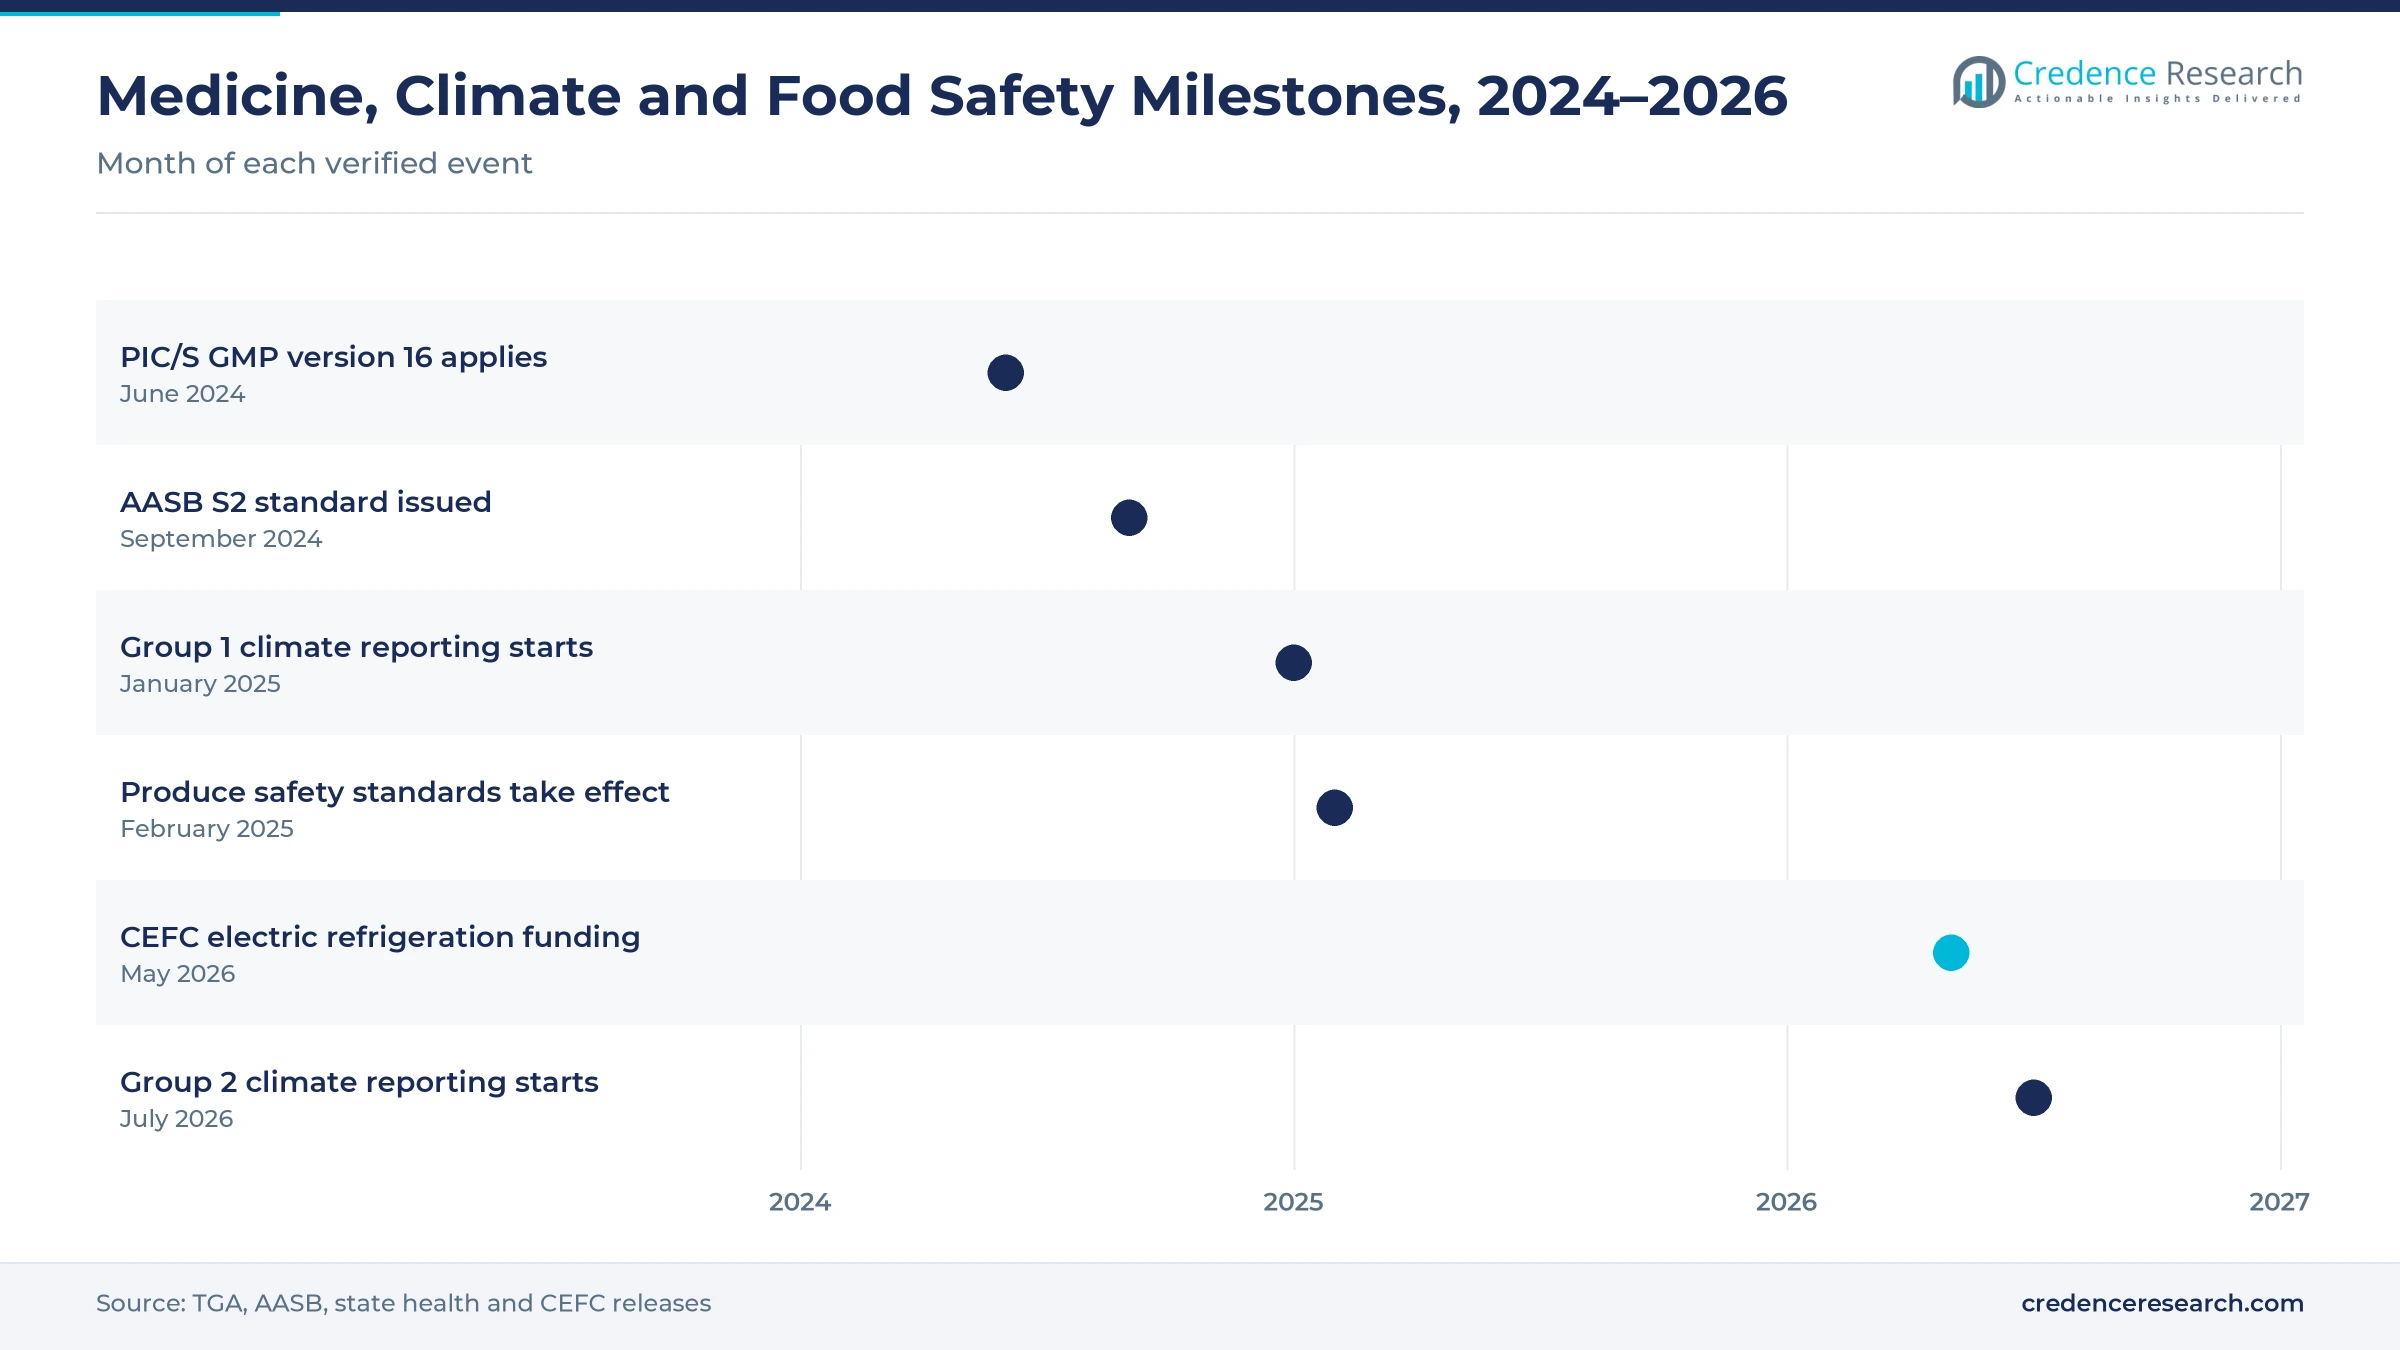
GMP, climate reporting and produce safety milestones
| Development | Status and market relevance |
|---|---|
| In June 2024, the Therapeutic Goods Administration applied version 16 of the PIC/S Guide to GMP for medicine manufacturing. | Raised validation and documentation work for medicine makers |
| In September 2024, the AASB issued the AASB S2 climate disclosure standard covering Scope 1, Scope 2 and Scope 3 emissions. | Set the measurement rules for refrigeration and freight emissions |
| In January 2025, mandatory climate reporting began for Group 1 entities with financial years starting on or after Jan. 1, 2025. | Created the first wave of climate readiness briefs |
| In February 2025, national food safety standards for berries, leafy vegetables and melons took effect. | Added produce safety and temperature control audits |
| In May 2026, the Clean Energy Finance Corporation committed up to A$10 million for Sunswap electric refrigeration units. | Supports electric refrigeration trials across fleets |
Mapping, monitoring and traceability tools underpin advice
- Temperature mapping studies measure air temperature across cold rooms, warehouses and vehicles under load, which shows hot and cold spots before products are stored there.
- Wireless monitoring loggers send real-time readings to cloud dashboards, which lets advisers and quality staff review alarms and trends between site visits.
- Time-temperature integrators record the cumulative heat exposure of a pallet or carton, which helps buyers judge shelf life and accept or reject stock.
- GS1 barcodes and traceability data link batch, location and temperature records to each item, which speeds recalls and supports audits across trading partners.
Need a Custom Version of This Report?
Tailor the scope, geography, or segments to your exact requirements.
- Custom geography or segment scope
- Direct access to our analyst team
GxP specialists and supply network advisers compete
Competition combines GxP quality specialists that serve medicine makers and wholesalers with supply network advisers that design warehouses and freight networks. PharmOut offers temperature mapping with its own equipment, calibration data and wireless monitoring, and runs offices in Australia and across Asia. SeerPharma has provided GxP and quality assurance training since 1989 and also offers consulting from development to commercial manufacturing. Logistics Bureau, founded in 1997 and based in Sydney, offers supply chain consulting, education and benchmarking. GS1 Australia supports traceability standards, while Keep It Cool Consulting helps refrigerated transport and warehouse operators improve temperature control. CoolPac in Doveton, Victoria, adds packaging qualification, validation and temperature mapping. Rivals compete on regulatory knowledge, mapping equipment, sector references and the ability to combine audits with design advice.
Which advisers shape temperature control practice?
| Company | Type | Role in the market |
|---|---|---|
| PharmOut | GxP consultancy | Offers GMP temperature mapping with in-house equipment |
| SeerPharma | GxP training and compliance | Provides GxP and quality training since 1989 |
| Logistics Bureau | Supply network consultancy | Sydney-based supply chain consulting since 1997 |
| GS1 Australia | Standards body | Co-convenes the national GS1 traceability advisory group |
| Keep It Cool Consulting | Cold chain specialist | Advises refrigerated transport and warehouse operators |
| CoolPac | Packaging and validation | Offers packaging qualification and temperature mapping |
Credence Research view on temperature control advice
Credence Research's view is that Australian temperature control advice will grow steadily because medicine, food and climate rules all require buyers to prove what happens at each handover point. Compliance assurance remains the largest fee pool, yet technology advisory adds the fastest growth as fleets electrify and sensors spread. Mandatory climate reporting widens the buyer base each year to 2027. Advisers that combine GxP knowledge, network design and emissions accounting should gain the most share by 2035.
How the advisory fee estimate was built
The report uses 2025 as the base year on a calendar basis, and market values come from the Credence Research model. That model combines government studies on cold chain food loss and equipment stock, regulator guidance on medicine and produce safety, accounting standards and laws on climate reporting, and national population data. Segment splits and zone growth rates are Credence Research estimates, while zone shares follow the client-provided split. Sources used are government, regulator, standard-setter, agency and company publications, and no interviews or surveys were used.
Wider climate reporting keeps advisory demand rising to 2035
The Australia cold chain consulting market is expected to reach USD 255.2 million by 2035, an 8.26% CAGR during 2026–2035, as medicine distribution checks, food loss programs and climate reporting keep buyers hiring specialists. Growth should be strongest in technology advisory, pharmaceuticals and healthcare, and the western zone, because these areas gain most from new sites, sensors and tighter rules. Tight budgets and a shortage of specialists could slow some projects, while Group 3 reporting from 2027 should add many first-time clients.
Frequently Asked Questions
How big is the Australia cold chain consulting market?
Which service type leads advisory revenue?
Which region leads the market?
How much food is lost in the Australian cold chain?
When did mandatory climate reporting start?
What temperature range applies to vaccine storage?
Who are the leading companies in the market?
What are the main challenges for advisers?
Table of Content
Chapter 1 Market Segmentation
- 1.1 Segmentation Framework
- 1.1.1 Product and Service Classification
- 1.1.2 Application and End-Use Classification
- 1.1.3 Technology and Solution Classification
- 1.1.4 Customer and Distribution Channel Classification
- 1.1.5 Geographic Segmentation
- 1.1.6 Market Segment Definitions and Boundaries
- 1.2 By Service Type
- 1.2.1 Compliance assurance
- 1.2.2 Network design
- 1.2.3 Technology advisory
- 1.2.4 Strategic advisory
- 1.3 By End-Use Industry
- 1.3.1 Food production and export
- 1.3.2 Pharmaceuticals and healthcare
- 1.3.3 Grocery retail
- 1.3.4 Cold-chain logistics
- 1.4 By Customer Type
- 1.4.1 National enterprise buyers
- 1.4.2 Regional enterprise buyers
- 1.4.3 Public-sector buyers
- 1.5 By Delivery Model
- 1.5.1 On-site delivery
- 1.5.2 Remote delivery
- 1.5.3 Hybrid delivery
Chapter 2 Introduction
- 2.1 Report Objectives and Scope
- 2.2 Product Definition and Industry Terminology
- 2.3 Market Inclusions and Exclusions
- 2.4 Research Process
- 2.4.1 Primary Research and Expert Interviews
- 2.4.2 Secondary Research and Source Review
- 2.4.3 Top-Down and Bottom-Up Estimation
- 2.4.4 Data Triangulation and Verification
- 2.5 Market Size Measurement Basis
- 2.5.1 2025: USD 109.5 million → 2035: USD 255.2 million
- 2.6 Historical and Forecast Reference Periods
- 2.6.1 Historical Period: 2018-2025
- 2.6.2 Base Year: 2025
- 2.6.3 Forecast Period: 2025-2035
- 2.7 Research Assumptions and Limitations
Chapter 3 Executive Summary
- 3.1 Market Snapshot and Key Findings
- 3.2 Base-Year Market Size, 2025
- 3.3 Forecast Market Size, 2035
- 3.4 Revenue and Volume Growth Outlook
- 3.5 Key Demand and Supply Indicators
- 3.6 Leading Market Segments
- 3.7 Fastest-Growing Market Opportunities
- 3.8 Regional Performance Highlights
- 3.9 Technology and Industry Transformation
- 3.10 Competitive Landscape Summary
- 3.11 Analyst View and Strategic Implications
Chapter 4 Australia Cold Chain Consulting Market Trends and Developments
- 4.1 Historical Industry Development, 2018-2025
- 4.2 Recent Market Trends and Developments
- 4.3 Demand and Customer Behavior Trends
- 4.4 Technology and Product Innovation
- 4.5 Artificial Intelligence, Automation and Digitalization
- 4.6 Local Manufacturing and Supply Chain Realignment
- 4.7 Industry Partnerships, Mergers and Acquisitions
- 4.8 Sustainability and Circular Economy Developments
- 4.9 Government and Private Sector Investment Trends
- 4.10 Emerging Business Models and Commercialization
- 4.11 Industry Developments and Announcements
Chapter 5 Australia Cold Chain Consulting Market Supply and Demand Analysis
- 5.1 Demand Trend and Consumption Analysis, 2018-2025
- 5.2 Demand Forecast, 2025-2035
- 5.3 Supply Chain Structure and Procurement Trends
- 5.4 Supply-Demand Gap and Bottlenecks
- 5.5 Import Dependence and Sourcing Structure
- 5.6 Regional Supply and Demand Concentration
Chapter 6 Australia Cold Chain Consulting Market Pricing Analysis
- 6.1 Pricing Structure and Measurement
- 6.2 Historical Pricing Trends, 2018-2025
- 6.3 Pricing Outlook, 2025-2035
- 6.4 Pricing by Product and Market Segment
- 6.5 Geographic Pricing Differences
- 6.6 Key Input, Energy, Labor and Logistics Costs
- 6.7 Contract Pricing and Purchasing Models
- 6.8 Pricing Sensitivity and Competitive Positioning
- 6.9 Price, Margin and Profitability Implications
Chapter 7 Australia Cold Chain Consulting Market Dynamics
- 7.1 Market Growth Drivers
- 7.1.1 Demand-Side Drivers
- 7.1.2 Technology and Innovation Drivers
- 7.1.3 Infrastructure and Investment Drivers
- 7.1.4 Regulatory and Policy Drivers
- 7.2 Market Restraints
- 7.2.1 Cost and Affordability Constraints
- 7.2.2 Technology and Adoption Barriers
- 7.2.3 Supply Chain and Operational Constraints
- 7.3 Market Challenges
- 7.3.1 Competitive Pressure and Margin Erosion
- 7.3.2 Skills, Infrastructure and Implementation Gaps
- 7.4 Emerging Market Opportunities
- 7.5 Market Dynamics Impact and Time-Horizon Assessment
Chapter 8 Australia Cold Chain Consulting Value Chain Analysis
- 8.1 Industry Value Chain Overview
- 8.2 Upstream Suppliers and Critical Inputs
- 8.3 Technology and Component Providers
- 8.4 Manufacturing or Service Delivery
- 8.5 Distribution, Channel Partners and Integrators
- 8.6 Downstream Applications and End Users
- 8.7 Value Addition and Profit Pools
- 8.8 Vertical Integration and Outsourcing
- 8.9 Supplier Concentration and Risk
- 8.10 Supply Chain Localization and Resilience
Chapter 9 Australia Cold Chain Consulting Market Regulations and Policies
- 9.1 Relevant Laws, Standards and Compliance Frameworks
- 9.2 Product, Service, Safety and Quality Requirements
- 9.3 Government Policies, Incentives and Subsidies
- 9.4 Imports, Exports and Trade Barriers
- 9.5 Public Procurement and Local Content Requirements
- 9.6 Data Protection, AI and Cybersecurity Compliance
- 9.7 Upcoming Policy Changes and Market Implications
Chapter 10 Australia Cold Chain Consulting Market Hotspots and Opportunities
- 10.1 Market Opportunity Mapping and Growth Hotspots
- 10.2 High-Growth Applications and Customer Groups
- 10.3 Underserved Markets and White-Space Opportunities
- 10.4 Emerging Technology and Product Opportunities
- 10.5 New Capacity and Investment Hotspots
- 10.6 Market Entry and Expansion Opportunities
- 10.7 Distribution and Partnership Opportunities
- 10.8 Near-Term and Long-Term Commercial Potential
- 10.9 Opportunity Attractiveness and Execution Risks
Chapter 11 Australia Cold Chain Consulting Market Outlook, 2025-2035
- 11.1 Market Size and Analysis
- 11.1.1 Revenue (Market Measurement: 2025: USD 109.5 million → 2035: USD 255.2 million)
- 11.1.2 Historical Market Size, 2018-2025
- 11.1.3 Base-Year Market Size, 2025
- 11.2 Market Forecast, 2025-2035
- 11.2.1 Revenue Forecast to 2035
- 11.2.2 CAGR and Year-on-Year Growth
- 11.2.3 Incremental Revenue Opportunity
- 11.3 Forecast Assumptions and Scenario Analysis
- 11.3.1 Base-Case Forecast
- 11.3.2 Optimistic and Conservative Scenarios
- 11.3.3 Technology, Pricing and Policy Sensitivities
- 11.4 Market Attractiveness and Growth Outlook
Chapter 12 Australia Cold Chain Consulting Market Segmentation and Outlook
- 12.1 Segmentation Summary and Market Shares, 2025
- 12.2 Largest and Fastest-Growing Segments
- 12.3 By Service Type - Market Size and Forecast, 2025-2035
- 12.3.1 Segment Definition and Scope
- 12.3.2 Historical Market Size, 2018-2025
- 12.3.3 Revenue Forecast, 2025-2035
- 12.3.4 Base-Year Market Share, 2025
- 12.3.5 Segment CAGR and Growth Drivers
- 12.3.6 Subsegment Market Size and Forecast
- 12.3.6.1 Compliance assurance
- 12.3.6.2 Network design
- 12.3.6.3 Technology advisory
- 12.3.6.4 Strategic advisory
- 12.3.7 Subsegment Pricing and Adoption Trends
- 12.3.8 Leading Suppliers and Competition
- 12.3.9 Regional Demand and Opportunities
- 12.4 By End-Use Industry - Market Size and Forecast, 2025-2035
- 12.4.1 Segment Definition and Scope
- 12.4.2 Historical Market Size, 2018-2025
- 12.4.3 Revenue Forecast, 2025-2035
- 12.4.4 Base-Year Market Share, 2025
- 12.4.5 Segment CAGR and Growth Drivers
- 12.4.6 Subsegment Market Size and Forecast
- 12.4.6.1 Food production and export
- 12.4.6.2 Pharmaceuticals and healthcare
- 12.4.6.3 Grocery retail
- 12.4.6.4 Cold-chain logistics
- 12.4.7 Subsegment Pricing and Adoption Trends
- 12.4.8 Leading Suppliers and Competition
- 12.4.9 Regional Demand and Opportunities
- 12.5 By Customer Type - Market Size and Forecast, 2025-2035
- 12.5.1 Segment Definition and Scope
- 12.5.2 Historical Market Size, 2018-2025
- 12.5.3 Revenue Forecast, 2025-2035
- 12.5.4 Base-Year Market Share, 2025
- 12.5.5 Segment CAGR and Growth Drivers
- 12.5.6 Subsegment Market Size and Forecast
- 12.5.6.1 National enterprise buyers
- 12.5.6.2 Regional enterprise buyers
- 12.5.6.3 Public-sector buyers
- 12.5.7 Subsegment Pricing and Adoption Trends
- 12.5.8 Leading Suppliers and Competition
- 12.5.9 Regional Demand and Opportunities
- 12.6 By Delivery Model - Market Size and Forecast, 2025-2035
- 12.6.1 Segment Definition and Scope
- 12.6.2 Historical Market Size, 2018-2025
- 12.6.3 Revenue Forecast, 2025-2035
- 12.6.4 Base-Year Market Share, 2025
- 12.6.5 Segment CAGR and Growth Drivers
- 12.6.6 Subsegment Market Size and Forecast
- 12.6.6.1 On-site delivery
- 12.6.6.2 Remote delivery
- 12.6.6.3 Hybrid delivery
- 12.6.7 Subsegment Pricing and Adoption Trends
- 12.6.8 Leading Suppliers and Competition
- 12.6.9 Regional Demand and Opportunities
- 12.7 Segment Growth Comparison
- 12.8 Segment Attractiveness and Priority Matrix
Chapter 13 Australia Cold Chain Consulting End-Use and Application Market Outlook
- 13.1 End-Use Industry and Customer Demand Structure
- 13.2 Leading Applications and Customer Groups
- 13.3 End-Use Market Size, Share and Forecast
- 13.4 Major End-Use Industry Deep Dives
- 13.4.1 Customer Requirements and Use Cases
- 13.4.2 Demand and Replacement Cycles
- 13.4.3 Technical and Regulatory Considerations
- 13.4.4 Purchasing and Procurement Models
- 13.4.5 Leading Vendors and Distribution Channels
- 13.4.6 Forecast and Commercial Opportunities
- 13.5 Emerging Applications and Cross-Segment Demand
- 13.6 End-Use Industry Investment Priorities
Chapter 14 Australia Cold Chain Consulting Geographic Market Outlook, 2025-2035
- 14.1 Domestic Market Distribution and Demand Clusters
- 14.2 State- or Province-Wise Market Size and Forecast, 2025-2035
- 14.3 City and Metropolitan Market Outlook
- 14.4 Industrial, Manufacturing and Commercial Clusters
- 14.5 Geographic Concentration of Key End Users
- 14.6 Local Pricing and Purchasing Differences
- 14.7 Domestic Production Facilities and Capacity Map
- 14.8 Local Infrastructure and Project Pipeline
- 14.9 State-Level Policy and Incentive Differences
- 14.10 Subnational Investment Hotspots and Opportunities
- 14.11 Distribution and Logistics Networks
- 14.12 Domestic Competitive Footprint
Chapter 15 Australia Cold Chain Consulting Technology, Innovation and Sustainability Outlook
- 15.1 Technology Landscape and Maturity
- 15.2 Product, Process and Service Innovation
- 15.3 AI, Automation and Digital Tools in the Industry
- 15.4 Technology Adoption and Performance Benchmarking
- 15.5 Innovation Pipeline and R&D Investment
- 15.6 Energy Efficiency and Resource Management
- 15.7 Sustainability, Recycling and Circularity
- 15.8 Technology Roadmap, 2025-2035
- 15.9 Risks of Obsolescence and Technology Substitution
Chapter 16 Australia Cold Chain Consulting Market Key Strategic Imperatives
- 16.1 Growth and Market Entry Priorities
- 16.2 High-Return Products and Segments
- 16.3 Pricing, Profitability and Cost Optimization
- 16.4 Technology Investment and Product Differentiation
- 16.5 Supply Chain Localization and Resilience
- 16.6 Distribution and Customer Acquisition
- 16.7 Partnership, Acquisition and Capacity Strategy
- 16.8 Regional Expansion Priorities
- 16.9 Short-, Medium- and Long-Term Actions
Chapter 17 Competition Outlook
- 17.1 Industry Competition Characteristics
- 17.2 Market Structure and Concentration
- 17.3 Market Share and Competitive Positioning, 2025
- 17.4 Company-Wise Revenue and Product Benchmarking
- 17.5 Production and Service Capacity Benchmarking
- 17.6 Technology, Pricing and Differentiation
- 17.7 Regional Footprint and Distribution Strength
- 17.8 Mergers, Acquisitions and Strategic Alliances
- 17.9 New Entrants and Competitive Threats
- 17.10 Porter's Five Forces and Industry Attractiveness
- 17.11 Competitive Outlook, 2025-2035
Chapter 18 Company Profiles
- 18.1 Company Coverage and Selection Criteria
- 18.2 PharmOut
- 18.2.1 Business Description
- 18.2.2 Company Ownership and Geographic Presence
- 18.2.3 Product and Service Portfolio
- 18.2.4 Manufacturing and Operating Footprint
- 18.2.5 Financial Performance and Investment
- 18.2.6 Market Share and Competitive Position
- 18.2.7 Technology and Innovation Capabilities
- 18.2.8 Strategic Alliances or Partnerships
- 18.2.9 Recent Developments
- 18.2.10 Growth Strategy and Outlook
- 18.3 Logistics Bureau
- 18.4 SeerPharma
- 18.5 GxP Services
- 18.6 Keep It Cool Consulting
- 18.7 Cync³
- 18.8 Prological
- 18.9 GS1 Australia
- 18.10 Aerovanta Compliance
- 18.11 CoolPac
- 18.12 Other Relevant Market Participants
Note: Every listed company is profiled on the structure shown under the first company. The company list is preliminary and may change based on research findings, market developments, data availability and client requirements.
Chapter 19 Disclaimer
- 19.1 Research and Forecast Disclaimer
- 19.2 Data Source and Estimation Limitations
Note: The depth of individual sections depends on data availability for this market. Volume, capacity, trade and other unit-based metrics are included where applicable.

