
Parcel flights and a curfew-free Sydney hub lift freight
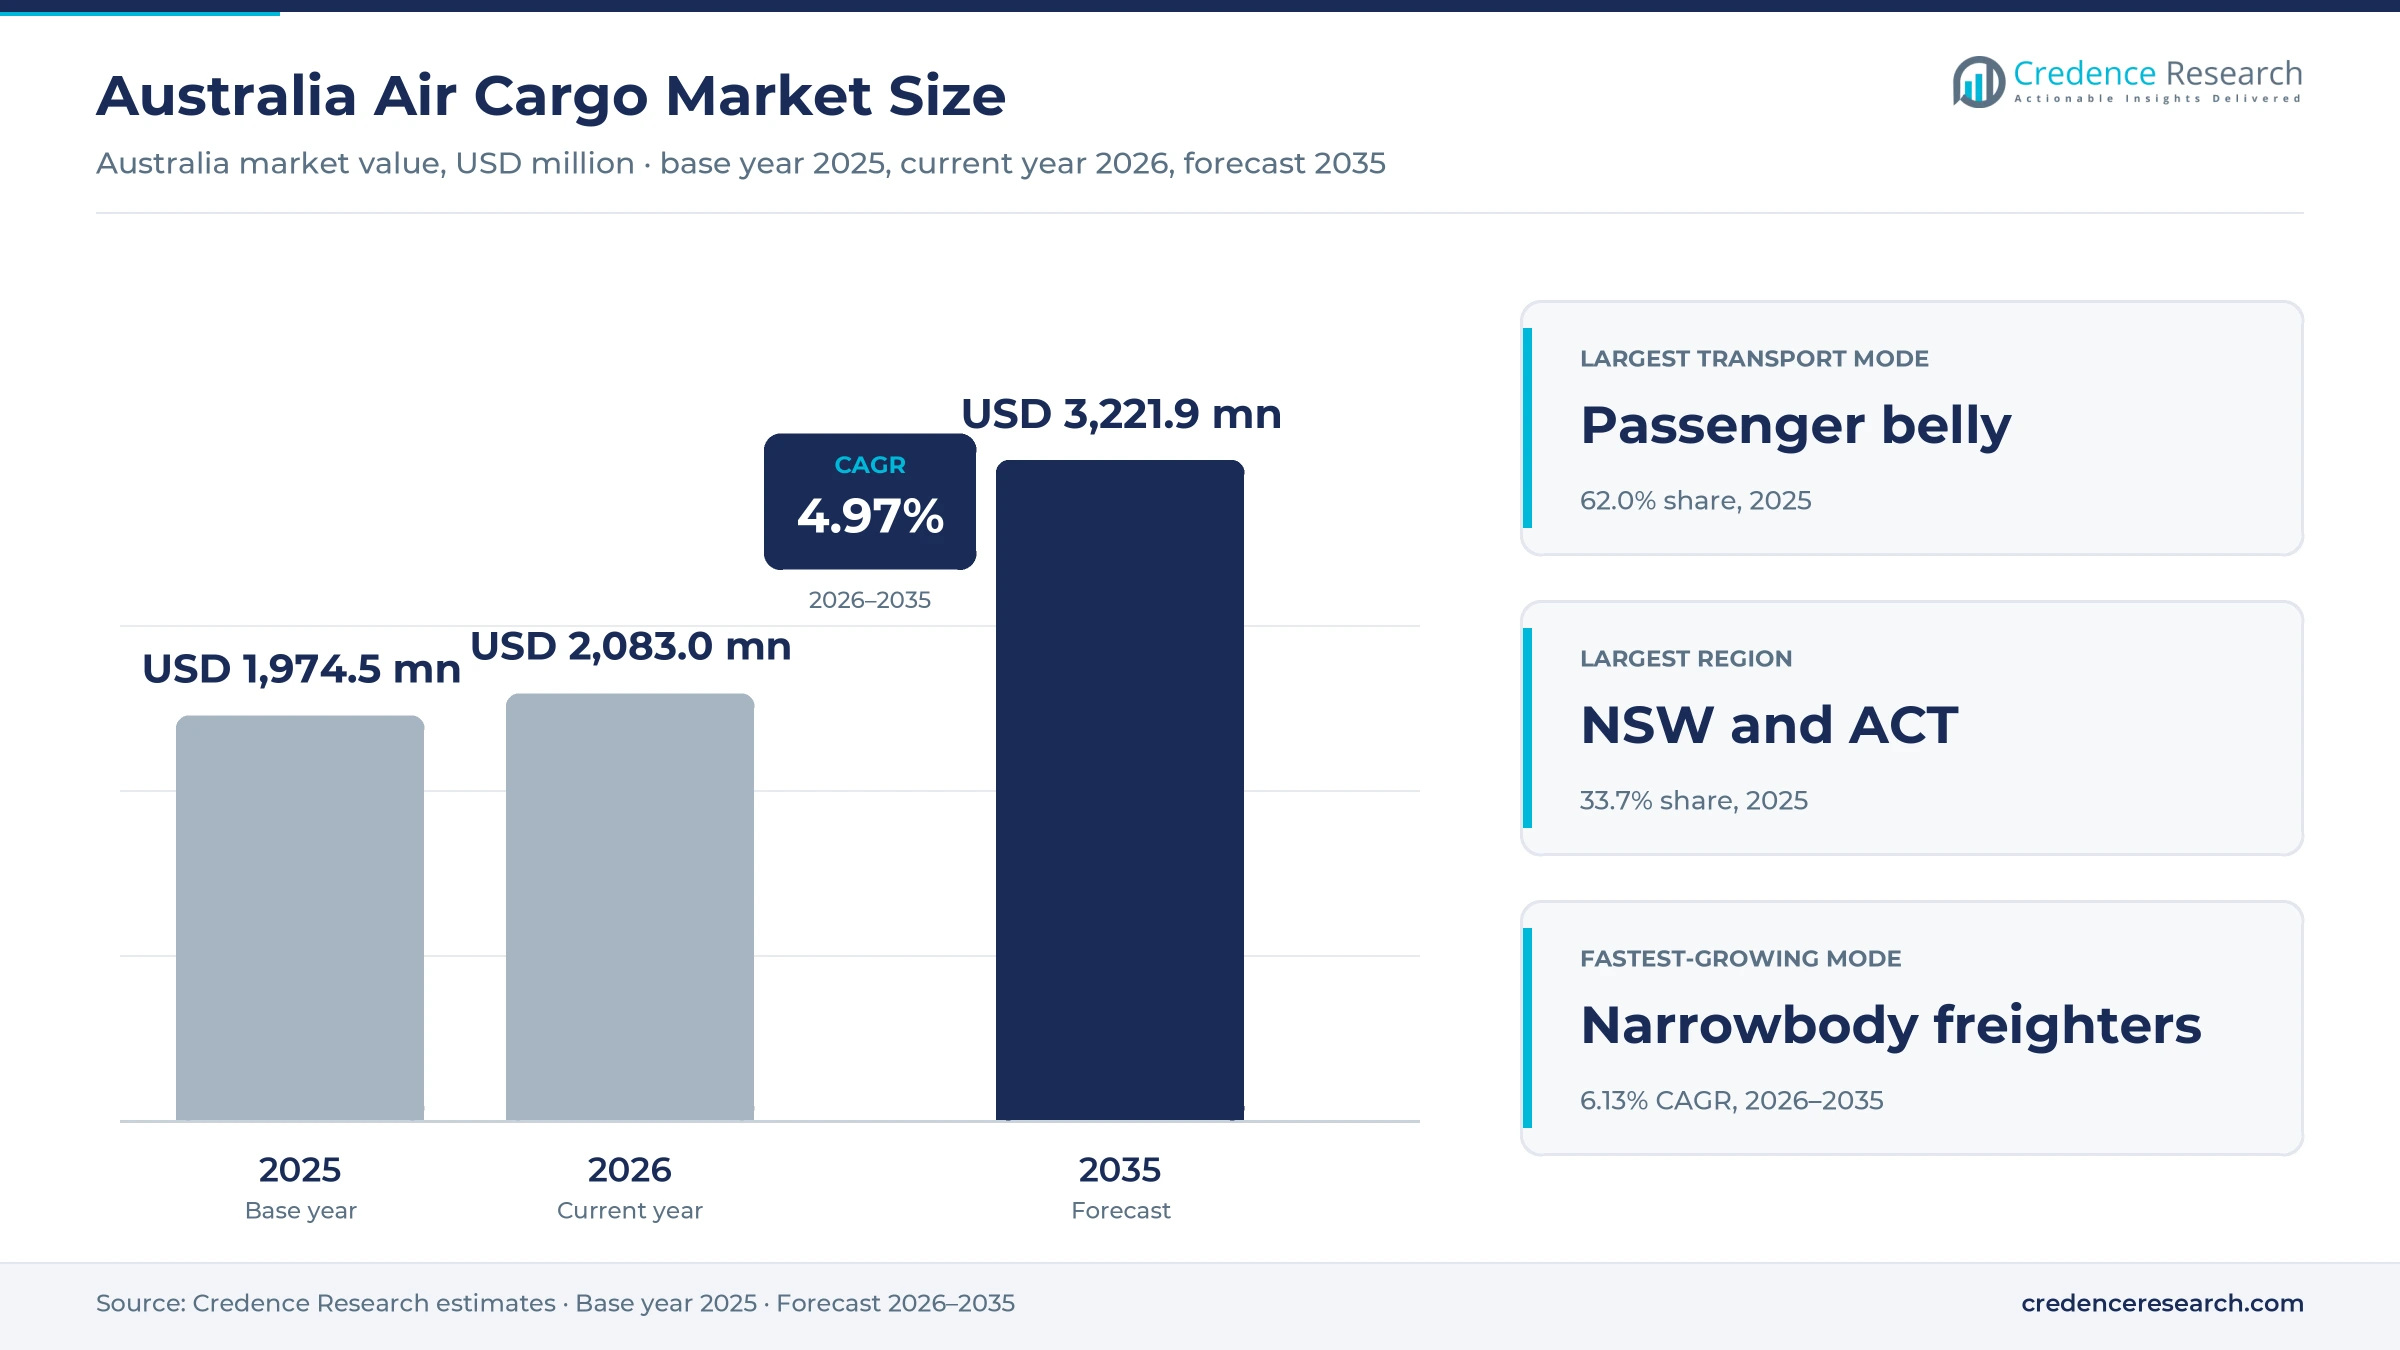
The Australia air cargo market was valued at USD 1.97 billion in 2025 and is projected to increase from USD 2.08 billion in 2026 to USD 3.22 billion by 2035, registering a CAGR of 4.97% during 2026–2035. Demand comes from parcel networks, freight forwarders, retailers, medicine suppliers and food exporters that pay airlines and integrators to move time-sensitive goods into, out of and across the country. New South Wales and the ACT held the largest regional share, 33.7% in 2025, because Sydney handles most international widebody flights and parcel sorting. The same zone is also the fastest-growing region at 5.46% a year, as Western Sydney International adds round-the-clock freight capacity. However, the move from older BAe 146 freighters to converted A321 freighters changed domestic parcel economics, because each aircraft now carries far more freight on the same overnight routes.
Which freight services and revenues does the estimate cover?
The estimate measures freight revenue earned by airlines, freighter operators and integrators for carrying cargo on international and domestic flights to, from and within Australia. It counts passenger belly capacity, widebody and narrowbody freighter services and express products sold to forwarders, express networks and direct shippers.
The estimate excludes airport charges, ground handling, customs brokerage, trucking and warehousing fees, along with mail carried under postal conventions. The value chain runs from shippers and forwarders through terminals and ground handlers to airlines, which then deliver cargo to consignees through road and parcel networks.
Australia Air Cargo Market Insights
- The Australia air cargo market was valued at USD 1.97 billion in 2025 and is projected to reach USD 3.22 billion by 2035, registering a CAGR of 4.97% during 2026–2035.
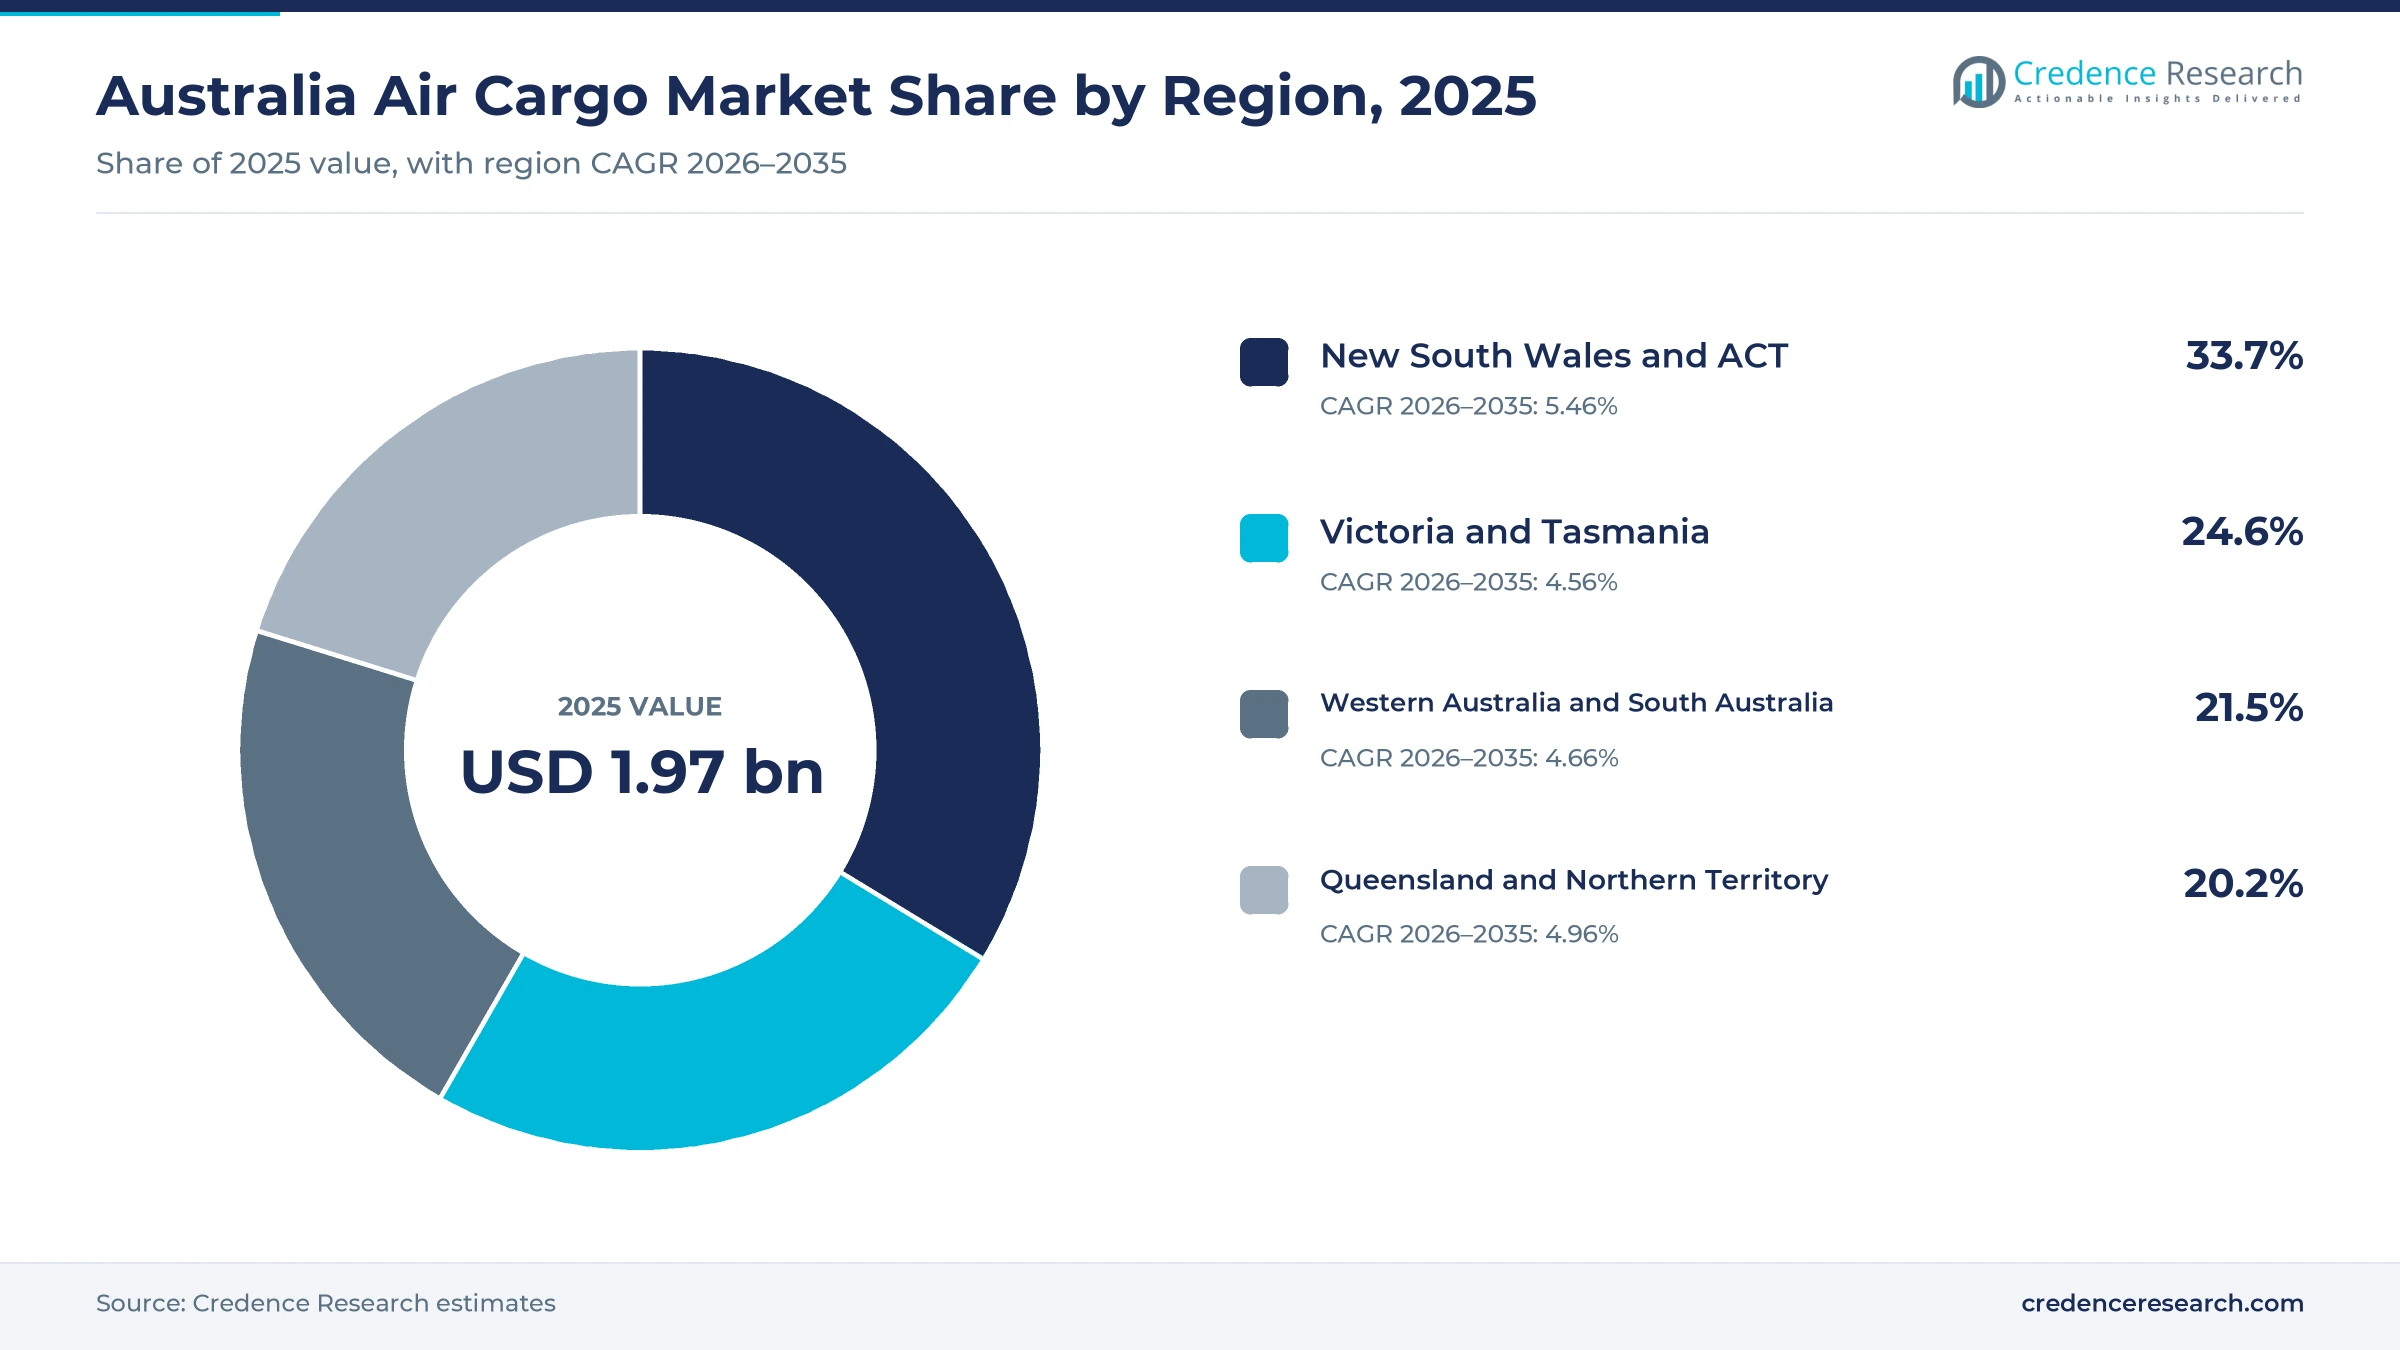
- New South Wales and the ACT held a 33.7% share of 2025 value, because Sydney concentrates international widebody flights and national parcel sorting.
- Passenger belly capacity led with a 62.0% share of 2025 value, because most international cargo still flies in the holds of scheduled passenger aircraft.
- Western Sydney International began regular freighter operations in July 2026, with a first-stage cargo precinct able to handle up to 270,000 metric tons a year.
- Narrowbody freighter capacity grows fastest at 6.13% a year during 2026–2035, as converted A321 freighters replace older BAe 146 aircraft on parcel routes.
Standard freight leads while express and freighters grow
Why does standard freight still earn the most revenue?
Based on service type, the market is categorized into standard freight, express freight and specialist freight. Standard Freight led with a 58.0% share of 2025 value, because forwarders book most general cargo on scheduled flights at standard rates. Express Freight grows fastest at 5.76% a year, as online retail and business parcels need next-day delivery across the country.
How do belly holds and freighters share the load?
Based on mode of transport, the market is categorized into passenger belly capacity, widebody freighter capacity and narrowbody freighter capacity. Passenger Belly Capacity led with a 62.0% share of 2025 value, because scheduled passenger flights carry most international cargo. Narrowbody Freighter Capacity grows fastest at 6.13% a year, as converted A321 freighters expand domestic parcel networks.
Which shipment flows generate the most revenue?
Based on shipment flow, the market is categorized into international inbound, international outbound and domestic. International Inbound led with a 44.0% share of 2025 value, because imported consumer goods, medicines and parts arrive by air from Asia, Europe and North America. International Outbound grows fastest at 5.36% a year, as perishable food and premium produce exports expand to Asian markets.
How do retail and healthcare shippers shape demand?
Based on end-use industry, the market is categorized into retail and consumer goods, healthcare and life sciences, food and horticulture, and manufacturing and business services. Retail and Consumer Goods led with a 36.0% share of 2025 value, because online retail drives parcel volumes. Healthcare and Life Sciences grows fastest at 5.80% a year, as biologic medicines and clinical supplies need fast, temperature-controlled transport.
| Segment Group | Leading Sub-segment | Share, 2025 | Fastest-growing Sub-segment | CAGR, 2026–2035 |
|---|---|---|---|---|
| By Service Type | Standard Freight | 58.0% | Express Freight | 5.76% |
| By Mode of Transport | Passenger Belly Capacity | 62.0% | Narrowbody Freighter Capacity | 6.13% |
| By Shipment Flow | International Inbound | 44.0% | International Outbound | 5.36% |
| By End-Use Industry | Retail and Consumer Goods | 36.0% | Healthcare and Life Sciences | 5.80% |
Request a Free Sample
Fill in your details and we'll send you a free sample report.
- Sample data tables & charts
- Research methodology
Parcel networks, Sydney capacity and perishables lift volume
How do time-definite parcel networks lift freight demand?
Time-definite parcel networks lift freight demand, because online shoppers and businesses expect next-day delivery between capital cities that sit thousands of kilometers apart. Australia Post grew domestic parcel volumes by 2.6% in the year to June 2025 and delivered a record 102.8 million parcels during its Christmas peak. Qantas Freight and Australia Post extended their partnership for 10 more years in October 2026, covering more than 75 million parcels and other freight items each year. Three additional A321P2F aircraft will add up to 20% capacity to the dedicated freighter network, which can uplift up to 20,000 parcels per flight. As a result, express freight grows at 5.76% a year, the fastest service type, as express delivery networks add lift.
Why does additional Sydney freight capacity matter?
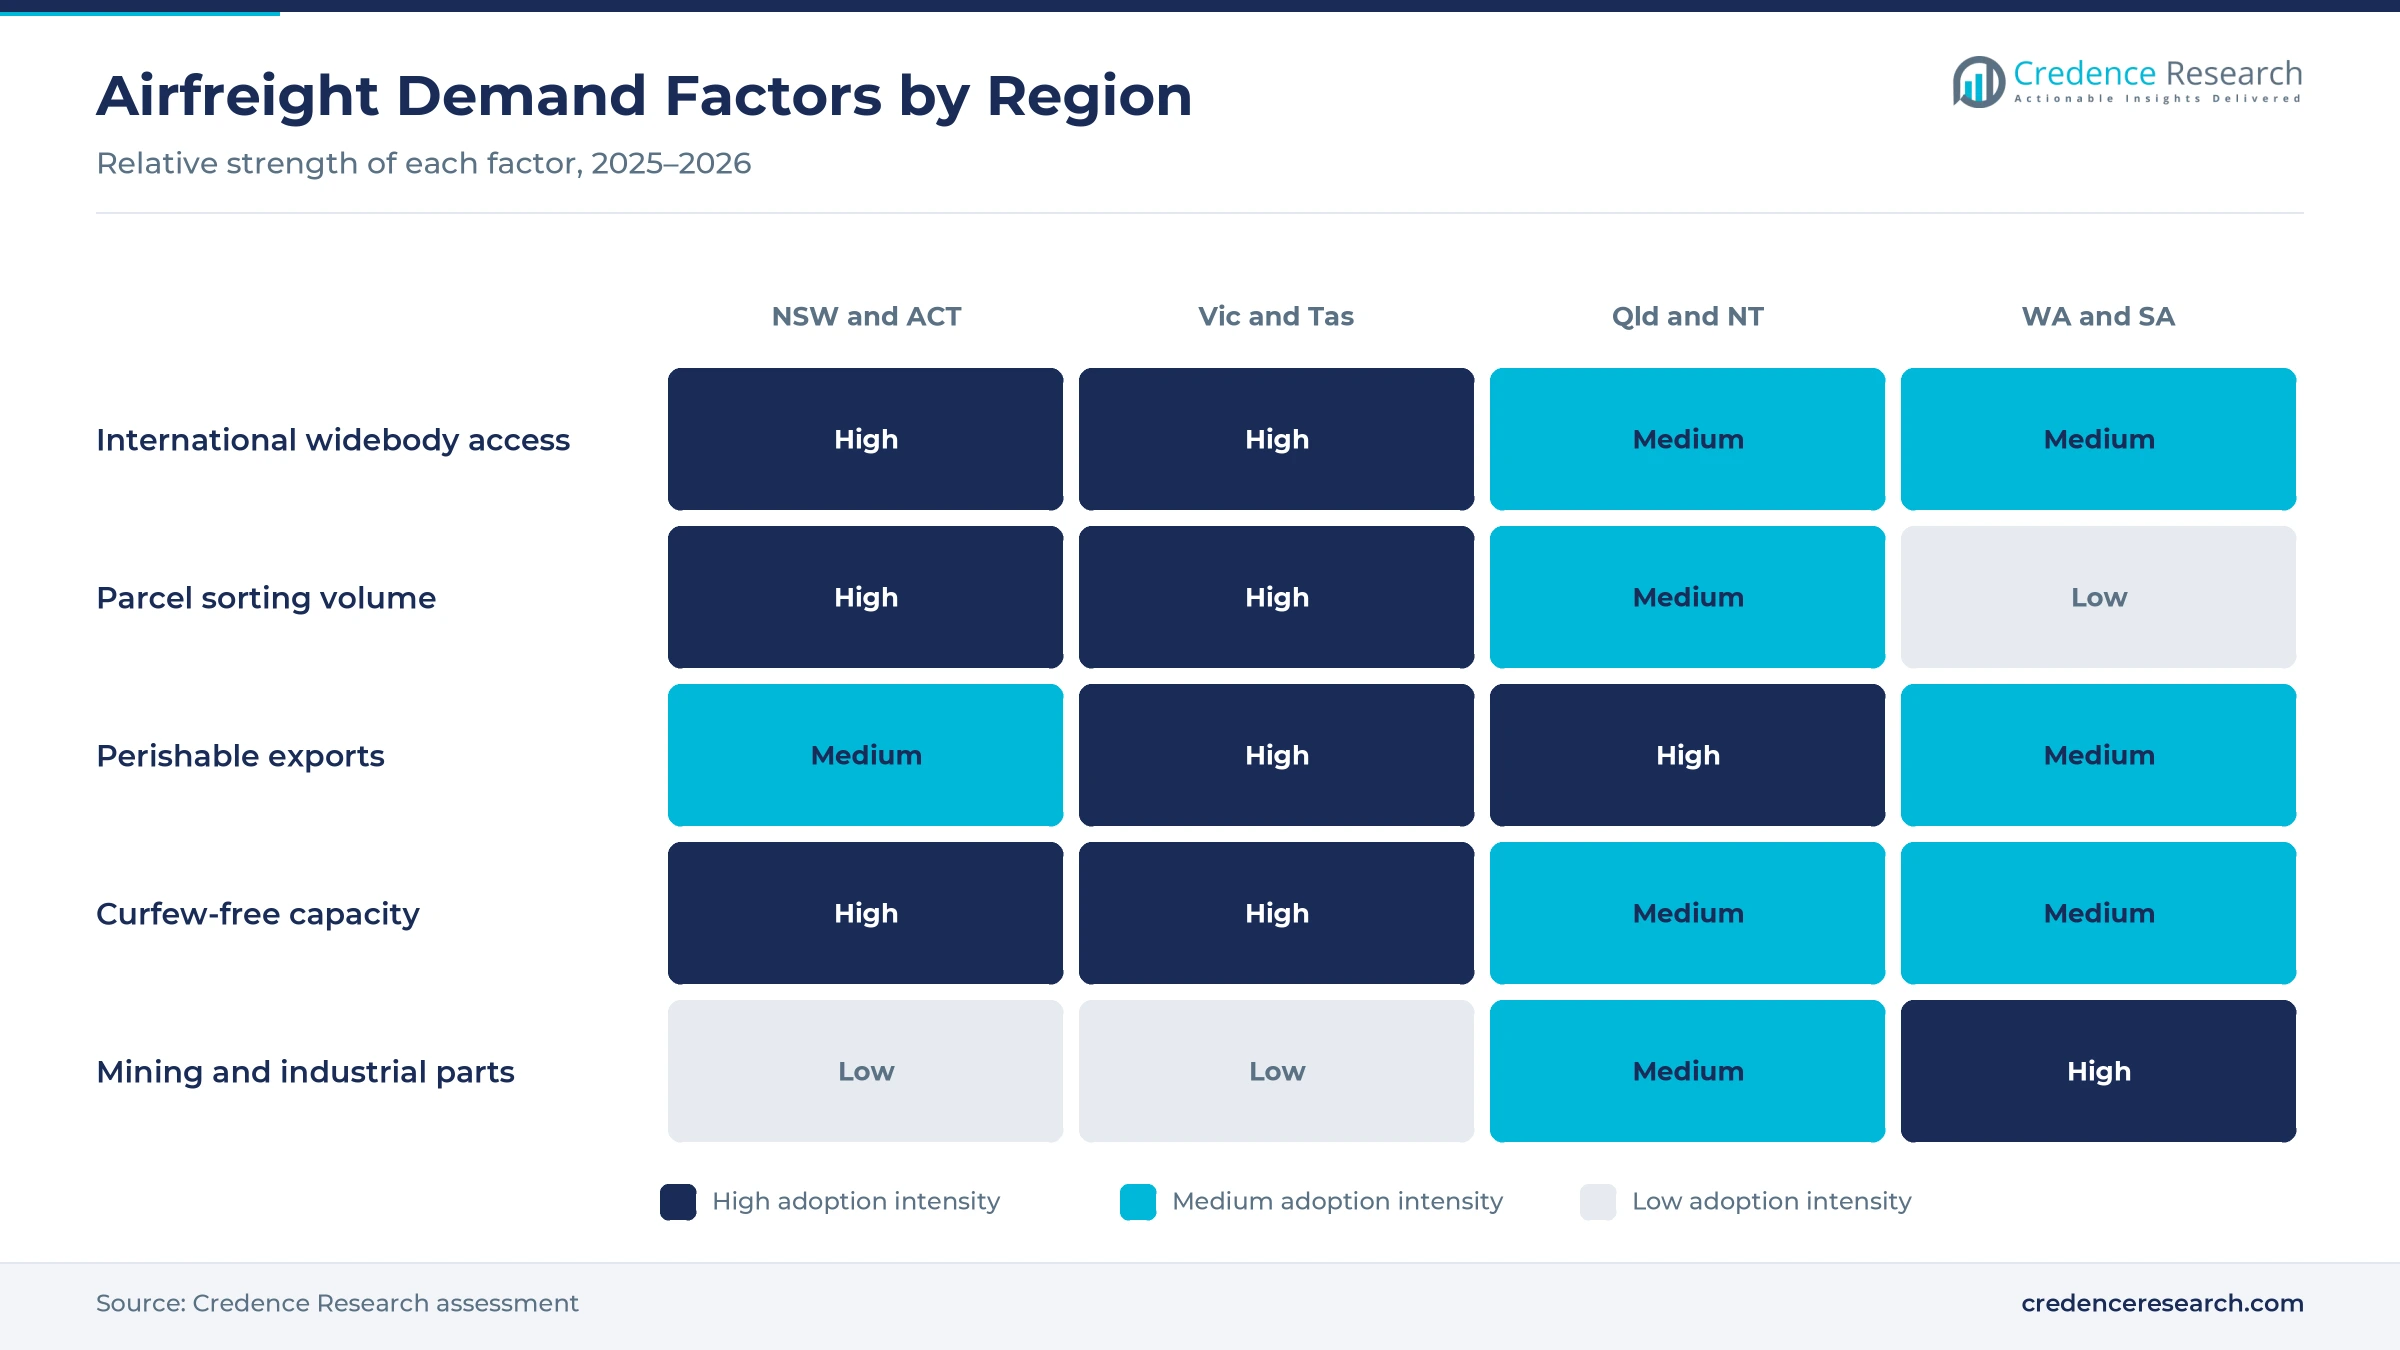
Additional Sydney freight capacity matters, because the main Sydney airport closes to most flights between 11 p.m. and 6 a.m., which limits overnight freight schedules. The national airport curfew rules apply the same 11 p.m. to 6 a.m. window at Sydney, Adelaide, Gold Coast and Essendon Fields. Western Sydney International runs 24 hours a day, and its first-stage cargo precinct can handle up to 270,000 metric tons a year, with long-term capacity of 1.8 million metric tons, according to STAT Times. Qantas started regular domestic freighter operations there on July 27, 2026, from a 24,000 square-meter terminal. In turn, New South Wales and the ACT post the fastest regional growth, as freighters shift overnight work west.
How does specialist shipment capability open new revenue?
Specialist shipment capability opens new revenue, because perishables and medicines pay premium rates for fast, temperature-controlled handling from farm or factory to the aircraft hold. Australian cherry exports reached 4,950 metric tons worth A$110.26 million in the 2025-26 season, up 22% in value, according to FreshPlaza. Air links let cherries reach key Asian markets within 72 hours of harvest, and Tasmania and Victoria supplied more than 90% of exported volume. National vaccine storage guidance also requires vaccines to stay between +2°C and +8°C, which pushes medicine shippers toward specialist products with active containers. As a result, healthcare and life sciences grow at 5.80% a year, the fastest end use during 2026–2035.
Why does Asian trade growth support international lift?
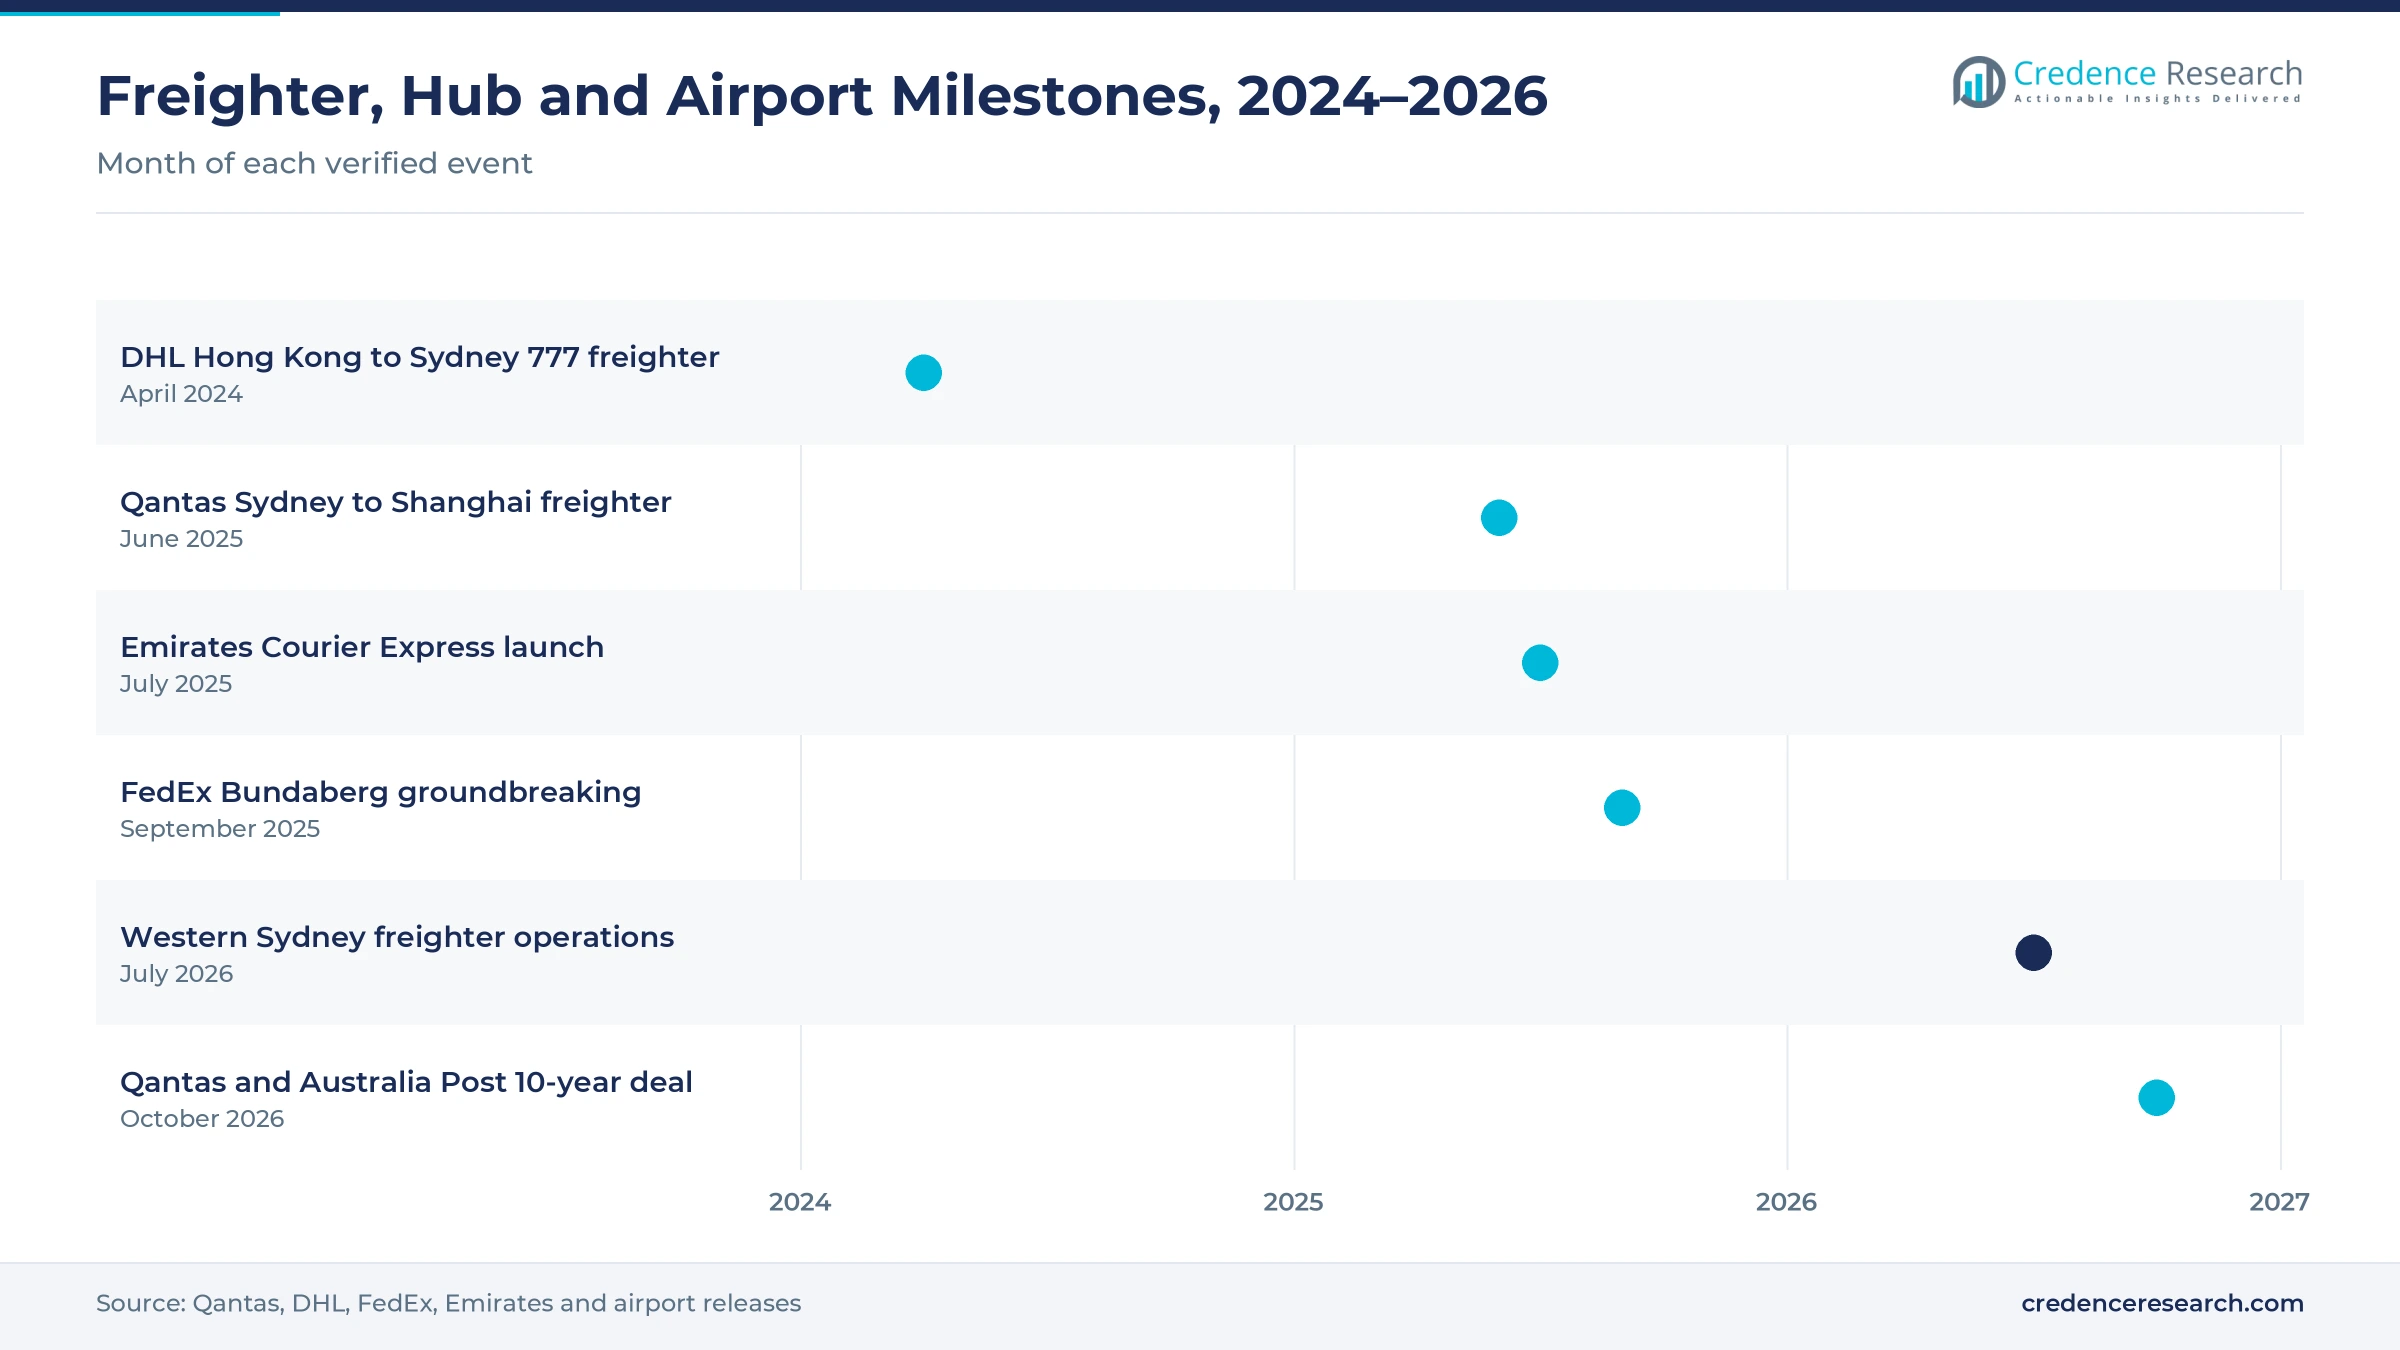
Asian trade growth supports international lift, because most imported parcels, parts and medicines reach Australia from Asian hubs on belly and freighter flights. Global air cargo demand rose 3.4% in 2025, and Asia Pacific carriers grew 8.4%, according to IATA. DHL Express introduced a Boeing 777 freighter between Hong Kong and Sydney in April 2024, flying five times a week with up to 105 tons per flight. Qantas Freight also planned twice-weekly A330 freighter flights between Sydney and Shanghai from June 26, 2025, which added direct capacity to China. In turn, international inbound flows hold 44.0% of 2025 value, as freight forwarding firms book more Asian capacity.
Narrowbody freighters and integrator hubs reshape networks
How is the shift to converted narrowbody freighters changing networks?
The shift to converted narrowbody freighters is changing domestic networks, because operators replace older four-engine BAe 146 aircraft with larger, more efficient A321 conversions. Qantas Freight received the first of three additional A321P2F aircraft in October 2026, and the other two are due by March 2027. Each A321P2F carries more freight than the BAe 146-300 it replaces on overnight parcel routes. Earlier, temporary curfew dispensations from May 2020 to March 2024 let Boeing 737 and Airbus A320 freighters replace some BAe 146 flights in Sydney, capped at 80 movements a week. As a result, narrowbody freighter capacity grows at 6.13% a year, the fastest transport mode during 2026–2035.
Why is the rise of integrator hubs reshaping express flows?
The rise of integrator hubs is reshaping express flows, because global express groups want their own sorting sites and courier links in growing regional markets. FedEx broke ground on a new regional facility in Bundaberg, Queensland, in September 2025, with operations expected in 2026. Emirates SkyCargo launched its Emirates Courier Express service in Australia in July 2025, with Team Global Express as its local partner. DHL Express also adds more than 500 tons of weekly payload with its Hong Kong to Sydney freighter service. In turn, express networks link air sectors with e-commerce fulfillment sites, which shortens delivery times for online retailers across the country.
Can perishable exports open more outbound capacity?
Perishable exports can open more outbound capacity, because growers and meat and seafood packers ship premium products to Asian buyers who pay for freshness. New South Wales horticulture exports rose 27% to A$432 million in 2024-25, and exports to China reached A$86 million, up 39%. Agriculture, fisheries and forestry exports reached A$75.6 billion in 2023-24, and about 70% of farm production is exported. Table grape export volumes from New South Wales also rose 48% in 2024-25, which adds seasonal demand for chilled air space. As a result, international outbound flows grow at 5.36% a year, the fastest shipment flow, as exporters fill return legs.
Is there room for growth in Western Sydney belly capacity?
Western Sydney belly capacity offers room for growth, because passenger flights from the new airport add hold space without the old curfew limits. Jetstar is scheduled to fly the first commercial passenger service at Western Sydney International on Oct. 25, 2026, and Qantas follows on March 28, 2027, according to Qantas. The new Qantas freight terminal there is expected to handle more than 850 tons of freight per week. Menzies Aviation, dnata Cargo, Texel Air and Team Global Express also operate in the cargo precinct. In turn, passenger belly capacity keeps 62.0% of 2025 value, while handlers order more unit load devices for new routes.
Curfews, belly dependence and costs limit freight growth
How do airport curfews limit overnight freight?
Airport curfews limit overnight freight, because Sydney, Adelaide and Gold Coast airports restrict most jet movements between 11 p.m. and 6 a.m. As a result, carriers squeeze parcel flights into narrow evening and early morning windows, which raises peak handling costs. Operators respond by moving some freighters to Western Sydney and other curfew-free airports, which spreads sorting across the night. This pressure eases only as Western Sydney freighter traffic builds over time.
Why does reliance on belly capacity create volatility?
Reliance on belly capacity creates volatility, because most international cargo depends on passenger schedules that airlines set for travel demand rather than freight needs. In turn, cargo space can shrink quickly when airlines cut routes, change aircraft or face shocks such as border closures. Forwarders respond with block space agreements and charter freighters, which secure capacity at a higher cost. This risk keeps demand steady for dedicated freighter services on key routes.
How do fuel and aircraft costs squeeze margins?
Fuel and aircraft costs squeeze margins, because jet fuel, freighter conversions and leased aircraft make up a large share of airline operating costs. As a result, carriers on thin domestic routes struggle to pass every cost increase to price-sensitive shippers. Operators respond with fuel surcharges, newer aircraft and long-term contracts that share costs with parcel partners. This challenge favors carriers that hold large anchor customers and long contracts.
Why do long distances and thin regional demand limit routes?
Long distances and thin regional demand limit routes, because many regional cities generate too little freight to fill dedicated aircraft every night. In turn, shippers in those areas rely on trucks or passenger flights with small holds, which slows delivery times. Carriers respond by linking regional stops into multi-sector routes and pooling freight with postal partners. This constraint keeps most freighter activity on capital city routes.
New South Wales leads as Western Sydney adds freighter slots
| Region | Value, 2025 (USD billion) | Share, 2025 | CAGR, 2026–2035 |
|---|---|---|---|
| New South Wales and ACT | 0.67 | 33.7% | 5.46% |
| Victoria and Tasmania | 0.49 | 24.6% | 4.56% |
| Western Australia and South Australia | 0.42 | 21.5% | 4.66% |
| Queensland and Northern Territory | 0.40 | 20.2% | 4.96% |
Why do New South Wales and the ACT hold the top share?
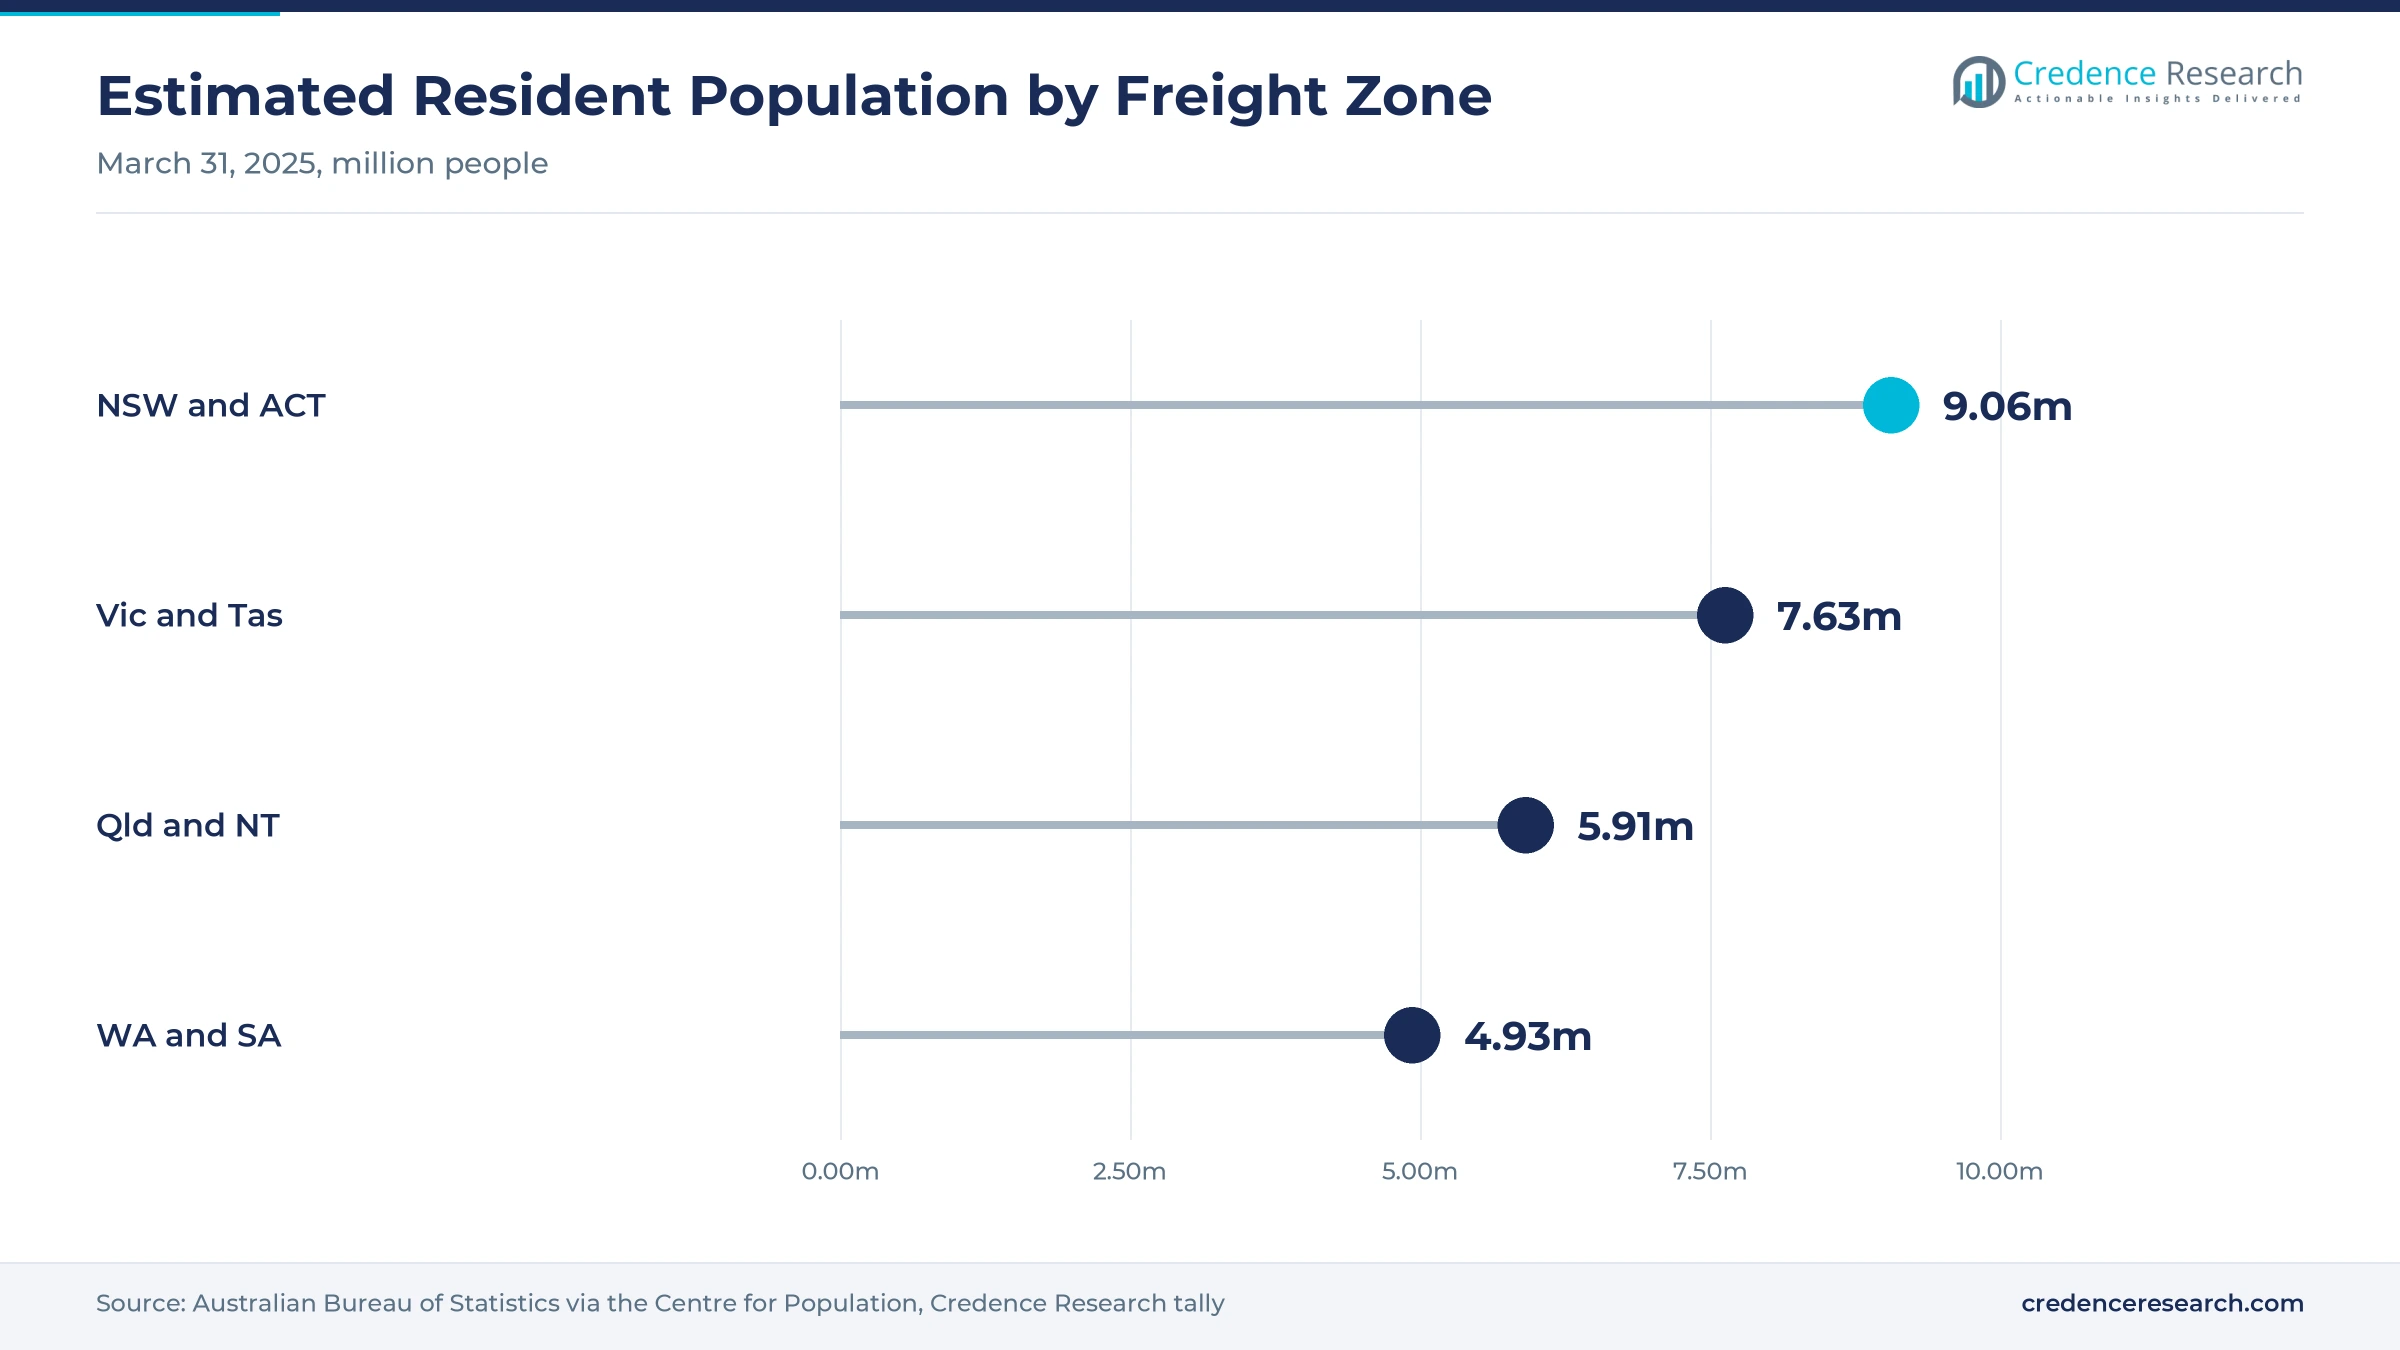
New South Wales and the ACT held a 33.7% share of 2025 value and grow fastest at 5.46% a year, because Sydney handles the most international widebody flights. The two jurisdictions had about 9.06 million residents in March 2025, the largest population of any zone. Western Sydney International also began regular freighter operations in July 2026 without a curfew. As a result, the zone combines the largest import base with new overnight freighter capacity.
How do Victoria and Tasmania support outbound perishables?
Victoria and Tasmania held a 24.6% share of 2025 value and grow at 4.56% a year, because Melbourne operates a curfew-free international airport with strong freighter links. The two states supplied more than 90% of exported cherry volume in the 2025-26 season, which adds seasonal outbound demand. In turn, the zone combines consumer imports with premium fruit, dairy and meat exports to Asian buyers each year.
What drives freight demand in Queensland and the NT?
Queensland and the Northern Territory held a 20.2% share of 2025 value and grow at 4.96% a year, because Brisbane links fast-growing southeast Queensland with Asian and Pacific markets. Queensland had about 5.65 million residents in March 2025, and FedEx broke ground on a regional facility in Bundaberg in September 2025. As a result, the zone adds express volume alongside seafood, meat and horticulture exports.
How do Western Australia and South Australia contribute?
Western Australia and South Australia held a 21.5% share of 2025 value and grow at 4.66% a year, because Perth and Adelaide serve mining, wine, grain and seafood shippers. Western Australia grew 2.3% in the year to March 2025, the fastest rate of any state. In turn, mining parts, medicines and premium food lift demand on Perth routes to Asia and the eastern states.
Freighter launches, new hubs and airport milestones
| Development | Status and market relevance |
|---|---|
| In April 2024, DHL Express introduced a Boeing 777 freighter between Hong Kong and Sydney, flying five times a week. | Added more than 500 tons of weekly payload |
| In July 2025, Emirates SkyCargo launched Emirates Courier Express in Australia with Team Global Express. | Extends an airline cargo brand into door-to-door courier work |
| In September 2025, FedEx broke ground on a new regional facility in Bundaberg, Queensland. | Expected to open in 2026 and support regional trade |
| In July 2026, Qantas started regular domestic freighter operations at Western Sydney International. | Opened the first curfew-free freighter base in Sydney |
| In October 2026, Qantas Freight and Australia Post extended their partnership for 10 years and added A321P2F capacity. | Adds up to 20% capacity to the freighter network |
Converted freighters and 24-hour terminals support growth
- Converted A321 freighters carry more freight than the BAe 146 aircraft they replace, which lowers the cost per parcel on overnight capital city routes.
- Curfew-free freight terminals such as the 24,000 square-meter Qantas terminal at Western Sydney let carriers sort and load freight through the night.
- Active temperature-controlled containers keep medicines and perishables within set limits during flight, which protects vaccines that must stay between +2°C and +8°C.
- Automated parcel sorting systems link aircraft arrivals with road networks, which helps express carriers meet next-day delivery promises across the country.
Need a Custom Version of This Report?
Tailor the scope, geography, or segments to your exact requirements.
- Custom geography or segment scope
- Direct access to our analyst team
Airlines, integrators and postal partners compete for lift
Competition combines Qantas Freight, which runs the largest domestic freighter network, with global integrators and international airlines that carry most imports. Qantas Freight extended its Australia Post partnership for 10 more years in October 2026 and is adding three A321P2F aircraft by March 2027. DHL Express flies a Boeing 777 freighter between Hong Kong and Sydney five times a week. FedEx broke ground on a regional facility in Bundaberg in September 2025, while Emirates SkyCargo launched a courier service with Team Global Express in July 2025. Carriers compete on overnight network reach, freighter capacity, curfew-free slots, temperature control and long-term contracts with postal and parcel partners. Ground handlers such as Menzies Aviation and dnata Cargo also compete for terminal work at Western Sydney, which gives airlines more handling choice.
Which carriers and integrators shape Australian airfreight?
| Company | Type | Role in the market |
|---|---|---|
| Qantas Freight | Domestic and international carrier | Runs dedicated freighters for Australia Post parcels |
| DHL Express Australia | Express integrator | Flies a Boeing 777 freighter from Hong Kong to Sydney |
| FedEx Australia | Express integrator | Building a regional facility in Bundaberg |
| Emirates SkyCargo | International airline cargo | Launched Emirates Courier Express in Australia in 2025 |
Credence Research view on Australian freight capacity
Credence Research's view is that Australian airfreight will grow steadily because parcel networks, new Sydney capacity and perishable exports all add demand for fast, reliable lift. Passenger belly space remains the largest source of revenue, yet narrowbody freighters add the fastest growth as A321 conversions replace older aircraft. Western Sydney International should shift some overnight freight away from curfew limits. Carriers that combine freighter capacity, curfew-free slots and long-term parcel contracts should gain the most share by 2035.
How the airfreight revenue estimate was built
The report uses 2025 as the base year on a calendar basis, and market values come from the Credence Research model. That model combines airline and integrator releases on freighter fleets and routes, airport and government information on terminal capacity and curfews, international aviation data on cargo demand, export statistics and national population data. Segment splits and zone growth rates are Credence Research estimates, while zone shares follow the client-provided split. Sources used are company, airport, government and international agency publications, and no interviews or surveys were used.
Western Sydney and parcel growth keep freight rising to 2035
The Australia air cargo market is expected to reach USD 3.22 billion by 2035, a 4.97% CAGR during 2026–2035, as parcel networks, Western Sydney capacity and perishable exports lift freight volumes. Growth should be strongest in express freight, narrowbody freighters and the New South Wales zone, because these areas gain most from overnight parcel demand and curfew-free flights. Curfews elsewhere, belly dependence and fuel costs could slow some routes, while new passenger services at Western Sydney should add hold space after 2026.
Frequently Asked Questions
How big is the Australia air cargo market?
Which transport mode carries the most air cargo revenue?
Which region leads the market?
When did Western Sydney International start freight operations?
How fast did global air cargo demand grow in 2025?
What role do perishable exports play?
Who are the leading companies in Australian air cargo?
What are the main challenges for air cargo carriers?
Table of Content
Chapter 1 Market Segmentation
- 1.1 Segmentation Framework
- 1.1.1 Product and Service Classification
- 1.1.2 Application and End-Use Classification
- 1.1.3 Technology and Solution Classification
- 1.1.4 Customer and Distribution Channel Classification
- 1.1.5 Geographic Segmentation
- 1.1.6 Market Segment Definitions and Boundaries
- 1.2 By Service Type
- 1.2.1 Standard Freight
- 1.2.2 Express Freight
- 1.2.3 Specialist Freight
- 1.3 By Mode of Transport
- 1.3.1 Passenger Belly Capacity
- 1.3.2 Widebody Freighter Capacity
- 1.3.3 Narrowbody Freighter Capacity
- 1.4 By Shipment Flow
- 1.4.1 International Inbound
- 1.4.2 International Outbound
- 1.4.3 Domestic
- 1.5 By End-Use Industry
- 1.5.1 Retail and Consumer Goods
- 1.5.2 Healthcare and Life Sciences
- 1.5.3 Food and Horticulture
- 1.5.4 Manufacturing and Business Services
Chapter 2 Introduction
- 2.1 Report Objectives and Scope
- 2.2 Product Definition and Industry Terminology
- 2.3 Market Inclusions and Exclusions
- 2.4 Research Process
- 2.4.1 Primary Research and Expert Interviews
- 2.4.2 Secondary Research and Source Review
- 2.4.3 Top-Down and Bottom-Up Estimation
- 2.4.4 Data Triangulation and Verification
- 2.5 Market Size Measurement Basis
- 2.5.1 2025: USD 1.97 billion → 2035: USD 3.22 billion
- 2.6 Historical and Forecast Reference Periods
- 2.6.1 Historical Period: 2018-2025
- 2.6.2 Base Year: 2025
- 2.6.3 Forecast Period: 2025-2035
- 2.7 Research Assumptions and Limitations
Chapter 3 Executive Summary
- 3.1 Market Snapshot and Key Findings
- 3.2 Base-Year Market Size, 2025
- 3.3 Forecast Market Size, 2035
- 3.4 Revenue and Volume Growth Outlook
- 3.5 Key Demand and Supply Indicators
- 3.6 Leading Market Segments
- 3.7 Fastest-Growing Market Opportunities
- 3.8 Regional Performance Highlights
- 3.9 Technology and Industry Transformation
- 3.10 Competitive Landscape Summary
- 3.11 Analyst View and Strategic Implications
Chapter 4 Australia Air Cargo Market Trends and Developments
- 4.1 Historical Industry Development, 2018-2025
- 4.2 Recent Market Trends and Developments
- 4.3 Demand and Customer Behavior Trends
- 4.4 Technology and Product Innovation
- 4.5 Artificial Intelligence, Automation and Digitalization
- 4.6 Local Manufacturing and Supply Chain Realignment
- 4.7 Industry Partnerships, Mergers and Acquisitions
- 4.8 Sustainability and Circular Economy Developments
- 4.9 Government and Private Sector Investment Trends
- 4.10 Emerging Business Models and Commercialization
- 4.11 Industry Developments and Announcements
Chapter 5 Australia Air Cargo Market Production, Supply and Demand Analysis
- 5.1 Demand Trend and Consumption Analysis, 2018-2025
- 5.2 Demand Forecast, 2025-2035
- 5.3 Production and Output Trend, 2018-2025
- 5.4 Production and Output Forecast, 2025-2035
- 5.5 Installed Capacity and Capacity Utilization
- 5.6 Company-Wise Production Plants and Statistics
- 5.6.1 Installed Production Capacity
- 5.6.2 Actual Production
- 5.6.3 Planned Capacity and Expansion Targets
- 5.7 Supply Chain Structure and Procurement Trends
- 5.8 Supply-Demand Gap and Bottlenecks
- 5.9 Import Dependence and Sourcing Structure
- 5.10 Contract Manufacturing and Outsourcing
- 5.11 Regional Supply and Demand Concentration
Chapter 6 Australia Air Cargo Market Pricing Analysis
- 6.1 Pricing Structure and Measurement
- 6.2 Historical Pricing Trends, 2018-2025
- 6.3 Pricing Outlook, 2025-2035
- 6.4 Average Selling Price and Unit Economics
- 6.5 Pricing by Product and Market Segment
- 6.6 Geographic Pricing Differences
- 6.7 Key Input, Energy, Labor and Logistics Costs
- 6.8 Contract Pricing and Purchasing Models
- 6.9 Pricing Sensitivity and Competitive Positioning
- 6.10 Price, Margin and Profitability Implications
Chapter 7 Australia Air Cargo Market Dynamics
- 7.1 Market Growth Drivers
- 7.1.1 Demand-Side Drivers
- 7.1.2 Technology and Innovation Drivers
- 7.1.3 Infrastructure and Investment Drivers
- 7.1.4 Regulatory and Policy Drivers
- 7.2 Market Restraints
- 7.2.1 Cost and Affordability Constraints
- 7.2.2 Technology and Adoption Barriers
- 7.2.3 Supply Chain and Operational Constraints
- 7.3 Market Challenges
- 7.3.1 Competitive Pressure and Margin Erosion
- 7.3.2 Skills, Infrastructure and Implementation Gaps
- 7.4 Emerging Market Opportunities
- 7.5 Market Dynamics Impact and Time-Horizon Assessment
Chapter 8 Australia Air Cargo Value Chain Analysis
- 8.1 Industry Value Chain Overview
- 8.2 Upstream Suppliers and Critical Inputs
- 8.3 Technology and Component Providers
- 8.4 Manufacturing or Service Delivery
- 8.5 Distribution, Channel Partners and Integrators
- 8.6 Downstream Applications and End Users
- 8.7 Value Addition and Profit Pools
- 8.8 Vertical Integration and Outsourcing
- 8.9 Supplier Concentration and Risk
- 8.10 Supply Chain Localization and Resilience
Chapter 9 Australia Air Cargo Market Regulations and Policies
- 9.1 Relevant Laws, Standards and Compliance Frameworks
- 9.2 Product, Service, Safety and Quality Requirements
- 9.3 Government Policies, Incentives and Subsidies
- 9.4 Imports, Exports and Trade Barriers
- 9.5 Public Procurement and Local Content Requirements
- 9.6 Environmental and Sustainability Compliance
- 9.7 Upcoming Policy Changes and Market Implications
Chapter 10 Australia Air Cargo Market Hotspots and Opportunities
- 10.1 Market Opportunity Mapping and Growth Hotspots
- 10.2 High-Growth Applications and Customer Groups
- 10.3 Underserved Markets and White-Space Opportunities
- 10.4 Emerging Technology and Product Opportunities
- 10.5 New Capacity and Investment Hotspots
- 10.6 Market Entry and Expansion Opportunities
- 10.7 Distribution and Partnership Opportunities
- 10.8 Near-Term and Long-Term Commercial Potential
- 10.9 Opportunity Attractiveness and Execution Risks
Chapter 11 Australia Air Cargo Market Outlook, 2025-2035
- 11.1 Market Size and Analysis
- 11.1.1 Revenue (Market Measurement: 2025: USD 1.97 billion → 2035: USD 3.22 billion)
- 11.1.2 Market Volume and Quantity Sold
- 11.1.3 Historical Market Size, 2018-2025
- 11.1.4 Base-Year Market Size, 2025
- 11.2 Market Forecast, 2025-2035
- 11.2.1 Revenue Forecast to 2035
- 11.2.2 Volume Forecast to 2035
- 11.2.3 CAGR and Year-on-Year Growth
- 11.2.4 Incremental Revenue Opportunity
- 11.3 Forecast Assumptions and Scenario Analysis
- 11.3.1 Base-Case Forecast
- 11.3.2 Optimistic and Conservative Scenarios
- 11.3.3 Technology, Pricing and Policy Sensitivities
- 11.4 Market Attractiveness and Growth Outlook
Chapter 12 Australia Air Cargo Market Segmentation and Outlook
- 12.1 Segmentation Summary and Market Shares, 2025
- 12.2 Largest and Fastest-Growing Segments
- 12.3 By Service Type - Market Size and Forecast, 2025-2035
- 12.3.1 Segment Definition and Scope
- 12.3.2 Historical Market Size, 2018-2025
- 12.3.3 Revenue Forecast, 2025-2035
- 12.3.4 Volume Forecast, 2025-2035
- 12.3.5 Base-Year Market Share, 2025
- 12.3.6 Segment CAGR and Growth Drivers
- 12.3.7 Subsegment Market Size and Forecast
- 12.3.7.1 Standard Freight
- 12.3.7.2 Express Freight
- 12.3.7.3 Specialist Freight
- 12.3.8 Subsegment Pricing and Adoption Trends
- 12.3.9 Leading Suppliers and Competition
- 12.3.10 Regional Demand and Opportunities
- 12.4 By Mode of Transport - Market Size and Forecast, 2025-2035
- 12.4.1 Segment Definition and Scope
- 12.4.2 Historical Market Size, 2018-2025
- 12.4.3 Revenue Forecast, 2025-2035
- 12.4.4 Volume Forecast, 2025-2035
- 12.4.5 Base-Year Market Share, 2025
- 12.4.6 Segment CAGR and Growth Drivers
- 12.4.7 Subsegment Market Size and Forecast
- 12.4.7.1 Passenger Belly Capacity
- 12.4.7.2 Widebody Freighter Capacity
- 12.4.7.3 Narrowbody Freighter Capacity
- 12.4.8 Subsegment Pricing and Adoption Trends
- 12.4.9 Leading Suppliers and Competition
- 12.4.10 Regional Demand and Opportunities
- 12.5 By Shipment Flow - Market Size and Forecast, 2025-2035
- 12.5.1 Segment Definition and Scope
- 12.5.2 Historical Market Size, 2018-2025
- 12.5.3 Revenue Forecast, 2025-2035
- 12.5.4 Volume Forecast, 2025-2035
- 12.5.5 Base-Year Market Share, 2025
- 12.5.6 Segment CAGR and Growth Drivers
- 12.5.7 Subsegment Market Size and Forecast
- 12.5.7.1 International Inbound
- 12.5.7.2 International Outbound
- 12.5.7.3 Domestic
- 12.5.8 Subsegment Pricing and Adoption Trends
- 12.5.9 Leading Suppliers and Competition
- 12.5.10 Regional Demand and Opportunities
- 12.6 By End-Use Industry - Market Size and Forecast, 2025-2035
- 12.6.1 Segment Definition and Scope
- 12.6.2 Historical Market Size, 2018-2025
- 12.6.3 Revenue Forecast, 2025-2035
- 12.6.4 Volume Forecast, 2025-2035
- 12.6.5 Base-Year Market Share, 2025
- 12.6.6 Segment CAGR and Growth Drivers
- 12.6.7 Subsegment Market Size and Forecast
- 12.6.7.1 Retail and Consumer Goods
- 12.6.7.2 Healthcare and Life Sciences
- 12.6.7.3 Food and Horticulture
- 12.6.7.4 Manufacturing and Business Services
- 12.6.8 Subsegment Pricing and Adoption Trends
- 12.6.9 Leading Suppliers and Competition
- 12.6.10 Regional Demand and Opportunities
- 12.7 Segment Growth Comparison
- 12.8 Segment Attractiveness and Priority Matrix
Chapter 13 Australia Air Cargo End-Use and Application Market Outlook
- 13.1 End-Use Industry and Customer Demand Structure
- 13.2 Leading Applications and Customer Groups
- 13.3 End-Use Market Size, Share and Forecast
- 13.4 Major End-Use Industry Deep Dives
- 13.4.1 Customer Requirements and Use Cases
- 13.4.2 Demand and Replacement Cycles
- 13.4.3 Technical and Regulatory Considerations
- 13.4.4 Purchasing and Procurement Models
- 13.4.5 Leading Vendors and Distribution Channels
- 13.4.6 Forecast and Commercial Opportunities
- 13.5 Emerging Applications and Cross-Segment Demand
- 13.6 End-Use Industry Investment Priorities
Chapter 14 Australia Air Cargo Geographic Market Outlook, 2025-2035
- 14.1 Domestic Market Distribution and Demand Clusters
- 14.2 State- or Province-Wise Market Size and Forecast, 2025-2035
- 14.3 City and Metropolitan Market Outlook
- 14.4 Industrial, Manufacturing and Commercial Clusters
- 14.5 Geographic Concentration of Key End Users
- 14.6 Local Pricing and Purchasing Differences
- 14.7 Domestic Production Facilities and Capacity Map
- 14.8 Local Infrastructure and Project Pipeline
- 14.9 State-Level Policy and Incentive Differences
- 14.10 Subnational Investment Hotspots and Opportunities
- 14.11 Distribution and Logistics Networks
- 14.12 Domestic Competitive Footprint
Chapter 15 Australia Air Cargo Technology, Innovation and Sustainability Outlook
- 15.1 Technology Landscape and Maturity
- 15.2 Product, Process and Service Innovation
- 15.3 AI, Automation and Digital Tools in the Industry
- 15.4 Technology Adoption and Performance Benchmarking
- 15.5 Innovation Pipeline and R&D Investment
- 15.6 Patent and Intellectual Property Trends
- 15.7 Energy Efficiency and Resource Management
- 15.8 Sustainability, Recycling and Circularity
- 15.9 Technology Roadmap, 2025-2035
- 15.10 Risks of Obsolescence and Technology Substitution
Chapter 16 Australia Air Cargo Market Key Strategic Imperatives
- 16.1 Growth and Market Entry Priorities
- 16.2 High-Return Products and Segments
- 16.3 Pricing, Profitability and Cost Optimization
- 16.4 Technology Investment and Product Differentiation
- 16.5 Supply Chain Localization and Resilience
- 16.6 Distribution and Customer Acquisition
- 16.7 Partnership, Acquisition and Capacity Strategy
- 16.8 Regional Expansion Priorities
- 16.9 Short-, Medium- and Long-Term Actions
Chapter 17 Competition Outlook
- 17.1 Industry Competition Characteristics
- 17.2 Market Structure and Concentration
- 17.3 Market Share and Competitive Positioning, 2025
- 17.4 Company-Wise Revenue and Product Benchmarking
- 17.5 Production and Service Capacity Benchmarking
- 17.6 Technology, Pricing and Differentiation
- 17.7 Regional Footprint and Distribution Strength
- 17.8 Mergers, Acquisitions and Strategic Alliances
- 17.9 New Entrants and Competitive Threats
- 17.10 Porter's Five Forces and Industry Attractiveness
- 17.11 Competitive Outlook, 2025-2035
Chapter 18 Company Profiles
- 18.1 Company Coverage and Selection Criteria
- 18.2 Qantas Freight
- 18.2.1 Business Description
- 18.2.2 Company Ownership and Geographic Presence
- 18.2.3 Product and Service Portfolio
- 18.2.4 Manufacturing and Operating Footprint
- 18.2.5 Production Capacity and Expansion Plans
- 18.2.6 Financial Performance and Investment
- 18.2.7 Market Share and Competitive Position
- 18.2.8 Technology and Innovation Capabilities
- 18.2.9 Strategic Alliances or Partnerships
- 18.2.10 Recent Developments
- 18.2.11 Growth Strategy and Outlook
- 18.3 DHL Express Australia
- 18.4 Singapore Airlines Cargo
- 18.5 FedEx Australia
- 18.6 Emirates SkyCargo
- 18.7 Other Relevant Market Participants
Note: Every listed company is profiled on the structure shown under the first company. The company list is preliminary and may change based on research findings, market developments, data availability and client requirements.
Chapter 19 Disclaimer
- 19.1 Research and Forecast Disclaimer
- 19.2 Data Source and Estimation Limitations
Note: The depth of individual sections depends on data availability for this market. Volume, capacity, trade and other unit-based metrics are included where applicable.

