
Design rules and an imported fleet shape braking demand
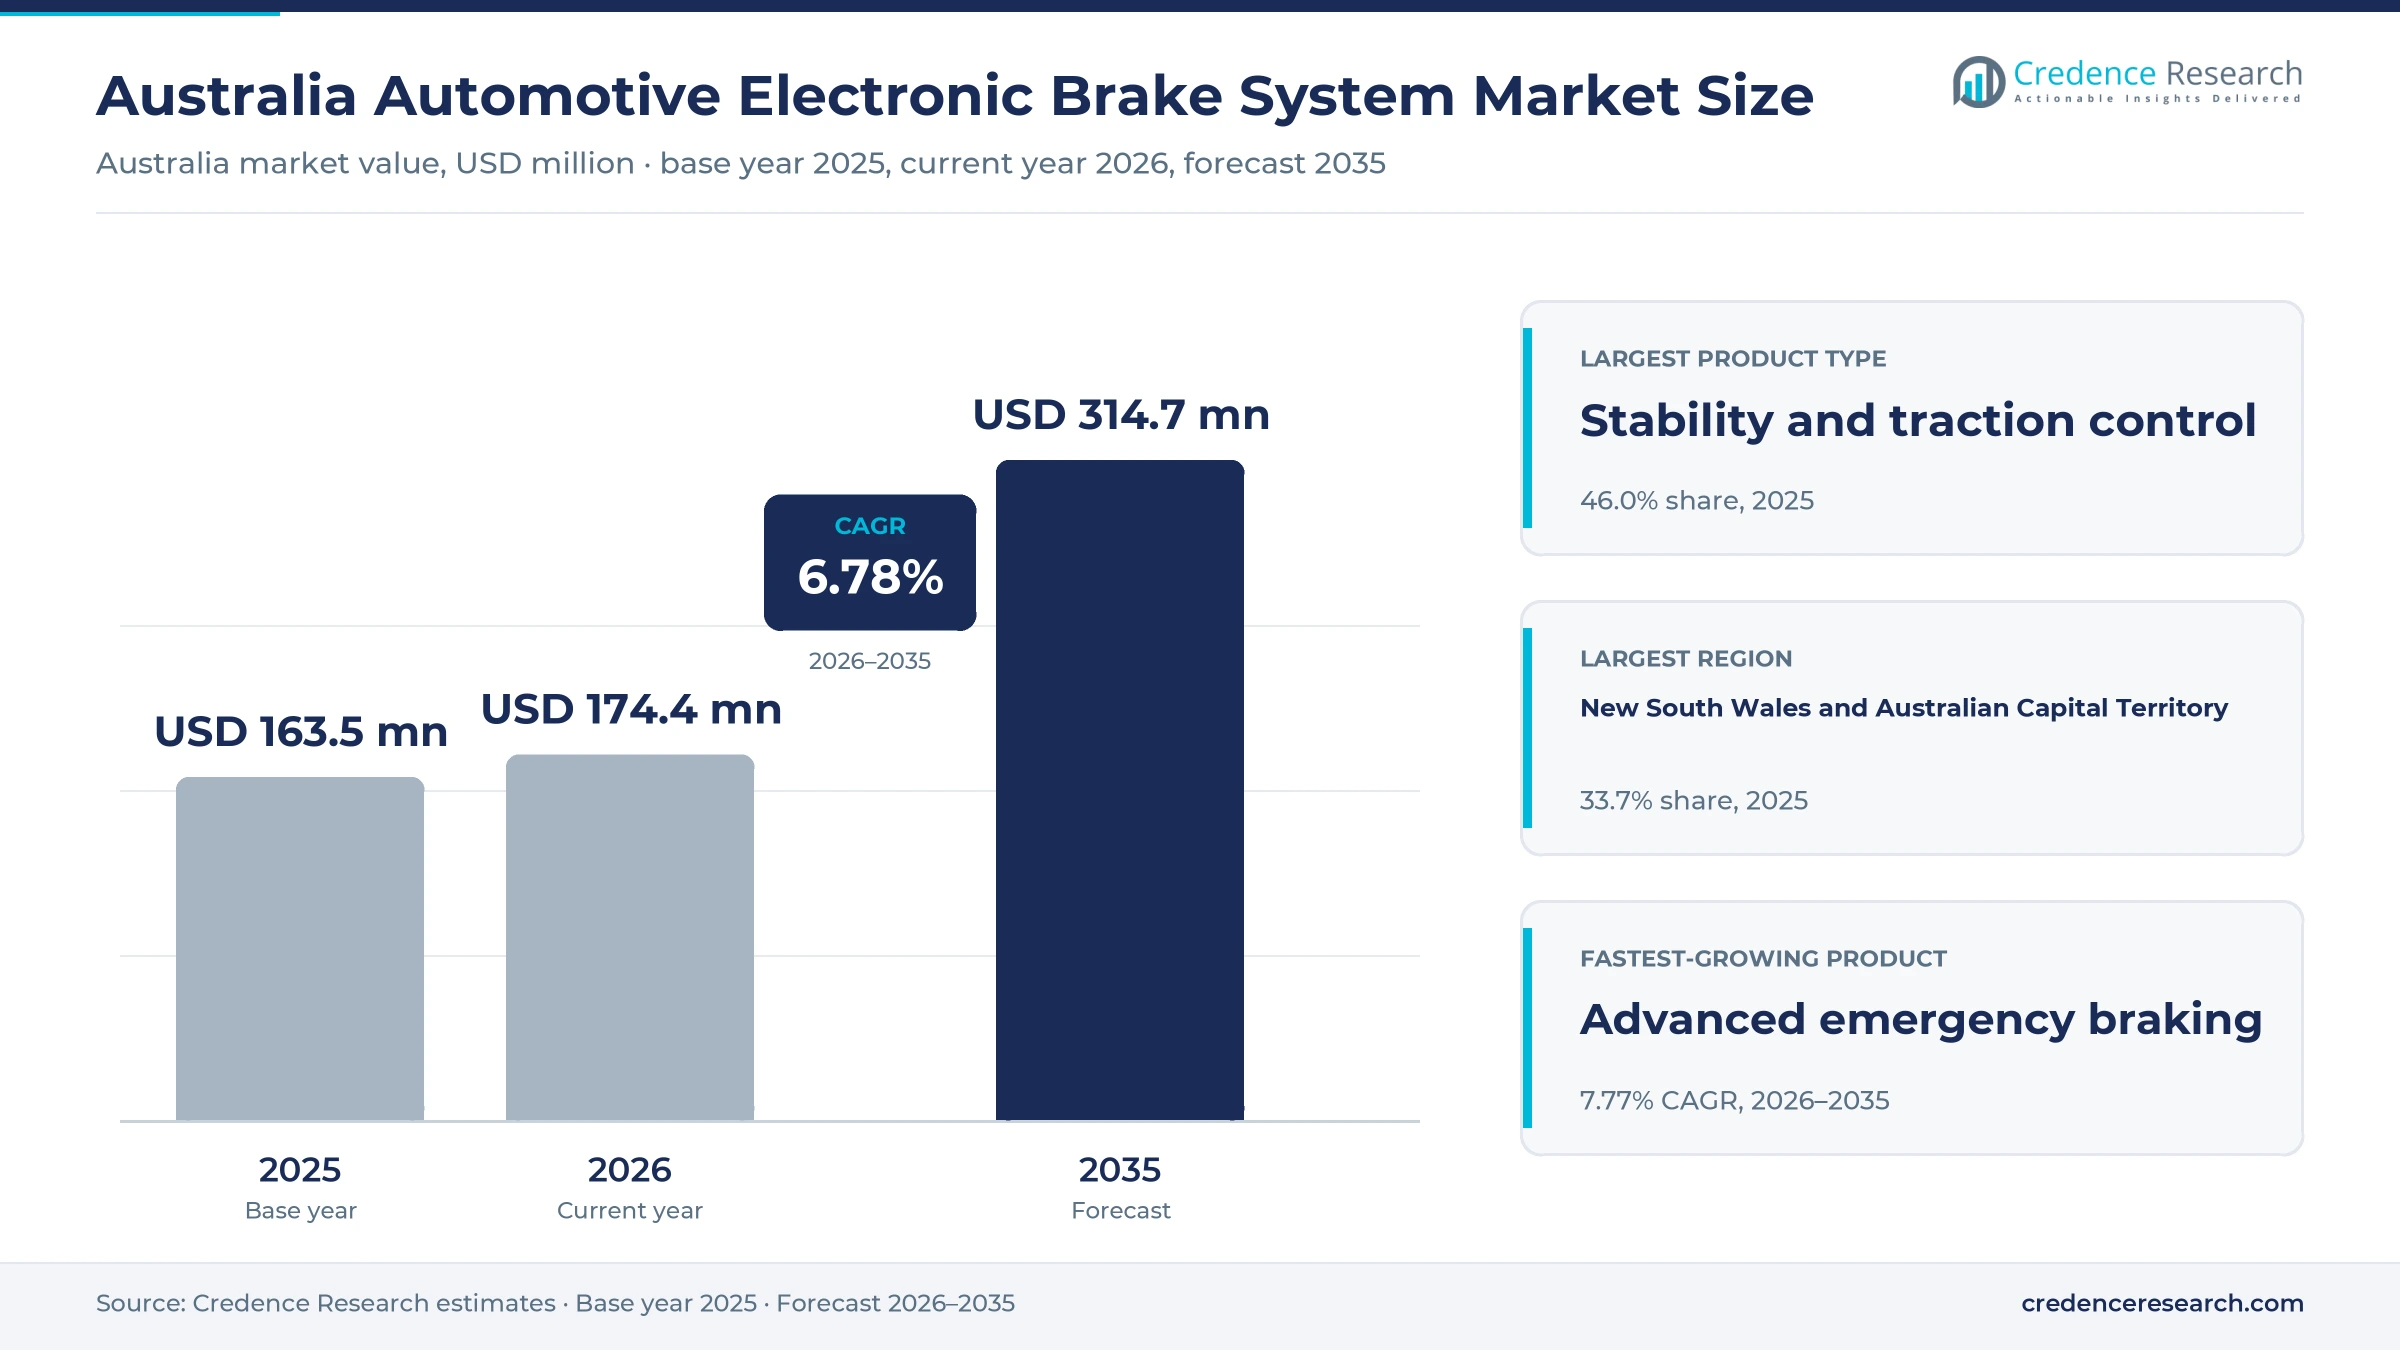
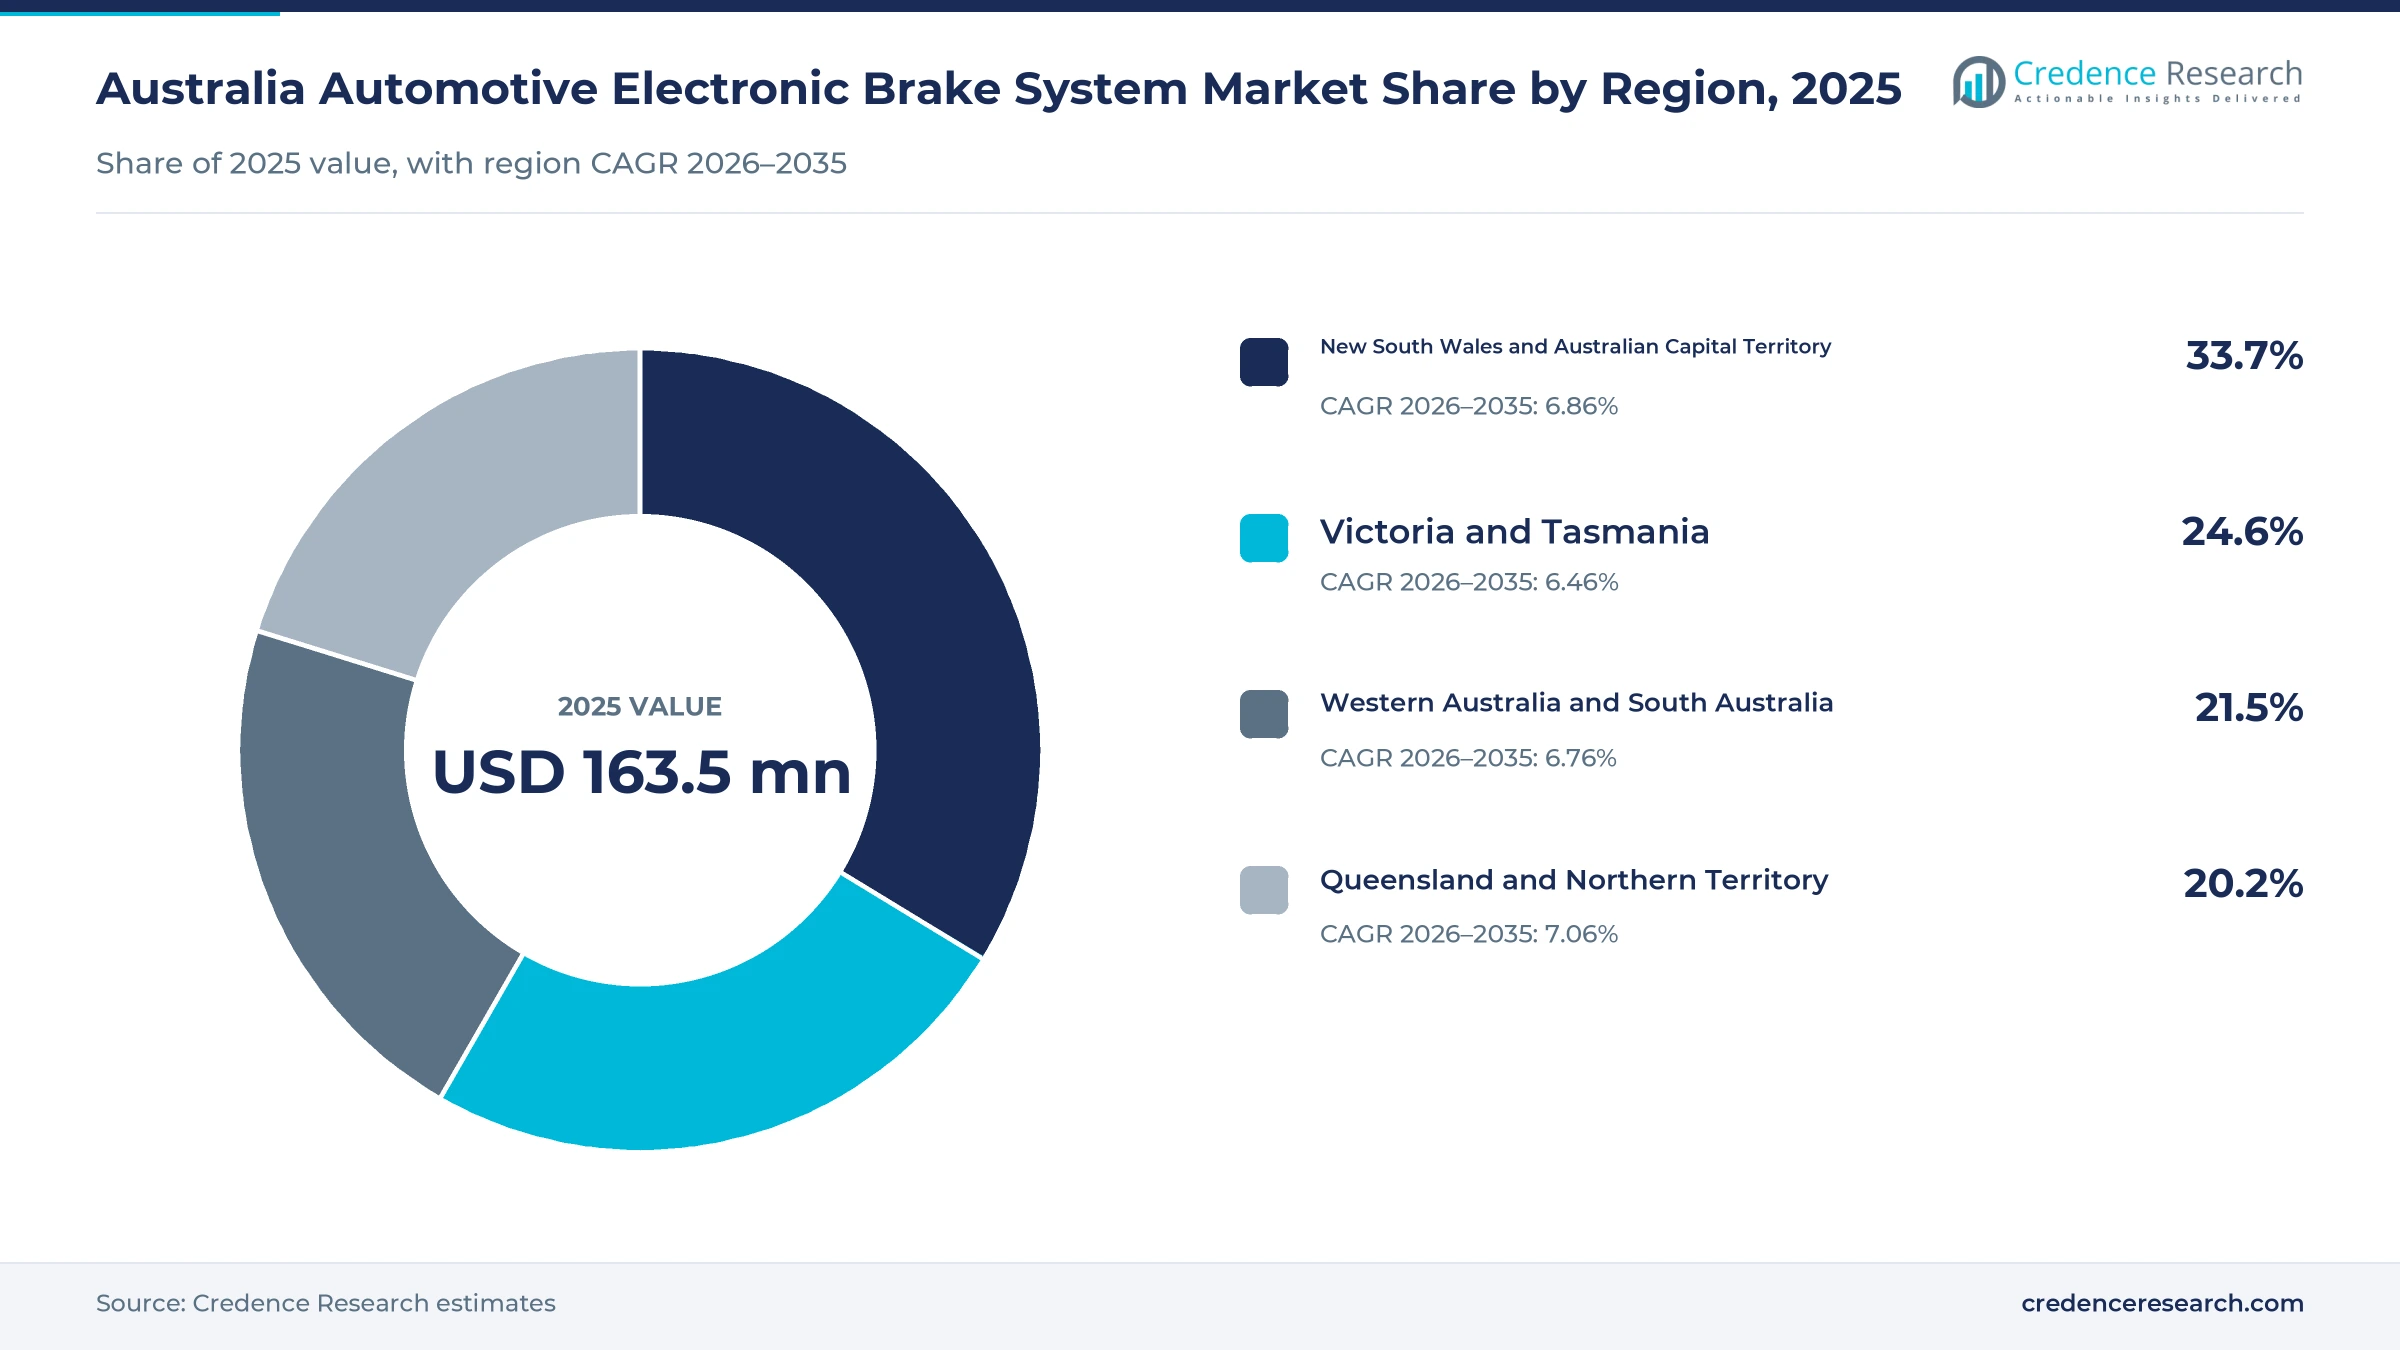
The Australia automotive electronic brake system market was valued at USD 163.5 million in 2025 and is projected to increase from USD 174.4 million in 2026 to USD 314.7 million by 2035, registering a CAGR of 6.78% during 2026–2035. Demand comes from the stability control, emergency braking and electronic air braking content that arrives fitted to every imported car, ute, truck and trailer, plus repair and replacement work across an aging national fleet. New South Wales and the Australian Capital Territory held the largest regional share, 33.7% in 2025, because the zone buys the most new vehicles. Queensland and the Northern Territory form the fastest-growing region at 7.06% a year, as freight corridors and population growth add trucks and light commercial vehicles. At the same time, car-to-car emergency braking became compulsory for imported light vehicles in March 2025, and pedestrian detection rules follow in August 2026.
Which electronic braking functions does the estimate count?
The estimate measures the value of electronic brake control content sold into Australian vehicles, including stability and traction control units, advanced emergency braking functions, electronic parking brakes, brake boosters and the electronic air braking used on trucks, buses and trailers. It counts controllers, modulators, wheel speed and pressure sensors, actuators and brake-specific software.
The estimate excludes friction pads, rotors, drums, hoses and plain mechanical parts without electronic control. The value chain runs from global system suppliers through vehicle makers, importers, truck and trailer builders and parts distributors to dealer workshops, fleet depots and independent repair specialists that test, recalibrate and replace modules.
Australia Automotive Electronic Brake System Market Insights
- The Australia automotive electronic brake system market was valued at USD 163.5 million in 2025 and is projected to reach USD 314.7 million by 2035, registering a CAGR of 6.78% during 2026–2035.
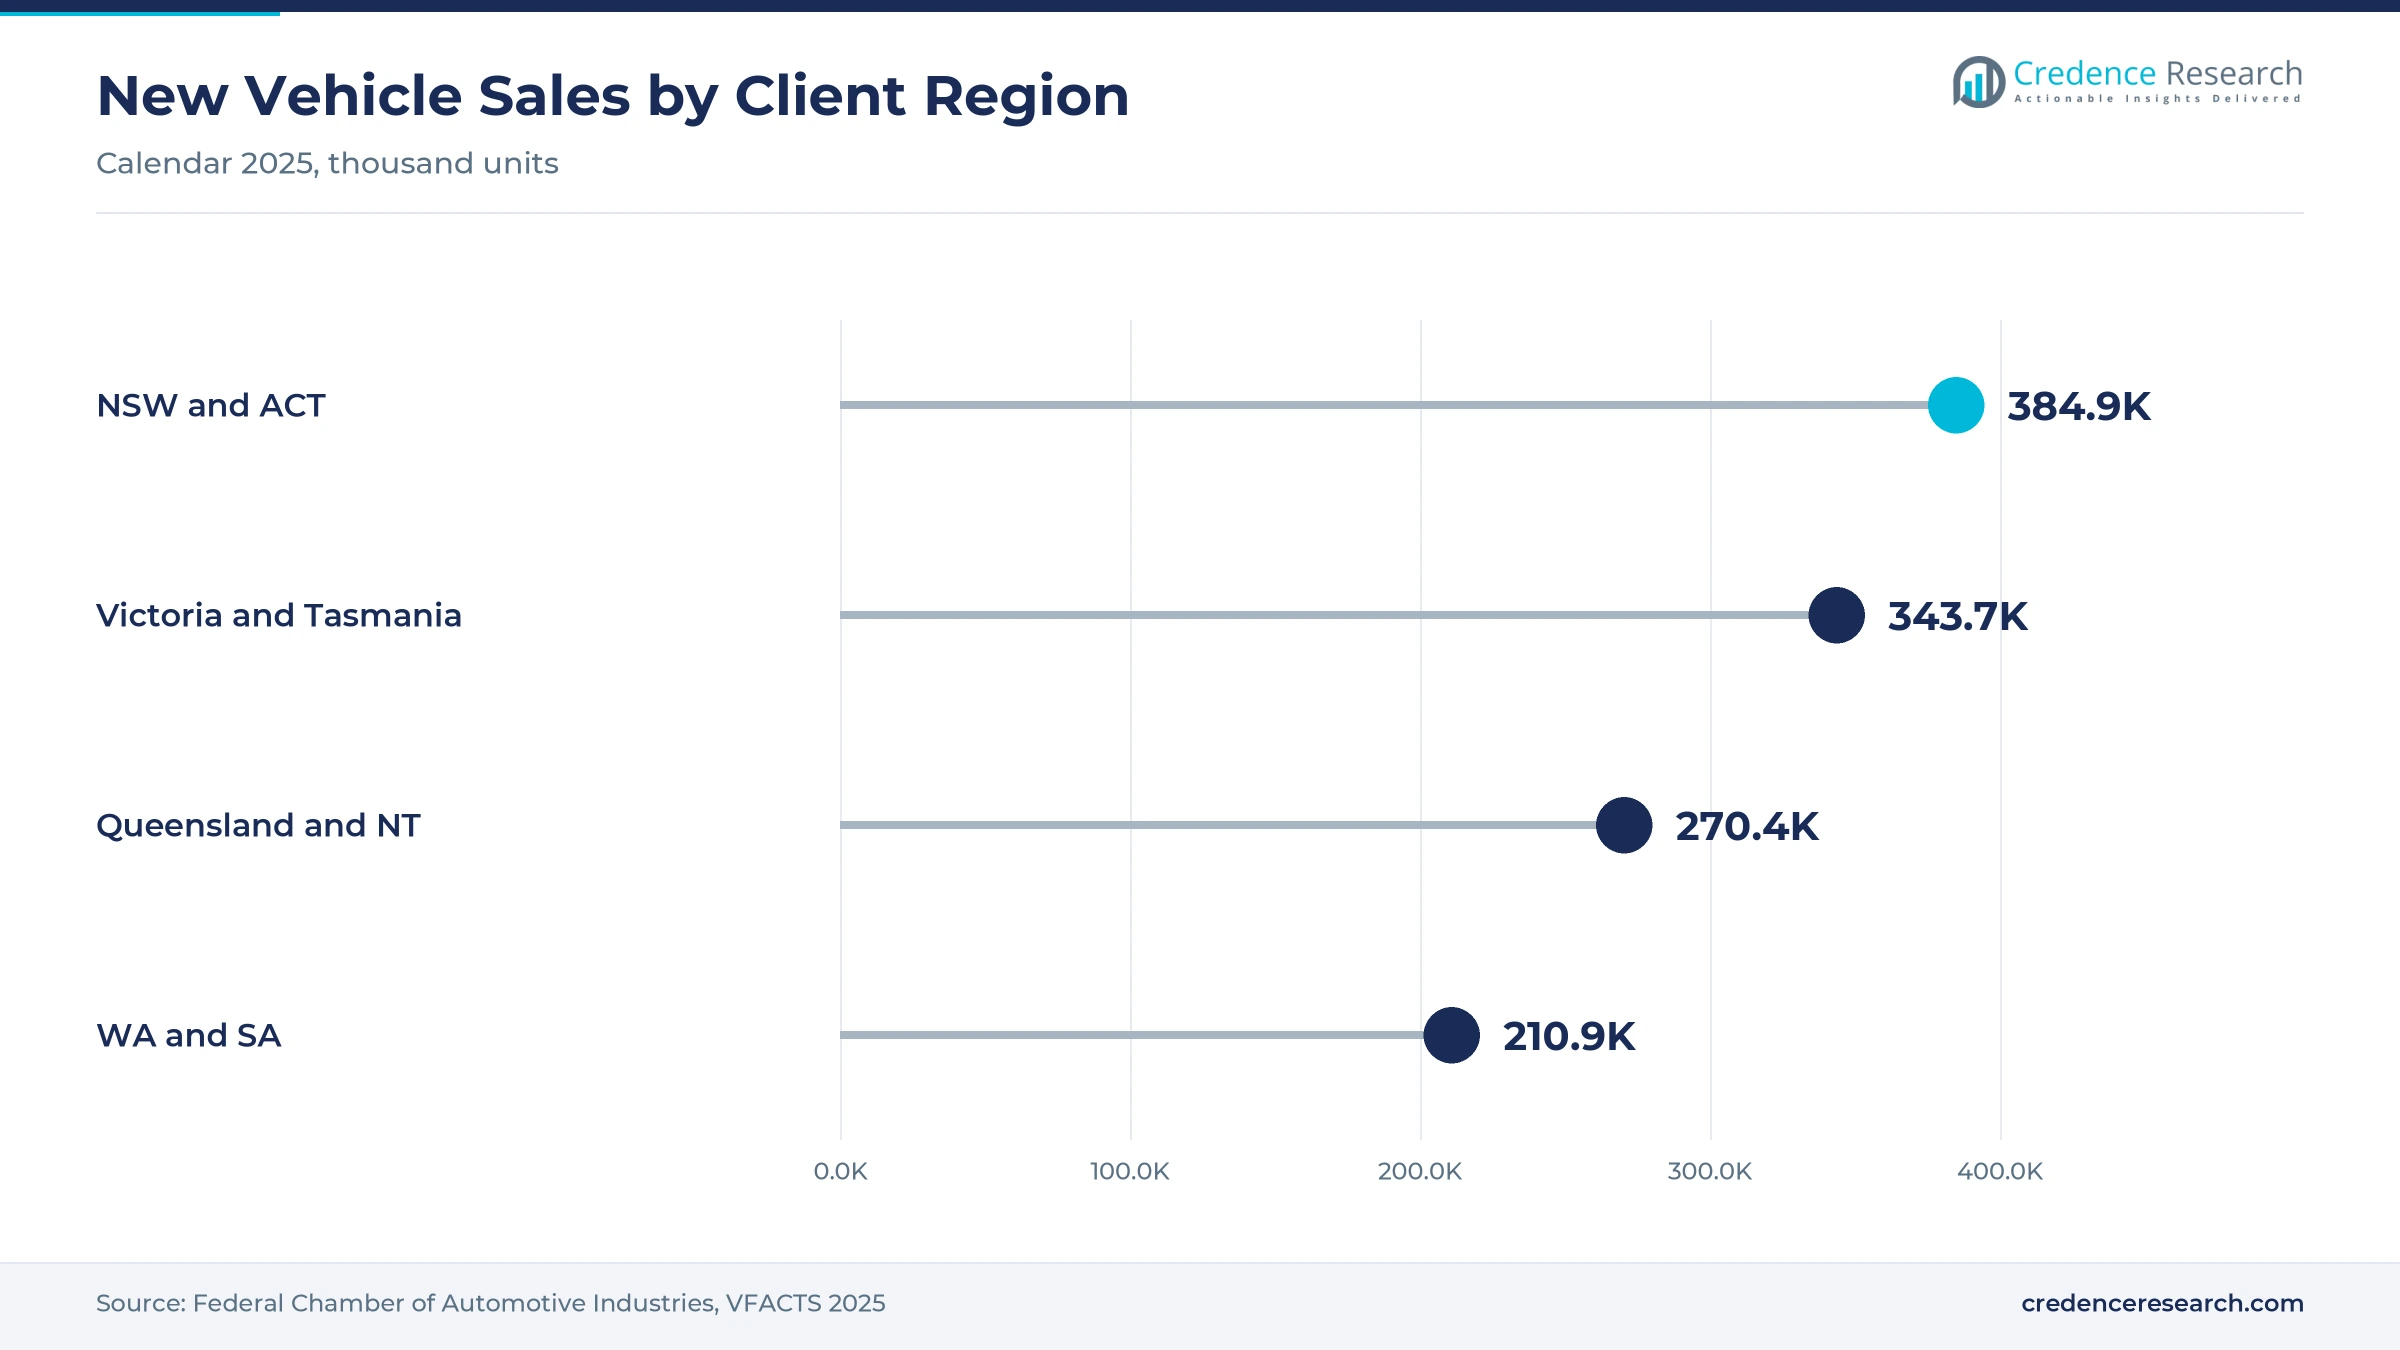
- New South Wales and the Australian Capital Territory held a 33.7% share of 2025 value, because the zone bought 384,864 new vehicles in 2025.
- Stability and traction control led with a 46.0% share of 2025 value, because almost every light vehicle and heavy vehicle now carries it.
- Car-to-car emergency braking became mandatory for light vehicles imported from March 1, 2025, and pedestrian detection rules apply from Aug. 1, 2026.
- Advanced emergency braking grows fastest at 7.77% a year during 2026–2035, as camera and radar functions spread to every new light and heavy vehicle.
Stability control leads as emergency braking grows fastest
Why does stability and traction control hold the top share?
Based on product type, the market is categorized into stability and traction control, heavy vehicle electronic braking, advanced emergency braking and parking and boost control. Stability and traction control led with a 46.0% share of 2025 value, because the anti-lock and stability unit sits on every light vehicle sold. Advanced emergency braking grows fastest at 7.77% a year, as design rules extend emergency braking to pedestrians and heavy vehicles.
How do passenger cars and SUVs anchor brake content?
Based on vehicle type, the market is categorized into passenger cars and sport utility vehicles, light commercial vehicles, heavy trucks, buses and trailers, and motorcycles. Passenger cars and sport utility vehicles led with 62.0% of 2025 value, because they make up most of the 1.21 million new vehicles sold. Heavy trucks, buses and trailers grow fastest at 7.34% a year, as buses and goods vehicles adopt emergency braking and stability control.
Why are plug-in vehicles the fastest-growing powertrain?
Based on powertrain, the market is categorized into internal combustion vehicles, non-plug-in hybrids and plug-in vehicles. Internal combustion vehicles led with a 72.0% share of 2025 value, because petrol and diesel models still dominate new sales and the fleet. Plug-in vehicles grow fastest at 9.45% a year, as blended regenerative braking needs electronic boosters and higher-value control units.
How do factory-fitted systems lead the sales channels?
Based on sales channel, the market is categorized into direct original-equipment supply, indirect original-equipment supply, independent aftermarket and dealer and fleet service. Direct original-equipment supply led with a 41.0% share of 2025 value, because most content arrives fitted to imported vehicles and locally built trailers. Dealer and fleet service grows fastest at 7.15% a year, as calibration and module work shifts to workshops.
| Segment Group | Leading Sub-segment | Share, 2025 | Fastest-growing Sub-segment | CAGR, 2026–2035 |
|---|---|---|---|---|
| By Product Type | Stability and traction control | 46.0% | Advanced emergency braking | 7.77% |
| By Vehicle Type | Passenger cars and sport utility vehicles | 62.0% | Heavy trucks, buses and trailers | 7.34% |
| By Powertrain | Internal combustion vehicles | 72.0% | Plug-in vehicles | 9.45% |
| By Sales Channel | Direct original-equipment supply | 41.0% | Dealer and fleet service | 7.15% |
Request a Free Sample
Fill in your details and we'll send you a free sample report.
- Sample data tables & charts
- Research methodology
AEB mandates, hybrids and an aging fleet lift demand
How does emergency-braking compliance raise content per vehicle?
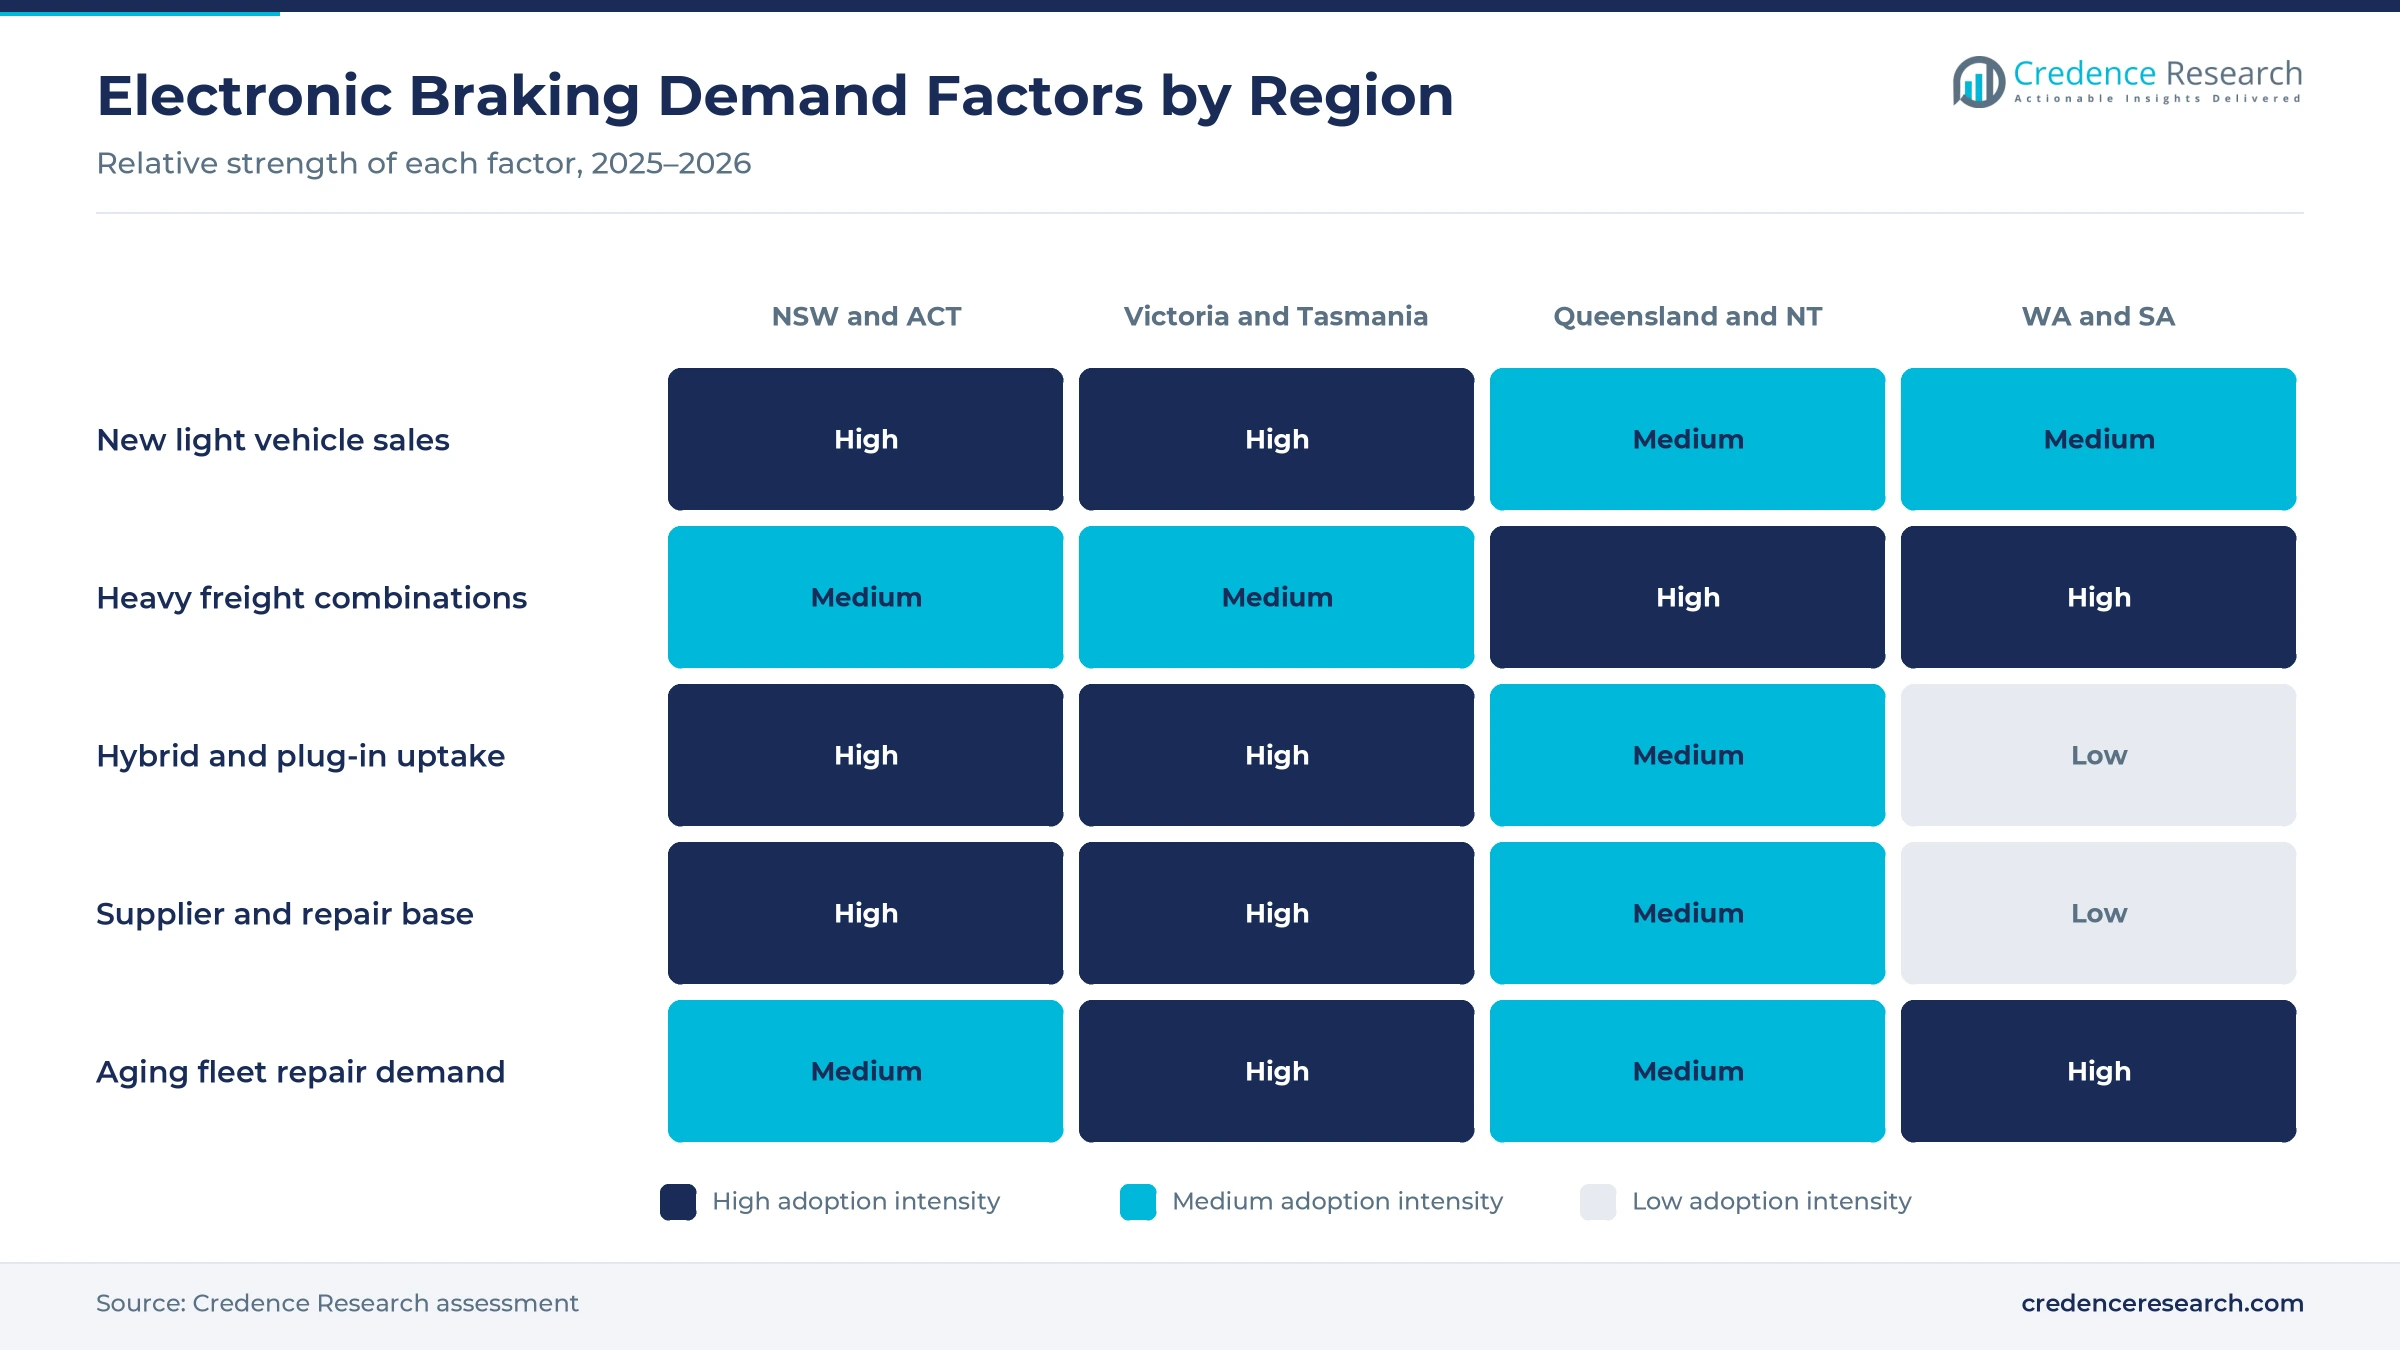
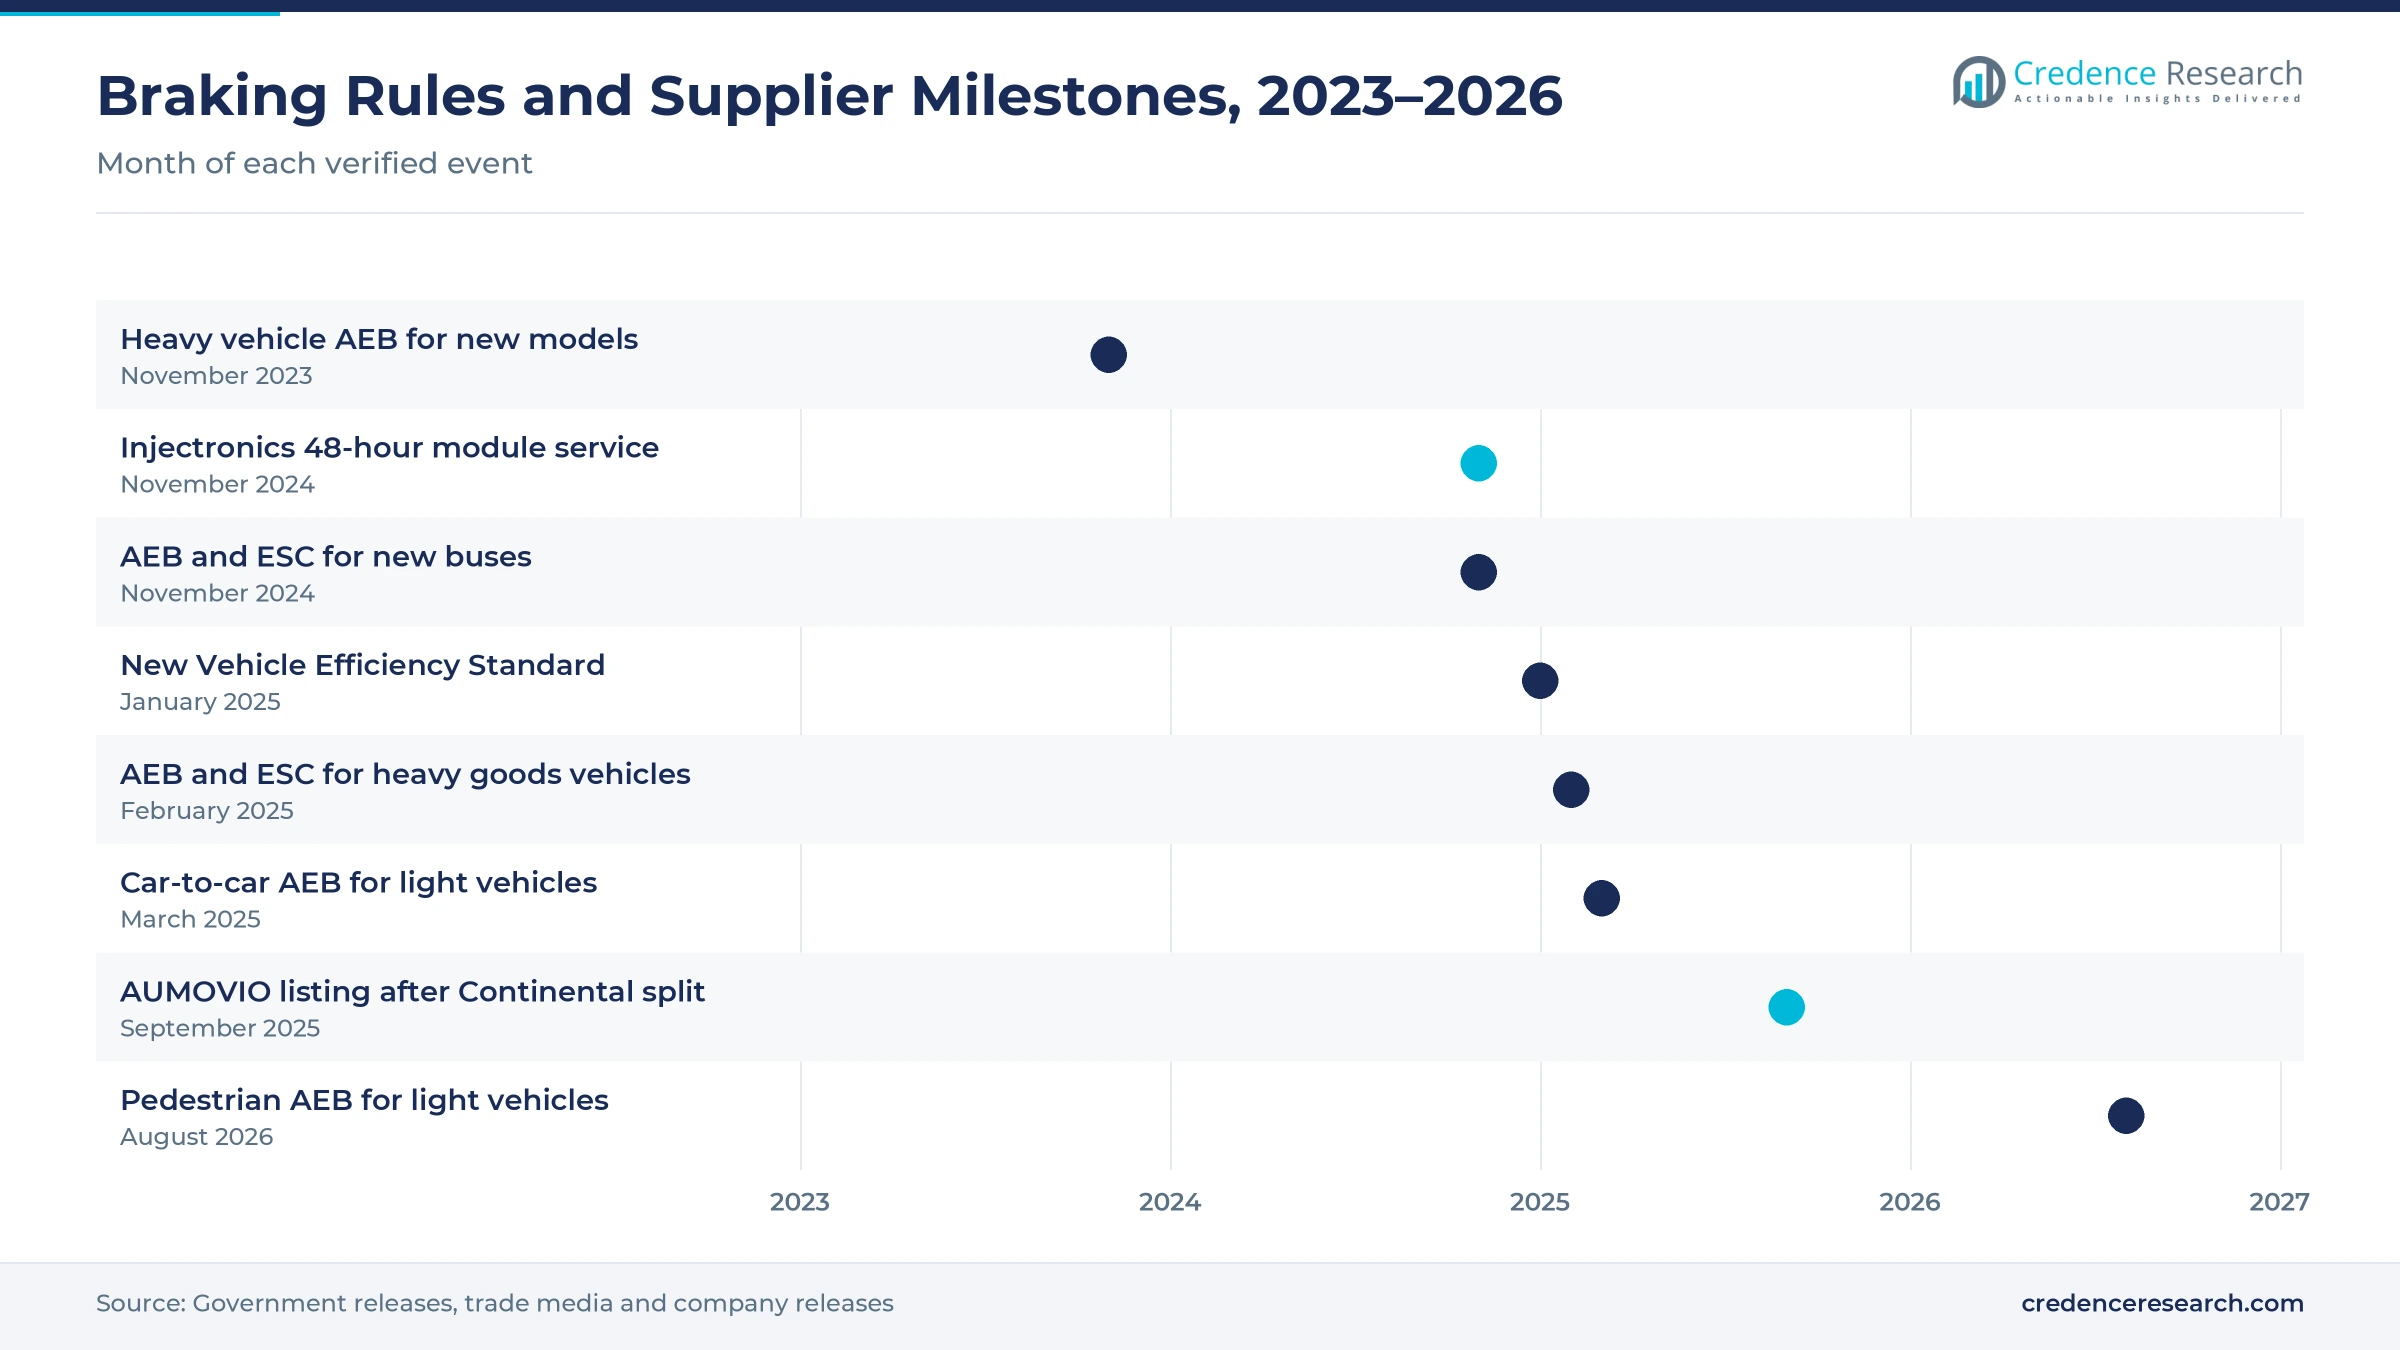
Australian Design Rules now require emergency braking on almost every new road vehicle, which adds sensors, controllers and software to each unit sold. Car-to-car emergency braking under ADR 98/00 became compulsory for light vehicles imported from March 1, 2025, and pedestrian detection under ADR 98/01 applies to passenger cars, off-road passenger vehicles and light goods vehicles from Aug. 1, 2026, GoAuto reported. For heavy vehicles, ADR 97/00 and ADR 35/07 required emergency braking and stability control on new buses from Nov. 1, 2024 and on goods vehicles above 3.5 metric tons from Feb. 1, 2025, Big Rigs reported. As a result, advanced emergency braking grows at 7.77% a year, the fastest product type, as suppliers fit more AEB hardware per vehicle.
Why does electrified powertrain integration lift value?
Hybrids and plug-in vehicles blend regenerative and friction braking, which requires electronic boosters, pedal simulators and more capable control units. The Federal Chamber of Automotive Industries reported 199,133 hybrid sales in 2025, up 15.3%, and 53,484 plug-in hybrid sales, up 130.9%. The same release counted 103,269 battery electric vehicles, or 8.3% of total sales. The International Energy Agency said Australian electric car sales reached around 15% of new car sales in 2025, with a rising plug-in hybrid share. The New Vehicle Efficiency Standard began on Jan. 1, 2025, and credits and penalties accrued from July 1, 2025. In turn, plug-in vehicles grow at 9.45% a year, the fastest powertrain.
How does installed-base repair demand support the aftermarket?
Australia keeps vehicles in service for a long time, so anti-lock and stability modules, sensors and actuators fail and need replacement well after the warranty ends. Passenger vehicles averaged 11.1 years and light commercial vehicles 11.4 years in 2024, while trucks averaged 16.2 years, according to GoAuto analysis of national registration data. Tasmania had the oldest registered fleet of any state or territory, at an average of 13.5 years. Injectronics introduced a 48-hour turnaround service for ABS units and other control modules in November 2024, after moving to a Keysborough site four times larger than its Hallam operation, Australian Manufacturing reported. As a result, the independent aftermarket holds a steady share of value, with fleets using fleet telematics to flag brake faults earlier.
Why does trailer and truck electronic braking expand?
Long road trains and multi-trailer combinations make electronic air braking and roll stability support essential for Australian freight operators. ZF said more than 100,000 trailer electronic braking units are installed on Australian trailers, and it oversees 75% to 80% of them through distribution partners, Trailer Magazine reported on Dec. 22, 2025. ZF runs about 40 partner workshops from Western Australia to Queensland and trained about 500 technicians in two years. Knorr-Bremse showed emergency braking, adaptive cruise control and its iTEBS X trailer platform, due for local launch in 2026, at the 2025 Brisbane Truck Show. In turn, heavy trucks, buses and trailers grow at 7.34% a year, the fastest vehicle type.
Pedestrian AEB, trailer platforms and module repair rise
How is the shift to pedestrian and junction AEB changing systems?
Emergency braking is moving from simple car-to-car scenarios toward pedestrians, cyclists and turning traffic, which raises sensor and software requirements. ADR 98/01 extends emergency braking to pedestrian detection for light vehicles from Aug. 1, 2026, GoAuto reported. The heavy vehicle rules expect emergency braking to cut crashes where a truck hits the rear of another vehicle by up to 57%. The government also estimated that the heavy vehicle package would save around 100 lives and avoid more than 2,300 serious injuries over 40 years. As a result, suppliers add camera and radar sensing with brake-control software updates to models already on sale before each new compliance date arrives.
Why is the rise of trailer electronic braking platforms notable?
Trailer builders and fleets are moving to newer electronic braking platforms that combine stability control, mass sensing and reversing aids. Knorr-Bremse, which has more than 100 locations in over 30 countries, presented its iMass on-board mass system, built into its trailer electronic braking architecture, and its iReverse dock approach assist at the 2025 Brisbane Truck Show, Big Rigs reported. ZF combined the former WABCO aftersales program with ZF Service Point to form its partner network after acquiring WABCO in 2020. ZF also identified about 15 gaps in its national network that it plans to fill, and its academy ran 50 trailer module training sessions over two years. In turn, heavy vehicle electronic braking holds a growing share of service work at truck, bus and trailer depots.
Can control module remanufacturing open a repair opening?
Replacement anti-lock and stability modules for older imported vehicles are often costly or slow to source, which opens room for local repair and parts remanufacturing specialists. Injectronics offers a 48-hour turnaround for ABS units, engine control modules, transmission controllers and electronic throttle bodies across four locations in Australia and New Zealand, Australian Manufacturing reported in November 2024. The company has repaired control modules since 1984 and also serves trucks, buses and farm machinery, Big Rigs reported. Trucks averaged 16.2 years in 2024, so heavy modules stay in service for long periods. As a result, dealer and fleet service grows at 7.15% a year, the fastest sales channel.
Is there an opening in brake control for electrified fleets?
Electrified cars, vans and buses need brake control that blends regenerative and friction braking smoothly, which favors suppliers with electronic boosters and by-wire actuators. Plug-in hybrid sales rose 130.9% in 2025, the strongest growth of any drivetrain, according to the industry chamber. The New Vehicle Efficiency Standard aims to cut emissions from new passenger vehicles by more than 60% by 2030, the Department of Infrastructure said. Hybrids and plug-in vehicles together took more than 20% of 2025 new vehicle sales, based on the industry chamber figures. In turn, suppliers that pair regenerative braking with electromechanical actuation can win more content per vehicle.
Calibration skills, recalls and price pressure weigh
How do calibration and diagnostic skill gaps slow repair?
Emergency braking and stability systems need precise sensor alignment and software calibration after windscreen, suspension or brake work. As a result, workshops without scan tools, targets and training struggle to return vehicles to the road with working safety systems. Suppliers respond with technician training programs, partner networks and mobile calibration services. Even so, regional workshops in remote areas often send vehicles long distances for calibration, which lengthens downtime for fleets and private owners.
Why do recalls and software faults add cost?
Electronic brake systems depend on sensors and valves that can fail in ways drivers cannot see, which forces suppliers into recalls and software fixes. The national recall register lists 920 ZF trailer electronic braking units of model years 2023 to 2025 with acceleration sensor and brake valve faults. Such faults can deactivate anti-lock, electronic braking and roll stability functions. In turn, suppliers and trailer builders absorb inspection and replacement costs across many depots.
How does import dependence affect supply and pricing?
Most brake control content reaches Australia fitted to imported vehicles or as imported modules and sensors. As a result, suppliers have limited local leverage over specifications and pricing for the domestic market. Exchange rate swings also change the landed cost of replacement modules and sensors. Distributors respond by holding more local stock and by using remanufactured units, although specialized parts for low-volume imports can still take weeks to arrive.
Why does price pressure weigh on aftermarket margins?
Owners of older vehicles often compare the cost of a new anti-lock or stability module with the value of the car itself, which limits spending on genuine parts. In turn, used and remanufactured modules take a growing share of repair work for vehicles older than 10 years. Dealer workshops compete with independent specialists on price and speed. Suppliers respond with exchange programs and warranties, but margins on high-volume replacement sensors stay thin across the independent channel.
New South Wales leads as Queensland grows fastest
| Region | Value, 2025 (USD million) | Share, 2025 | CAGR, 2026–2035 |
|---|---|---|---|
| New South Wales and Australian Capital Territory | 55.1 | 33.7% | 6.86% |
| Victoria and Tasmania | 40.2 | 24.6% | 6.46% |
| Western Australia and South Australia | 35.2 | 21.5% | 6.76% |
| Queensland and Northern Territory | 33.0 | 20.2% | 7.06% |
New South Wales and the ACT hold the largest regional share
New South Wales and the Australian Capital Territory held a 33.7% share of 2025 value and grow at 6.86% a year, because the zone buys the most new vehicles. New South Wales recorded 367,947 new vehicle sales in 2025, and the Australian Capital Territory added 16,917, according to the industry chamber. ZF bases its national headquarters and technical support team in Sydney. As a result, the zone carries the largest base of factory-fitted emergency braking content.
How does Victoria and Tasmania support supply and repair?
Victoria and Tasmania held a 24.6% share of 2025 value and grow at 6.46% a year, because Melbourne hosts several supplier and repair operations. Victoria recorded 323,768 new vehicle sales in 2025 and Tasmania 19,892. Bosch runs its national headquarters at Clayton, where it set up a global center of competence for trailer safety, Australian Manufacturing reported. Injectronics repairs ABS units and control modules from its Keysborough site, so the zone combines supplier offices with module repair work.
Western Australia and South Australia lean on freight fleets
Western Australia and South Australia held a 21.5% share of 2025 value and grow at 6.76% a year, because mining, grain and long-haul freight rely on heavy combinations. Western Australia recorded 132,067 new vehicle sales in 2025, up 1.0%, while South Australia recorded 78,811. Road trains and multi-trailer combinations in these states need electronic air braking and roll stability support. In turn, the zone has a high share of heavy vehicle service work.
Why are Queensland and the Northern Territory growing fastest?
Queensland and the Northern Territory held a 20.2% share of 2025 value and grow fastest at 7.06% a year, because population growth and freight corridors add utes, other light commercial vehicles and trucks. Queensland recorded 259,903 new vehicle sales in 2025, and the Northern Territory added 10,503, up 0.6%. Knorr-Bremse used the 2025 Brisbane Truck Show to show its newest trailer and truck braking technology. As a result, the zone gains heavy vehicle content fastest.
Trailer platforms, repair services and supplier changes
| Development | Status and market relevance |
|---|---|
| In November 2024, Injectronics introduced a 48-hour turnaround service for ABS units and other control modules. | Serves workshops from four locations after a move to a larger Keysborough site |
| In February 2025, emergency braking and stability control became mandatory for new goods vehicles above 3.5 metric tons. | Completes the heavy vehicle rollout that began with buses in November 2024 |
| In March 2025, car-to-car emergency braking became compulsory for newly imported light vehicles. | Adds radar, camera and brake-control content to every new car and light goods vehicle |
| In May 2025, Knorr-Bremse showed its iTEBS X trailer platform and iMass system at the Brisbane Truck Show. | Local launch of iTEBS X is planned for 2026 through its partner network |
| In December 2025, ZF said its partner network had about 40 workshops serving trailer electronic braking. | Supports more than 100,000 installed trailer units with plans to fill about 15 network gaps |
Hydraulic, pneumatic and by-wire actuation with software
- Electrohydraulic systems use pumps, valves and electronic control to run anti-lock, stability and emergency braking on cars, SUVs and light commercial vehicles.
- Electropneumatic systems control air brakes electronically on trucks, buses and trailers, which shortens response time and supports roll stability functions.
- Electromechanical systems use electric motors for parking brakes and brake boosters, which helps hybrids and electric vehicles blend regenerative and friction braking.
- Brake-specific software links wheel speed, radar and camera signals to the brakes, which allows emergency braking updates and diagnostic checks in workshops.
Need a Custom Version of This Report?
Tailor the scope, geography, or segments to your exact requirements.
- Custom geography or segment scope
- Direct access to our analyst team
Global suppliers and local repair specialists compete
Competition combines global system suppliers that win factory fitment on imported vehicles with local distributors and repair specialists that support the installed base. Knorr-Bremse and ZF lead electronic air braking for trucks and trailers, with ZF supporting more than 100,000 installed trailer units through about 40 partner workshops, and both sell electronic air braking platforms developed for global vehicle programs. Bosch runs its national headquarters at Clayton in Victoria, and Hyundai Mobis runs a Pacific parts distribution center near Eastern Creek in Sydney, CarExpert reported. Knorr-Bremse supports its systems through TruckServices partners, including independent service centers, dealerships and mobile operators. Injectronics competes on repair speed for ABS units and other control modules. Suppliers also compete on calibration support, parts availability and workshop training.
Which suppliers support electronic braking across Australia?
| Company | Type | Role in the market |
|---|---|---|
| Knorr-Bremse | Commercial vehicle braking supplier | Offers truck and trailer electronic braking and AEB through TruckServices partners |
| ZF Friedrichshafen | Braking and chassis supplier | Supports more than 100,000 trailer EBS units from its Sydney headquarters |
| Robert Bosch | Automotive system supplier | Runs its Clayton headquarters and a trailer safety competence center |
| Hyundai Mobis | Module and parts supplier | Runs a Pacific parts distribution center near Eastern Creek in Sydney |
| Injectronics | Module repair specialist | Repairs ABS units and control modules with a 48-hour turnaround |
Credence Research view on electronic braking content
Credence Research's view is that Australian electronic braking content will keep rising because design rules now make emergency braking and stability control standard on cars, utes, buses and trucks. Stability and traction control remains the largest product type, while advanced emergency braking grows fastest as pedestrian detection rules arrive in August 2026. Hybrids and plug-in vehicles add higher-value boosters and control units. Suppliers that combine factory fitment, calibration training and fast module repair should gain the most from an aging fleet by 2035.
How the national braking estimate was built
The report uses 2025 as the base year on a calendar basis, and market values come from the Credence Research model. That model combines industry chamber sales statistics, design rule implementation dates, energy agency electric vehicle data, national registration data, recall notices and company releases. Segment splits and regional growth rates are Credence Research estimates, while regional shares follow the client split. Sources used are government pages, international agency reports, trade media and company websites, and no interviews or surveys were used.
Pedestrian AEB and electrified fleets drive growth
The Australia automotive electronic brake system market is expected to reach USD 314.7 million by 2035, a 6.78% CAGR during 2026–2035, as emergency braking, stability control and electronic air braking become standard across the fleet. Growth should be strongest in advanced emergency braking, heavy vehicles and plug-in vehicles, because these areas gain most from new design rules and electrification. Calibration skill gaps, recalls and import dependence could slow some repair work, while partner networks, remanufacturing and software updates should support steady service demand.
Frequently Asked Questions
How big is the Australia automotive electronic brake system market?
Which product type leads electronic braking spending?
Which region leads the market?
When did emergency braking become mandatory?
How do hybrids and plug-in vehicles affect demand?
Why does the aging fleet matter?
Who are the leading companies in the market?
What are the main challenges for the market?
Table of Content
Chapter 1 Market Segmentation
- 1.1 Segmentation Framework
- 1.1.1 Product and Service Classification
- 1.1.2 Application and End-Use Classification
- 1.1.3 Technology and Solution Classification
- 1.1.4 Customer and Distribution Channel Classification
- 1.1.5 Geographic Segmentation
- 1.1.6 Market Segment Definitions and Boundaries
- 1.2 By Product Type
- 1.2.1 Stability and traction control
- 1.2.2 Heavy vehicle electronic braking
- 1.2.3 Advanced emergency braking
- 1.2.4 Parking and boost control
- 1.3 By Vehicle Type
- 1.3.1 Passenger cars and sport utility vehicles
- 1.3.2 Light commercial vehicles
- 1.3.3 Heavy trucks, buses and trailers
- 1.3.4 Motorcycles
- 1.4 By Powertrain
- 1.4.1 Internal combustion vehicles
- 1.4.2 Non-plug-in hybrids
- 1.4.3 Plug-in vehicles
- 1.5 By Sales Channel
- 1.5.1 Direct original-equipment supply
- 1.5.2 Indirect original-equipment supply
- 1.5.3 Independent aftermarket
- 1.5.4 Dealer and fleet service
Chapter 2 Introduction
- 2.1 Report Objectives and Scope
- 2.2 Product Definition and Industry Terminology
- 2.3 Market Inclusions and Exclusions
- 2.4 Research Process
- 2.4.1 Primary Research and Expert Interviews
- 2.4.2 Secondary Research and Source Review
- 2.4.3 Top-Down and Bottom-Up Estimation
- 2.4.4 Data Triangulation and Verification
- 2.5 Market Size Measurement Basis
- 2.5.1 2025: USD 163.5 million → 2035: USD 314.7 million
- 2.6 Historical and Forecast Reference Periods
- 2.6.1 Historical Period: 2018-2025
- 2.6.2 Base Year: 2025
- 2.6.3 Forecast Period: 2025-2035
- 2.7 Research Assumptions and Limitations
Chapter 3 Executive Summary
- 3.1 Market Snapshot and Key Findings
- 3.2 Base-Year Market Size, 2025
- 3.3 Forecast Market Size, 2035
- 3.4 Revenue and Volume Growth Outlook
- 3.5 Key Demand and Supply Indicators
- 3.6 Leading Market Segments
- 3.7 Fastest-Growing Market Opportunities
- 3.8 Regional Performance Highlights
- 3.9 Technology and Industry Transformation
- 3.10 Competitive Landscape Summary
- 3.11 Analyst View and Strategic Implications
Chapter 4 Australia Automotive Electronic Brake System Market Trends and Developments
- 4.1 Historical Industry Development, 2018-2025
- 4.2 Recent Market Trends and Developments
- 4.3 Demand and Customer Behavior Trends
- 4.4 Technology and Product Innovation
- 4.5 Artificial Intelligence, Automation and Digitalization
- 4.6 Local Manufacturing and Supply Chain Realignment
- 4.7 Industry Partnerships, Mergers and Acquisitions
- 4.8 Sustainability and Circular Economy Developments
- 4.9 Government and Private Sector Investment Trends
- 4.10 Emerging Business Models and Commercialization
- 4.11 Industry Developments and Announcements
Chapter 5 Australia Automotive Electronic Brake System Market Production, Supply and Demand Analysis
- 5.1 Demand Trend and Consumption Analysis, 2018-2025
- 5.2 Demand Forecast, 2025-2035
- 5.3 Production and Output Trend, 2018-2025
- 5.4 Production and Output Forecast, 2025-2035
- 5.5 Installed Capacity and Capacity Utilization
- 5.6 Company-Wise Production Plants and Statistics
- 5.6.1 Installed Production Capacity
- 5.6.2 Actual Production
- 5.6.3 Planned Capacity and Expansion Targets
- 5.7 Supply Chain Structure and Procurement Trends
- 5.8 Supply-Demand Gap and Bottlenecks
- 5.9 Import Dependence and Sourcing Structure
- 5.10 Contract Manufacturing and Outsourcing
- 5.11 Regional Supply and Demand Concentration
Chapter 6 Australia Automotive Electronic Brake System Market Pricing Analysis
- 6.1 Pricing Structure and Measurement
- 6.2 Historical Pricing Trends, 2018-2025
- 6.3 Pricing Outlook, 2025-2035
- 6.4 Average Selling Price and Unit Economics
- 6.5 Pricing by Product and Market Segment
- 6.6 Geographic Pricing Differences
- 6.7 Key Input, Energy, Labor and Logistics Costs
- 6.8 Contract Pricing and Purchasing Models
- 6.9 Pricing Sensitivity and Competitive Positioning
- 6.10 Price, Margin and Profitability Implications
Chapter 7 Australia Automotive Electronic Brake System Market Dynamics
- 7.1 Market Growth Drivers
- 7.1.1 Demand-Side Drivers
- 7.1.2 Technology and Innovation Drivers
- 7.1.3 Infrastructure and Investment Drivers
- 7.1.4 Regulatory and Policy Drivers
- 7.2 Market Restraints
- 7.2.1 Cost and Affordability Constraints
- 7.2.2 Technology and Adoption Barriers
- 7.2.3 Supply Chain and Operational Constraints
- 7.3 Market Challenges
- 7.3.1 Competitive Pressure and Margin Erosion
- 7.3.2 Skills, Infrastructure and Implementation Gaps
- 7.4 Emerging Market Opportunities
- 7.5 Market Dynamics Impact and Time-Horizon Assessment
Chapter 8 Australia Automotive Electronic Brake System Value Chain Analysis
- 8.1 Industry Value Chain Overview
- 8.2 Upstream Suppliers and Critical Inputs
- 8.3 Technology and Component Providers
- 8.4 Manufacturing or Service Delivery
- 8.5 Distribution, Channel Partners and Integrators
- 8.6 Downstream Applications and End Users
- 8.7 Value Addition and Profit Pools
- 8.8 Vertical Integration and Outsourcing
- 8.9 Supplier Concentration and Risk
- 8.10 Supply Chain Localization and Resilience
Chapter 9 Australia Automotive Electronic Brake System Market Regulations and Policies
- 9.1 Relevant Laws, Standards and Compliance Frameworks
- 9.2 Product, Service, Safety and Quality Requirements
- 9.3 Government Policies, Incentives and Subsidies
- 9.4 Imports, Exports and Trade Barriers
- 9.5 Public Procurement and Local Content Requirements
- 9.6 Environmental and Sustainability Compliance
- 9.7 Upcoming Policy Changes and Market Implications
Chapter 10 Australia Automotive Electronic Brake System Market Hotspots and Opportunities
- 10.1 Market Opportunity Mapping and Growth Hotspots
- 10.2 High-Growth Applications and Customer Groups
- 10.3 Underserved Markets and White-Space Opportunities
- 10.4 Emerging Technology and Product Opportunities
- 10.5 New Capacity and Investment Hotspots
- 10.6 Market Entry and Expansion Opportunities
- 10.7 Distribution and Partnership Opportunities
- 10.8 Near-Term and Long-Term Commercial Potential
- 10.9 Opportunity Attractiveness and Execution Risks
Chapter 11 Australia Automotive Electronic Brake System Market Outlook, 2025-2035
- 11.1 Market Size and Analysis
- 11.1.1 Revenue (Market Measurement: 2025: USD 163.5 million → 2035: USD 314.7 million)
- 11.1.2 Market Volume and Quantity Sold
- 11.1.3 Historical Market Size, 2018-2025
- 11.1.4 Base-Year Market Size, 2025
- 11.2 Market Forecast, 2025-2035
- 11.2.1 Revenue Forecast to 2035
- 11.2.2 Volume Forecast to 2035
- 11.2.3 CAGR and Year-on-Year Growth
- 11.2.4 Incremental Revenue Opportunity
- 11.3 Forecast Assumptions and Scenario Analysis
- 11.3.1 Base-Case Forecast
- 11.3.2 Optimistic and Conservative Scenarios
- 11.3.3 Technology, Pricing and Policy Sensitivities
- 11.4 Market Attractiveness and Growth Outlook
Chapter 12 Australia Automotive Electronic Brake System Market Segmentation and Outlook
- 12.1 Segmentation Summary and Market Shares, 2025
- 12.2 Largest and Fastest-Growing Segments
- 12.3 By Product Type - Market Size and Forecast, 2025-2035
- 12.3.1 Segment Definition and Scope
- 12.3.2 Historical Market Size, 2018-2025
- 12.3.3 Revenue Forecast, 2025-2035
- 12.3.4 Volume Forecast, 2025-2035
- 12.3.5 Base-Year Market Share, 2025
- 12.3.6 Segment CAGR and Growth Drivers
- 12.3.7 Subsegment Market Size and Forecast
- 12.3.7.1 Stability and traction control
- 12.3.7.2 Heavy vehicle electronic braking
- 12.3.7.3 Advanced emergency braking
- 12.3.7.4 Parking and boost control
- 12.3.8 Subsegment Pricing and Adoption Trends
- 12.3.9 Leading Suppliers and Competition
- 12.3.10 Regional Demand and Opportunities
- 12.4 By Vehicle Type - Market Size and Forecast, 2025-2035
- 12.4.1 Segment Definition and Scope
- 12.4.2 Historical Market Size, 2018-2025
- 12.4.3 Revenue Forecast, 2025-2035
- 12.4.4 Volume Forecast, 2025-2035
- 12.4.5 Base-Year Market Share, 2025
- 12.4.6 Segment CAGR and Growth Drivers
- 12.4.7 Subsegment Market Size and Forecast
- 12.4.7.1 Passenger cars and sport utility vehicles
- 12.4.7.2 Light commercial vehicles
- 12.4.7.3 Heavy trucks, buses and trailers
- 12.4.7.4 Motorcycles
- 12.4.8 Subsegment Pricing and Adoption Trends
- 12.4.9 Leading Suppliers and Competition
- 12.4.10 Regional Demand and Opportunities
- 12.5 By Powertrain - Market Size and Forecast, 2025-2035
- 12.5.1 Segment Definition and Scope
- 12.5.2 Historical Market Size, 2018-2025
- 12.5.3 Revenue Forecast, 2025-2035
- 12.5.4 Volume Forecast, 2025-2035
- 12.5.5 Base-Year Market Share, 2025
- 12.5.6 Segment CAGR and Growth Drivers
- 12.5.7 Subsegment Market Size and Forecast
- 12.5.7.1 Internal combustion vehicles
- 12.5.7.2 Non-plug-in hybrids
- 12.5.7.3 Plug-in vehicles
- 12.5.8 Subsegment Pricing and Adoption Trends
- 12.5.9 Leading Suppliers and Competition
- 12.5.10 Regional Demand and Opportunities
- 12.6 By Sales Channel - Market Size and Forecast, 2025-2035
- 12.6.1 Segment Definition and Scope
- 12.6.2 Historical Market Size, 2018-2025
- 12.6.3 Revenue Forecast, 2025-2035
- 12.6.4 Volume Forecast, 2025-2035
- 12.6.5 Base-Year Market Share, 2025
- 12.6.6 Segment CAGR and Growth Drivers
- 12.6.7 Subsegment Market Size and Forecast
- 12.6.7.1 Direct original-equipment supply
- 12.6.7.2 Indirect original-equipment supply
- 12.6.7.3 Independent aftermarket
- 12.6.7.4 Dealer and fleet service
- 12.6.8 Subsegment Pricing and Adoption Trends
- 12.6.9 Leading Suppliers and Competition
- 12.6.10 Regional Demand and Opportunities
- 12.7 Segment Growth Comparison
- 12.8 Segment Attractiveness and Priority Matrix
Chapter 13 Australia Automotive Electronic Brake System Geographic Market Outlook, 2025-2035
- 13.1 Domestic Market Distribution and Demand Clusters
- 13.2 State- or Province-Wise Market Size and Forecast, 2025-2035
- 13.3 City and Metropolitan Market Outlook
- 13.4 Industrial, Manufacturing and Commercial Clusters
- 13.5 Geographic Concentration of Key End Users
- 13.6 Local Pricing and Purchasing Differences
- 13.7 Domestic Production Facilities and Capacity Map
- 13.8 Local Infrastructure and Project Pipeline
- 13.9 State-Level Policy and Incentive Differences
- 13.10 Subnational Investment Hotspots and Opportunities
- 13.11 Distribution and Logistics Networks
- 13.12 Domestic Competitive Footprint
Chapter 14 Australia Automotive Electronic Brake System Technology, Innovation and Sustainability Outlook
- 14.1 Technology Landscape and Maturity
- 14.2 Product, Process and Service Innovation
- 14.3 AI, Automation and Digital Tools in the Industry
- 14.4 Technology Adoption and Performance Benchmarking
- 14.5 Innovation Pipeline and R&D Investment
- 14.6 Patent and Intellectual Property Trends
- 14.7 Energy Efficiency and Resource Management
- 14.8 Sustainability, Recycling and Circularity
- 14.9 Technology Roadmap, 2025-2035
- 14.10 Risks of Obsolescence and Technology Substitution
Chapter 15 Australia Automotive Electronic Brake System Market Key Strategic Imperatives
- 15.1 Growth and Market Entry Priorities
- 15.2 High-Return Products and Segments
- 15.3 Pricing, Profitability and Cost Optimization
- 15.4 Technology Investment and Product Differentiation
- 15.5 Supply Chain Localization and Resilience
- 15.6 Distribution and Customer Acquisition
- 15.7 Partnership, Acquisition and Capacity Strategy
- 15.8 Regional Expansion Priorities
- 15.9 Short-, Medium- and Long-Term Actions
Chapter 16 Competition Outlook
- 16.1 Industry Competition Characteristics
- 16.2 Market Structure and Concentration
- 16.3 Market Share and Competitive Positioning, 2025
- 16.4 Company-Wise Revenue and Product Benchmarking
- 16.5 Production and Service Capacity Benchmarking
- 16.6 Technology, Pricing and Differentiation
- 16.7 Regional Footprint and Distribution Strength
- 16.8 Mergers, Acquisitions and Strategic Alliances
- 16.9 New Entrants and Competitive Threats
- 16.10 Porter's Five Forces and Industry Attractiveness
- 16.11 Competitive Outlook, 2025-2035
Chapter 17 Company Profiles
- 17.1 Company Coverage and Selection Criteria
- 17.2 Knorr-Bremse
- 17.2.1 Business Description
- 17.2.2 Company Ownership and Geographic Presence
- 17.2.3 Product and Service Portfolio
- 17.2.4 Manufacturing and Operating Footprint
- 17.2.5 Production Capacity and Expansion Plans
- 17.2.6 Financial Performance and Investment
- 17.2.7 Market Share and Competitive Position
- 17.2.8 Technology and Innovation Capabilities
- 17.2.9 Strategic Alliances or Partnerships
- 17.2.10 Recent Developments
- 17.2.11 Growth Strategy and Outlook
- 17.3 Robert Bosch
- 17.4 ZF Friedrichshafen
- 17.5 AUMOVIO
- 17.6 ADVICS
- 17.7 HL Mando
- 17.8 Hyundai Mobis
- 17.9 Astemo
- 17.10 Bendix Australia
- 17.11 Injectronics
- 17.12 Other Relevant Market Participants
Note: Every listed company is profiled on the structure shown under the first company. The company list is preliminary and may change based on research findings, market developments, data availability and client requirements.
Chapter 18 Disclaimer
- 18.1 Research and Forecast Disclaimer
- 18.2 Data Source and Estimation Limitations
Note: The depth of individual sections depends on data availability for this market. Volume, capacity, trade and other unit-based metrics are included where applicable.

