
Loss control and peak stress push utilities to digitize
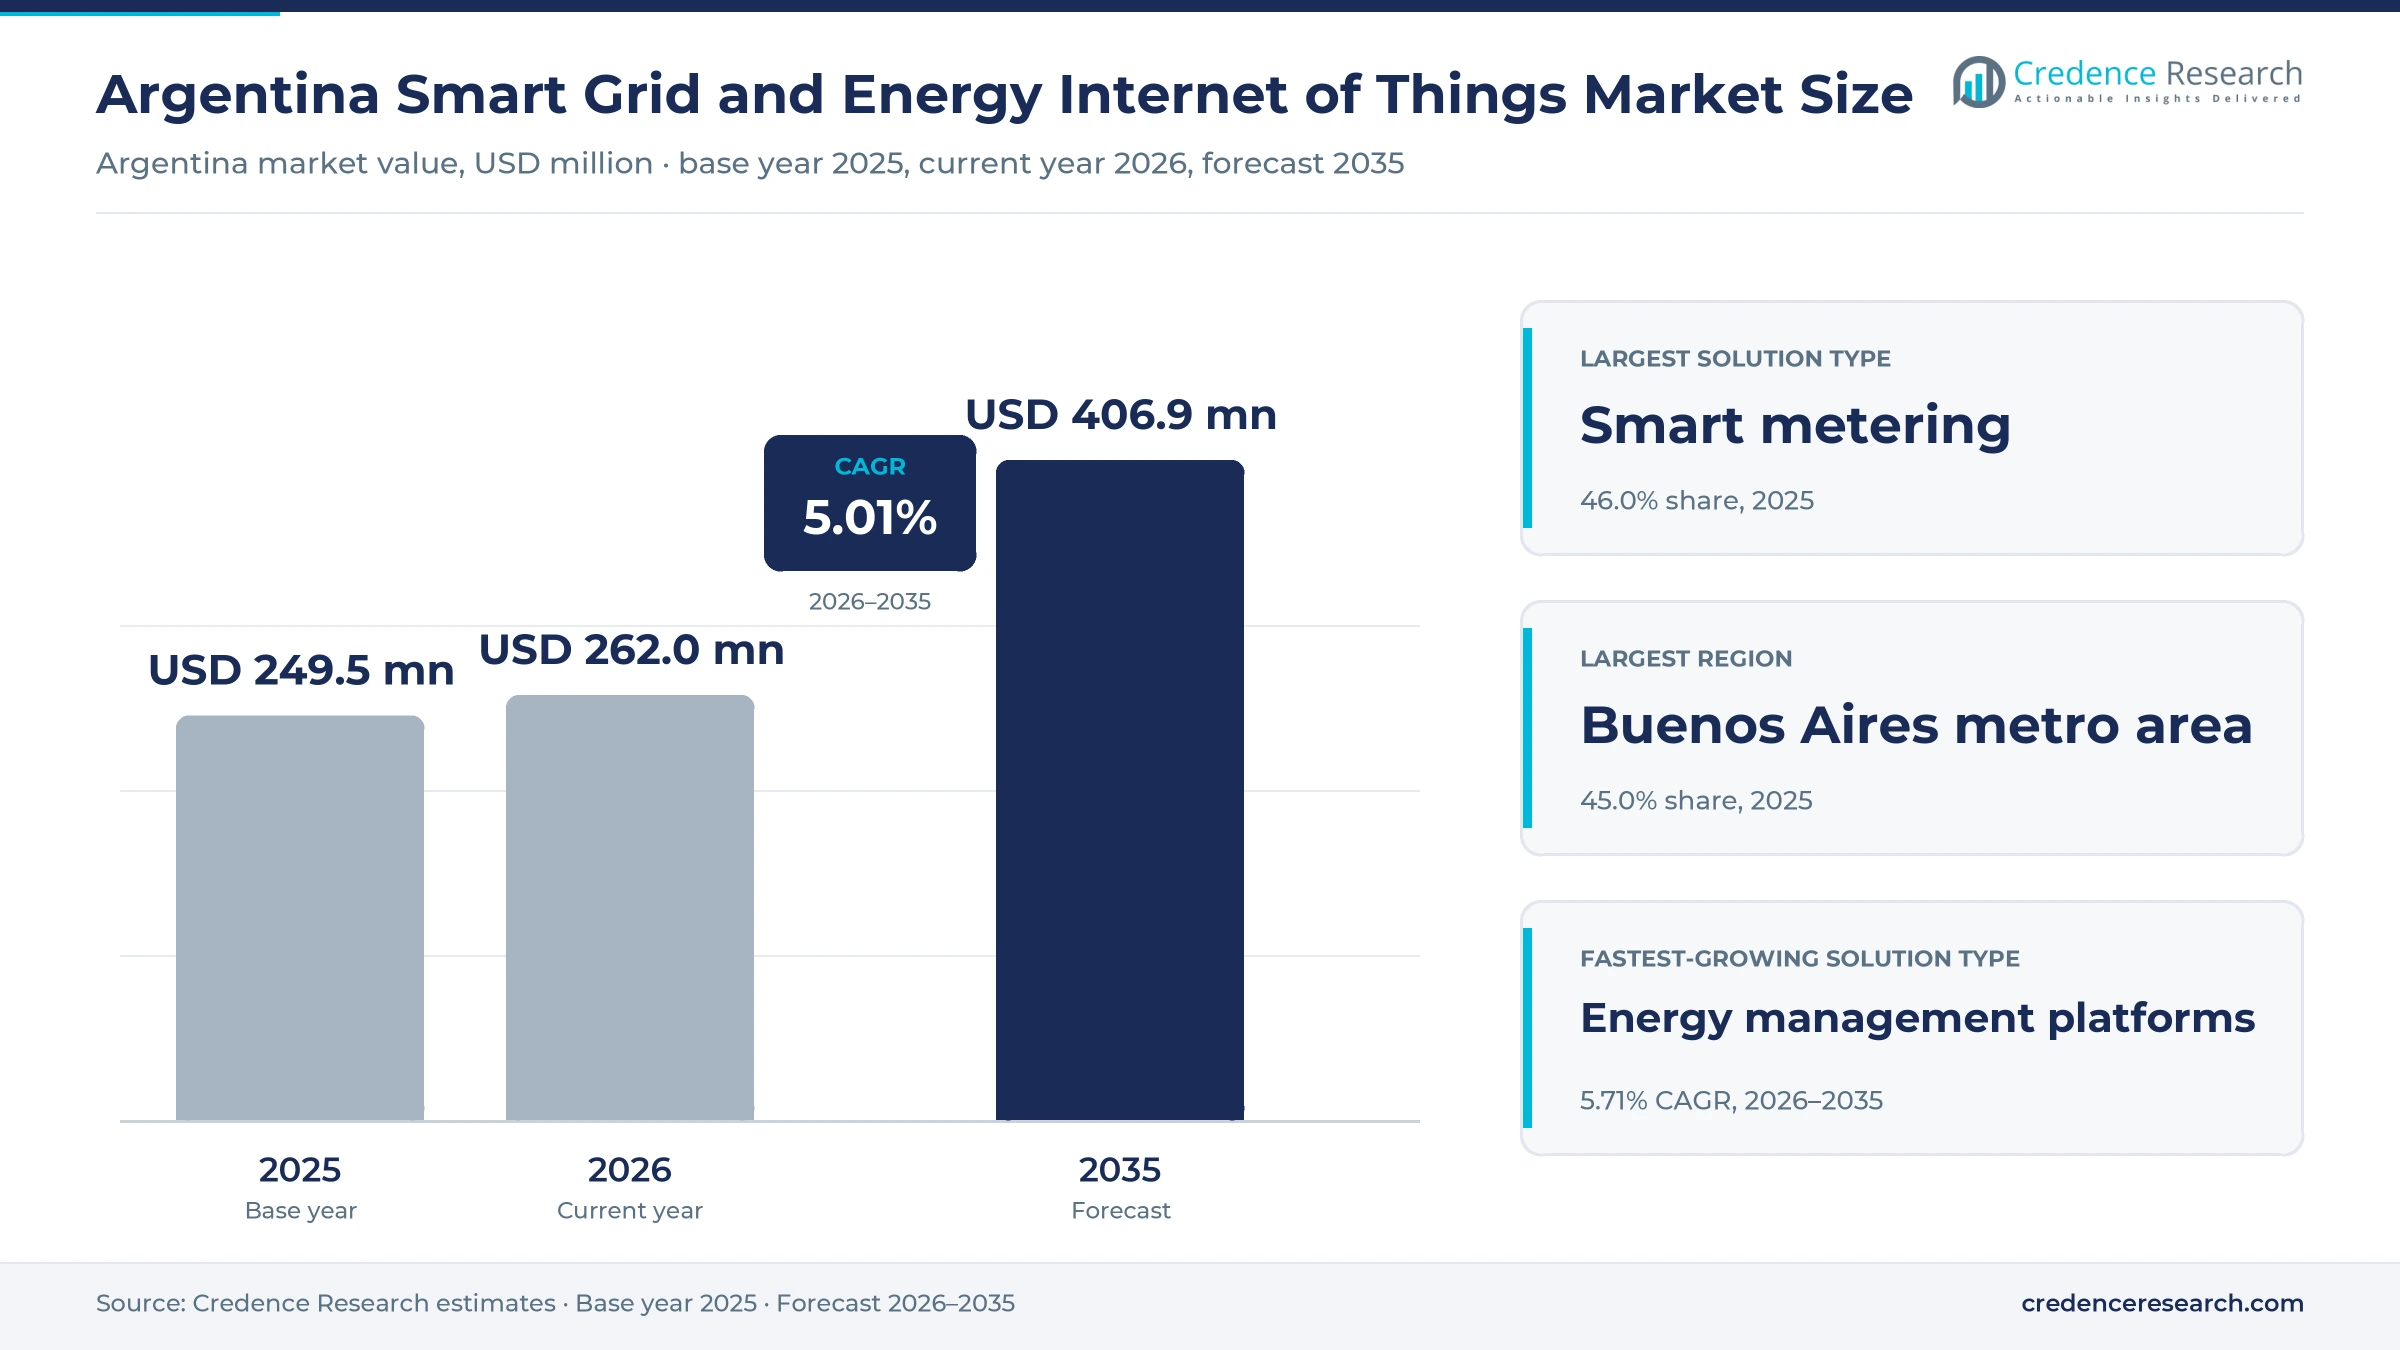
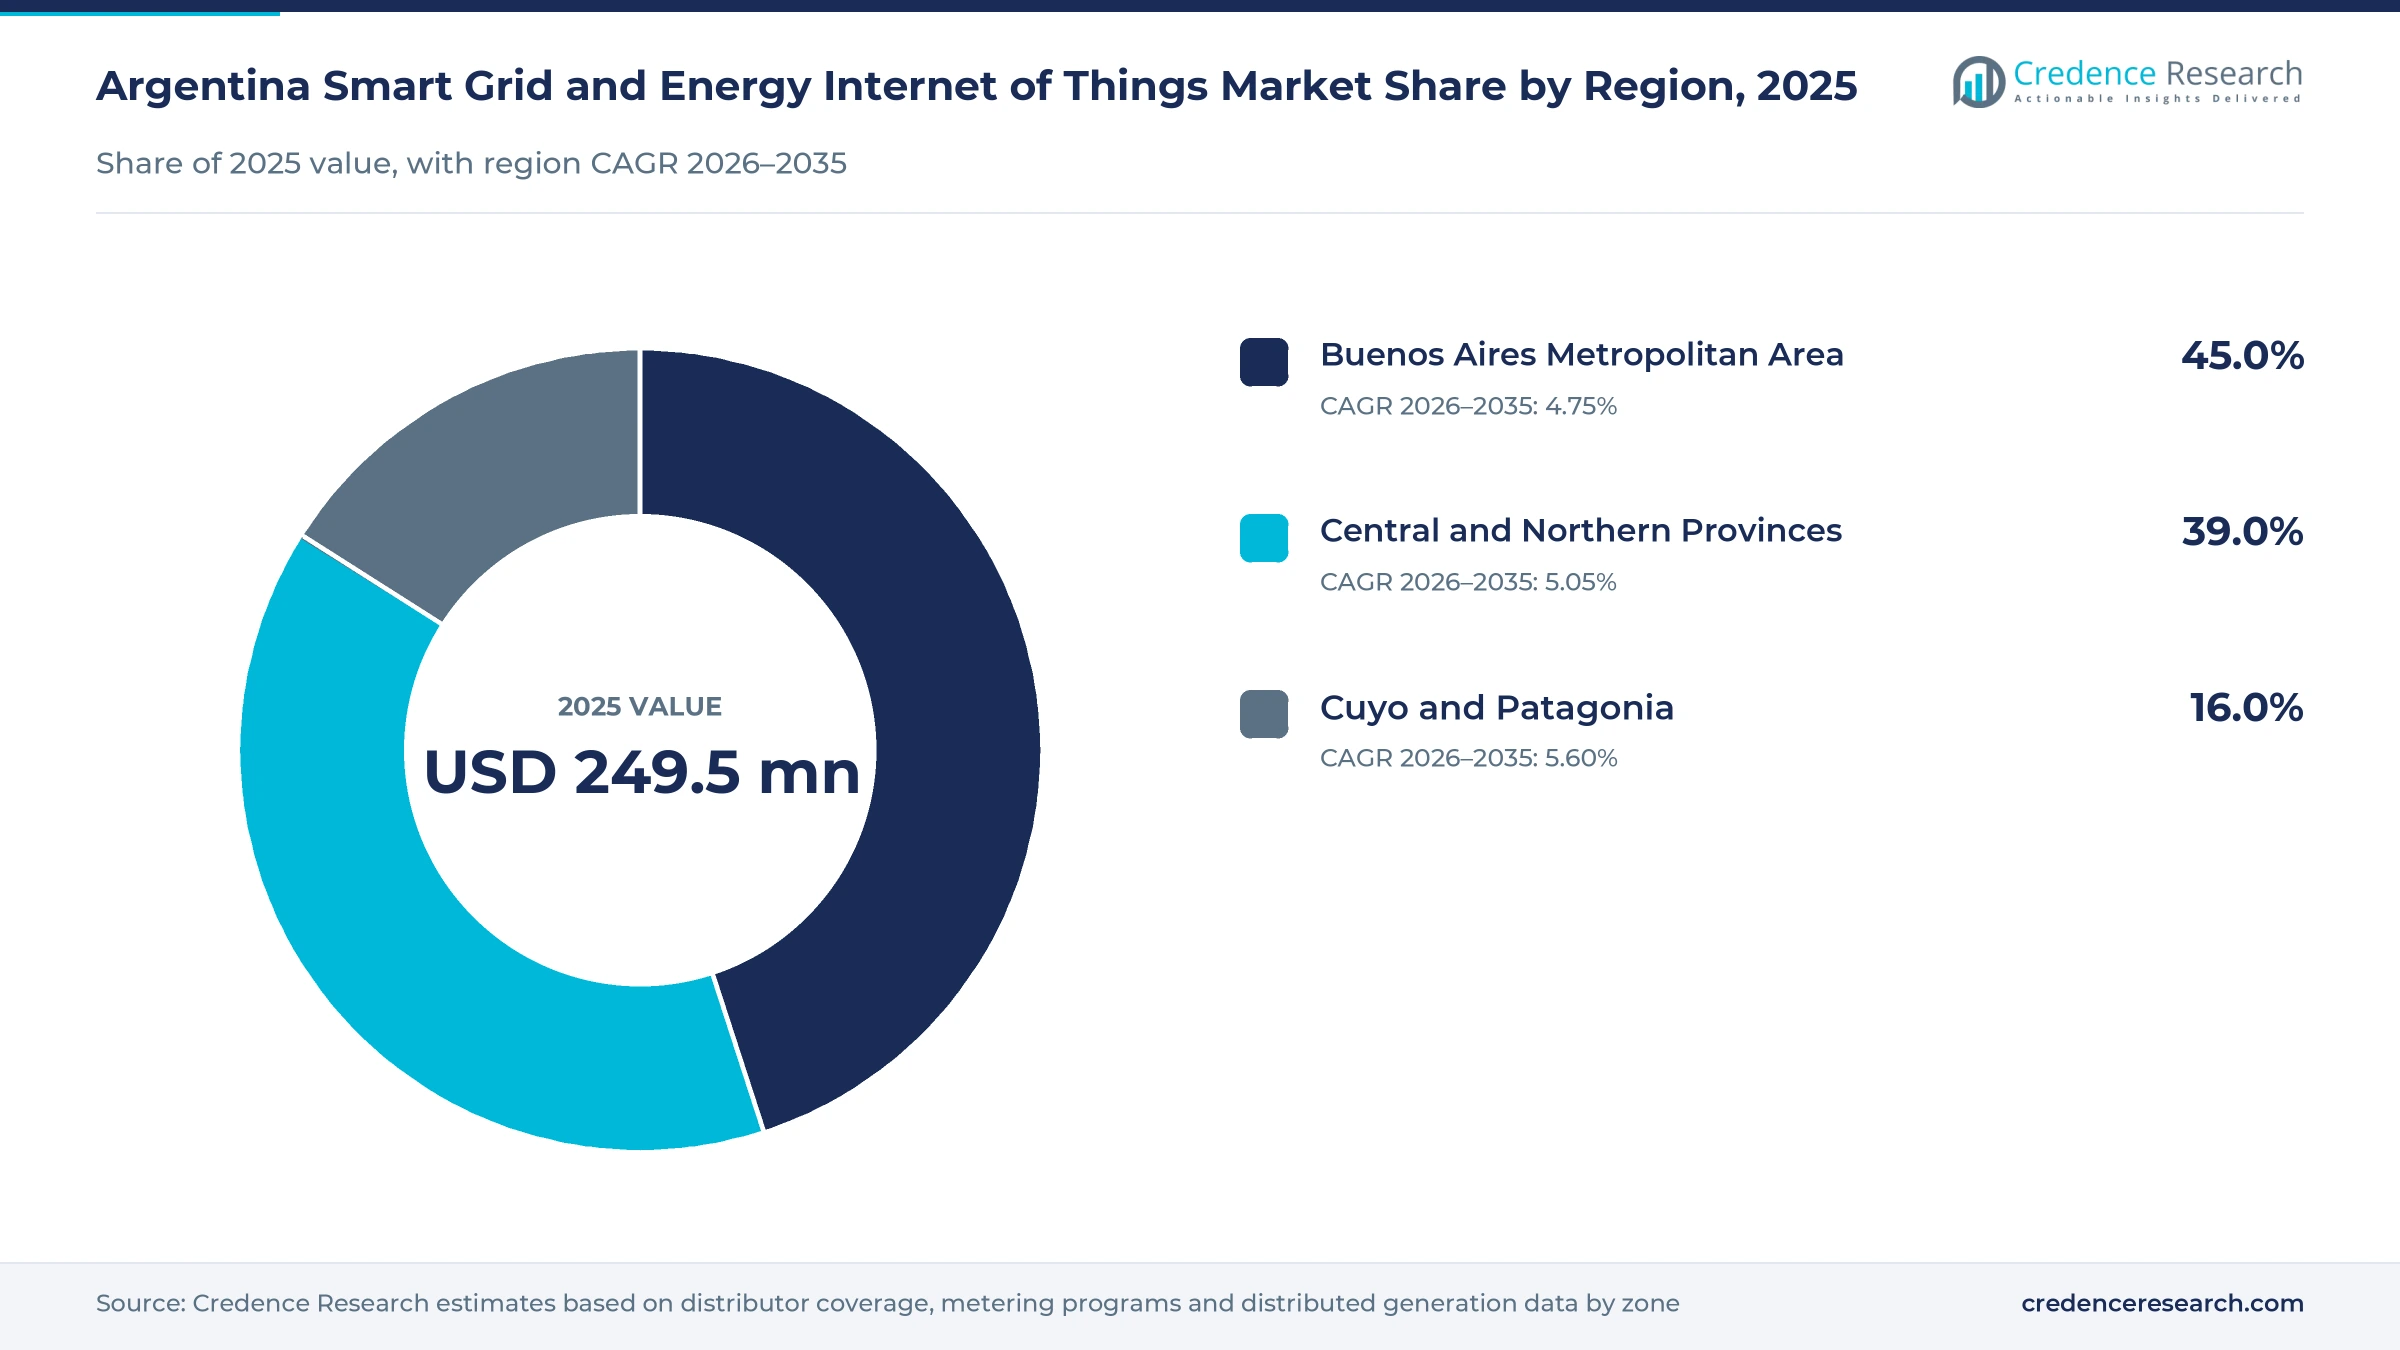
The Argentina smart grid and energy Internet of Things market was valued at USD 249.5 million in 2025 and is projected to increase from USD 262.0 million in 2026 to USD 406.9 million by 2035, registering a CAGR of 5.01% during 2026–2035. Spending comes from distribution utilities, transmission and system operators, energy producers and commercial and industrial sites that buy meters, automation equipment and energy management software to cut losses and keep supply stable during summer peaks. The Buenos Aires Metropolitan Area held the largest regional share, 45.0% in 2025, because Edenor and Edesur run the densest network and host the national battery program for the capital. Cuyo and Patagonia is the fastest-growing region at 5.60% a year, as Vaca Muerta shale fields add electric load. A national tender awarded 667 MW of battery storage for the metro area, as reported on Sept. 2, 2025, which moved reliability spending from studies to signed contracts.
Which grid digitalization products are counted in this estimate?
The estimate measures what buyers in Argentina spend on smart metering, grid automation and energy management platforms that connect electrical assets to data networks. It counts meters, communication modules, automation and protection devices, meter data and network software, and the subscriptions, connectivity, integration and managed services sold with them.
The estimate excludes conventional electromechanical meters, power lines and transformers bought without digital functions, and the energy itself. The value chain runs from global grid equipment suppliers and domestic meter makers through system integrators and specialist distributors to distribution utilities, cooperatives, transmission companies, generators and industrial sites across the country.
Argentina Smart Grid and Energy Internet of Things Market Insights
- The Argentine market was valued at USD 249.5 million in 2025 and should reach USD 406.9 million by 2035, a CAGR of 5.01% during 2026–2035.
- The Buenos Aires Metropolitan Area held a 45.0% share of 2025 value, because Edenor and Edesur run the densest network and host the national battery program.
- Smart metering led with a 46.0% share of 2025 value, as distributors use remote reading to recover unbilled energy and apply new tariffs.
- A national tender awarded 667 MW of battery storage for the Buenos Aires metro area, with investment above USD 540 million, as reported on Sept. 2, 2025.
- Energy management platforms grow fastest at 5.71% a year during 2026–2035, as self-generators and large users manage renewable supply and hourly prices.
Metering leads while management platforms grow fastest
Why does metering take the largest share of spending?
Based on solution type, the market is categorized into smart metering, grid automation and energy management platforms. Smart metering led with a 46.0% share of 2025 value, because Córdoba, Santa Fe and the capital area utilities are replacing meters to cut losses and bill hourly bands. Energy management platforms grow fastest at 5.71% a year, as self-generators and large sites track renewable supply.
Which buyers fund most grid digitalization projects?
Based on customer type, the market is categorized into distribution utilities, transmission and system operators, energy producers and commercial and industrial facility owners. Distribution utilities led with a 52.0% share of 2025 value, because they buy the meters and feeder devices. Commercial and industrial facility owners grow fastest at 5.69% a year, as renewable purchase duties and rooftop generation push sites to monitor their own load.
Why does revenue protection lead application spending?
Based on application, the market is categorized into revenue protection, reliability management and energy optimization. Revenue protection led with a 42.0% share of 2025 value, because unbilled losses remain the clearest return on meter spending for distributors. Energy optimization grows fastest at 5.54% a year, as time-of-use tariffs and self-generation give users reasons to shift and measure demand.
How are utilities choosing where grid software runs?
Based on deployment model, the market is categorized into on-premises, cloud and hybrid deployments. On-premises systems led with a 56.0% share of 2025 value, because utilities keep meter data and control systems inside their own data centers. Cloud deployments grow fastest at 6.12% a year, as cooperatives and industrial users buy hosted monitoring rather than build servers.
| Segment Group | Leading Sub-segment | Share, 2025 | Fastest-growing Sub-segment | CAGR, 2026–2035 |
|---|---|---|---|---|
| By Solution Type | Smart metering | 46.0% | Energy management platforms | 5.71% |
| By Customer Type | Distribution utilities | 52.0% | Commercial and industrial facility owners | 5.69% |
| By Application | Revenue protection | 42.0% | Energy optimization | 5.54% |
| By Deployment Model | On-premises | 56.0% | Cloud | 6.12% |
Request a Free Sample
Fill in your details and we'll send you a free sample report.
- Sample data tables & charts
- Research methodology
Losses, storage tenders and self-generation drive demand
How do unbilled losses make metering the first priority?
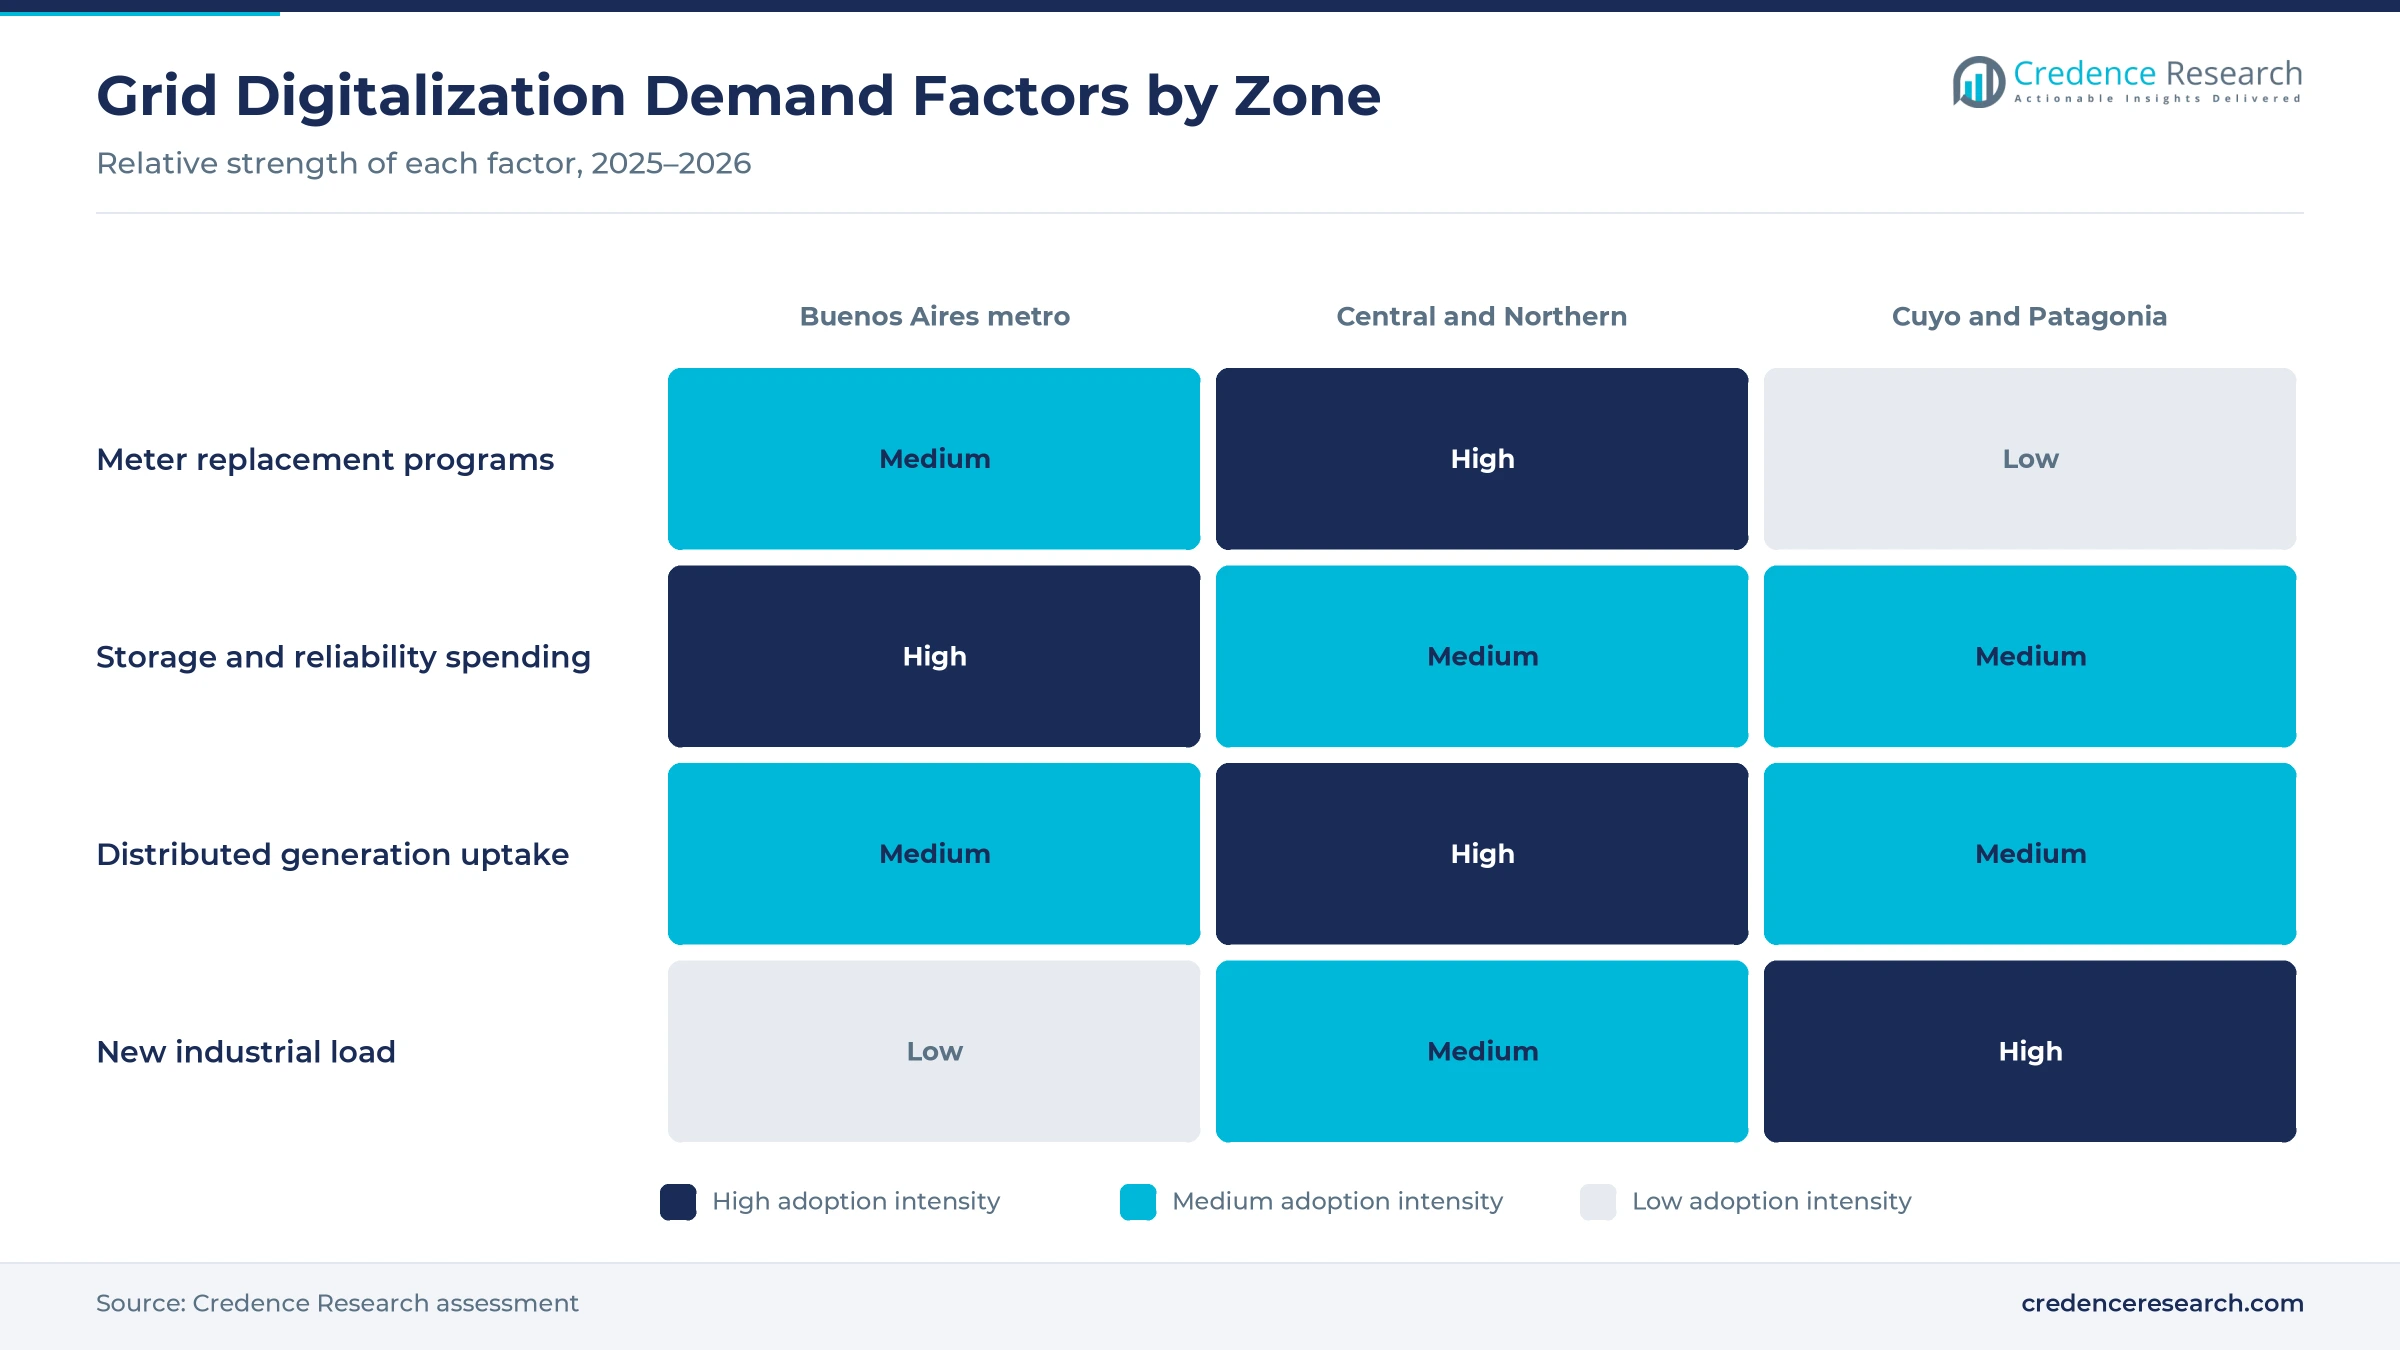
Each kilowatt-hour recovered from theft or misreading improves a distributor's cash flow, so loss control comes first in Argentine metering budgets. Argentina loses 15% to 18% of distributed electricity to non-technical losses, according to an Inter-American Development Bank and Adelat report, and iProfesional puts the cost at about USD 650 million a year. Transmission and distribution losses reached 21.5% of output in 2025, against 14.6% in 2021, according to the World Bank. The national regulator ENRE also created a committee through Resolution 100/2024 in February 2024 to study smart meters in the Edenor and Edesur concession areas. As a result, revenue protection holds 42.0% of 2025 value.
Why do storage tenders and peak stress lift reliability spending?
Record summer peaks and outages push operators to fund storage, automation and monitoring that keep feeders running under stress. Demand on the national grid passed 30,000 MW on Feb. 10, 2025, above the 29,653 MW record of Feb. 1, 2024, while more than 15,000 metro area users lost power, according to Los Andes. The national government then awarded 667 MW of battery storage in the AlmaGBA tender, with investment above USD 540 million, according to El Economista on Sept. 2, 2025. EconoJournal later put the final award at 713 MW across 12 projects in the Edenor and Edesur networks. In turn, reliability management and grid automation gain weight in capital area budgets through 2035.
How do self-generation and purchase duties push site monitoring?
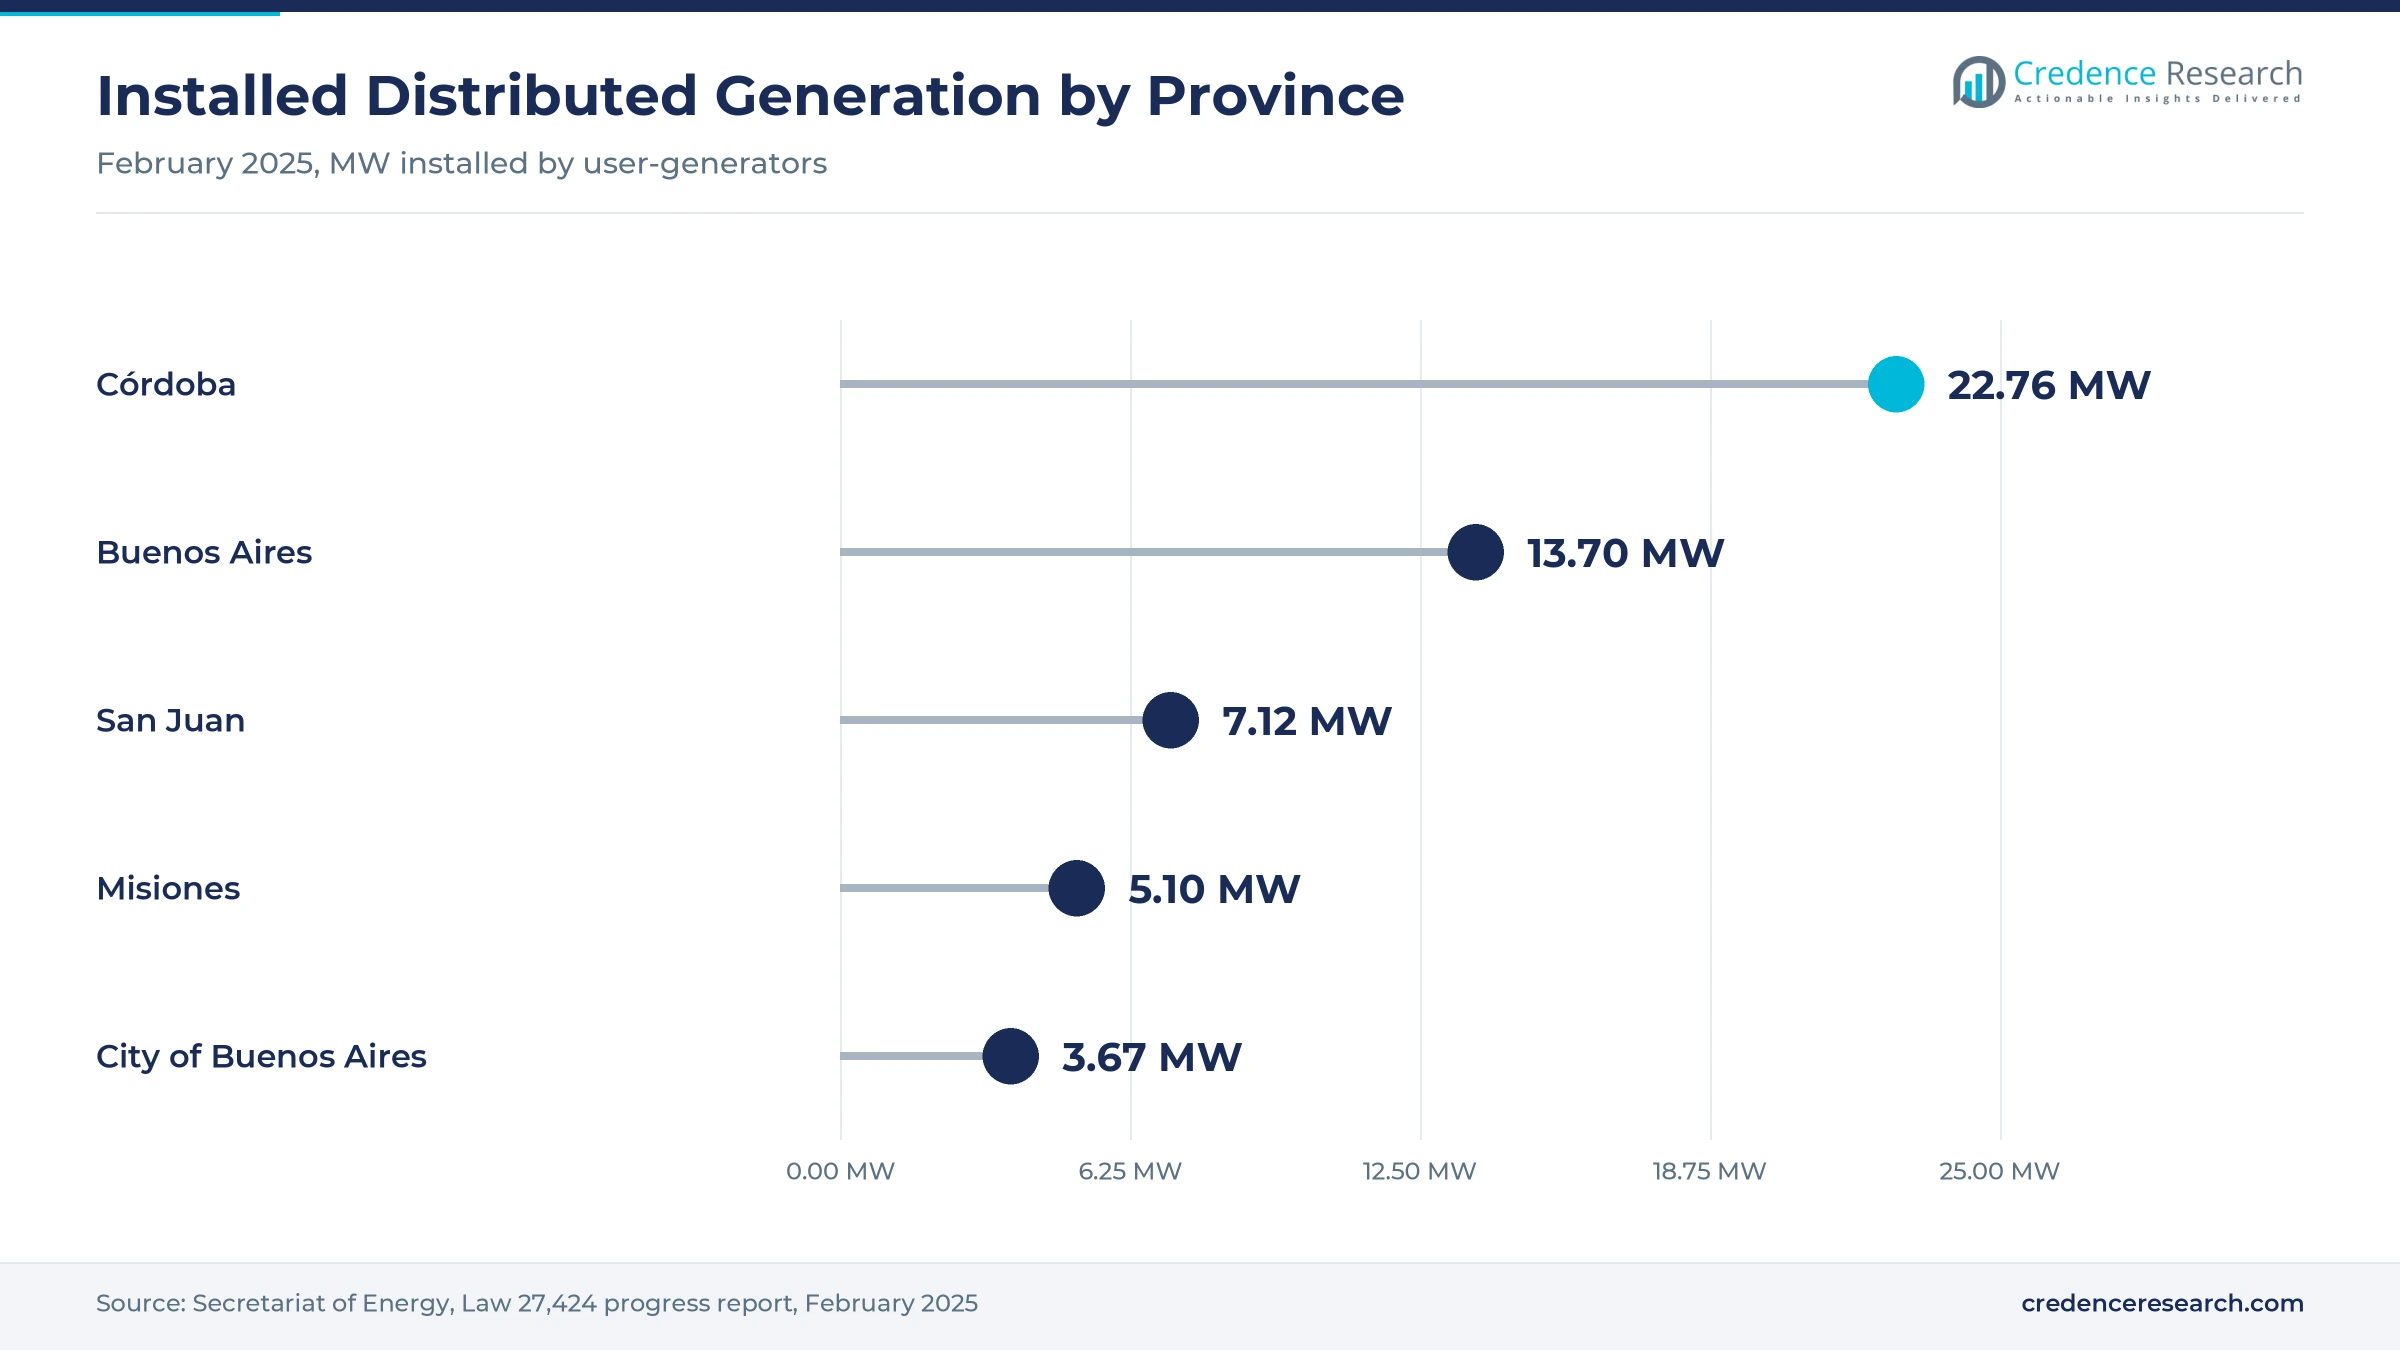
Commercial and industrial sites that produce their own power or buy renewables become active grid users, and they need bidirectional meters and energy management software. Installed distributed generation reached 97,652 kW from 3,306 user-generators in September 2025, according to Secretariat of Energy data reported by LM Neuquén, up from 64,456 kW in February 2025. Córdoba led with 1,341 user-generators and 32,699 kW, ahead of Buenos Aires province with 853 user-generators and 20,500 kW. Since Jan. 1, 2025, users above 300 kW must also source at least 20% of their electricity from renewables, according to La Gaceta. As a result, energy management platforms grow fastest at 5.71% a year.
Why are provincial rollouts and tariff reviews widening orders?
Provincial utilities and the tariff review in the capital area are turning metering pilots into multi-year purchase programs. EPEC in Córdoba had distributed 267,750 meters, about 200,000 of them smart, and targets about 800,000 smart meters within five years at an estimated USD 50 million, according to La Voz del Interior. Santa Fe's EPE opened six bids on Dec. 3, 2025, for 60,000 single-phase and 15,000 three-phase meters, with unit prices from USD 60 to USD 150, according to Cadena 3. Edenor plans to invest about ARS 1.03 trillion under its tariff review for April 2025 to April 2030, according to El Cronista. In turn, distribution utilities hold 52.0% of 2025 market value in Argentina.
Hourly tariffs, cellular links and shale load reshape work
How is the shift to hourly tariffs changing meter demand?
Time-of-use pricing gives smart meters a direct billing role, because tariffs that change by hour cannot be applied through electromechanical meters. Córdoba's regulator ERSeP authorized EPEC to extend hourly bands to households after testing them with large users, according to La Capital in March 2025. The peak band runs from 6 p.m. to 11 p.m., and the cheapest band runs from 11 p.m. to 5 a.m. Smart metering already reaches 25% of Córdoba households, the same report says. Santa Fe's EPE has telemetered about 3,000 large users, which account for 50% of its billing, and plans about 1.3 million meters by 2030. As a result, the Central and Northern Provinces grow at 5.05% a year.
Why does the rise of cellular links and data platforms matter?
Distributors are moving from manual reads to cellular links and central data platforms, which turns meters into network sensors. Edenor and Movistar tested NB-IoT readings from meters at transformer centers across more than 20 municipalities with nearly 9 million inhabitants, according to El Economista in March 2021. Siemens said in January 2024 that its EnergyIP meter data platform at EPEC covered 220,000 users, with a goal of about 1.2 million, according to EconoJournal. Siemens also supplies the SIGUARD system that gathers measurements from strategic grid points for the market operator CAMMESA. Domestic maker Powermeter sells IoT meters with cloud software for round-the-clock monitoring. In turn, cloud deployments grow fastest at 6.12% a year.
Can Vaca Muerta electrification open automation work in Patagonia?
Shale fields in Neuquén are adding electric load quickly, which opens work in substation automation, feeder monitoring and site energy management. Peak load on the 33 kV feeder at the Loma Campana substation rose from 13.2 MW in May 2022 to 28.1 MW in December 2024, according to provincial utility EPEN as reported by LM Neuquén. Demand from Loma Campana projects grew 112% in three years, while Neuquén oil output reached 467,467 barrels a day in December 2024, almost 23% above 2023. EPEN is also studying 500 kV and 132 kV expansions under its Vaca Muerta electrical infrastructure plan. As a result, Cuyo and Patagonia gain share against the capital zone through 2035.
Is there room for storage and metering beyond the capital area?
Storage and metering programs are spreading from the capital area to interior networks, which opens new work for integrators, specialist distributors and generators. EconoJournal reported in January 2026 that a new AlmaSADI tender would seek about 700 MW of batteries at saturated nodes in the northwest, the northeast and parts of Patagonia, under 15-year contracts. Interior cooperatives are also buying domestic equipment, as the Río Primero electricity cooperative plans about 4,500 DISCAR meters for more than ARS 1,000 million, according to InfoNegocios in March 2025. Those meters measure flows in both directions and support prepaid or postpaid billing. In turn, energy producers gain share as storage and interior metering contracts spread across the provinces through 2035.
Affordability, imports and split regulators slow rollouts
How does household affordability slow meter replacement?
Rising tariffs already strain family budgets, so utilities pace rollouts carefully and avoid adding visible costs to monthly bills. Residential smart meters cost about USD 50 to USD 70 in Argentina, while units for large users cost USD 400 to USD 600, according to InnovaciónDigital360 in October 2024. As a result, distributors spread purchases over many years and favor the zones with the highest losses. Cooperatives that fund meters from their own budgets, such as Río Primero, plan replacement over three to five years.
Why do import conditions and currency swings raise project risk?
Import rules and currency swings can change the cost of meters and relays after budgets are approved, which raises risk for multi-year programs. EPEC said its schedule of full metering within seven years could stretch or shrink with the economy and import conditions, according to La Voz del Interior. In turn, utilities prefer staged tenders with dollar unit prices. Domestic makers such as DISCAR, which uses hardware and software developed in Argentina, gain an edge when imports slow down.
How do split regulators complicate national rollouts?
Electricity distribution is regulated by the national ENRE in the capital area and by provincial bodies elsewhere, which leaves each zone with its own metering rules and tariff designs. ENRE Resolution 100/2024 covers only the Edenor and Edesur concession areas, while ERSeP approved hourly bands for Córdoba on its own. Santa Fe's EPE said hourly bands were not under study, according to La Capital. As a result, suppliers must adapt products and contracts province by province, which raises sales costs.
Why does slow self-generation uptake limit platform demand?
Distributed generation is growing quickly from a small base, which limits the number of sites that need advanced energy management today. Installed capacity of 97,652 kW in September 2025 compares with the goal of 1,000 MW of distributed renewables in 12 years set under the regulation of Law 27,424. In turn, platform vendors still depend on large industrial users and utilities for most orders. Faster adhesion by provinces and simpler connection steps would widen the base of buyers for these tools.
Buenos Aires leads while Cuyo and Patagonia grow fastest
| Region | Value, 2025 (USD million) | Share, 2025 | CAGR, 2026–2035 |
|---|---|---|---|
| Buenos Aires Metropolitan Area | 112.3 | 45.0% | 4.75% |
| Central and Northern Provinces | 97.3 | 39.0% | 5.05% |
| Cuyo and Patagonia | 39.9 | 16.0% | 5.60% |
Edenor, Edesur and new batteries keep the capital area ahead
The Buenos Aires Metropolitan Area held a 45.0% share of 2025 value and grows at 4.75% a year. The AlmaGBA program places battery storage at the most stressed nodes of the Edenor and Edesur networks. GE Vernova announced in August 2024 a contract to maintain three Edesur substations that supply more than 500,000 homes and industries. Edenor also plans new substations at Villa Tesei, General Rodríguez and the northern corridor toward San Isidro, so the zone keeps the lead.
Córdoba and Santa Fe drive meter rollouts in the interior
The Central and Northern Provinces held a 39.0% share of 2025 value and grow at 5.05% a year. Córdoba leads the country in self-generation, and EPEC already reaches 25% of provincial households with smart metering. Santa Fe's EPE plans to cover about 1.3 million meters by 2030. Misiones counted 5,095 kW of installed self-generation in February 2025, the fourth-largest provincial total, which adds bidirectional metering demand in the northeast.
How do shale load and solar sites lift Cuyo and Patagonia?
Cuyo and Patagonia held a 16.0% share of 2025 value and grow fastest at 5.60% a year. San Juan counted 7,119 kW of installed self-generation in February 2025, the third-largest provincial total. Chubut had 775 kW and Río Negro 614 kW in September 2025, while Neuquén had 394 kW. Rising load in Vaca Muerta and the planned AlmaSADI batteries in parts of Patagonia lift automation and monitoring work faster than in other zones.
Tenders, tariff rules and contracts, 2024–2026
| Development | Status and market relevance |
|---|---|
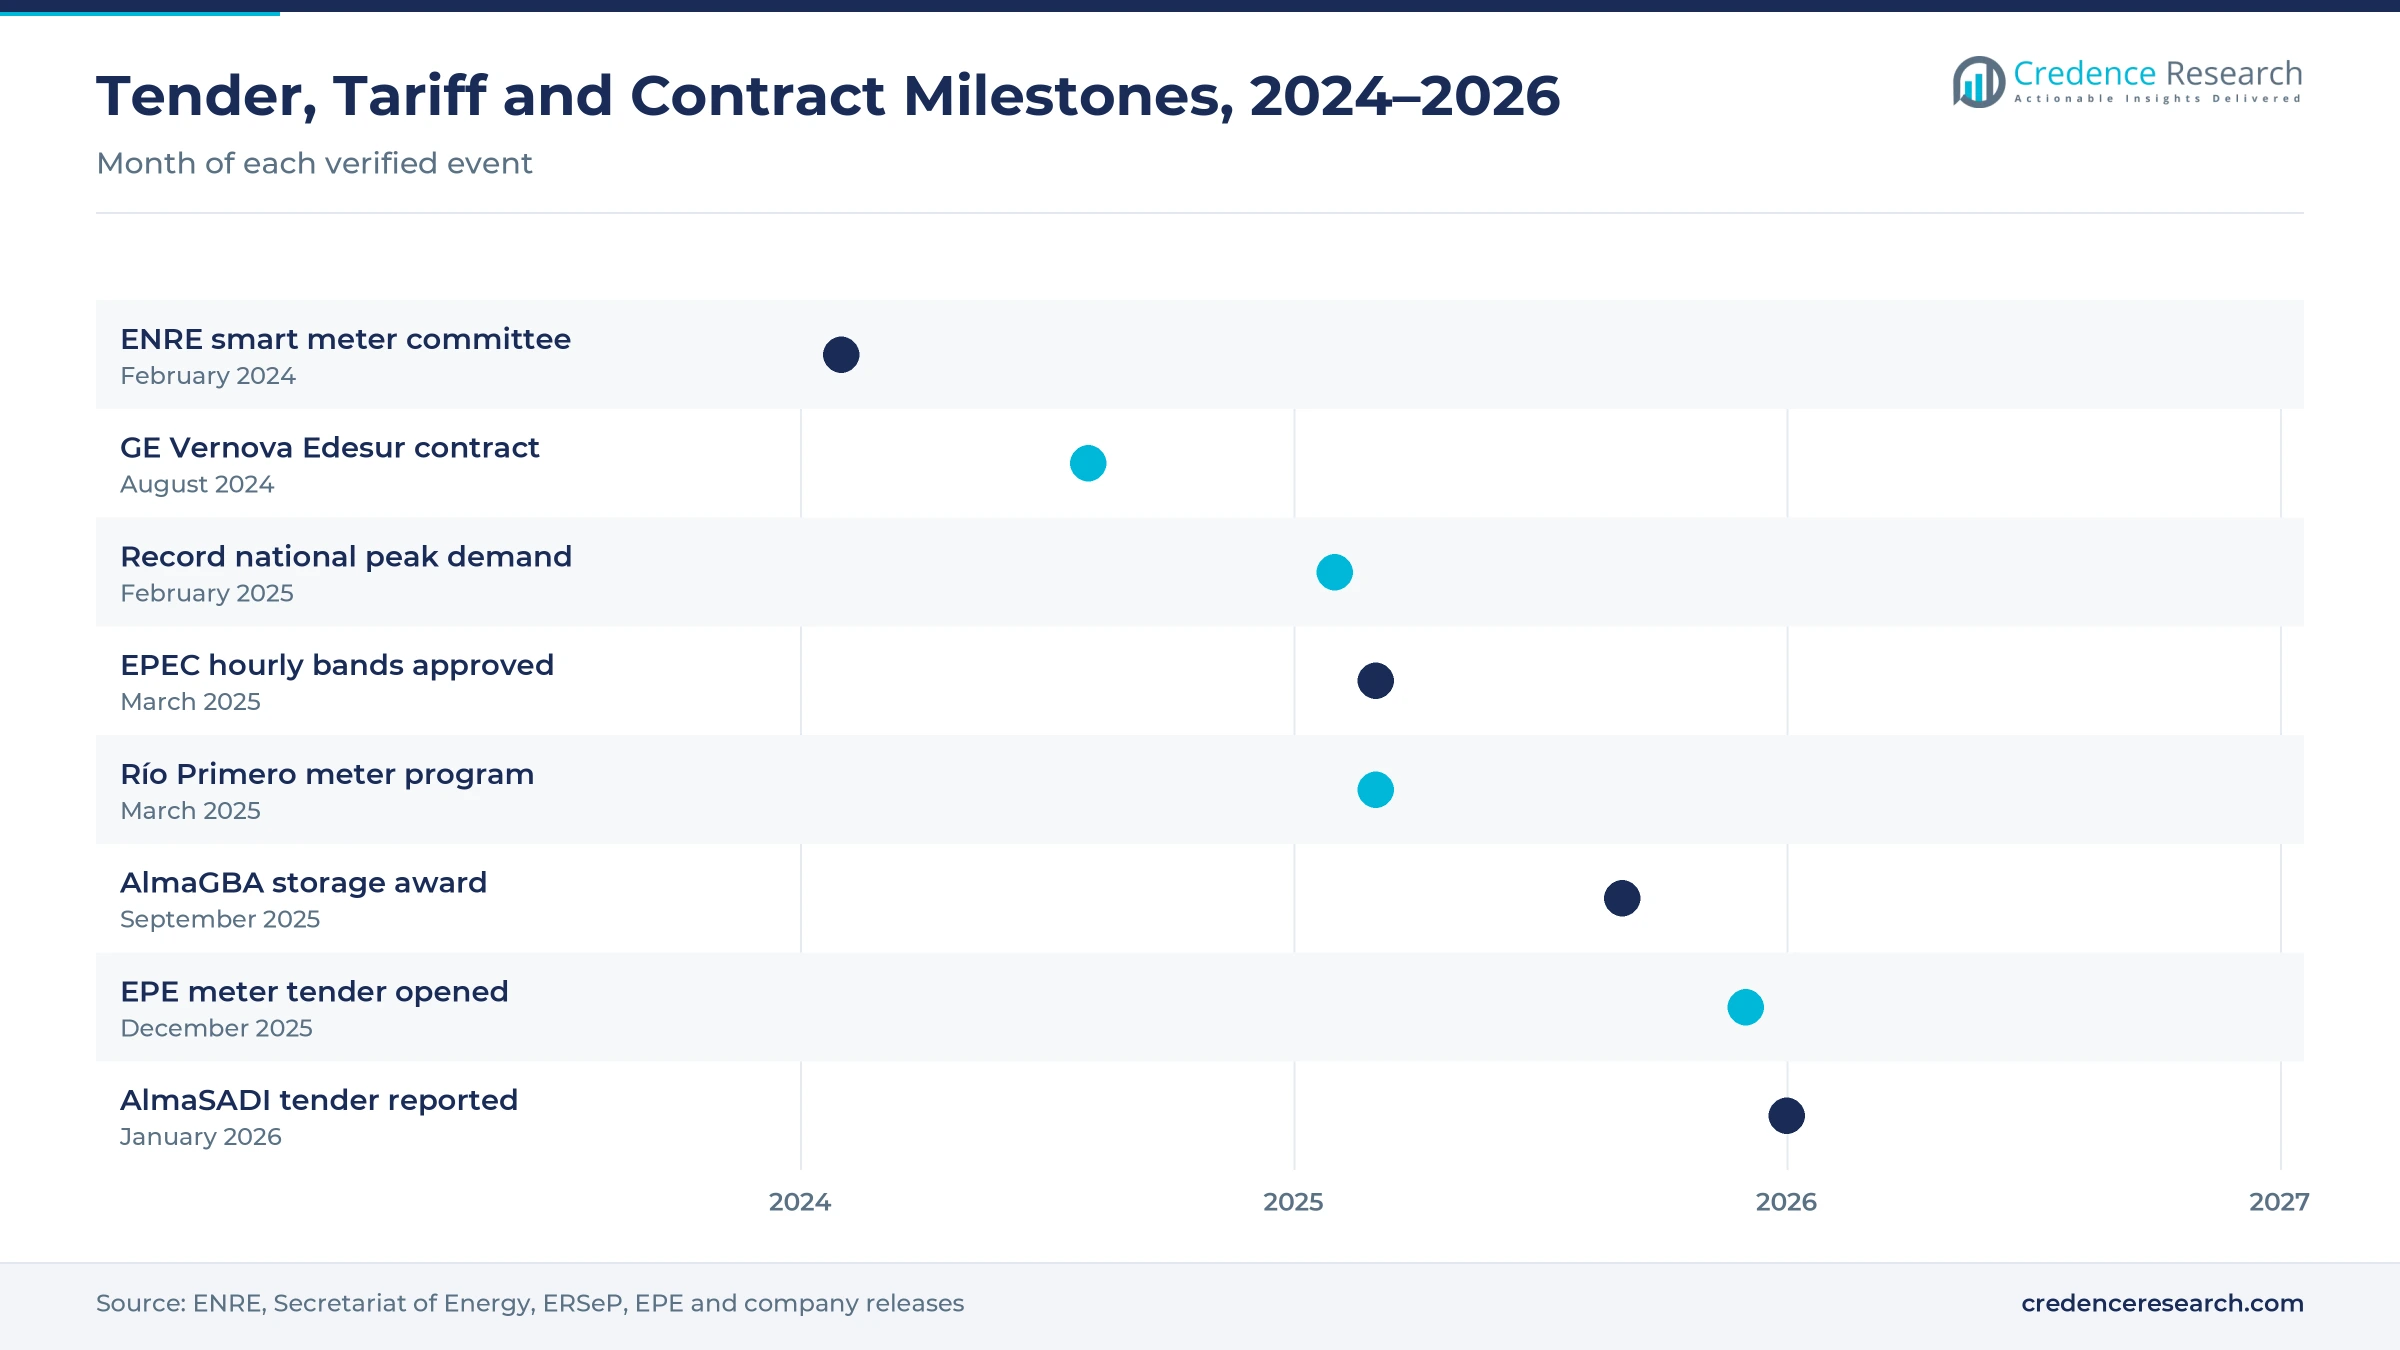
| In August 2024, GE Vernova won a services contract from Edesur to maintain three substations that supply more than 500,000 homes and industries in Buenos Aires. | Raises reliability services in the capital area |
| In March 2025, Córdoba regulator ERSeP authorized EPEC to apply time-of-use bands to residential users with smart meters. | Gives meters a direct billing role |
| In September 2025, the national government awarded 667 MW of battery storage for the Buenos Aires metro area in the AlmaGBA tender. | Moves storage and reliability spending to contracts |
| In December 2025, Santa Fe utility EPE opened six bids for 60,000 single-phase and 15,000 three-phase smart meters. | Expands metering orders in the interior |
| In January 2026, EconoJournal reported a planned AlmaSADI tender for about 700 MW of batteries at saturated interior nodes. | Extends storage demand beyond Buenos Aires |
Meters, data platforms and automated substations
- Bidirectional smart meters measure energy in both directions, support prepaid or postpaid billing and apply hourly bands, which lets distributors bill self-generators and detect tampering remotely.
- Meter data platforms collect readings over radio or cellular links and feed meter data management systems such as the one EPEC bought from Siemens, which flag losses and failing transformers.
- Automated substations and feeders combine protection relays, teleprotection multiplexers and distribution automation devices, which isolate faults and restore supply faster during summer peaks.
Need a Custom Version of This Report?
Tailor the scope, geography, or segments to your exact requirements.
- Custom geography or segment scope
- Direct access to our analyst team
Global grid suppliers compete with domestic meter makers
Competition centers on global grid equipment suppliers with Argentine operations and on domestic meter makers that sell to provincial utilities and cooperatives. Siemens supplies the EnergyIP meter data platform at EPEC and the SIGUARD measurement system for CAMMESA, according to EconoJournal. Hitachi Energy supplies FOX615 multiplexers for teleprotection on the 500 kV network of Transener, which spans 15,408 km of high-voltage lines. GE Vernova maintains three Edesur substations, and Schneider Electric has operated in Argentina for more than 40 years with 485 direct employees and a plant in Pacheco, according to Forbes Argentina. DISCAR in Córdoba builds meters and software for cooperatives, while Powermeter sells meters with cloud monitoring. Suppliers of advanced metering infrastructure compete on unit price, local support and proof of lower losses.
Which suppliers are active in Argentine grid digitalization?
| Company | Type | Role in the market |
|---|---|---|
| Siemens | Grid software and automation supplier | Supplies the EnergyIP meter data platform at EPEC and the SIGUARD system for CAMMESA |
| Hitachi Energy | Grid communication and automation supplier | Supplies FOX615 teleprotection multiplexers for the Transener 500 kV network |
| GE Vernova | Grid equipment and services supplier | Maintains three Edesur substations serving more than 500,000 homes and industries |
| Schneider Electric | Electrical distribution and automation supplier | Has operated in Argentina for more than 40 years and runs a plant in Pacheco |
| ABB | Electrical equipment supplier | Supplied 106 compact secondary substations and 10 eHouses for the Cauchari solar project in Jujuy |
| DISCAR | Domestic meter maker | Córdoba company supplying bidirectional meters with domestic hardware and software to cooperatives |
| Powermeter | Domestic IoT metering supplier | Sells IoT meters and cloud software for continuous monitoring of sites |
Credence Research view on Argentine grid digitalization
Credence Research's view is that Argentine grid digitalization will grow steadily rather than in a single national wave, because each province sets its own metering plan and tariff design. Loss recovery and storage contracts in the capital area give the market a firm base, while Córdoba and Santa Fe show how hourly tariffs turn meters into billing tools. Suppliers that combine affordable meters, hosted data platforms and local support for cooperatives should gain the most from the Argentina smart grid and energy Internet of Things opportunity through 2035.
How the Argentine grid digitalization estimate was built
The report uses 2025 as the base year on a calendar basis, and market values come from the Credence Research model. That model combines World Bank network loss statistics, Secretariat of Energy distributed generation reports, storage tender results, regulator resolutions, provincial utility metering programs and company announcements. Segment splits and zone shares and growth rates are Credence Research estimates built from distributor coverage, metering programs, distributed generation and industrial load by zone. Sources used are official statistics, regulations, utility and company releases and news reports that name their sources, and Credence Research conducted no interviews or surveys of its own for this report.
Interior rollouts and platforms lead growth to 2035
Spending in the Argentina smart grid and energy Internet of Things market is expected to reach USD 406.9 million by 2035, a 5.01% CAGR during 2026–2035, as distributors replace meters and operators automate stressed networks. Growth should come from energy management platforms, cloud deployments, commercial and industrial sites and the Cuyo and Patagonia zone. Steadier prices and clear import rules would let utilities sign larger tenders, while renewed inflation would slow household meter replacement. Suppliers that pair metering with demand response tools for hourly tariffs are expected to gain share.
Frequently Asked Questions
How big is the Argentina smart grid and energy Internet of Things market?
Which solution type leads the Argentine market?
Which region leads the Argentine market?
How large are electricity losses in Argentina?
What battery storage has Argentina contracted?
How fast is distributed generation growing in Argentina?
Which companies are active in the Argentine market?
What are the main challenges for grid digitalization in Argentina?
Table of Content
Chapter 1 Market Segmentation
- 1.1 Segmentation Framework
- 1.1.1 Product and Service Classification
- 1.1.2 Application and End-Use Classification
- 1.1.3 Technology and Solution Classification
- 1.1.4 Customer and Distribution Channel Classification
- 1.1.5 Geographic Segmentation
- 1.1.6 Market Segment Definitions and Boundaries
- 1.2 By Solution Type
- 1.2.1 Smart metering
- 1.2.2 Grid automation
- 1.2.3 Energy management platforms
- 1.3 By Customer Type
- 1.3.1 Distribution utilities
- 1.3.2 Transmission and system operators
- 1.3.3 Energy producers
- 1.3.4 Commercial and industrial facility owners
- 1.4 By Application
- 1.4.1 Revenue protection
- 1.4.2 Reliability management
- 1.4.3 Energy optimization
- 1.5 By Deployment Model
- 1.5.1 On-premises
- 1.5.2 Cloud
- 1.5.3 Hybrid
Chapter 2 Introduction
- 2.1 Report Objectives and Scope
- 2.2 Product Definition and Industry Terminology
- 2.3 Market Inclusions and Exclusions
- 2.4 Research Process
- 2.4.1 Primary Research and Expert Interviews
- 2.4.2 Secondary Research and Source Review
- 2.4.3 Top-Down and Bottom-Up Estimation
- 2.4.4 Data Triangulation and Verification
- 2.5 Market Size Measurement Basis
- 2.5.1 2025: USD 249.5 million → 2035: USD 406.9 million
- 2.6 Historical and Forecast Reference Periods
- 2.6.1 Historical Period: 2018-2025
- 2.6.2 Base Year: 2025
- 2.6.3 Forecast Period: 2025-2035
- 2.7 Research Assumptions and Limitations
Chapter 3 Executive Summary
- 3.1 Market Snapshot and Key Findings
- 3.2 Base-Year Market Size, 2025
- 3.3 Forecast Market Size, 2035
- 3.4 Revenue and Volume Growth Outlook
- 3.5 Key Demand and Supply Indicators
- 3.6 Leading Market Segments
- 3.7 Fastest-Growing Market Opportunities
- 3.8 Regional Performance Highlights
- 3.9 Technology and Industry Transformation
- 3.10 Competitive Landscape Summary
- 3.11 Analyst View and Strategic Implications
Chapter 4 Argentina Smart Grid and Energy Internet of Things Market Trends and Developments
- 4.1 Historical Industry Development, 2018-2025
- 4.2 Recent Market Trends and Developments
- 4.3 Demand and Customer Behavior Trends
- 4.4 Technology and Product Innovation
- 4.5 Artificial Intelligence, Automation and Digitalization
- 4.6 Local Manufacturing and Supply Chain Realignment
- 4.7 Industry Partnerships, Mergers and Acquisitions
- 4.8 Sustainability and Circular Economy Developments
- 4.9 Government and Private Sector Investment Trends
- 4.10 Emerging Business Models and Commercialization
- 4.11 Industry Developments and Announcements
Chapter 5 Argentina Smart Grid and Energy Internet of Things Market Production, Supply and Demand Analysis
- 5.1 Demand Trend and Consumption Analysis, 2018-2025
- 5.2 Demand Forecast, 2025-2035
- 5.3 Production and Output Trend, 2018-2025
- 5.4 Production and Output Forecast, 2025-2035
- 5.5 Installed Capacity and Capacity Utilization
- 5.6 Company-Wise Production Plants and Statistics
- 5.6.1 Installed Production Capacity
- 5.6.2 Actual Production
- 5.6.3 Planned Capacity and Expansion Targets
- 5.7 Supply Chain Structure and Procurement Trends
- 5.8 Supply-Demand Gap and Bottlenecks
- 5.9 Import Dependence and Sourcing Structure
- 5.10 Contract Manufacturing and Outsourcing
- 5.11 Regional Supply and Demand Concentration
Chapter 6 Argentina Smart Grid and Energy Internet of Things Market Pricing Analysis
- 6.1 Pricing Structure and Measurement
- 6.2 Historical Pricing Trends, 2018-2025
- 6.3 Pricing Outlook, 2025-2035
- 6.4 Average Selling Price and Unit Economics
- 6.5 Pricing by Product and Market Segment
- 6.6 Geographic Pricing Differences
- 6.7 Key Input, Energy, Labor and Logistics Costs
- 6.8 Contract Pricing and Purchasing Models
- 6.9 Pricing Sensitivity and Competitive Positioning
- 6.10 Price, Margin and Profitability Implications
Chapter 7 Argentina Smart Grid and Energy Internet of Things Market Dynamics
- 7.1 Market Growth Drivers
- 7.1.1 Demand-Side Drivers
- 7.1.2 Technology and Innovation Drivers
- 7.1.3 Infrastructure and Investment Drivers
- 7.1.4 Regulatory and Policy Drivers
- 7.2 Market Restraints
- 7.2.1 Cost and Affordability Constraints
- 7.2.2 Technology and Adoption Barriers
- 7.2.3 Supply Chain and Operational Constraints
- 7.3 Market Challenges
- 7.3.1 Competitive Pressure and Margin Erosion
- 7.3.2 Skills, Infrastructure and Implementation Gaps
- 7.4 Emerging Market Opportunities
- 7.5 Market Dynamics Impact and Time-Horizon Assessment
Chapter 8 Argentina Smart Grid and Energy Internet of Things Value Chain Analysis
- 8.1 Industry Value Chain Overview
- 8.2 Upstream Suppliers and Critical Inputs
- 8.3 Technology and Component Providers
- 8.4 Manufacturing or Service Delivery
- 8.5 Distribution, Channel Partners and Integrators
- 8.6 Downstream Applications and End Users
- 8.7 Value Addition and Profit Pools
- 8.8 Vertical Integration and Outsourcing
- 8.9 Supplier Concentration and Risk
- 8.10 Supply Chain Localization and Resilience
Chapter 9 Argentina Smart Grid and Energy Internet of Things Market Regulations and Policies
- 9.1 Relevant Laws, Standards and Compliance Frameworks
- 9.2 Product, Service, Safety and Quality Requirements
- 9.3 Government Policies, Incentives and Subsidies
- 9.4 Imports, Exports and Trade Barriers
- 9.5 Public Procurement and Local Content Requirements
- 9.6 Environmental and Sustainability Compliance
- 9.7 Upcoming Policy Changes and Market Implications
Chapter 10 Argentina Smart Grid and Energy Internet of Things Market Hotspots and Opportunities
- 10.1 Market Opportunity Mapping and Growth Hotspots
- 10.2 High-Growth Applications and Customer Groups
- 10.3 Underserved Markets and White-Space Opportunities
- 10.4 Emerging Technology and Product Opportunities
- 10.5 New Capacity and Investment Hotspots
- 10.6 Market Entry and Expansion Opportunities
- 10.7 Distribution and Partnership Opportunities
- 10.8 Near-Term and Long-Term Commercial Potential
- 10.9 Opportunity Attractiveness and Execution Risks
Chapter 11 Argentina Smart Grid and Energy Internet of Things Market Outlook, 2025-2035
- 11.1 Market Size and Analysis
- 11.1.1 Revenue (Market Measurement: 2025: USD 249.5 million → 2035: USD 406.9 million)
- 11.1.2 Market Volume and Quantity Sold
- 11.1.3 Historical Market Size, 2018-2025
- 11.1.4 Base-Year Market Size, 2025
- 11.2 Market Forecast, 2025-2035
- 11.2.1 Revenue Forecast to 2035
- 11.2.2 Volume Forecast to 2035
- 11.2.3 CAGR and Year-on-Year Growth
- 11.2.4 Incremental Revenue Opportunity
- 11.3 Forecast Assumptions and Scenario Analysis
- 11.3.1 Base-Case Forecast
- 11.3.2 Optimistic and Conservative Scenarios
- 11.3.3 Technology, Pricing and Policy Sensitivities
- 11.4 Market Attractiveness and Growth Outlook
Chapter 12 Argentina Smart Grid and Energy Internet of Things Market Segmentation and Outlook
- 12.1 Segmentation Summary and Market Shares, 2025
- 12.2 Largest and Fastest-Growing Segments
- 12.3 By Solution Type - Market Size and Forecast, 2025-2035
- 12.3.1 Segment Definition and Scope
- 12.3.2 Historical Market Size, 2018-2025
- 12.3.3 Revenue Forecast, 2025-2035
- 12.3.4 Volume Forecast, 2025-2035
- 12.3.5 Base-Year Market Share, 2025
- 12.3.6 Segment CAGR and Growth Drivers
- 12.3.7 Subsegment Market Size and Forecast
- 12.3.7.1 Smart metering
- 12.3.7.2 Grid automation
- 12.3.7.3 Energy management platforms
- 12.3.8 Subsegment Pricing and Adoption Trends
- 12.3.9 Leading Suppliers and Competition
- 12.3.10 Regional Demand and Opportunities
- 12.4 By Customer Type - Market Size and Forecast, 2025-2035
- 12.4.1 Segment Definition and Scope
- 12.4.2 Historical Market Size, 2018-2025
- 12.4.3 Revenue Forecast, 2025-2035
- 12.4.4 Volume Forecast, 2025-2035
- 12.4.5 Base-Year Market Share, 2025
- 12.4.6 Segment CAGR and Growth Drivers
- 12.4.7 Subsegment Market Size and Forecast
- 12.4.7.1 Distribution utilities
- 12.4.7.2 Transmission and system operators
- 12.4.7.3 Energy producers
- 12.4.7.4 Commercial and industrial facility owners
- 12.4.8 Subsegment Pricing and Adoption Trends
- 12.4.9 Leading Suppliers and Competition
- 12.4.10 Regional Demand and Opportunities
- 12.5 By Application - Market Size and Forecast, 2025-2035
- 12.5.1 Segment Definition and Scope
- 12.5.2 Historical Market Size, 2018-2025
- 12.5.3 Revenue Forecast, 2025-2035
- 12.5.4 Volume Forecast, 2025-2035
- 12.5.5 Base-Year Market Share, 2025
- 12.5.6 Segment CAGR and Growth Drivers
- 12.5.7 Subsegment Market Size and Forecast
- 12.5.7.1 Revenue protection
- 12.5.7.2 Reliability management
- 12.5.7.3 Energy optimization
- 12.5.8 Subsegment Pricing and Adoption Trends
- 12.5.9 Leading Suppliers and Competition
- 12.5.10 Regional Demand and Opportunities
- 12.6 By Deployment Model - Market Size and Forecast, 2025-2035
- 12.6.1 Segment Definition and Scope
- 12.6.2 Historical Market Size, 2018-2025
- 12.6.3 Revenue Forecast, 2025-2035
- 12.6.4 Volume Forecast, 2025-2035
- 12.6.5 Base-Year Market Share, 2025
- 12.6.6 Segment CAGR and Growth Drivers
- 12.6.7 Subsegment Market Size and Forecast
- 12.6.7.1 On-premises
- 12.6.7.2 Cloud
- 12.6.7.3 Hybrid
- 12.6.8 Subsegment Pricing and Adoption Trends
- 12.6.9 Leading Suppliers and Competition
- 12.6.10 Regional Demand and Opportunities
- 12.7 Segment Growth Comparison
- 12.8 Segment Attractiveness and Priority Matrix
Chapter 13 Argentina Smart Grid and Energy Internet of Things End-Use and Application Market Outlook
- 13.1 End-Use Industry and Customer Demand Structure
- 13.2 Leading Applications and Customer Groups
- 13.3 End-Use Market Size, Share and Forecast
- 13.4 Major End-Use Industry Deep Dives
- 13.4.1 Customer Requirements and Use Cases
- 13.4.2 Demand and Replacement Cycles
- 13.4.3 Technical and Regulatory Considerations
- 13.4.4 Purchasing and Procurement Models
- 13.4.5 Leading Vendors and Distribution Channels
- 13.4.6 Forecast and Commercial Opportunities
- 13.5 Emerging Applications and Cross-Segment Demand
- 13.6 End-Use Industry Investment Priorities
Chapter 14 Argentina Smart Grid and Energy Internet of Things Geographic Market Outlook, 2025-2035
- 14.1 Domestic Market Distribution and Demand Clusters
- 14.2 State- or Province-Wise Market Size and Forecast, 2025-2035
- 14.3 City and Metropolitan Market Outlook
- 14.4 Industrial, Manufacturing and Commercial Clusters
- 14.5 Geographic Concentration of Key End Users
- 14.6 Local Pricing and Purchasing Differences
- 14.7 Domestic Production Facilities and Capacity Map
- 14.8 Local Infrastructure and Project Pipeline
- 14.9 State-Level Policy and Incentive Differences
- 14.10 Subnational Investment Hotspots and Opportunities
- 14.11 Distribution and Logistics Networks
- 14.12 Domestic Competitive Footprint
Chapter 15 Argentina Smart Grid and Energy Internet of Things Technology, Innovation and Sustainability Outlook
- 15.1 Technology Landscape and Maturity
- 15.2 Product, Process and Service Innovation
- 15.3 AI, Automation and Digital Tools in the Industry
- 15.4 Technology Adoption and Performance Benchmarking
- 15.5 Innovation Pipeline and R&D Investment
- 15.6 Patent and Intellectual Property Trends
- 15.7 Energy Efficiency and Resource Management
- 15.8 Sustainability, Recycling and Circularity
- 15.9 Technology Roadmap, 2025-2035
- 15.10 Risks of Obsolescence and Technology Substitution
Chapter 16 Argentina Smart Grid and Energy Internet of Things Market Key Strategic Imperatives
- 16.1 Growth and Market Entry Priorities
- 16.2 High-Return Products and Segments
- 16.3 Pricing, Profitability and Cost Optimization
- 16.4 Technology Investment and Product Differentiation
- 16.5 Supply Chain Localization and Resilience
- 16.6 Distribution and Customer Acquisition
- 16.7 Partnership, Acquisition and Capacity Strategy
- 16.8 Regional Expansion Priorities
- 16.9 Short-, Medium- and Long-Term Actions
Chapter 17 Competition Outlook
- 17.1 Industry Competition Characteristics
- 17.2 Market Structure and Concentration
- 17.3 Market Share and Competitive Positioning, 2025
- 17.4 Company-Wise Revenue and Product Benchmarking
- 17.5 Production and Service Capacity Benchmarking
- 17.6 Technology, Pricing and Differentiation
- 17.7 Regional Footprint and Distribution Strength
- 17.8 Mergers, Acquisitions and Strategic Alliances
- 17.9 New Entrants and Competitive Threats
- 17.10 Porter's Five Forces and Industry Attractiveness
- 17.11 Competitive Outlook, 2025-2035
Chapter 18 Company Profiles
- 18.1 Company Coverage and Selection Criteria
- 18.2 Schneider Electric
- 18.2.1 Business Description
- 18.2.2 Company Ownership and Geographic Presence
- 18.2.3 Product and Service Portfolio
- 18.2.4 Manufacturing and Operating Footprint
- 18.2.5 Production Capacity and Expansion Plans
- 18.2.6 Financial Performance and Investment
- 18.2.7 Market Share and Competitive Position
- 18.2.8 Technology and Innovation Capabilities
- 18.2.9 Strategic Alliances or Partnerships
- 18.2.10 Recent Developments
- 18.2.11 Growth Strategy and Outlook
- 18.3 ABB
- 18.4 Siemens
- 18.5 Hitachi Energy
- 18.6 GE Vernova
- 18.7 Itron
- 18.8 Telecom Argentina
- 18.9 DISCAR
- 18.10 Circutor
- 18.11 Powermeter
- 18.12 Other Relevant Market Participants
Note: Every listed company is profiled on the structure shown under the first company. The company list is preliminary and may change based on research findings, market developments, data availability and client requirements.
Chapter 19 Disclaimer
- 19.1 Research and Forecast Disclaimer
- 19.2 Data Source and Estimation Limitations
Note: The depth of individual sections depends on data availability for this market. Volume, capacity, trade and other unit-based metrics are included where applicable.

