
Headstart support and refueling hubs widen storage needs
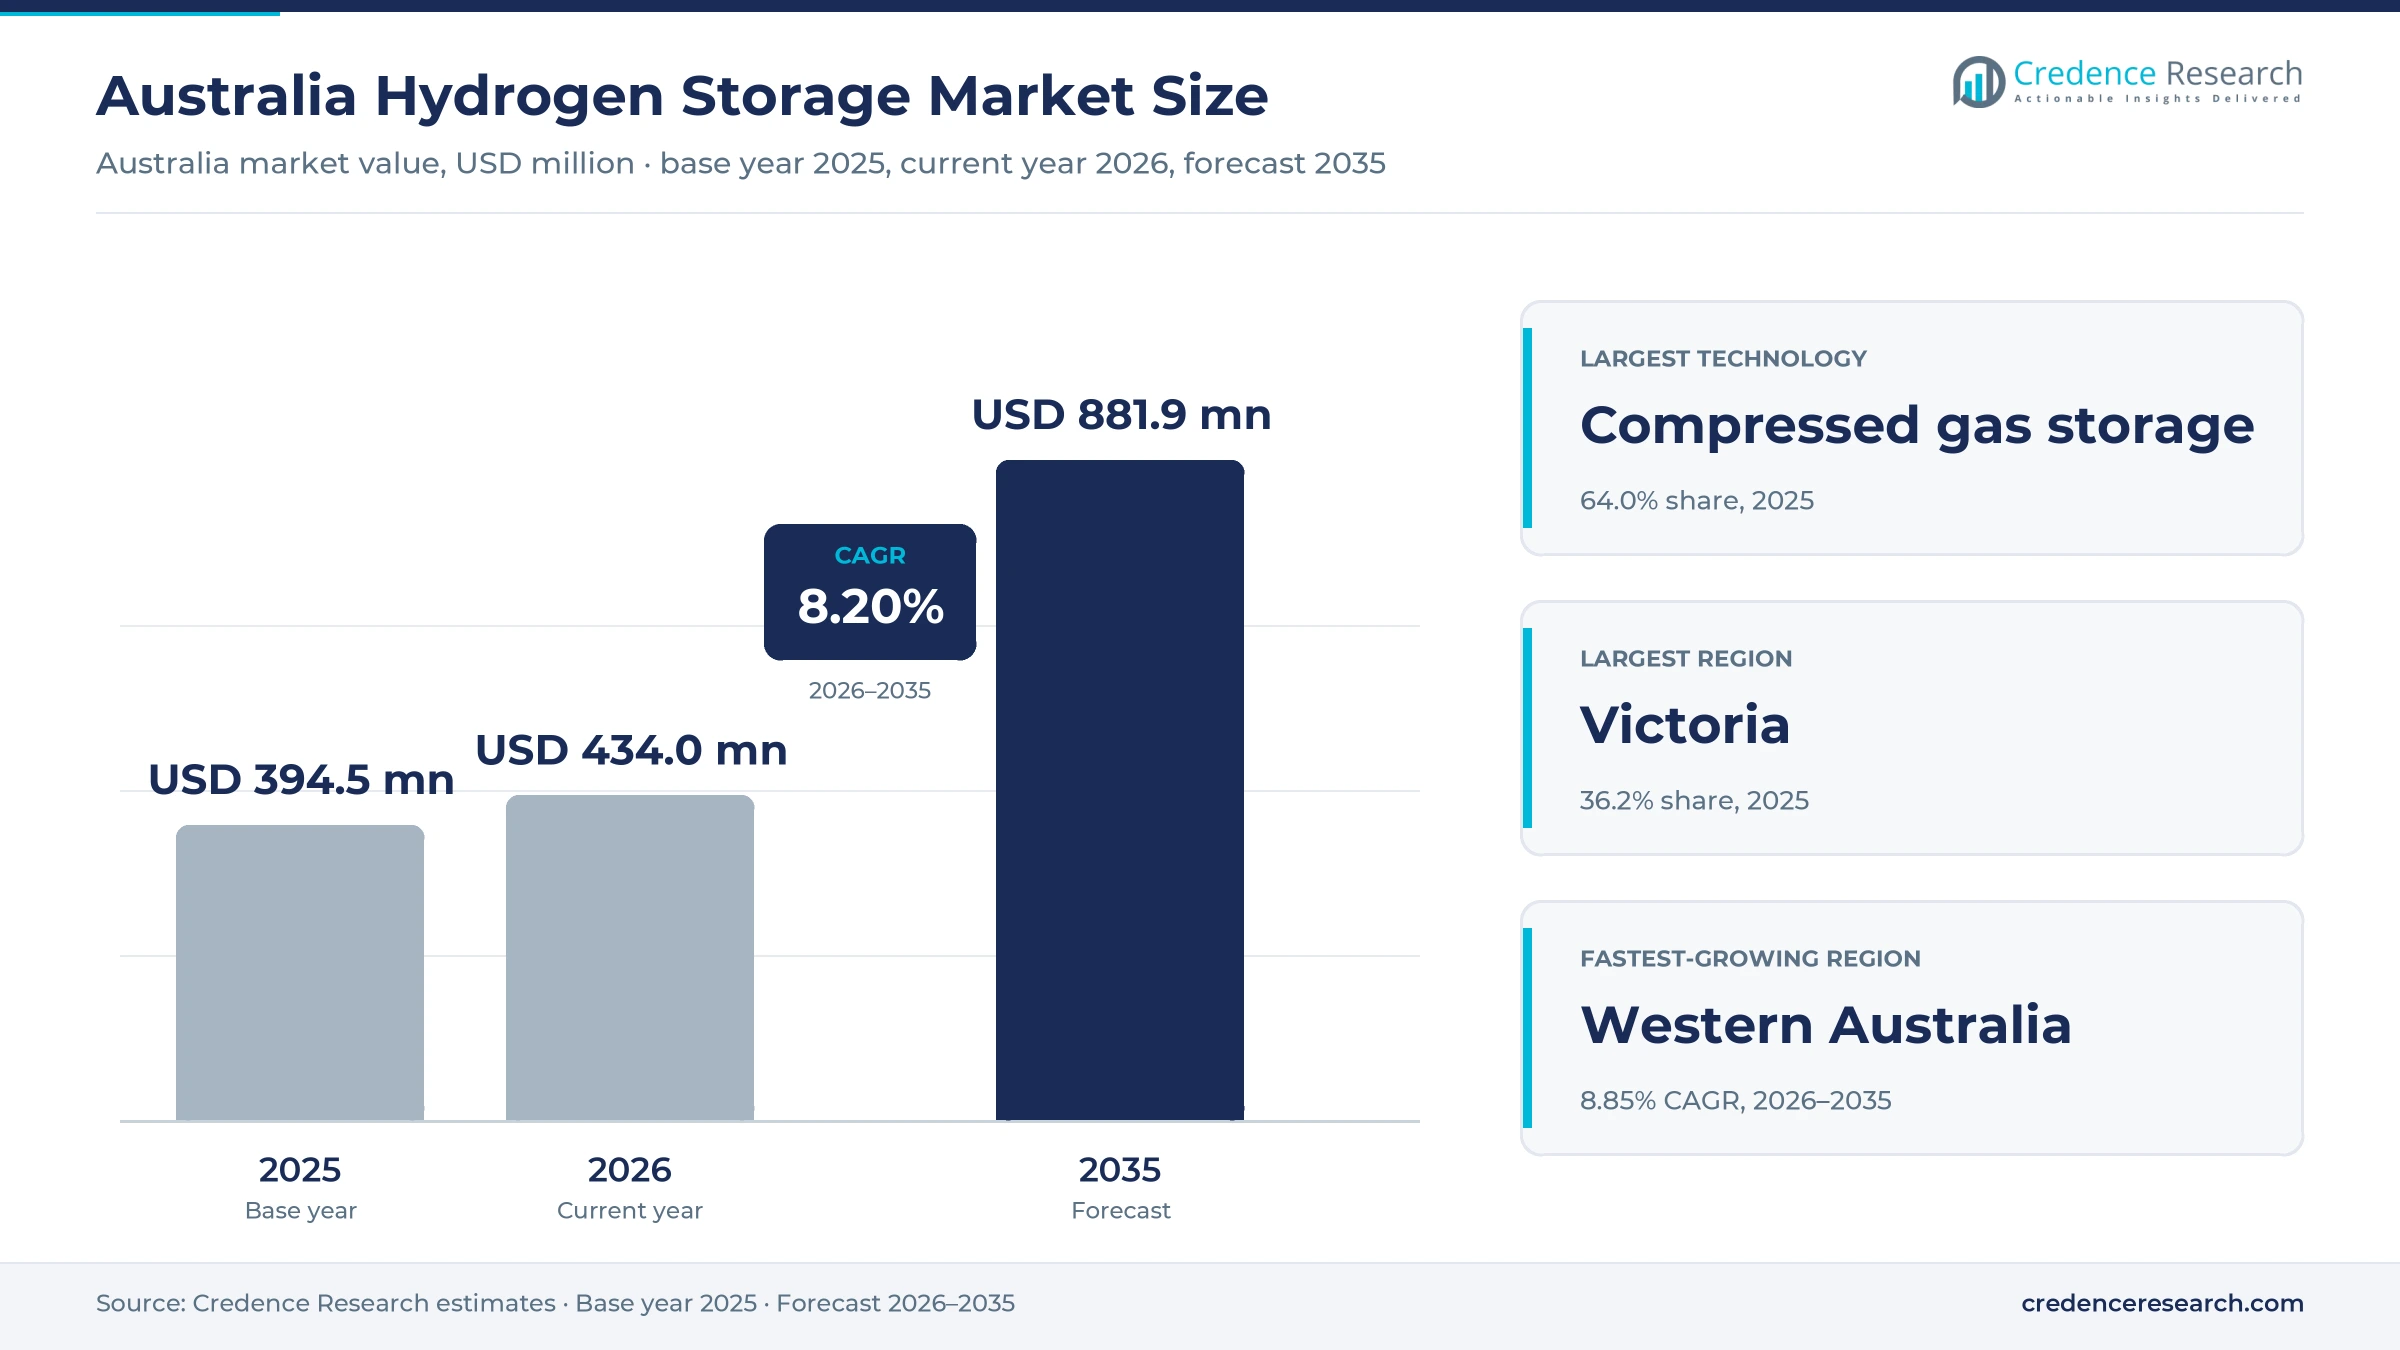
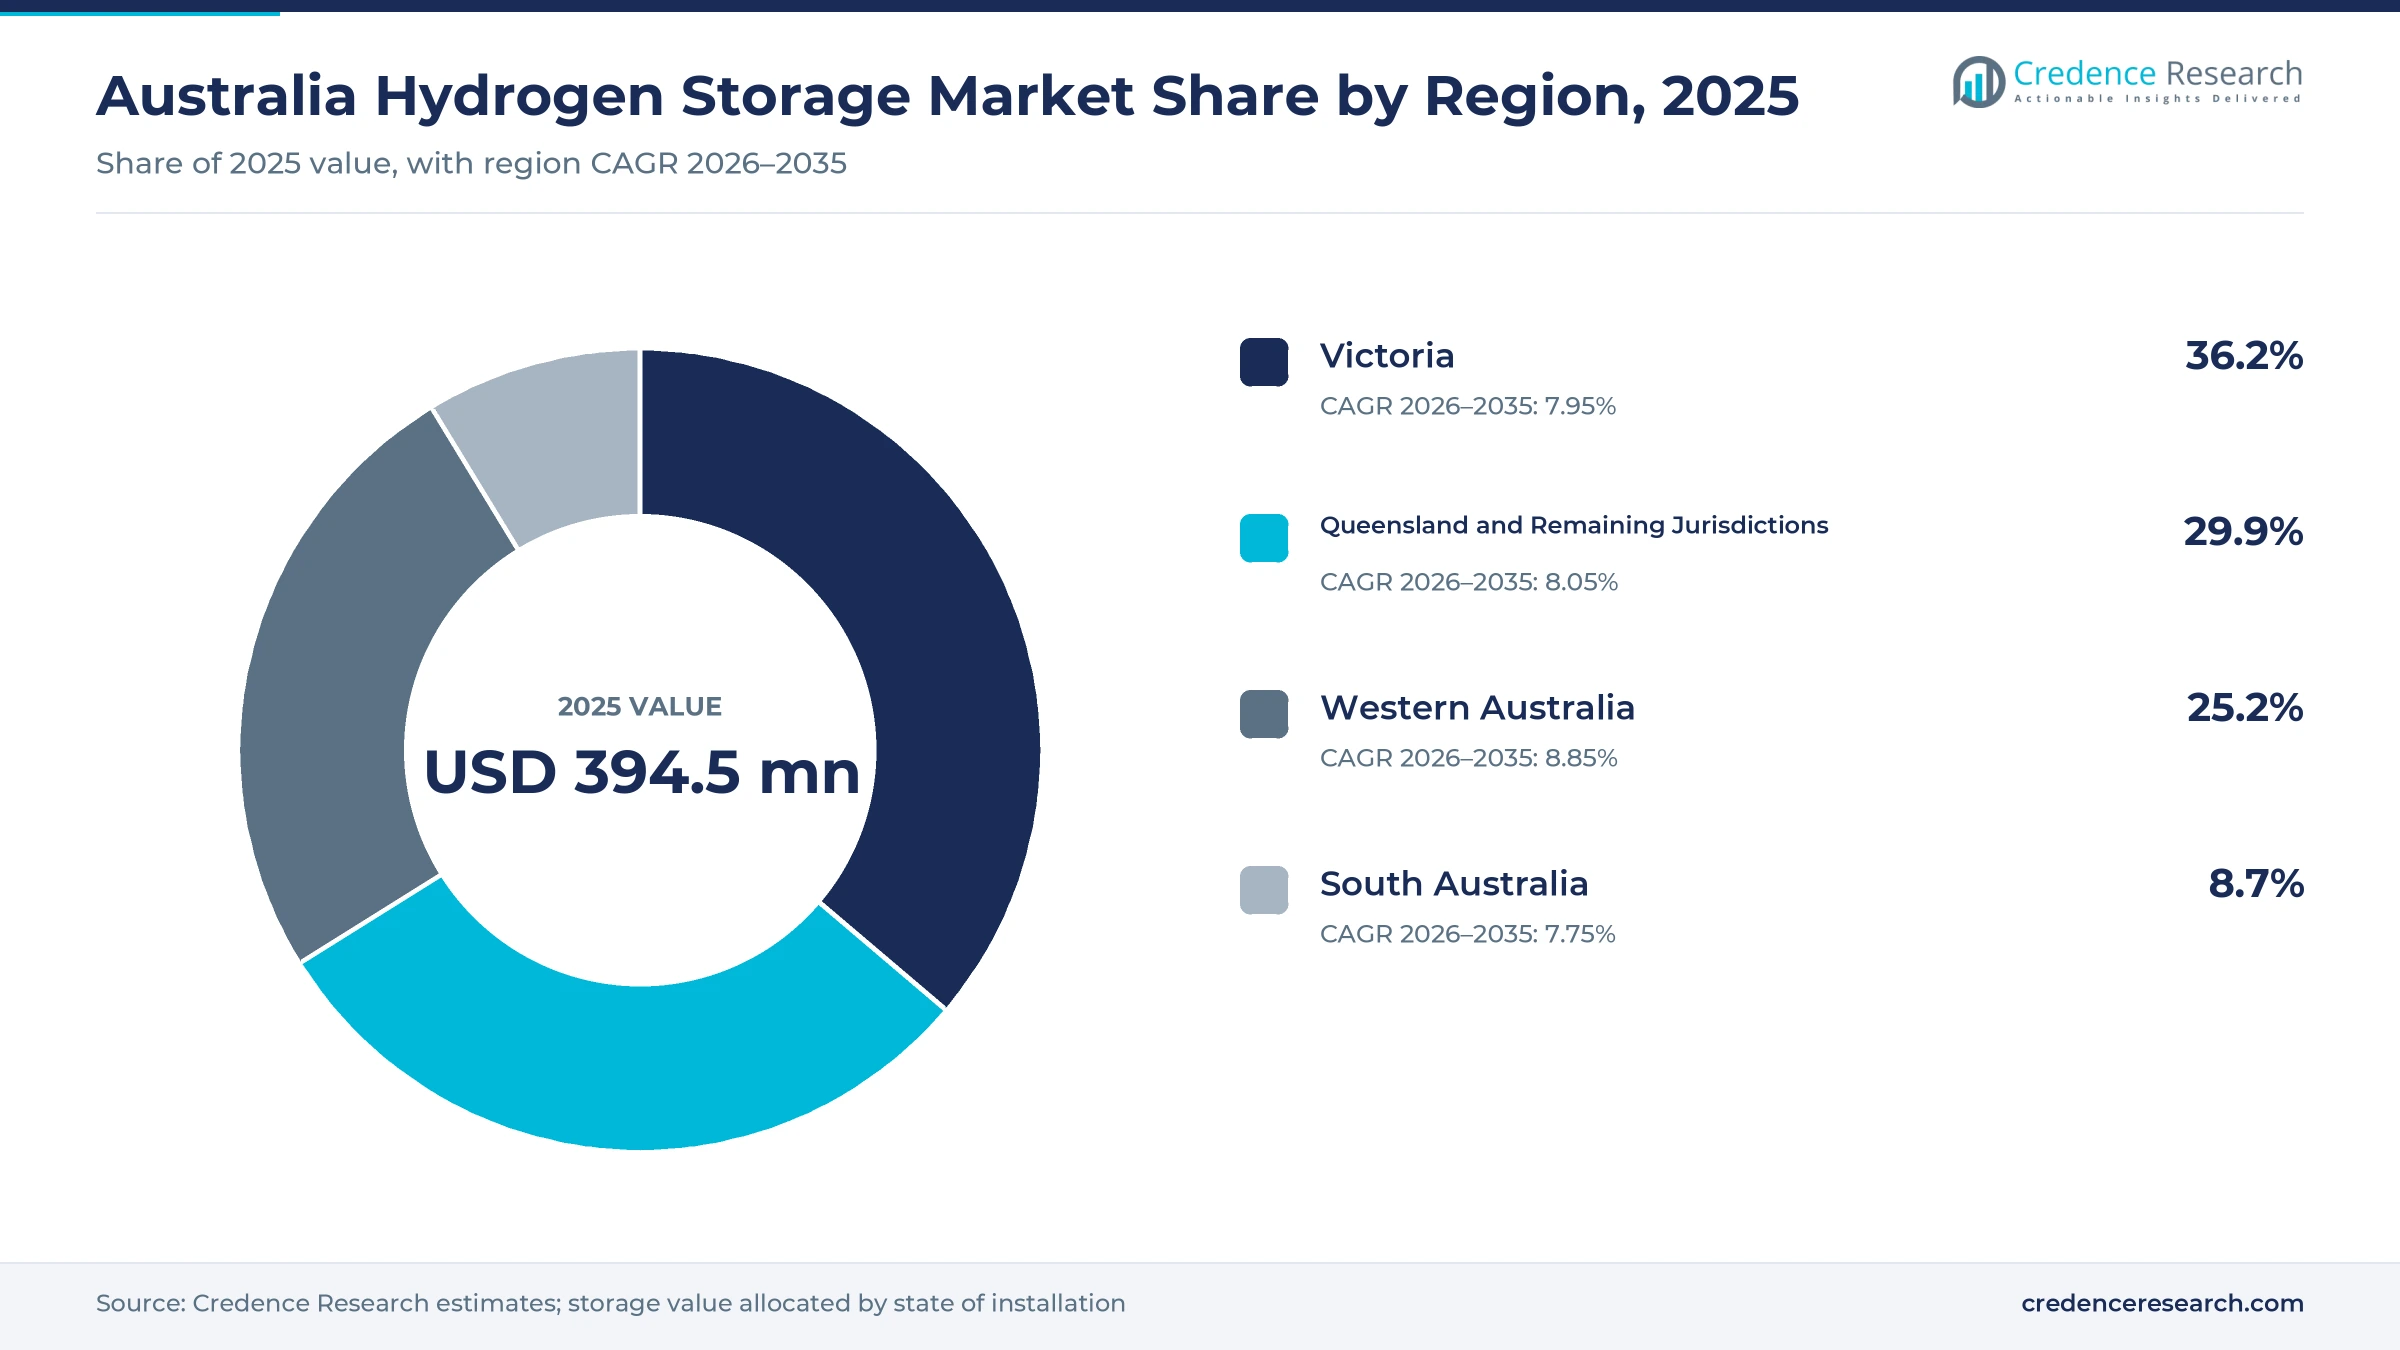
The Australia hydrogen storage market was valued at USD 394.5 million in 2025 and is projected to increase from USD 434.0 million in 2026 to USD 881.9 million by 2035, registering a CAGR of 8.20% during 2026–2035. Demand comes from ammonia and chemicals plants, refueling station operators, gas network trials, export developers and research groups that buy pressure vessels, tube trailers, cryogenic tanks, hydride units and reservoir studies. Victoria held the largest regional share, 36.2% in 2025, because the state hosts liquefaction work at Hastings, refueling stations in Melbourne and Geelong, and underground storage studies in the Otway Basin. Western Australia is the fastest-growing region at 8.85% a year, as large renewable ammonia projects in the Mid West move toward investment decisions. Federal policy is also changing project economics, because a production tax incentive of $2 per kilogram of renewable hydrogen applies from July 2027, which supports buffer storage at new plants.
What counts as hydrogen storage spending in Australia?
The estimate measures the value of hydrogen storage equipment and services installed or contracted in Australia, including compressed gas vessels, tube trailers, liquid hydrogen tanks, metal hydride systems and underground storage development work. Values are stated at the prices that producers, refueling operators, gas networks, export developers and research groups pay for these assets and services.
The estimate excludes electrolyzers, fuel cells, pipelines built only for transport and the value of the stored hydrogen itself. The value chain runs from vessel, cryogenic and hydride suppliers through engineering contractors and industrial gas companies to chemicals plants, refueling sites, network operators and export terminals.
Australia Hydrogen Storage Market Insights
- The Australia hydrogen storage market was valued at USD 394.5 million in 2025 and is projected to reach USD 881.9 million by 2035, registering a CAGR of 8.20% during 2026–2035.
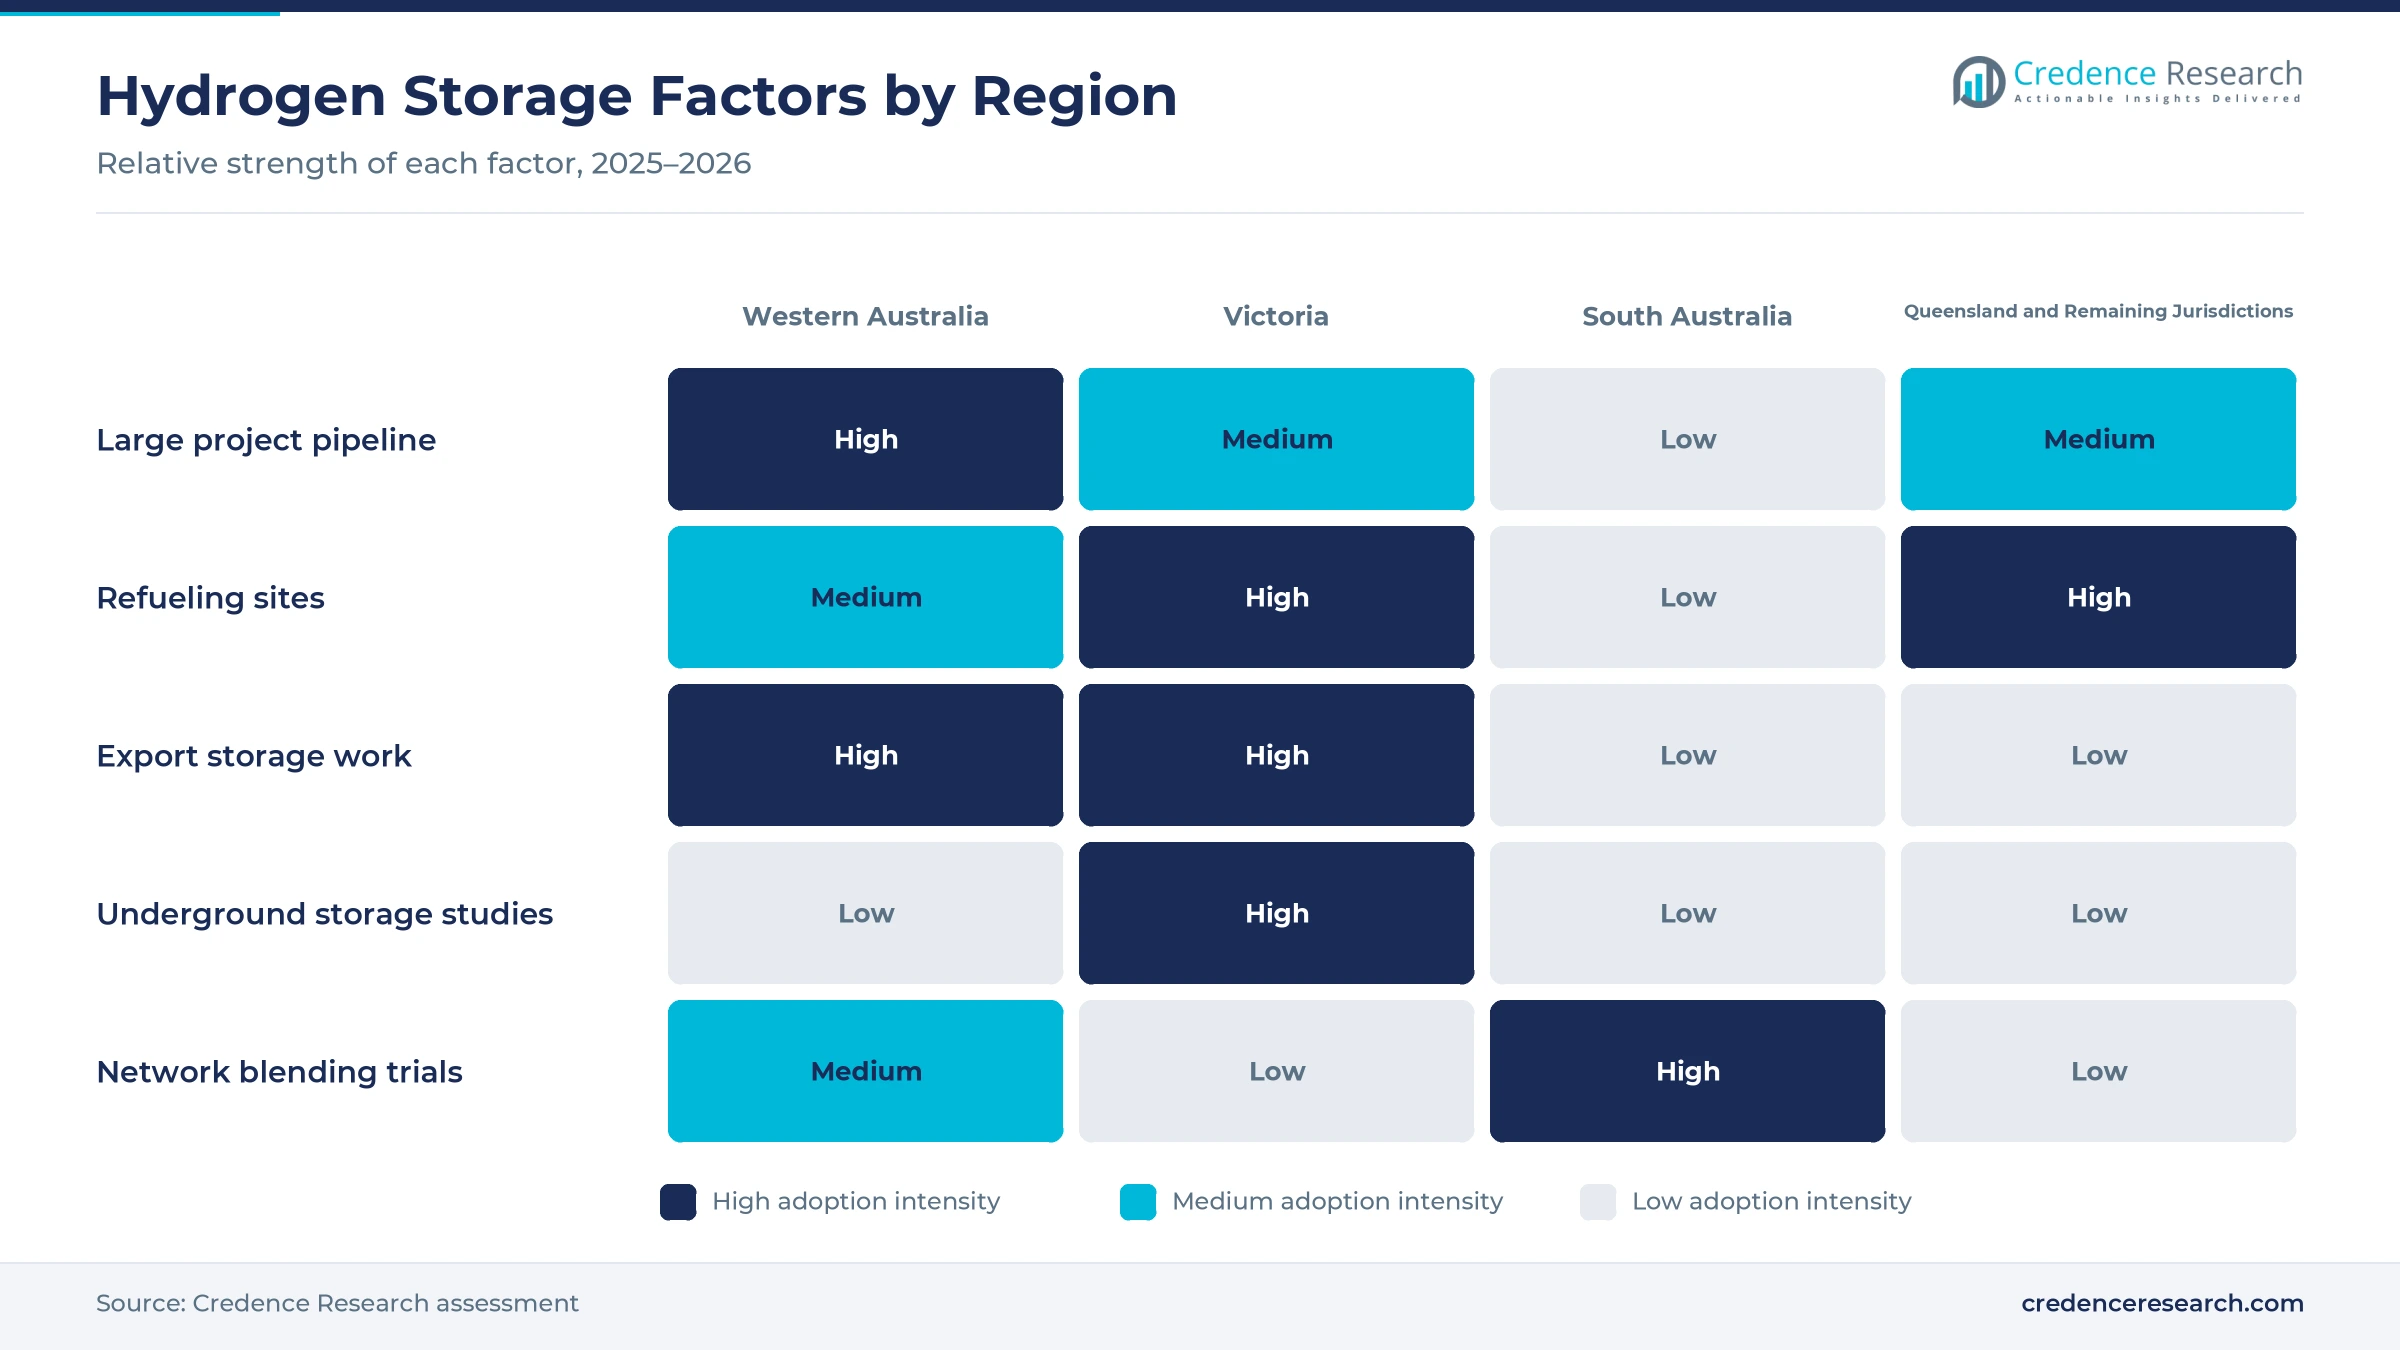
- Victoria held a 36.2% share of 2025 value, because Hastings liquefaction work, Geelong refueling and Otway Basin storage studies are based in the state.
- Compressed gas storage led with a 64.0% share of 2025 value, because refueling stations, tube trailers and blending trials all rely on pressure vessels.
- Viva Energy launched a Geelong station in June 2025 with a 2.5 MW electrolyzer that can make up to 1,000 kg of hydrogen a day.
- Round 1 of Hydrogen Headstart committed $814 million to Murchison Green Hydrogen and $432 million to the Hunter Valley Hydrogen Hub in July 2025.
Compressed gas leads as underground storage grows fastest
Why does compressed gas storage lead technology value?
Based on technology, the market is categorized into compressed gas storage, liquid hydrogen storage, material-based storage and underground storage development. Compressed Gas Storage led with a 64.0% share of 2025 value, because nearly every refueling site and production trial uses pressure vessels. Underground Storage Development grows fastest at 9.75% a year, as sandstone reservoir studies in Victoria move toward pilot design.
How do refining and chemicals buyers dominate demand?
Based on end-use sector, the market is categorized into refining and chemicals, hydrogen export, power and distributed energy, and transport refuelling. Refining and Chemicals led with 46.0% of 2025 value, because ammonia and refinery sites already store large volumes on site. Hydrogen Export grows fastest at 9.00% a year, as export-linked ammonia and liquefaction projects advance.
Why do stationary assets hold most of the value?
Based on asset type, the market is categorized into stationary storage assets, mobile storage assets, export terminal storage assets and geological storage development. Stationary Storage Assets led with 55.0% of 2025 value, because buffer vessels sit at every production and refueling site. Geological Storage Development grows fastest at 9.74% a year, as developers test depleted gas reservoirs for seasonal storage.
How do equipment purchases and service contracts split value?
Based on contracting model, the market is categorized into equipment purchase, turnkey storage contracts and storage service contracts. Equipment Purchase led with 48.0% of 2025 value, because most project owners buy vessels, trailers and tanks outright and run them with their own staff. Storage Service Contracts grow fastest at 9.05% a year, as industrial gas suppliers offer storage, refilling and delivery under multi-year terms that spread the cost of new assets.
| Segment Group | Leading Sub-segment | Share, 2025 | Fastest-growing Sub-segment | CAGR, 2026–2035 |
|---|---|---|---|---|
| By Technology | Compressed Gas Storage | 64.0% | Underground Storage Development | 9.75% |
| By End-Use Sector | Refining and Chemicals | 46.0% | Hydrogen Export | 9.00% |
| By Asset Type | Stationary Storage Assets | 55.0% | Geological Storage Development | 9.74% |
| By Contracting Model | Equipment Purchase | 48.0% | Storage Service Contracts | 9.05% |
Request a Free Sample
Fill in your details and we'll send you a free sample report.
- Sample data tables & charts
- Research methodology
Production credits and demonstrations lift storage spending
How does production support improve investment economics?
Production support improves investment economics, because subsidies narrow the gap between renewable hydrogen costs and sale prices. Hydrogen Headstart provides up to $2.25 billion of support, and Round 1 concluded in July 2025 with commitments to two projects, according to the International Energy Agency. Murchison Green Hydrogen received $814 million, and the Hunter Valley Hydrogen Hub received $432 million. A production tax incentive also pays $2 per kilogram of renewable hydrogen for up to ten years between July 2027 and June 2040, as stated by the Australian Taxation Office. Because supported plants still need buffer vessels between electrolyzers and users, refining and chemicals buyers held 46.0% of 2025 value.
Why do operating demonstrations repeat storage needs?
Operating demonstrations create repeatable storage requirements, because each pilot site needs vessels, compression and dispensing that later projects can copy. ATCO's Jandakot hub in Perth uses a 260 kW electrolyzer that makes up to 65 kg of hydrogen a day, with a 30-bar vessel that holds gas outside the solar window. Coregas compresses hydrogen to 500 bar at its Port Kembla station, which can deliver 400 kg a day to truck fleets. BOC's Bulwer Island project, which used a 220 kW electrolyzer and tube trailers, was completed on Nov. 17, 2025. As a result, compressed gas storage held 64.0% of 2025 value, as these sites set designs for industrial gas suppliers.
How does export-chain development widen technical needs?
Export-chain development widens technical requirements, because shipping hydrogen or ammonia needs cryogenic tanks, terminal storage and new safety standards. Japan Suiso Energy, formed by Kawasaki Heavy Industries, Iwatani and INPEX, was allocated 210 billion yen from Japan's Green Innovation Fund in March 2023 for the Hastings commercial demonstration. Victoria's planning minister approved the next part of the Hastings production and liquefaction facility in July 2025. The Murchison project plans up to 1.5 GW of electrolysis and 3,600 metric tons of ammonia a day for export. In turn, hydrogen export grows fastest among end uses at 9.00% a year, which lifts orders for cryogenic tanks and terminal assets.
Why do heavy vehicle refueling hubs add pressure capacity?
Heavy vehicle refueling hubs add pressure capacity, because trucks and buses need large volumes stored on site before each shift. Viva Energy launched its Geelong station in June 2025 with a 2.5 MW electrolyzer that can produce up to 1,000 kg a day, according to CSIRO HyResource. The project received $34 million from the federal renewable energy agency, and Air Liquide supplied the refueling station. Toyota's Altona site also keeps hydrogen in medium and high-pressure tubes and can make up to 80 kg a day. As a result, transport refuelling buyers keep adding vessels and dispensers, while stationary storage assets held 55.0% of 2025 value.
Sandstone reservoirs and metal hydrides widen the options
How is the shift toward underground storage studies changing plans?
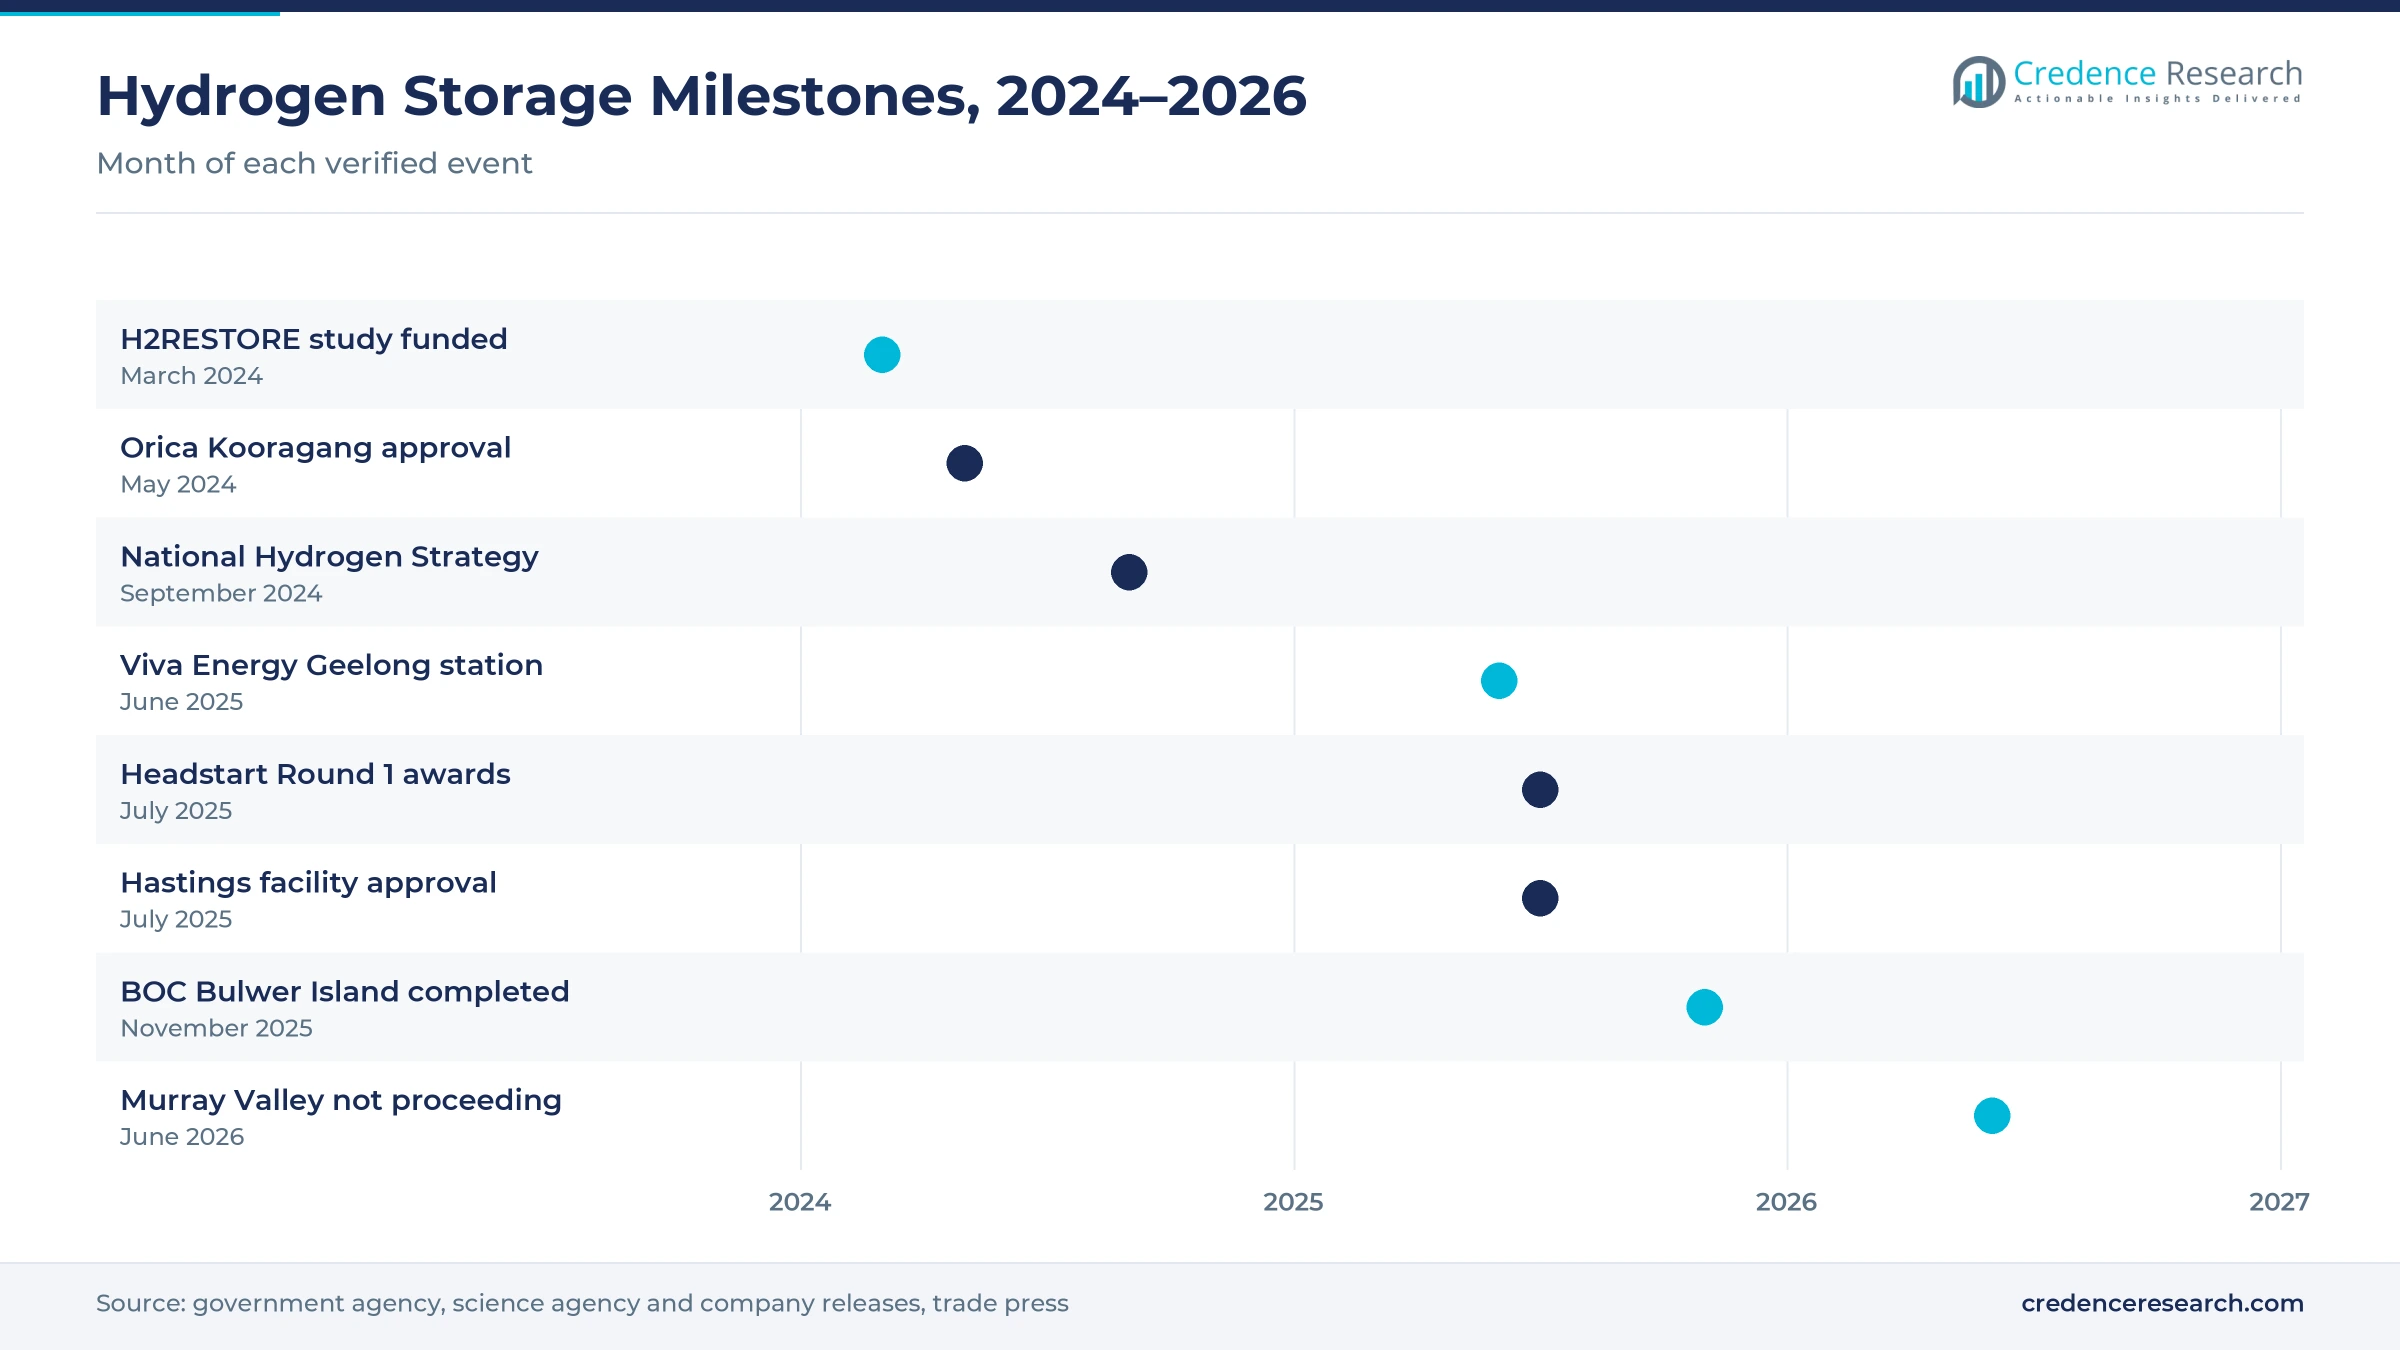
The shift toward underground storage studies is changing long-term plans, because depleted reservoirs could hold far more hydrogen than surface tanks. Lochard Energy started an 18-month, $6.3 million feasibility study in March 2024 with $2 million from the federal renewable energy agency, according to the agency release. The study tests storage in porous sandstone in the onshore Otway Basin and may repurpose reservoirs at the Iona facility near Port Campbell. The study is now complete, a small pilot may follow, and commercial operation is targeted for the early 2030s. As a result, underground storage development grows fastest among technologies at 9.75% a year, from a small base.
Why is the rise of metal hydride storage notable?
The rise of metal hydride storage is notable, because solid-state systems hold hydrogen at low pressure for long periods. LAVO, founded in Sydney in 2020 with UNSW, developed a storage system based on metal hydride technology, according to JETRO. The company opened a Tokyo subsidiary in January 2024 and has deployed systems for data centers and telecom towers abroad. Hydrexia, an earlier low-pressure storage developer, raised $9.25 million in a round co-led by Air Liquide to reach industrial gas and storage markets sooner. In turn, material-based storage is gaining attention from remote sites, telecom operators and backup power users that want compact units without high-pressure vessels.
Can renewable ammonia hubs open larger storage contracts?
Renewable ammonia hubs can open larger storage contracts, because they need steady hydrogen supply between variable power and continuous synthesis. Orica plans a 50 MW electrolyzer at Kooragang Island that should make about 4,700 metric tons of hydrogen a year for about 26,600 metric tons of renewable ammonia. The site received development approval in May 2024 and is backed by $432 million of Headstart credits. Murchison also pairs electrolysis with a 600 MW, 1,200 MWh battery near Kalbarri, which smooths power supply to the electrolyzers. As a result, storage service contracts grow fastest among contracting models at 9.05% a year, as hubs seek long-term supply and storage terms.
Is there room to grow through a national production target?
A national production target leaves room to grow, because storage demand scales with every metric ton produced. The 2024 National Hydrogen Strategy, released in September 2024, targets at least 15 million metric tons a year of hydrogen by 2050, with a stretch of 30 million metric tons. It also reviews progress every five years through an annual State of Hydrogen report. Round 2 of Headstart holds up to $1 billion, with outcomes expected between late 2026 and early 2027, as announced in the 2026-27 federal budget. In turn, Western Australia holds 25.2% of 2025 value and gains ground, as large export and ammonia sites in the Mid West seek support.
Project exits, cost gaps and safety rules slow new storage
How do project exits reduce near-term storage orders?
Project exits reduce near-term storage orders, because cancelled plants never reach the stage of buying vessels and tanks. Stanwell left the Central Queensland Hydrogen Project in July 2025, after a first phase of up to 720 MW had been planned, and the state government announced it would not fund further development. Fortescue also shelved its PEM50 electrolyzer project in the same month. In turn, storage suppliers face uneven demand and idle manufacturing capacity. Storage firms respond by focusing on smaller refueling and industrial sites with firm buyers.
Why do cost gaps delay hydrogen network projects?
Cost gaps delay network projects, because renewable hydrogen still costs more than natural gas for most users. AGIG decided in June 2026 not to proceed with Hydrogen Park Murray Valley, a 10 MW plant planned at Wodonga. As a result, blending trials that would have used storage at the plant were lost, even after groundbreaking in October 2024. Network operators respond by waiting for production credits and clearer offtake before committing to new storage assets.
How do safety and approval rules slow new storage sites?
Safety and approval rules slow new storage sites, because high-pressure and cryogenic hydrogen needs separation distances, hazard studies and community consultation. Projects near towns and ports face added scrutiny and objections during planning, as seen at Hastings where the planning minister had to intervene. In turn, approvals can take far longer than developers first expect. Developers respond with early engagement, proven vessel designs and staged builds that keep stored volumes small at first.
Why do thin vehicle fleets limit refueling storage returns?
Thin vehicle fleets limit refueling storage returns, because stations need steady daily demand to pay back compressors and vessels. Fuel cell trucks and cars remain few on Australian roads compared with battery electric models. The Coregas station at Port Kembla can deliver 400 kg of hydrogen a day, yet its demand depends on a small truck fleet. As a result, many stations run below their design capacity in early years of operation. Operators respond by signing fleet customers such as government cars, buses and freight trucks before building more storage.
Victoria leads while Western Australia grows fastest
| Region | Value, 2025 (USD million) | Share, 2025 | CAGR, 2026–2035 |
|---|---|---|---|
| Victoria | 142.8 | 36.2% | 7.95% |
| Queensland and Remaining Jurisdictions | 118.0 | 29.9% | 8.05% |
| Western Australia | 99.4 | 25.2% | 8.85% |
| South Australia | 34.3 | 8.7% | 7.75% |
Why does Victoria hold the largest share?
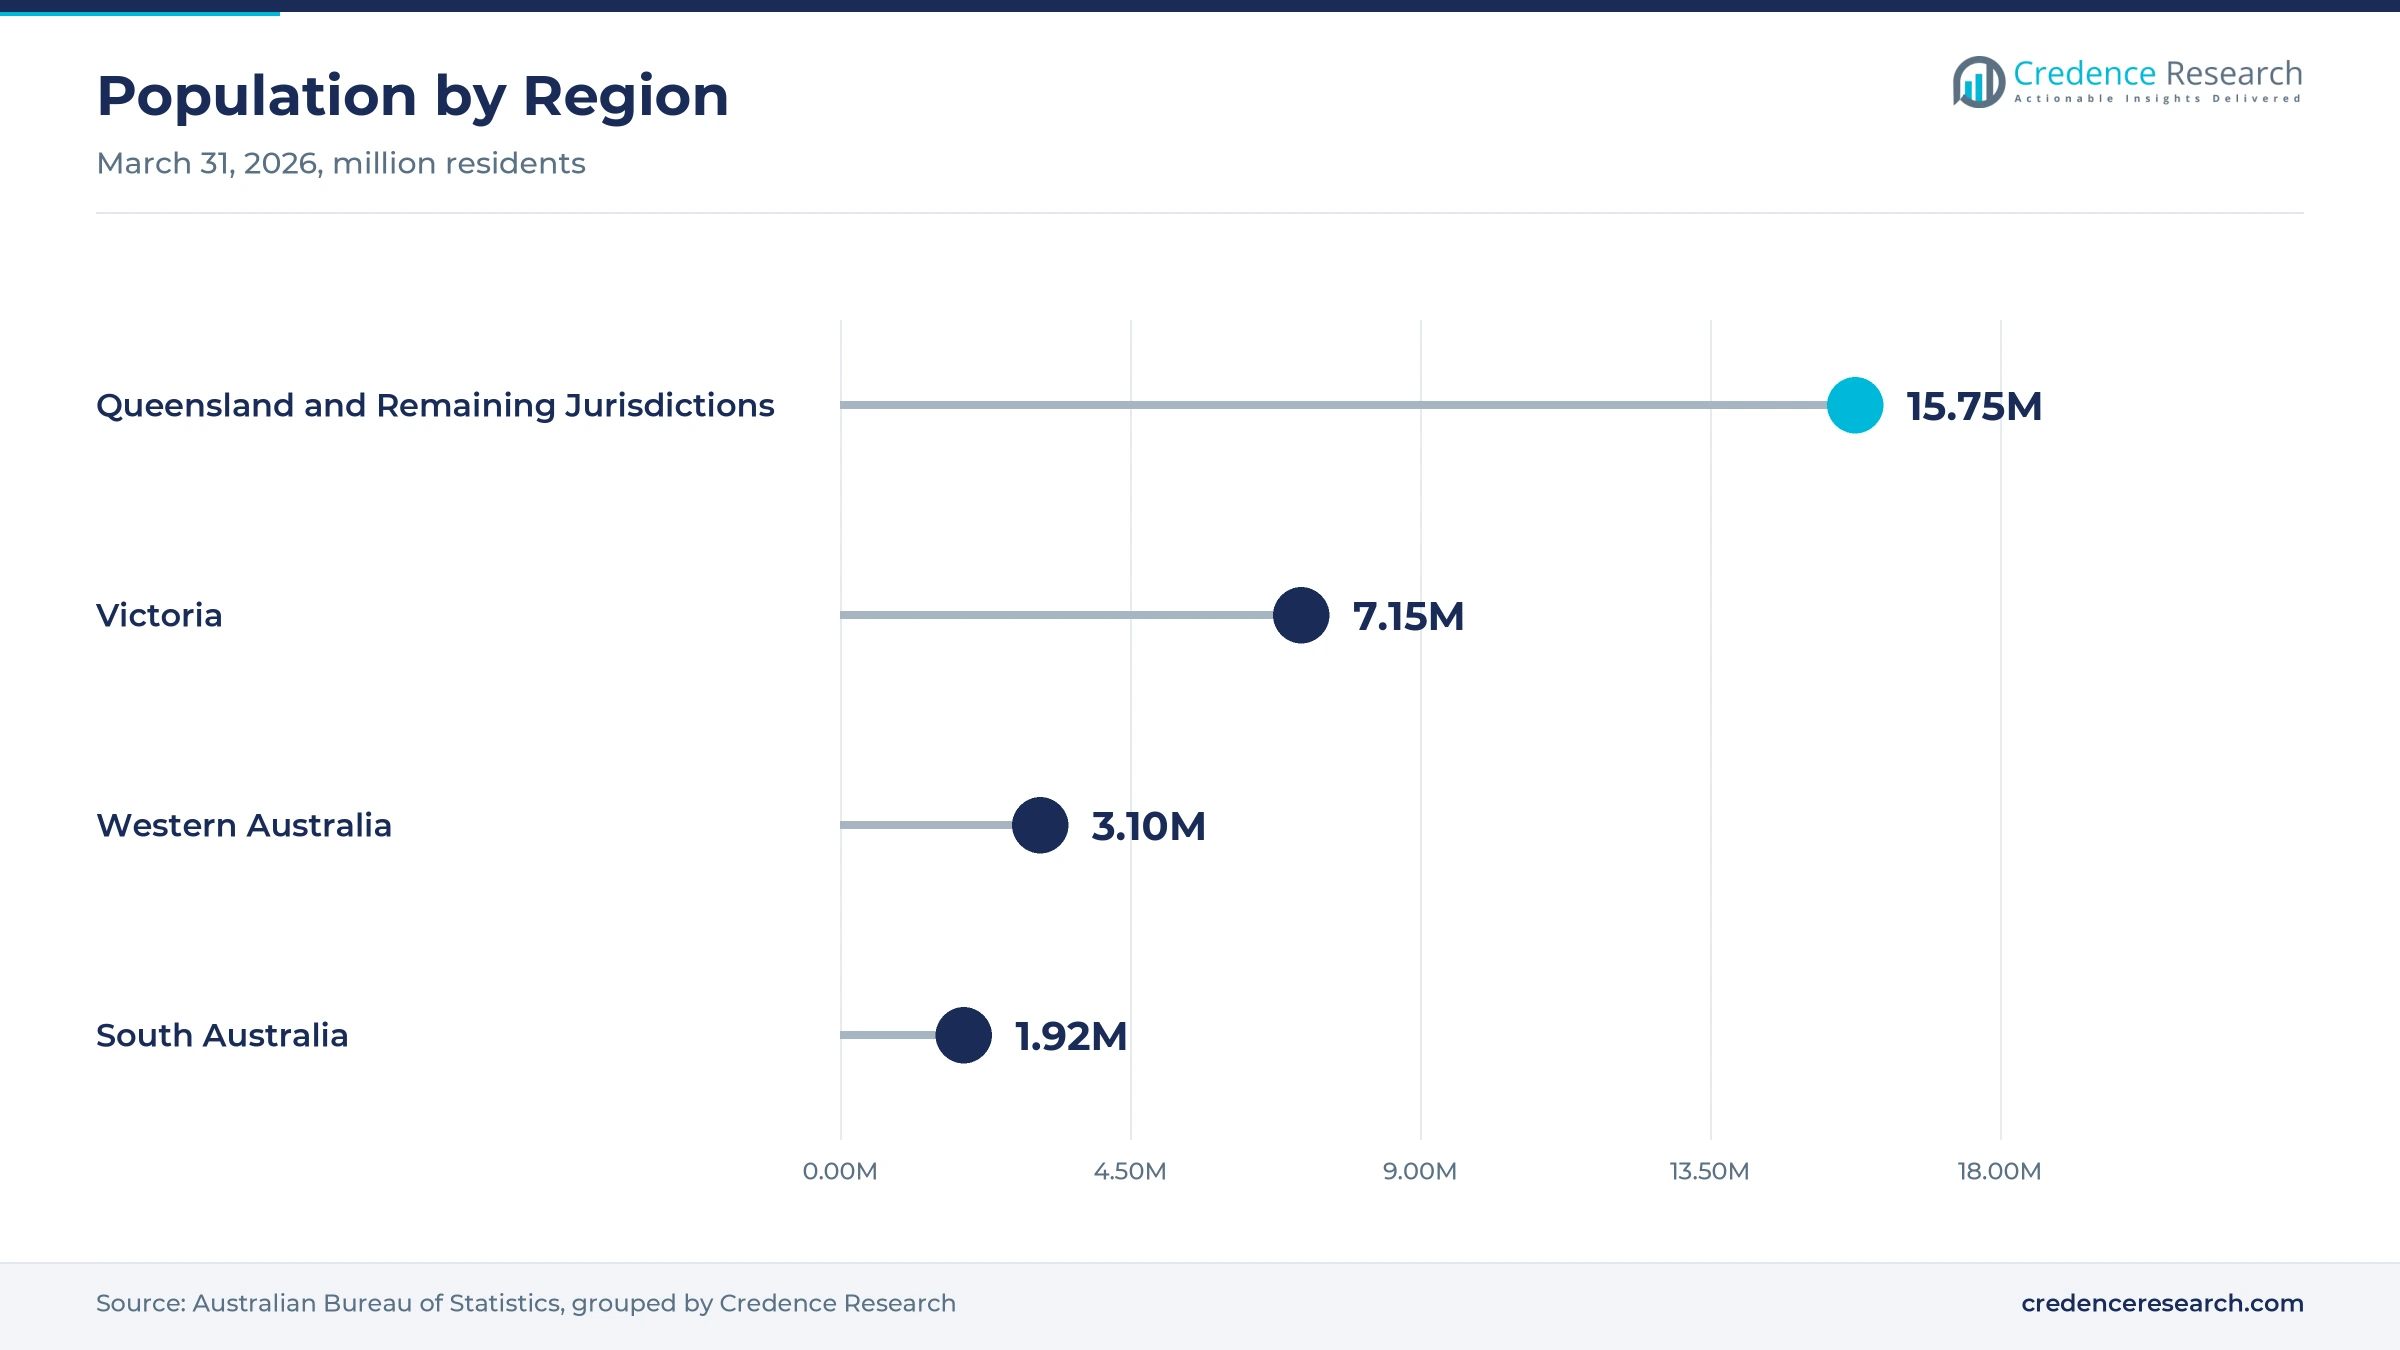
Victoria held 36.2% of 2025 value and grows at 7.95% a year, because the state hosts liquefaction work at Hastings, refueling stations at Geelong and Altona, and sandstone storage studies in the Otway Basin. Victoria had about 7.15 million residents at March 31, 2026, with growth of 1.6% over the year. As a result, liquid, compressed and underground storage spending all have a base in the state.
How do Queensland and the remaining jurisdictions add demand?
Queensland and Remaining Jurisdictions held 29.9% of 2025 value and grow at 8.05% a year, because the group includes BOC's Bulwer Island site, the Coregas station at Port Kembla and Orica's planned hub at Kooragang Island. However, the exit of Stanwell from the Central Queensland Hydrogen Project removed a large planned buyer near Gladstone. In turn, New South Wales ammonia work carries more of the growth.
How do Mid West ammonia hubs lift Western Australia?
Western Australia held 25.2% of 2025 value and grows fastest at 8.85% a year, because Murchison Green Hydrogen received $814 million of Headstart support for up to 1.5 GW of electrolysis near Kalbarri. ATCO's Jandakot hub in Perth already runs storage and refueling with Fortescue. The state also grew its population by 2.1% in the year to March 2026, the fastest rate in the country.
How does South Australia build on early blending trials?
South Australia held 8.7% of 2025 value and grows at 7.75% a year, because Hydrogen Park South Australia at Tonsley uses a 1.25 MW electrolyzer to blend 5% hydrogen into gas for more than 700 properties. As a result, the state has experience with network storage and blending. However, growth is slower because no large export project has secured federal production support yet. The state had about 1.92 million residents at March 31, 2026, which also limits regional demand for refueling storage.
Lochard, Viva Energy and Headstart marked 2024 to 2026
| Development | Status and market relevance |
|---|---|
| In March 2024, Lochard Energy began a $6.3 million underground storage feasibility study backed by a $2 million federal grant. | Tests storage in Otway Basin sandstone near the Iona facility |
| In September 2024, the government released the 2024 National Hydrogen Strategy with a 2050 target of 15 million metric tons a year. | Sets the long-term demand base for storage assets |
| In June 2025, Viva Energy launched its Geelong refueling station with a 2.5 MW electrolyzer. | Adds up to 1,000 kg a day of compressed hydrogen supply |
| In July 2025, Hydrogen Headstart Round 1 committed $814 million to Murchison and $432 million to the Hunter Valley hub. | Supports large ammonia hubs that need buffer storage |
| In November 2025, BOC completed its Bulwer Island renewable hydrogen production and refueling project. | Shows tube trailer supply to a Brisbane truck stop |
Tube trailers, cryogenic tanks and hydrides set the mix
- High-pressure vessels and tube trailers hold gas at 350 to 500 bar for refueling and road delivery, which suits stations and small industrial users.
- Cryogenic liquid tanks keep hydrogen at very low temperature in dense form, which suits export terminals and ships.
- Metal hydride systems absorb hydrogen into alloys at low pressure, which suits homes, remote sites and backup power.
- Porous rock reservoirs store large volumes in depleted gas fields, which could shift renewable energy between seasons.
Need a Custom Version of This Report?
Tailor the scope, geography, or segments to your exact requirements.
- Custom geography or segment scope
- Direct access to our analyst team
Gas majors lead as storage specialists seek scale
Competition centers on storage engineering, supply contracts, safety records and access to public funding. BOC Limited supplies hydrogen by tube trailer from Bulwer Island, while Coregas runs a 500 bar station at Port Kembla. Air Liquide Australia supplied the refueling station at Viva Energy's Geelong hub. ATCO Australia operates storage and refueling at Jandakot with Fortescue Energy. Kawasaki Heavy Industries and Japan Suiso Energy lead liquefaction and shipping work at Hastings. LAVO and Hydrexia focus on low-pressure solid storage, and Lochard Energy studies sandstone reservoirs. Because compressed gas storage holds the largest share of 2025 value, industrial gas suppliers hold the strongest position, while specialists compete for new storage formats.
Companies profiled and their roles in this market
| Company | Type | Role in the market |
|---|---|---|
| BOC Limited | Industrial gas supplier | Produces hydrogen at Bulwer Island and delivers by tube trailer |
| Air Liquide Australia | Industrial gas supplier | Supplied the refueling station at Viva Energy Geelong |
| Coregas | Industrial gas supplier | Runs a 500 bar refueling station at Port Kembla |
| Fortescue Energy | Energy developer | Partners with ATCO on refueling at Jandakot |
| ATCO Australia | Gas network operator | Runs the Clean Energy Innovation Hub in Perth |
| Kawasaki Heavy Industries | Technology supplier | Shareholder in Japan Suiso Energy for Hastings |
| Japan Suiso Energy | Export chain developer | Leads liquefaction and shipping from Hastings |
| Hydrexia | Storage developer | Develops low-pressure hydrogen storage |
| LAVO | Storage developer | Develops metal hydride storage systems |
| Lochard Energy | Gas storage operator | Studies sandstone hydrogen storage near Iona |
Buffer storage at supported hubs sets the growth path
Credence Research's view is that Australian hydrogen storage spending will grow steadily because production credits, Headstart awards and refueling hubs all need vessels, trailers and tanks. Compressed gas keeps the largest share, while underground and material-based storage grow faster from small bases. Western Australia should grow fastest among regions through 2035 as large ammonia projects advance. However, project exits and cost gaps will keep demand uneven. Suppliers with proven safety records and flexible contracts should gain the most share.
Agency releases and project data anchor the model
The report uses 2025 as the base year on a calendar basis, and market values come from the Credence Research model. That model combines federal funding awards, tax incentive rules, project capacities, electrolyzer sizes, refueling station data and population data. Segment splits and regional growth rates are Credence Research estimates, while regional shares follow the client-defined split. Sources used are government agency releases, international agency policy data, science agency project records, trade press and company releases, and no interviews or surveys were used.
Headstart hubs and export links carry growth to 2035
Spending on hydrogen storage assets and services is expected to reach USD 881.9 million by 2035, an 8.20% CAGR during 2026–2035, as supported hubs move into construction and operation. Growth should build after July 2027, when production credits begin and plants need buffer storage. After that, export terminals and reservoir storage could set the pace if pilots succeed. Faster Headstart awards would shift value toward large turnkey contracts, while more project exits would keep spending focused on refueling and small industrial sites.
Frequently Asked Questions
How big is the Australia hydrogen storage market?
Which storage technology leads in Australia?
Which region leads the Australian market?
How does federal policy support hydrogen storage demand?
What is the H2RESTORE study?
Which end use grows fastest?
Who are the leading companies in Australia?
What are the main challenges for the market?
Table of Content
Chapter 1 Market Segmentation
- 1.1 Segmentation Framework
- 1.1.1 Product and Service Classification
- 1.1.2 Application and End-Use Classification
- 1.1.3 Technology and Solution Classification
- 1.1.4 Customer and Distribution Channel Classification
- 1.1.5 Geographic Segmentation
- 1.1.6 Market Segment Definitions and Boundaries
- 1.2 By Technology
- 1.2.1 Compressed Gas Storage
- 1.2.2 Liquid Hydrogen Storage
- 1.2.3 Material-Based Storage
- 1.2.4 Underground Storage Development
- 1.3 By End-Use Sector
- 1.3.1 Refining and Chemicals
- 1.3.2 Hydrogen Export
- 1.3.3 Power and Distributed Energy
- 1.3.4 Transport Refuelling
- 1.4 By Asset Type
- 1.4.1 Stationary Storage Assets
- 1.4.2 Mobile Storage Assets
- 1.4.3 Export Terminal Storage Assets
- 1.4.4 Geological Storage Development
- 1.5 By Contracting Model
- 1.5.1 Equipment Purchase
- 1.5.2 Turnkey Storage Contracts
- 1.5.3 Storage Service Contracts
Chapter 2 Introduction
- 2.1 Report Objectives and Scope
- 2.2 Product Definition and Industry Terminology
- 2.3 Market Inclusions and Exclusions
- 2.4 Research Process
- 2.4.1 Primary Research and Expert Interviews
- 2.4.2 Secondary Research and Source Review
- 2.4.3 Top-Down and Bottom-Up Estimation
- 2.4.4 Data Triangulation and Verification
- 2.5 Market Size Measurement Basis
- 2.5.1 2025: USD 394.5 million → 2035: USD 881.9 million
- 2.6 Historical and Forecast Reference Periods
- 2.6.1 Historical Period: 2018-2025
- 2.6.2 Base Year: 2025
- 2.6.3 Forecast Period: 2025-2035
- 2.7 Research Assumptions and Limitations
Chapter 3 Executive Summary
- 3.1 Market Snapshot and Key Findings
- 3.2 Base-Year Market Size, 2025
- 3.3 Forecast Market Size, 2035
- 3.4 Revenue and Volume Growth Outlook
- 3.5 Key Demand and Supply Indicators
- 3.6 Leading Market Segments
- 3.7 Fastest-Growing Market Opportunities
- 3.8 Regional Performance Highlights
- 3.9 Technology and Industry Transformation
- 3.10 Competitive Landscape Summary
- 3.11 Analyst View and Strategic Implications
Chapter 4 Australia Hydrogen Storage Market Trends and Developments
- 4.1 Historical Industry Development, 2018-2025
- 4.2 Recent Market Trends and Developments
- 4.3 Demand and Customer Behavior Trends
- 4.4 Technology and Product Innovation
- 4.5 Artificial Intelligence, Automation and Digitalization
- 4.6 Local Manufacturing and Supply Chain Realignment
- 4.7 Industry Partnerships, Mergers and Acquisitions
- 4.8 Sustainability and Circular Economy Developments
- 4.9 Government and Private Sector Investment Trends
- 4.10 Emerging Business Models and Commercialization
- 4.11 Industry Developments and Announcements
Chapter 5 Australia Hydrogen Storage Market Production, Supply and Demand Analysis
- 5.1 Demand Trend and Consumption Analysis, 2018-2025
- 5.2 Demand Forecast, 2025-2035
- 5.3 Production and Output Trend, 2018-2025
- 5.4 Production and Output Forecast, 2025-2035
- 5.5 Installed Capacity and Capacity Utilization
- 5.6 Company-Wise Production Plants and Statistics
- 5.6.1 Installed Production Capacity
- 5.6.2 Actual Production
- 5.6.3 Planned Capacity and Expansion Targets
- 5.7 Supply Chain Structure and Procurement Trends
- 5.8 Supply-Demand Gap and Bottlenecks
- 5.9 Import Dependence and Sourcing Structure
- 5.10 Contract Manufacturing and Outsourcing
- 5.11 Regional Supply and Demand Concentration
Chapter 6 Australia Hydrogen Storage Market Pricing Analysis
- 6.1 Pricing Structure and Measurement
- 6.2 Historical Pricing Trends, 2018-2025
- 6.3 Pricing Outlook, 2025-2035
- 6.4 Average Selling Price and Unit Economics
- 6.5 Pricing by Product and Market Segment
- 6.6 Geographic Pricing Differences
- 6.7 Key Input, Energy, Labor and Logistics Costs
- 6.8 Contract Pricing and Purchasing Models
- 6.9 Pricing Sensitivity and Competitive Positioning
- 6.10 Price, Margin and Profitability Implications
Chapter 7 Australia Hydrogen Storage Market Dynamics
- 7.1 Market Growth Drivers
- 7.1.1 Demand-Side Drivers
- 7.1.2 Technology and Innovation Drivers
- 7.1.3 Infrastructure and Investment Drivers
- 7.1.4 Regulatory and Policy Drivers
- 7.2 Market Restraints
- 7.2.1 Cost and Affordability Constraints
- 7.2.2 Technology and Adoption Barriers
- 7.2.3 Supply Chain and Operational Constraints
- 7.3 Market Challenges
- 7.3.1 Competitive Pressure and Margin Erosion
- 7.3.2 Skills, Infrastructure and Implementation Gaps
- 7.4 Emerging Market Opportunities
- 7.5 Market Dynamics Impact and Time-Horizon Assessment
Chapter 8 Australia Hydrogen Storage Value Chain Analysis
- 8.1 Industry Value Chain Overview
- 8.2 Upstream Suppliers and Critical Inputs
- 8.3 Technology and Component Providers
- 8.4 Manufacturing or Service Delivery
- 8.5 Distribution, Channel Partners and Integrators
- 8.6 Downstream Applications and End Users
- 8.7 Value Addition and Profit Pools
- 8.8 Vertical Integration and Outsourcing
- 8.9 Supplier Concentration and Risk
- 8.10 Supply Chain Localization and Resilience
Chapter 9 Australia Hydrogen Storage Market Regulations and Policies
- 9.1 Relevant Laws, Standards and Compliance Frameworks
- 9.2 Product, Service, Safety and Quality Requirements
- 9.3 Government Policies, Incentives and Subsidies
- 9.4 Imports, Exports and Trade Barriers
- 9.5 Public Procurement and Local Content Requirements
- 9.6 Environmental and Sustainability Compliance
- 9.7 Upcoming Policy Changes and Market Implications
Chapter 10 Australia Hydrogen Storage Market Hotspots and Opportunities
- 10.1 Market Opportunity Mapping and Growth Hotspots
- 10.2 High-Growth Applications and Customer Groups
- 10.3 Underserved Markets and White-Space Opportunities
- 10.4 Emerging Technology and Product Opportunities
- 10.5 New Capacity and Investment Hotspots
- 10.6 Market Entry and Expansion Opportunities
- 10.7 Distribution and Partnership Opportunities
- 10.8 Near-Term and Long-Term Commercial Potential
- 10.9 Opportunity Attractiveness and Execution Risks
Chapter 11 Australia Hydrogen Storage Market Outlook, 2025-2035
- 11.1 Market Size and Analysis
- 11.1.1 Revenue (Market Measurement: 2025: USD 394.5 million → 2035: USD 881.9 million)
- 11.1.2 Market Volume and Quantity Sold
- 11.1.3 Historical Market Size, 2018-2025
- 11.1.4 Base-Year Market Size, 2025
- 11.2 Market Forecast, 2025-2035
- 11.2.1 Revenue Forecast to 2035
- 11.2.2 Volume Forecast to 2035
- 11.2.3 CAGR and Year-on-Year Growth
- 11.2.4 Incremental Revenue Opportunity
- 11.3 Forecast Assumptions and Scenario Analysis
- 11.3.1 Base-Case Forecast
- 11.3.2 Optimistic and Conservative Scenarios
- 11.3.3 Technology, Pricing and Policy Sensitivities
- 11.4 Market Attractiveness and Growth Outlook
Chapter 12 Australia Hydrogen Storage Market Segmentation and Outlook
- 12.1 Segmentation Summary and Market Shares, 2025
- 12.2 Largest and Fastest-Growing Segments
- 12.3 By Technology - Market Size and Forecast, 2025-2035
- 12.3.1 Segment Definition and Scope
- 12.3.2 Historical Market Size, 2018-2025
- 12.3.3 Revenue Forecast, 2025-2035
- 12.3.4 Volume Forecast, 2025-2035
- 12.3.5 Base-Year Market Share, 2025
- 12.3.6 Segment CAGR and Growth Drivers
- 12.3.7 Subsegment Market Size and Forecast
- 12.3.7.1 Compressed Gas Storage
- 12.3.7.2 Liquid Hydrogen Storage
- 12.3.7.3 Material-Based Storage
- 12.3.7.4 Underground Storage Development
- 12.3.8 Subsegment Pricing and Adoption Trends
- 12.3.9 Leading Suppliers and Competition
- 12.3.10 Regional Demand and Opportunities
- 12.4 By End-Use Sector - Market Size and Forecast, 2025-2035
- 12.4.1 Segment Definition and Scope
- 12.4.2 Historical Market Size, 2018-2025
- 12.4.3 Revenue Forecast, 2025-2035
- 12.4.4 Volume Forecast, 2025-2035
- 12.4.5 Base-Year Market Share, 2025
- 12.4.6 Segment CAGR and Growth Drivers
- 12.4.7 Subsegment Market Size and Forecast
- 12.4.7.1 Refining and Chemicals
- 12.4.7.2 Hydrogen Export
- 12.4.7.3 Power and Distributed Energy
- 12.4.7.4 Transport Refuelling
- 12.4.8 Subsegment Pricing and Adoption Trends
- 12.4.9 Leading Suppliers and Competition
- 12.4.10 Regional Demand and Opportunities
- 12.5 By Asset Type - Market Size and Forecast, 2025-2035
- 12.5.1 Segment Definition and Scope
- 12.5.2 Historical Market Size, 2018-2025
- 12.5.3 Revenue Forecast, 2025-2035
- 12.5.4 Volume Forecast, 2025-2035
- 12.5.5 Base-Year Market Share, 2025
- 12.5.6 Segment CAGR and Growth Drivers
- 12.5.7 Subsegment Market Size and Forecast
- 12.5.7.1 Stationary Storage Assets
- 12.5.7.2 Mobile Storage Assets
- 12.5.7.3 Export Terminal Storage Assets
- 12.5.7.4 Geological Storage Development
- 12.5.8 Subsegment Pricing and Adoption Trends
- 12.5.9 Leading Suppliers and Competition
- 12.5.10 Regional Demand and Opportunities
- 12.6 By Contracting Model - Market Size and Forecast, 2025-2035
- 12.6.1 Segment Definition and Scope
- 12.6.2 Historical Market Size, 2018-2025
- 12.6.3 Revenue Forecast, 2025-2035
- 12.6.4 Volume Forecast, 2025-2035
- 12.6.5 Base-Year Market Share, 2025
- 12.6.6 Segment CAGR and Growth Drivers
- 12.6.7 Subsegment Market Size and Forecast
- 12.6.7.1 Equipment Purchase
- 12.6.7.2 Turnkey Storage Contracts
- 12.6.7.3 Storage Service Contracts
- 12.6.8 Subsegment Pricing and Adoption Trends
- 12.6.9 Leading Suppliers and Competition
- 12.6.10 Regional Demand and Opportunities
- 12.7 Segment Growth Comparison
- 12.8 Segment Attractiveness and Priority Matrix
Chapter 13 Australia Hydrogen Storage End-Use and Application Market Outlook
- 13.1 End-Use Industry and Customer Demand Structure
- 13.2 Leading Applications and Customer Groups
- 13.3 End-Use Market Size, Share and Forecast
- 13.4 Major End-Use Industry Deep Dives
- 13.4.1 Customer Requirements and Use Cases
- 13.4.2 Demand and Replacement Cycles
- 13.4.3 Technical and Regulatory Considerations
- 13.4.4 Purchasing and Procurement Models
- 13.4.5 Leading Vendors and Distribution Channels
- 13.4.6 Forecast and Commercial Opportunities
- 13.5 Emerging Applications and Cross-Segment Demand
- 13.6 End-Use Industry Investment Priorities
Chapter 14 Australia Hydrogen Storage Geographic Market Outlook, 2025-2035
- 14.1 Domestic Market Distribution and Demand Clusters
- 14.2 State- or Province-Wise Market Size and Forecast, 2025-2035
- 14.3 City and Metropolitan Market Outlook
- 14.4 Industrial, Manufacturing and Commercial Clusters
- 14.5 Geographic Concentration of Key End Users
- 14.6 Local Pricing and Purchasing Differences
- 14.7 Domestic Production Facilities and Capacity Map
- 14.8 Local Infrastructure and Project Pipeline
- 14.9 State-Level Policy and Incentive Differences
- 14.10 Subnational Investment Hotspots and Opportunities
- 14.11 Distribution and Logistics Networks
- 14.12 Domestic Competitive Footprint
Chapter 15 Australia Hydrogen Storage Technology, Innovation and Sustainability Outlook
- 15.1 Technology Landscape and Maturity
- 15.2 Product, Process and Service Innovation
- 15.3 AI, Automation and Digital Tools in the Industry
- 15.4 Technology Adoption and Performance Benchmarking
- 15.5 Innovation Pipeline and R&D Investment
- 15.6 Patent and Intellectual Property Trends
- 15.7 Energy Efficiency and Resource Management
- 15.8 Sustainability, Recycling and Circularity
- 15.9 Technology Roadmap, 2025-2035
- 15.10 Risks of Obsolescence and Technology Substitution
Chapter 16 Australia Hydrogen Storage Market Key Strategic Imperatives
- 16.1 Growth and Market Entry Priorities
- 16.2 High-Return Products and Segments
- 16.3 Pricing, Profitability and Cost Optimization
- 16.4 Technology Investment and Product Differentiation
- 16.5 Supply Chain Localization and Resilience
- 16.6 Distribution and Customer Acquisition
- 16.7 Partnership, Acquisition and Capacity Strategy
- 16.8 Regional Expansion Priorities
- 16.9 Short-, Medium- and Long-Term Actions
Chapter 17 Competition Outlook
- 17.1 Industry Competition Characteristics
- 17.2 Market Structure and Concentration
- 17.3 Market Share and Competitive Positioning, 2025
- 17.4 Company-Wise Revenue and Product Benchmarking
- 17.5 Production and Service Capacity Benchmarking
- 17.6 Technology, Pricing and Differentiation
- 17.7 Regional Footprint and Distribution Strength
- 17.8 Mergers, Acquisitions and Strategic Alliances
- 17.9 New Entrants and Competitive Threats
- 17.10 Porter's Five Forces and Industry Attractiveness
- 17.11 Competitive Outlook, 2025-2035
Chapter 18 Company Profiles
- 18.1 Company Coverage and Selection Criteria
- 18.2 BOC Limited
- 18.2.1 Business Description
- 18.2.2 Company Ownership and Geographic Presence
- 18.2.3 Product and Service Portfolio
- 18.2.4 Manufacturing and Operating Footprint
- 18.2.5 Production Capacity and Expansion Plans
- 18.2.6 Financial Performance and Investment
- 18.2.7 Market Share and Competitive Position
- 18.2.8 Technology and Innovation Capabilities
- 18.2.9 Strategic Alliances or Partnerships
- 18.2.10 Recent Developments
- 18.2.11 Growth Strategy and Outlook
- 18.3 Air Liquide Australia
- 18.4 Coregas
- 18.5 Fortescue Energy
- 18.6 ATCO Australia
- 18.7 Kawasaki Heavy Industries
- 18.8 Japan Suiso Energy
- 18.9 Hydrexia
- 18.10 LAVO
- 18.11 Lochard Energy
- 18.12 Other Relevant Market Participants
Note: Every listed company is profiled on the structure shown under the first company. The company list is preliminary and may change based on research findings, market developments, data availability and client requirements.
Chapter 19 Disclaimer
- 19.1 Research and Forecast Disclaimer
- 19.2 Data Source and Estimation Limitations
Note: The depth of individual sections depends on data availability for this market. Volume, capacity, trade and other unit-based metrics are included where applicable.

