
Warehouse and lift truck power needs shape demand
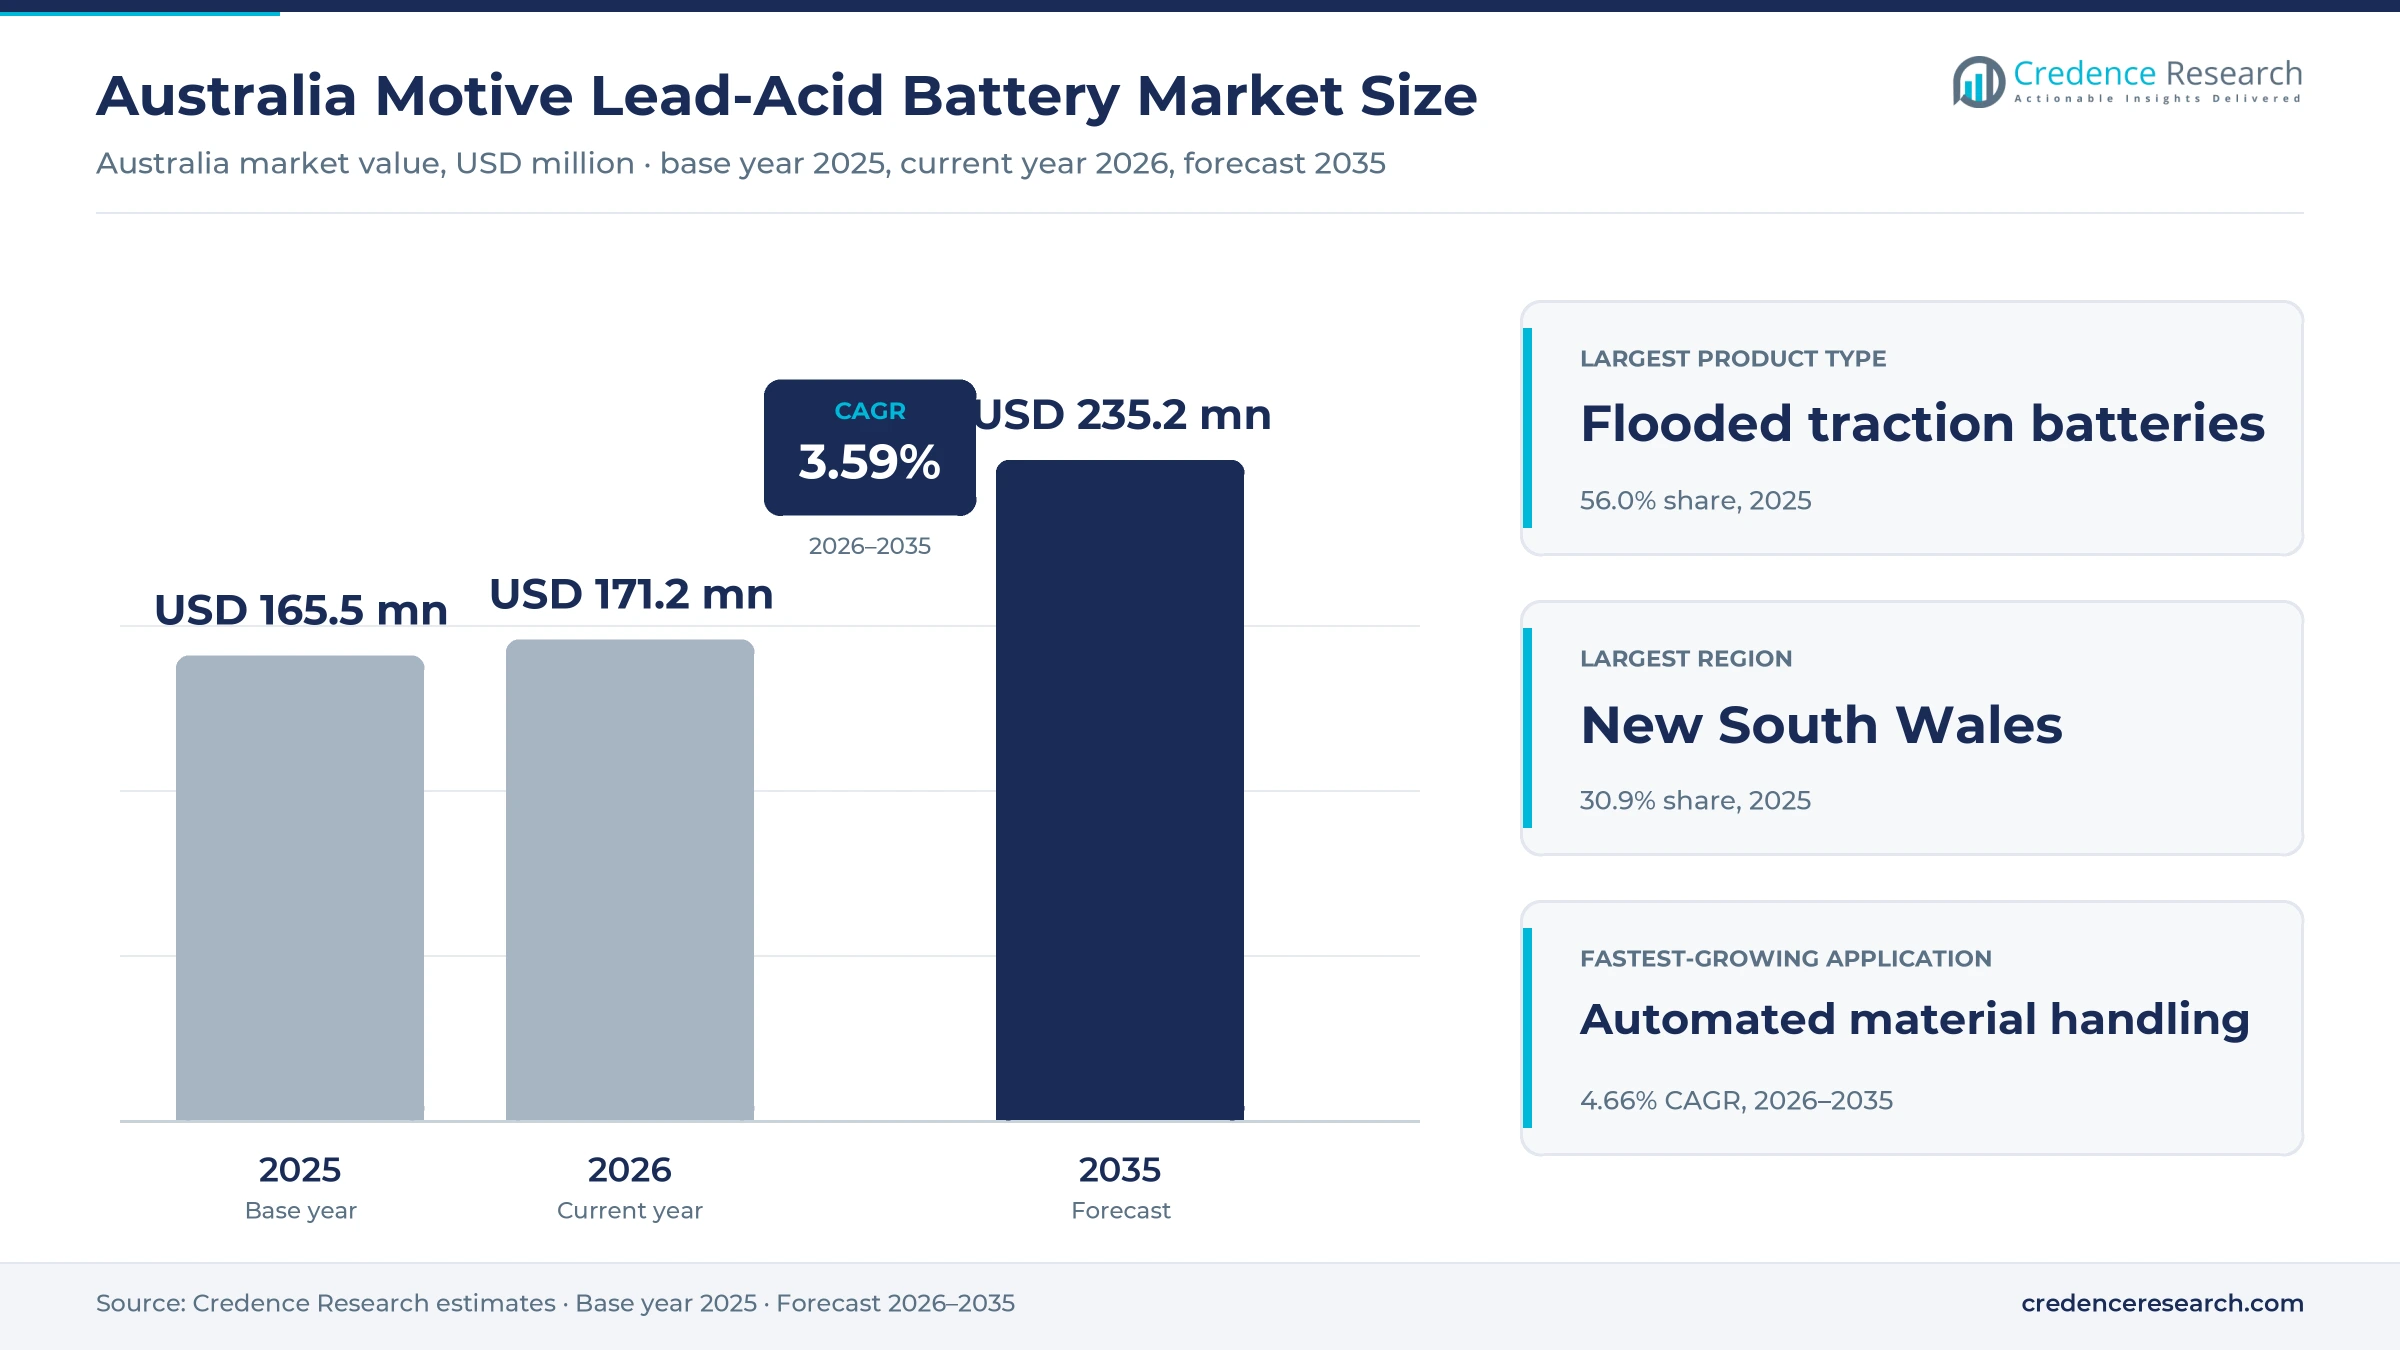
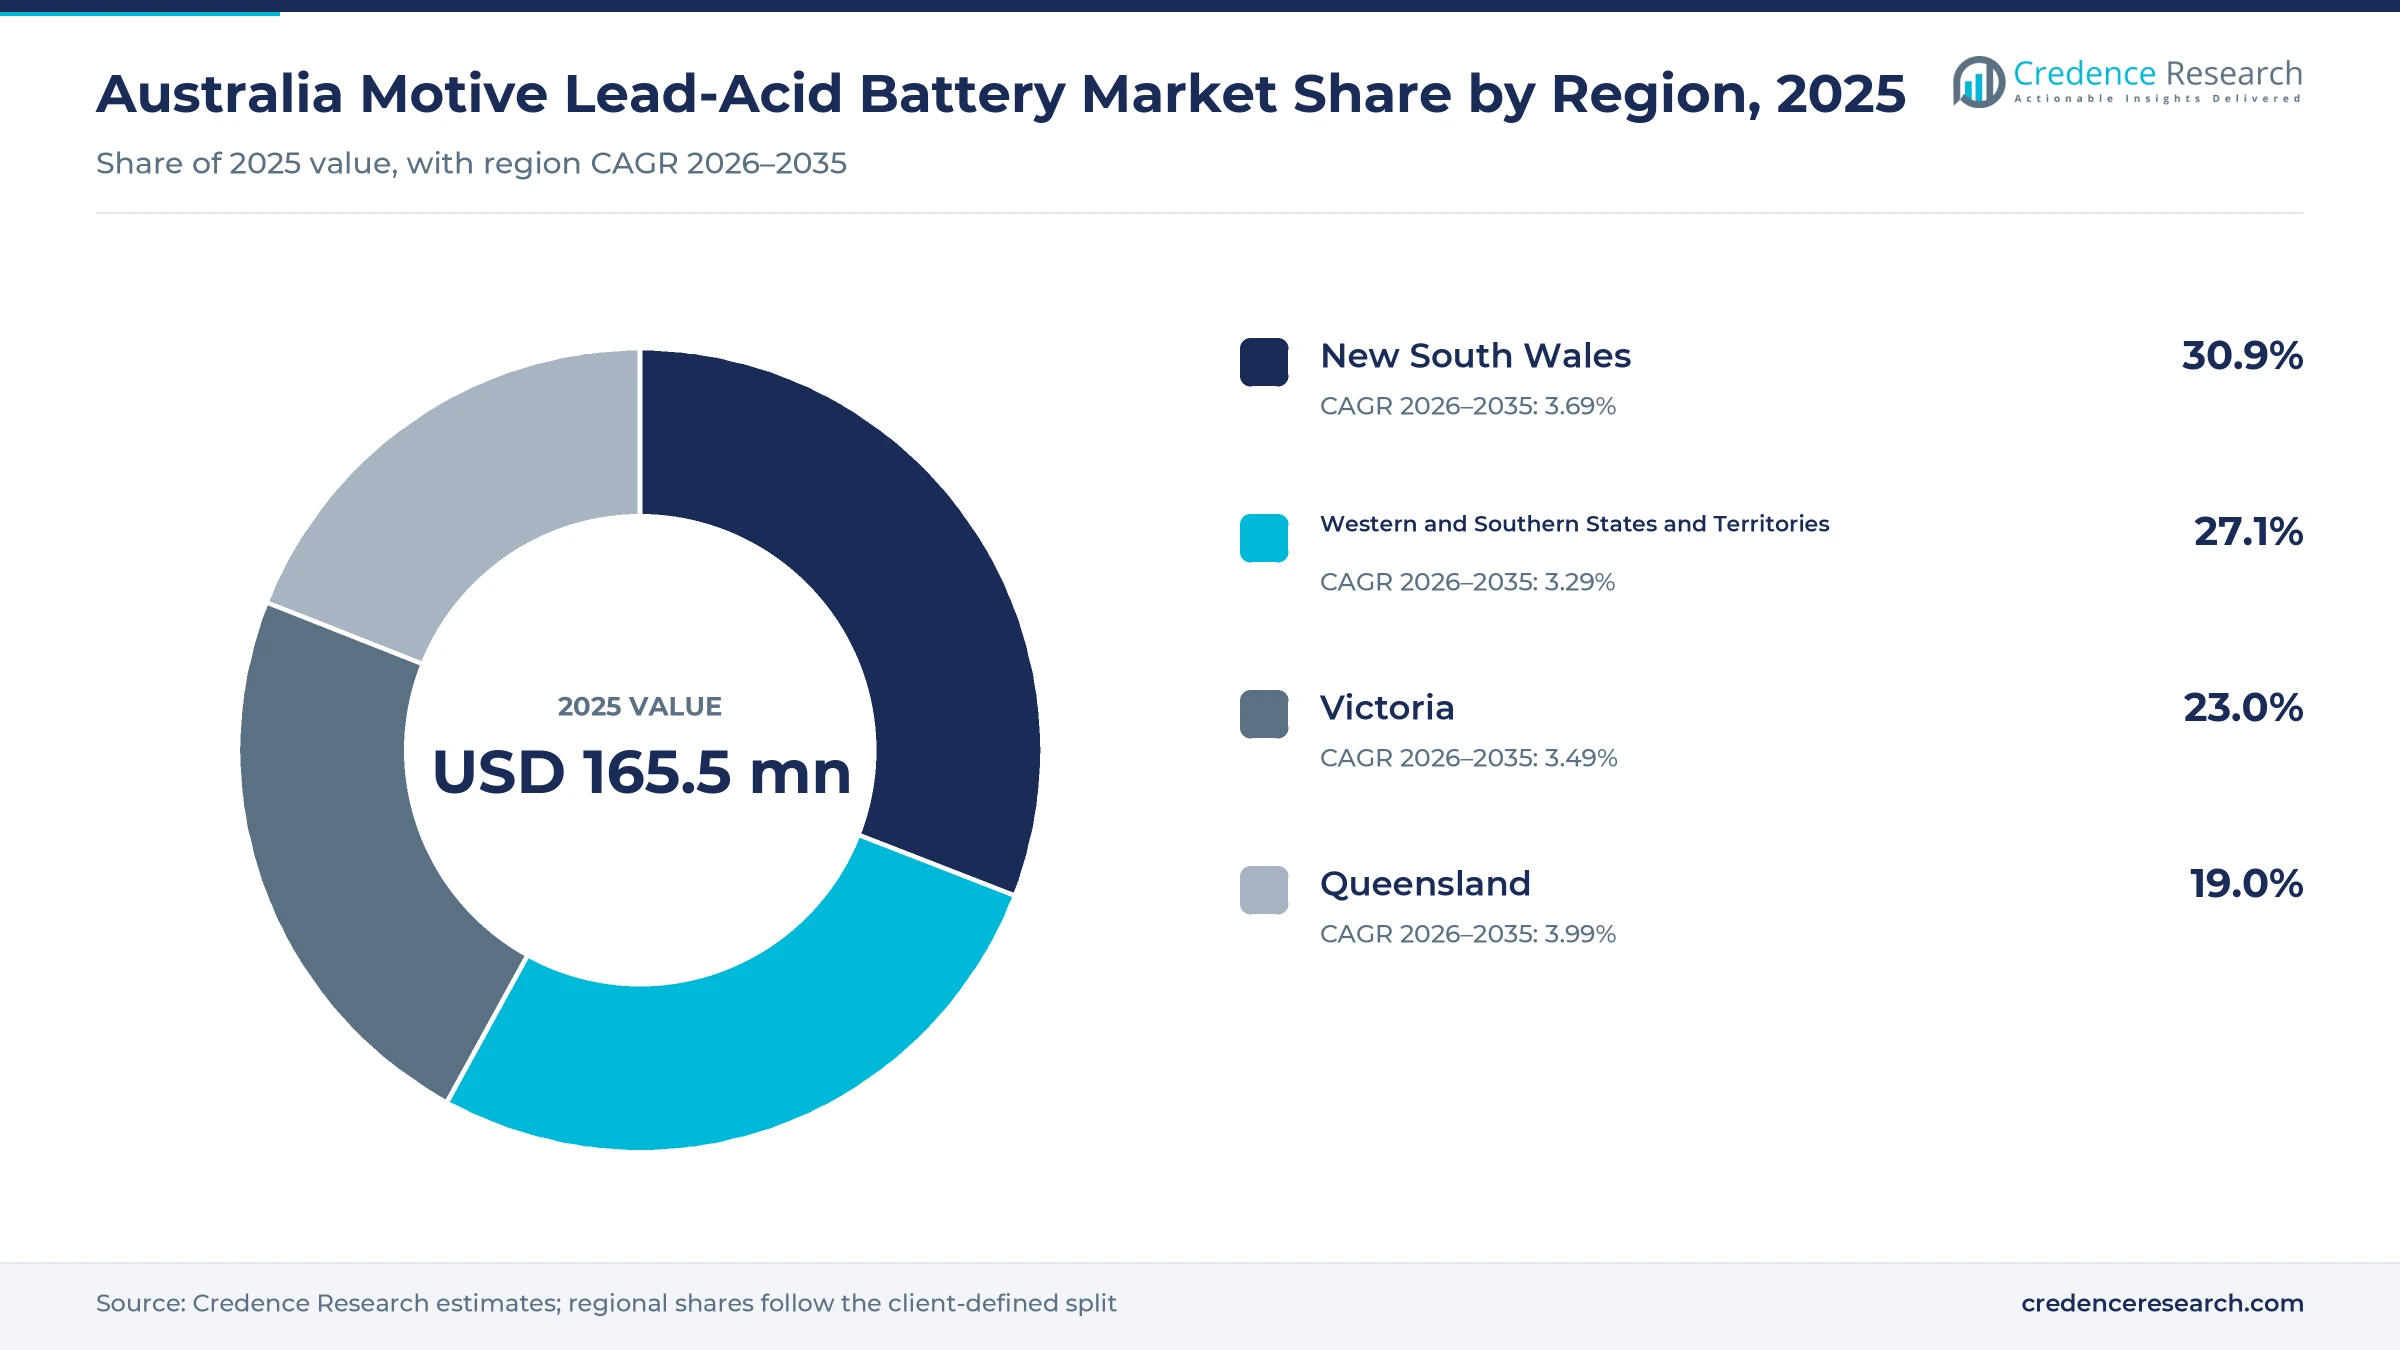
The Australia motive lead-acid battery market was valued at USD 165.5 million in 2025 and is projected to increase from USD 171.2 million in 2026 to USD 235.2 million by 2035, registering a CAGR of 3.59% during 2026–2035. Demand comes from warehouses, factories, ports and airports that run electric lift trucks, powered pallet movers and tow tractors on deep-cycle traction cells. New South Wales held the largest regional share, 30.9% in 2025, because the state holds the densest cluster of distribution centers and freight terminals. Queensland is the fastest-growing region at 3.99% a year, as resource logistics and retail distribution expand across the southeast corner. Replacement buying rather than new equipment sales shapes most orders, because traction cells are renewed on fixed service cycles. In turn, suppliers compete on serviceable tubular designs, maintenance-free alternatives and charging options that suit multi-shift operations across warehousing, manufacturing and ground handling fleets.
Which traction power products does the estimate cover?
The estimate measures the value of motive power lead-acid batteries sold in Australia for electric lift trucks, airport ground support equipment, automated material handling vehicles and mobile utility equipment. It covers flooded traction cells, gel products and absorbent glass mat designs bought by equipment owners, rental fleets and equipment manufacturers.
The estimate excludes automotive starting batteries, stationary standby units and lithium-ion traction packs. The value chain runs from lead refining and plate making through battery assembly and import channels to specialist suppliers, equipment dealers and the service teams that install, water and test cells in working fleets.
Australia Motive Lead-Acid Battery Market Insights
- The Australia motive lead-acid battery market was valued at USD 165.5 million in 2025 and is projected to reach USD 235.2 million by 2035, registering a CAGR of 3.59% during 2026–2035.
- New South Wales held a 30.9% share of 2025 value, because the state holds the largest group of distribution centers and freight terminals.
- Flooded traction batteries led with a 56.0% share of 2025 value, because multi-shift fleets still favor serviceable tubular cells.
- Lead-acid batteries took an estimated 67% of United States apparent lead consumption in 2025, which shows how firmly the chemistry sits in industrial power.
- Automated material handling grows fastest at 4.66% a year during 2026–2035, as operators add powered pallet movers and tow tractors.
Flooded cells lead while glass mat designs gain
Why do flooded traction cells still lead?
Based on product type, the market is categorized into flooded traction batteries, valve-regulated gel batteries and absorbent glass mat batteries. Flooded Traction Batteries led with a 56.0% share of 2025 value, because tubular plates and serviceable cells suit heavy multi-shift duty. Absorbent Glass Mat Batteries grow fastest at 4.59% a year, as buyers seek sealed products that avoid watering and suit charging between shifts.
How does distribution shape traction power use?
Based on end-use industry, the market is categorized into warehousing and retail distribution, manufacturing, transport infrastructure and resources and facility operations. Warehousing and Retail Distribution led with a 41.0% share of 2025 value, because order picking and pallet movement run for long hours. Warehousing and Retail Distribution grows fastest at 3.95% a year, as retail supply chains add storage capacity.
Which equipment consumes the most traction power?
Based on application, the market is categorized into electric forklifts, airport ground support equipment, automated material handling and mobile utility equipment. Electric Forklifts led with a 62.0% share of 2025 value, because counterbalance and reach trucks form the largest installed group. Automated Material Handling grows fastest at 4.66% a year, as automated vehicles enter more warehouses.
How do buyers source replacement cells?
Based on sales channel, the market is categorized into battery specialist direct sales, equipment dealer networks and technical distributors. Battery Specialist Direct Sales led with a 44.0% share of 2025 value, because specialists bundle supply with testing and field service. Battery Specialist Direct Sales grow fastest at 3.76% a year, as dealers tie power supply to equipment service contracts.
| Segment Group | Leading Sub-segment | Share, 2025 | Fastest-growing Sub-segment | CAGR, 2026–2035 |
|---|---|---|---|---|
| By Product Type | Flooded Traction Batteries | 56.0% | Absorbent Glass Mat Batteries | 4.59% |
| By End-Use Industry | Warehousing and Retail Distribution | 41.0% | Warehousing and Retail Distribution | 3.95% |
| By Application | Electric Forklifts | 62.0% | Automated Material Handling | 4.66% |
| By Sales Channel | Battery Specialist Direct Sales | 44.0% | Battery Specialist Direct Sales | 3.76% |
Request a Free Sample
Fill in your details and we'll send you a free sample report.
- Sample data tables & charts
- Research methodology
Distribution activity and fleet renewal lift buying
How does distribution activity sustain equipment use?
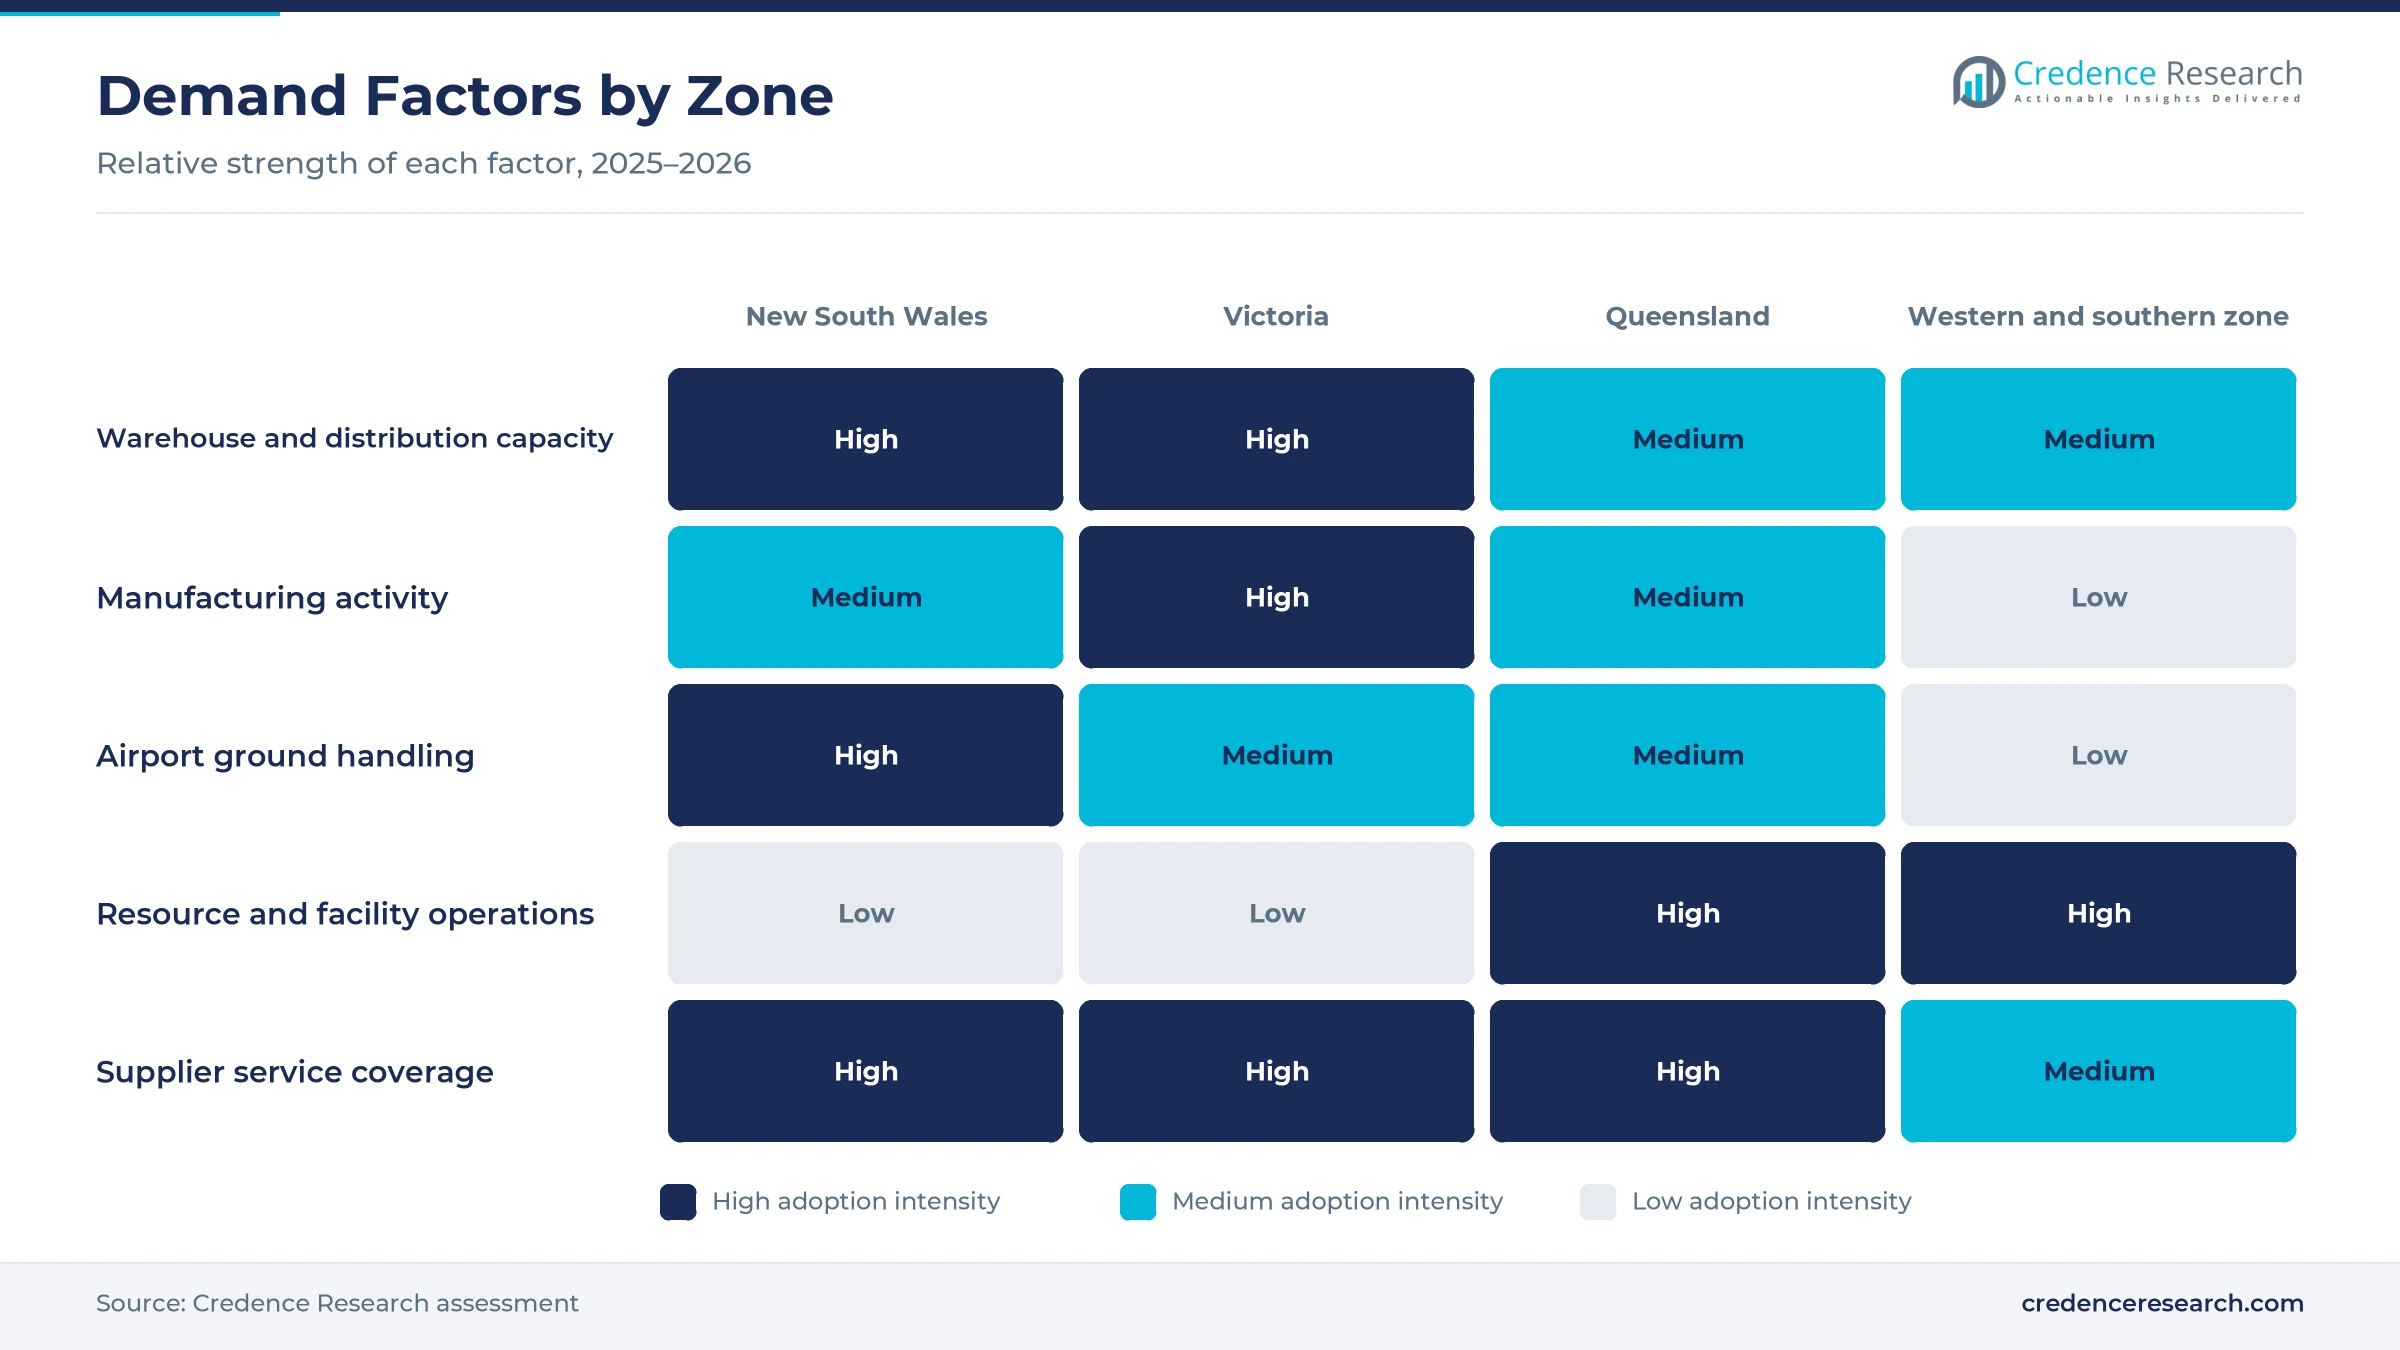
Distribution activity sustains equipment use, because every pallet moved in a warehouse draws on a traction cell. Transport, postal and warehousing employed 754,500 people in February 2026, or 5.1% of the workforce, up 15,300 over the year, according to Jobs and Skills Australia data. Warehousing and storage services alone employed 122,300 workers, the second-largest group after road freight transport with 201,400 workers. The industry also produced 4.5% of gross value added in 2024 and 2025. As a result, warehousing and retail distribution holds 41.0% of 2025 value, and New South Wales keeps the largest regional share because national distribution hubs cluster there.
Why do installed fleets sustain replacement buying?
Installed fleets sustain replacement buying, because traction cells wear out on predictable service cycles and must be renewed while equipment keeps working. Lead-acid batteries took an estimated 67% of apparent lead consumption in the United States during 2025, and secondary production of about 1 million tons covered 70% of that consumption, almost all from used batteries, according to the United States Geological Survey. Scrap value therefore offsets part of each replacement purchase, which keeps total cost competitive. In turn, flooded traction batteries hold 56.0% of 2025 value, and battery specialist direct sales lead the channel split because fleets renew cells under fixed replacement schedules.
How do advanced designs reduce operating friction?
Advanced lead-acid designs reduce operating friction, because sealed products remove watering work and allow charging during short breaks. EnerSys expanded its maintenance-free thin plate pure lead range on Sept. 4, 2025, adding 24, 36, 48 and 80 volt models for Class 1 and Class 2 trucks, as its product announcement set out. The company cited up to 12% better energy efficiency than flooded products and up to 99% recyclability. Because these products suit opportunity charging, operators can keep single-battery fleets running through two shifts. As a result, absorbent glass mat batteries grow fastest at 4.59% a year through 2026–2035.
What does airport ground handling add to demand?
Airport ground handling adds demand, because baggage tractors, belt loaders and cargo loaders run on battery power between flights. The Australian government confirmed on June 10, 2026, that Western Sydney International would take freight flights from July 26, 2026, and passengers from Oct. 25, 2026, in a public statement that also cited capacity for 10 million passengers a year and more than 12,800 jobs. The airport contracted a single operator to run a pooled, mainly electric ground support fleet of loaders, tractors and pushback units. In turn, airport ground support equipment draws steady traction power orders, and New South Wales grows at 3.69% a year.
Fast charging, lithium rivalry and rental services
How is fast charging reshaping product choice?
Fast and opportunity charging is reshaping product choice, because fleets want power topped up during meal breaks instead of battery changes. Century Yuasa sells British Standard and DIN traction cells with tubular positive plates and zigzag polyethylene separators built for fast charging, as its motive power range describes, alongside bolt-on cells that need no electrolyte maintenance. Crown Equipment extended its own lead-acid line on Oct. 7, 2020, with flat plate and tubular designs, five-layer plate wraps and high frequency chargers. Because 2 of the 3 product groups in this report are sealed, the shift favors them in single-battery operations. Fleets that top up during 2 or 3 short breaks a shift also avoid separate change rooms, which lowers the cost of adding equipment.
Why is lithium-ion rivalry growing in light duty?
Lithium-ion rivalry is growing in light duty work, because sealed packs need no watering and accept frequent partial charges. Industrial Batteries Australia added lithium forklift packs in 24, 48 and 80 volt sizes through a supply partnership announced on July 15, 2023, while keeping its traction battery and charger business. Crown Equipment also lists lithium-ion products beside its lead-acid range on its Australian site. However, higher purchase prices and limited charging power at older sites keep many buyers with proven chemistry, so lift truck fleets still renew lead cells on established cycles. Mixed fleets are now common, with sealed packs in 1 or 2 light trucks and traction cells in heavier units that work three shifts.
Can rental and refurbishment open recurring work?
Rental and refurbishment can open recurring work, because fleets want power as a service rather than a capital item. Sunlight Group bought the remaining 49% of Triathlon Battery Solutions on Oct. 11, 2023, taking full ownership of a Sydney supplier that offers rental, refurbishment and customized assembly of traction cells from its Eastern Creek plant. Industrial Batteries Australia runs branches in every mainland state with more than 30 staff, which supports field swaps and capacity testing. Because equipment hire operators renew fleets often, battery specialist direct sales hold 44.0% of 2025 value. Rental contracts of 3 to five years also give suppliers a known replacement date for each unit.
Is automation creating new fitted power demand?
Automation is creating new fitted power demand, because guided vehicles and tow tractors need batteries sized for continuous duty. Toyota Material Handling Australia supplied 6 battery-electric tow tugs with 48 volt drivelines to an airport services operator in 2026, lifting that fleet to 16 units across 15 regional airports. Those vehicles recharge without three-phase supply, which suits sites with limited power. Because apron handling and warehouse automation both expand, automated material handling grows at 4.66% a year. Fitted packs also follow the vehicle rather than a change room, so each new machine adds a fresh replacement cycle.
Lithium rivals, compliance and charging limits weigh
How does lithium substitution limit value growth?
Lithium substitution limits value growth, because single-shift sites that once bought traction cells now compare sealed packs with longer cycle life. As a result, suppliers face slower volume gains in light duty equipment and must defend price against imported alternatives. Many respond with maintenance-free designs, charger upgrades and service bundles, which keep total operating cost close while fleets test alternatives in mixed operations and measure energy use over several seasons.
Why does lead handling raise compliance cost?
Lead handling raises compliance cost, because collection, transport and smelting of used cells are closely regulated. Victorian regulators granted a conditional works approval on Aug. 31, 2020, for a plant designed to process 50,000 metric tons of used lead-acid batteries a year and produce 28,000 metric tons of refined lead, with commissioning tied to further conditions. In turn, suppliers carry collection duties and audit work, which they handle through licensed recyclers and documented return programs.
How do charging limits restrict fleet upgrades?
Charging limits restrict fleet upgrades, because many older warehouses lack the electrical capacity for high-power charger banks. As a result, operators keep spare batteries and change rooms rather than move to charging between shifts. Suppliers respond with high frequency chargers, staged installation plans and products that tolerate partial charging, which lets sites raise equipment utilization without rebuilding the incoming power supply or moving to a new building.
Why does service labor availability constrain supply?
Service labor availability constrains supply, because traction cells need trained technicians for installation, watering checks and capacity testing across long distances. Remote mine sites and regional ports are costly to reach, so visits are infrequent and faults are found late. In turn, suppliers invest in monitoring devices, dealer training and regional agents, which extend coverage while keeping response times acceptable for working fleets.
New South Wales leads while Queensland grows fastest
| Region | Value, 2025 (USD million) | Share, 2025 | CAGR, 2026–2035 |
|---|---|---|---|
| New South Wales | 51.1 | 30.9% | 3.69% |
| Western and Southern States and Territories | 44.9 | 27.1% | 3.29% |
| Victoria | 38.1 | 23.0% | 3.49% |
| Queensland | 31.4 | 19.0% | 3.99% |
Why does New South Wales hold the largest share?
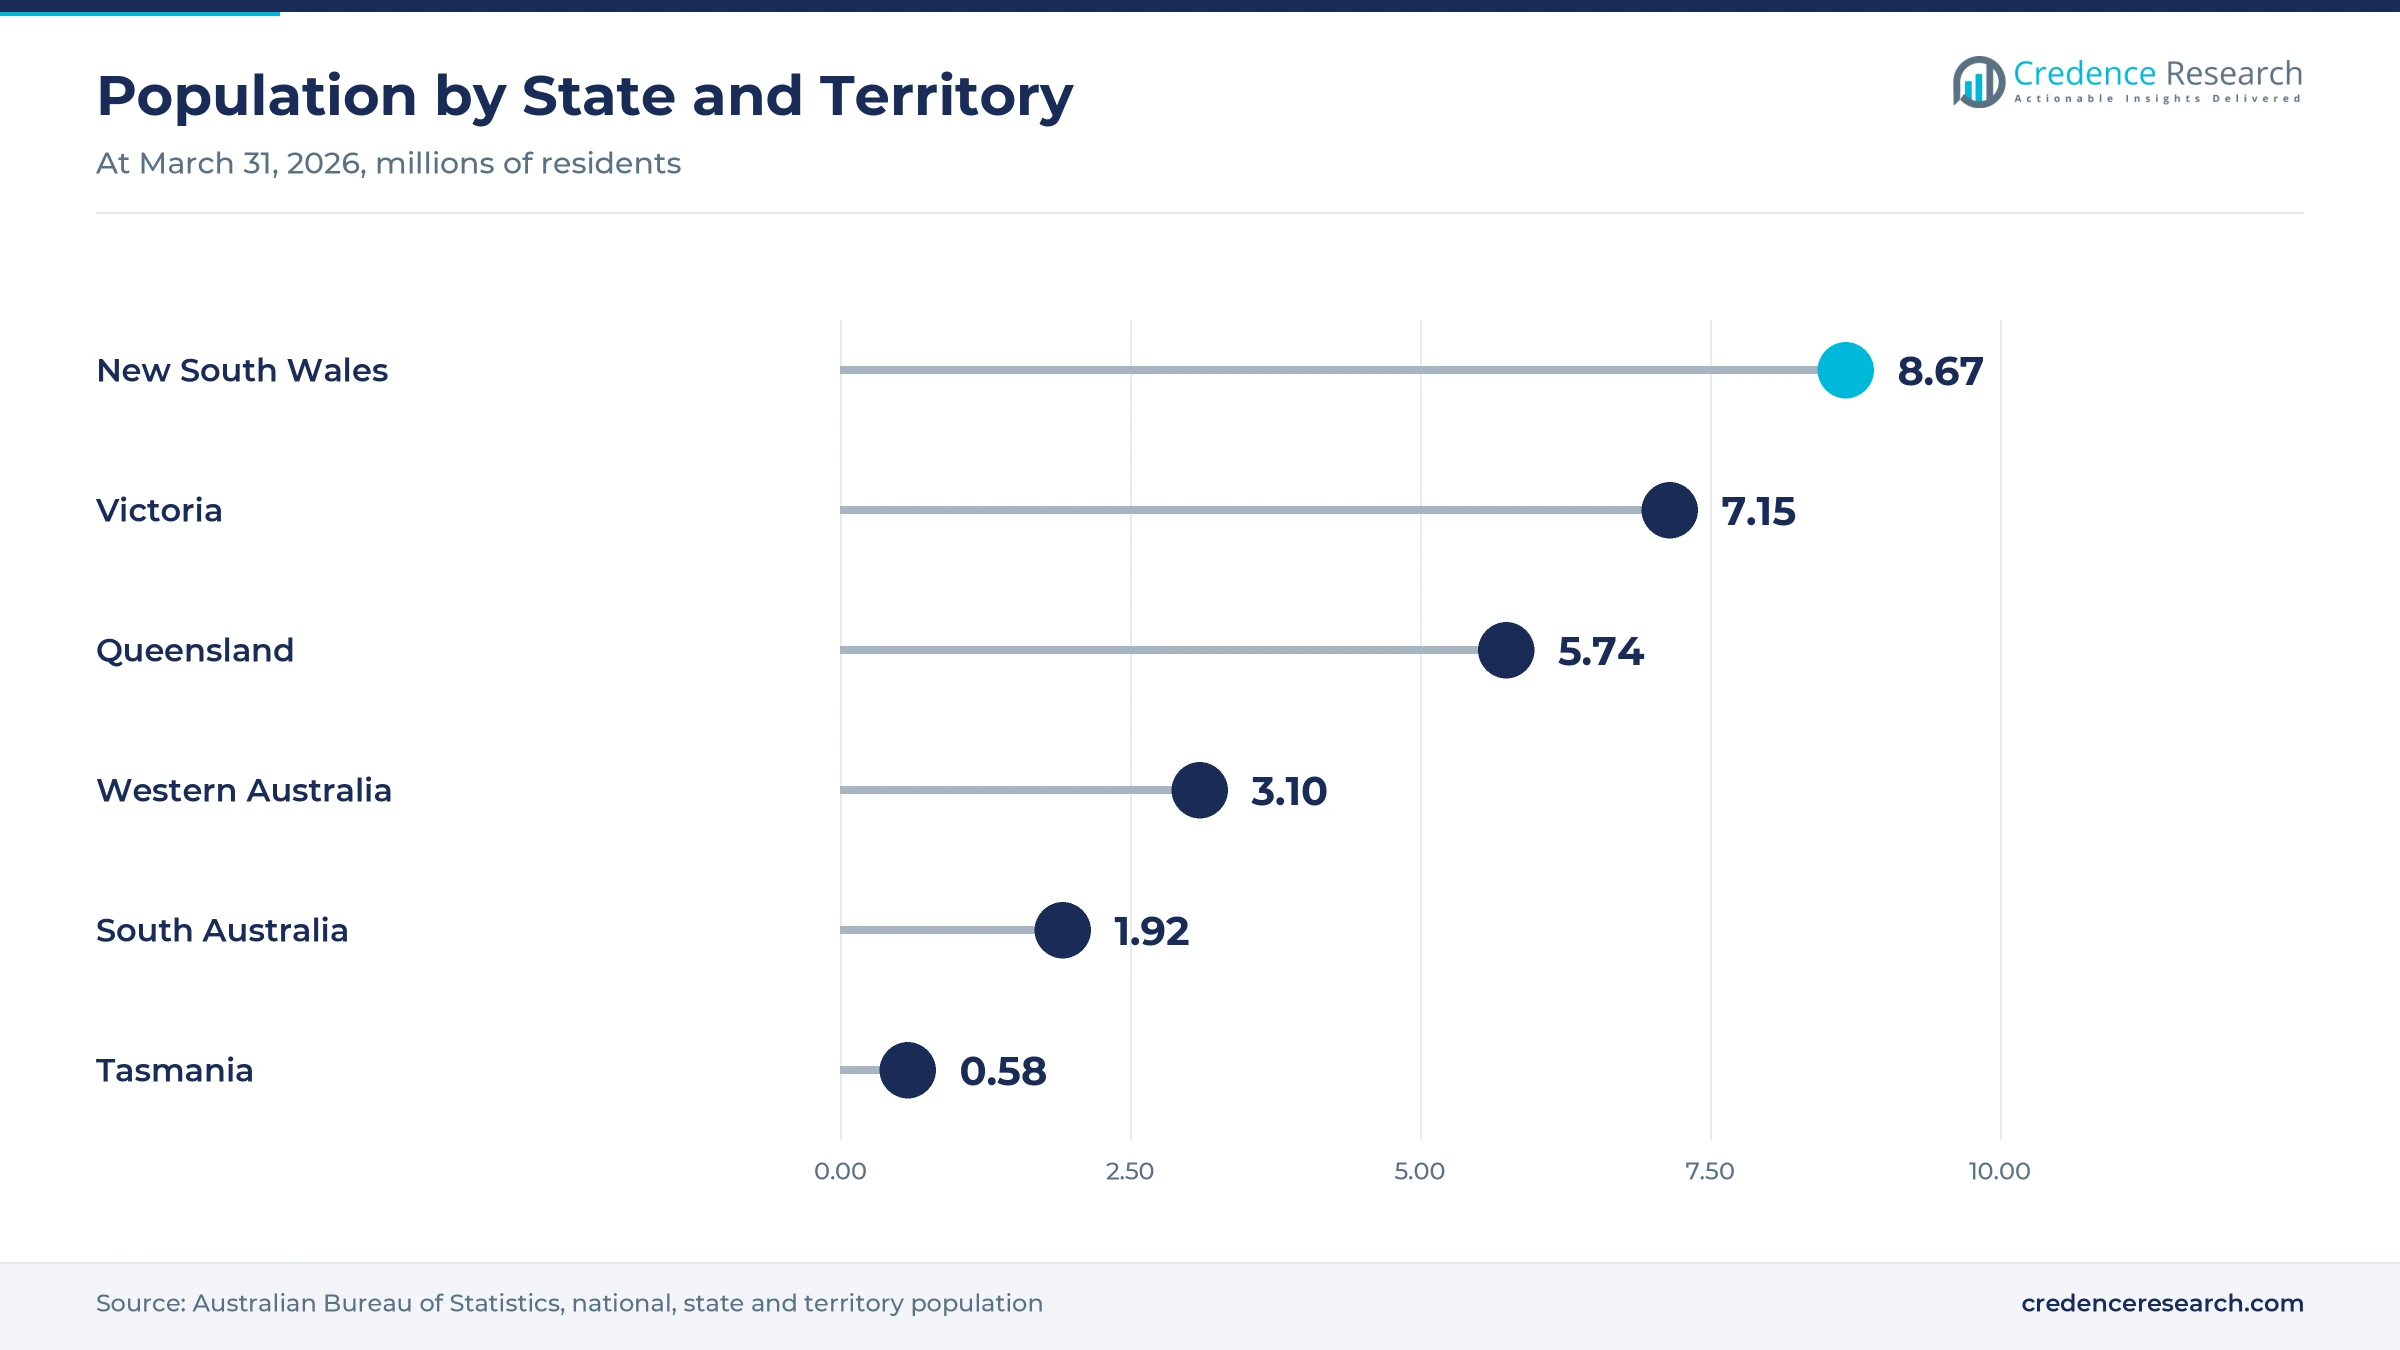
New South Wales held a 30.9% share of 2025 value and grows at 3.69% a year, because the state holds the largest group of distribution centers, container terminals and manufacturing plants. The state had 8.67 million residents at the end of March 2026, more than any other state, which supports dense retail replenishment. Western Sydney also gains a second airport with a mainly electric ground handling fleet. As a result, the zone buys the widest mix of flooded, gel and glass mat products.
What supports demand across Victoria?
Victoria held a 23.0% share of 2025 value and grows at 3.49% a year, because Melbourne handles large container volumes and hosts food, beverage and building product plants that run electric lift trucks. The state had 7.15 million residents at the end of March 2026 and grew 1.6% over the year. Cold storage and grocery distribution add duty cycles that suit serviceable traction cells. In turn, suppliers maintain service branches and change room installations across the metropolitan fringe.
How is Queensland growing fastest?
Queensland held a 19.0% share of 2025 value and grows fastest at 3.99% a year, because population gains, resource logistics and new warehouse capacity lift equipment use. The state had 5.74 million residents at the end of March 2026 after growth of 1.6%, and battery manufacturing at Carole Park sits inside the zone. Mine site facilities and regional ports also run utility vehicles on traction cells. As a result, replacement buying rises faster here than the national average.
What shapes the western and southern zone?
The western and southern states and territories held a 27.1% share of 2025 value and grow at 3.29% a year, because Western Australia, South Australia, Tasmania and the territories rely on resources, agriculture and regional distribution. Western Australia had 3.10 million residents and the fastest state growth at 2.1% in the year to March 2026, while South Australia had 1.92 million. In turn, demand concentrates on durable products for long service intervals.
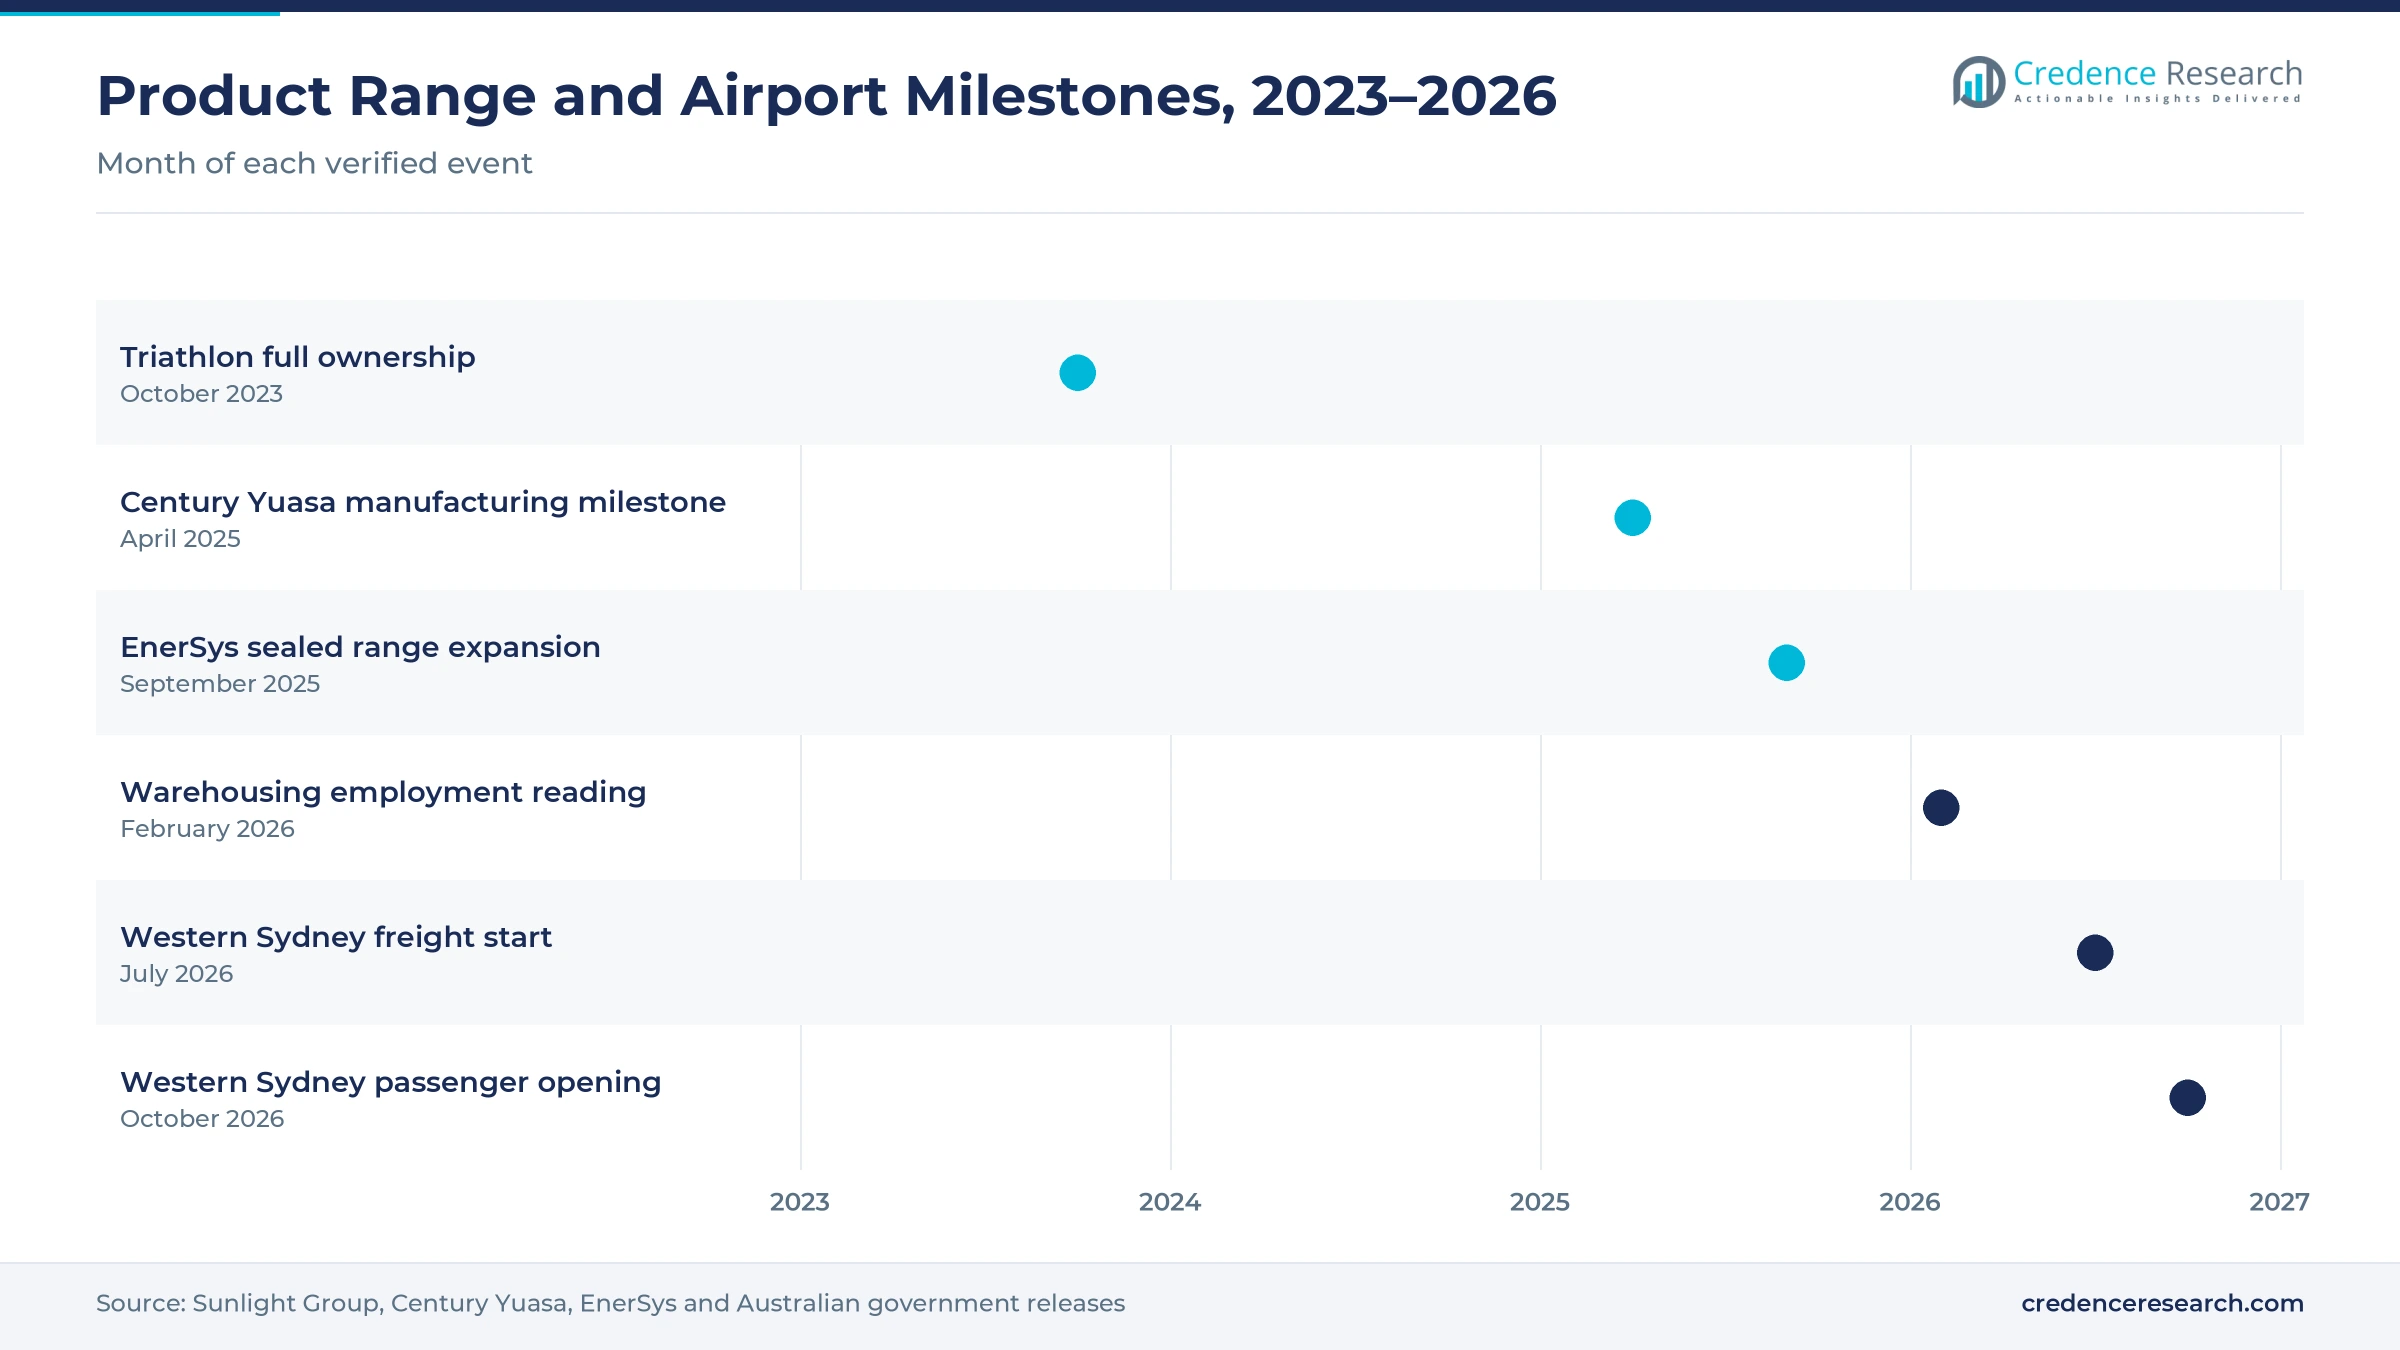
Product range and airport milestones, 2023–2026
| Development | Status and market relevance |
|---|---|
| In October 2023, Sunlight Group acquired the remaining 49% of Triathlon Battery Solutions and took full ownership of the Sydney traction battery supplier. | Strengthens local assembly and rental capacity |
| In April 2025, Century Yuasa marked more than 95 years of building batteries in Australia from its Queensland plant. | Confirms continued domestic manufacturing |
| In September 2025, EnerSys expanded its maintenance-free thin plate pure lead range with 24, 36, 48 and 80 volt models for Class 1 and Class 2 trucks. | Widens sealed options for multi-shift fleets |
| In June 2026, the Australian government confirmed Western Sydney International would open to freight in July 2026 and to passengers in October 2026. | Adds a mainly electric ground handling fleet |
Plate design and charge control extend service life
- Tubular positive plates hold more active material in place through deep discharge cycles, which extends service life in heavy multi-shift duty.
- Thin plate pure lead construction raises charge acceptance and removes watering work, which suits sealed products used in opportunity charging.
- High frequency charging control adjusts current to temperature and state of charge, which limits gassing and keeps cells cooler during short top-up sessions.
- Monitoring and watering systems log temperature, voltage and water levels, which helps technicians plan visits and spot weak cells before a failure.
Need a Custom Version of This Report?
Tailor the scope, geography, or segments to your exact requirements.
- Custom geography or segment scope
- Direct access to our analyst team
Specialists, importers and dealer networks compete
Competition is shaped by one domestic manufacturer, two international motive power groups and independent suppliers that import and assemble cells. Century Yuasa, an affiliate of GS Yuasa, builds batteries at Carole Park in Queensland, reaches customers through 35 distribution centers and runs a collection program with more than 1,100 recycling points. EnerSys sells sealed thin plate pure lead products for Class 1 and Class 2 trucks. Triathlon Battery Solutions, fully owned by Sunlight Group since 2023, assembles, rents and refurbishes traction cells near Sydney. Industrial Batteries Australia supplies batteries and chargers from branches in every mainland state, while Crown Equipment offers its own flat plate and tubular lines beside lithium products. Suppliers compete on field service, charger packages and the ability to keep fleets working during replacement.
Which suppliers serve Australian fleets?
| Company | Type | Role in the market |
|---|---|---|
| Century Yuasa Batteries | Domestic manufacturer | Builds traction cells in Queensland and supplies through 35 distribution centers |
| EnerSys | International motive power group | Supplies sealed thin plate pure lead products for lift truck fleets |
| Triathlon Battery Solutions | Assembler and service provider | Assembles, rents and refurbishes traction cells near Sydney |
| Industrial Batteries Australia | Independent supplier | Sells batteries and chargers from branches in every mainland state |
| Crown Equipment | Equipment manufacturer | Offers flat plate and tubular lines beside lithium products for its trucks |
Credence Research view on motive power purchasing
Credence Research's view is that Australian traction power demand will grow slowly in value, because replacement buying dominates and equipment numbers rise only with warehouse and airport capacity. The bigger change sits inside the product mix, as sealed glass mat designs take share from flooded cells in single-battery operations. Suppliers with field service networks, charger packages and collection programs should hold position best. Operators that move to charging between shifts will buy fewer spare cells, which shifts supplier revenue toward service and monitoring work rather than simple unit replacement.
How the national motive power estimate was built
The report uses 2025 as the base year on a calendar basis, and market values come from the Credence Research model. That model combines national employment and industry statistics, official minerals data, government announcements, regulator records and company product and corporate disclosures. Segment splits and zone growth rates are Credence Research estimates, while zone shares follow the client-defined split. Sources used are official statistics, government publications, regulator decisions and company releases, and no interviews or surveys were used in preparing the estimates.
Fleet renewal and automation carry demand to 2035
The Australia motive lead-acid battery market is expected to reach USD 235.2 million by 2035, a 3.59% CAGR during 2026–2035, as fleets keep renewing traction cells on service cycles. Growth should be strongest in absorbent glass mat products, automated material handling and warehousing demand, because sealed designs suit charging between shifts and automated vehicles enter more sites. Airport ground handling adds a smaller but steady volume of replacement orders each year. Lithium substitution in light duty work remains the main limit on value, while service and collection programs keep established suppliers close to buyers.
Frequently Asked Questions
How big is the Australia motive lead-acid battery market?
Which product type leads the market?
Which region leads and which grows fastest?
Which equipment uses the most traction power?
How does recycling affect replacement cost?
What did EnerSys add to its range in 2025?
Who are the leading suppliers in Australia?
What are the main challenges for suppliers?
Table of Content
Chapter 1 Market Segmentation
- 1.1 Segmentation Framework
- 1.1.1 Product and Service Classification
- 1.1.2 Application and End-Use Classification
- 1.1.3 Technology and Solution Classification
- 1.1.4 Customer and Distribution Channel Classification
- 1.1.5 Geographic Segmentation
- 1.1.6 Market Segment Definitions and Boundaries
- 1.2 By Product Type
- 1.2.1 Flooded Traction Batteries
- 1.2.2 Valve-Regulated Gel Batteries
- 1.2.3 Absorbent Glass Mat Batteries
- 1.3 By End-Use Industry
- 1.3.1 Warehousing and Retail Distribution
- 1.3.2 Manufacturing
- 1.3.3 Transport Infrastructure
- 1.3.4 Resources and Facility Operations
- 1.4 By Application
- 1.4.1 Electric Forklifts
- 1.4.2 Airport Ground Support Equipment
- 1.4.3 Automated Material Handling
- 1.4.4 Mobile Utility Equipment
- 1.5 By Sales Channel
- 1.5.1 Battery Specialist Direct Sales
- 1.5.2 Equipment Dealer Networks
- 1.5.3 Technical Distributors
Chapter 2 Introduction
- 2.1 Report Objectives and Scope
- 2.2 Product Definition and Industry Terminology
- 2.3 Market Inclusions and Exclusions
- 2.4 Research Process
- 2.4.1 Primary Research and Expert Interviews
- 2.4.2 Secondary Research and Source Review
- 2.4.3 Top-Down and Bottom-Up Estimation
- 2.4.4 Data Triangulation and Verification
- 2.5 Market Size Measurement Basis
- 2.5.1 2025: USD 165.5 million → 2035: USD 235.2 million
- 2.6 Historical and Forecast Reference Periods
- 2.6.1 Historical Period: 2018-2025
- 2.6.2 Base Year: 2025
- 2.6.3 Forecast Period: 2025-2035
- 2.7 Research Assumptions and Limitations
Chapter 3 Executive Summary
- 3.1 Market Snapshot and Key Findings
- 3.2 Base-Year Market Size, 2025
- 3.3 Forecast Market Size, 2035
- 3.4 Revenue and Volume Growth Outlook
- 3.5 Key Demand and Supply Indicators
- 3.6 Leading Market Segments
- 3.7 Fastest-Growing Market Opportunities
- 3.8 Regional Performance Highlights
- 3.9 Technology and Industry Transformation
- 3.10 Competitive Landscape Summary
- 3.11 Analyst View and Strategic Implications
Chapter 4 Australia Motive Lead-Acid Battery Market Trends and Developments
- 4.1 Historical Industry Development, 2018-2025
- 4.2 Recent Market Trends and Developments
- 4.3 Demand and Customer Behavior Trends
- 4.4 Technology and Product Innovation
- 4.5 Artificial Intelligence, Automation and Digitalization
- 4.6 Local Manufacturing and Supply Chain Realignment
- 4.7 Industry Partnerships, Mergers and Acquisitions
- 4.8 Sustainability and Circular Economy Developments
- 4.9 Government and Private Sector Investment Trends
- 4.10 Emerging Business Models and Commercialization
- 4.11 Industry Developments and Announcements
Chapter 5 Australia Motive Lead-Acid Battery Market Production, Supply and Demand Analysis
- 5.1 Demand Trend and Consumption Analysis, 2018-2025
- 5.2 Demand Forecast, 2025-2035
- 5.3 Production and Output Trend, 2018-2025
- 5.4 Production and Output Forecast, 2025-2035
- 5.5 Installed Capacity and Capacity Utilization
- 5.6 Company-Wise Production Plants and Statistics
- 5.6.1 Installed Production Capacity
- 5.6.2 Actual Production
- 5.6.3 Planned Capacity and Expansion Targets
- 5.7 Supply Chain Structure and Procurement Trends
- 5.8 Supply-Demand Gap and Bottlenecks
- 5.9 Import Dependence and Sourcing Structure
- 5.10 Contract Manufacturing and Outsourcing
- 5.11 Regional Supply and Demand Concentration
Chapter 6 Australia Motive Lead-Acid Battery Market Pricing Analysis
- 6.1 Pricing Structure and Measurement
- 6.2 Historical Pricing Trends, 2018-2025
- 6.3 Pricing Outlook, 2025-2035
- 6.4 Average Selling Price and Unit Economics
- 6.5 Pricing by Product and Market Segment
- 6.6 Geographic Pricing Differences
- 6.7 Key Input, Energy, Labor and Logistics Costs
- 6.8 Contract Pricing and Purchasing Models
- 6.9 Pricing Sensitivity and Competitive Positioning
- 6.10 Price, Margin and Profitability Implications
Chapter 7 Australia Motive Lead-Acid Battery Market Dynamics
- 7.1 Market Growth Drivers
- 7.1.1 Demand-Side Drivers
- 7.1.2 Technology and Innovation Drivers
- 7.1.3 Infrastructure and Investment Drivers
- 7.1.4 Regulatory and Policy Drivers
- 7.2 Market Restraints
- 7.2.1 Cost and Affordability Constraints
- 7.2.2 Technology and Adoption Barriers
- 7.2.3 Supply Chain and Operational Constraints
- 7.3 Market Challenges
- 7.3.1 Competitive Pressure and Margin Erosion
- 7.3.2 Skills, Infrastructure and Implementation Gaps
- 7.4 Emerging Market Opportunities
- 7.5 Market Dynamics Impact and Time-Horizon Assessment
Chapter 8 Australia Motive Lead-Acid Battery Value Chain Analysis
- 8.1 Industry Value Chain Overview
- 8.2 Upstream Suppliers and Critical Inputs
- 8.3 Technology and Component Providers
- 8.4 Manufacturing or Service Delivery
- 8.5 Distribution, Channel Partners and Integrators
- 8.6 Downstream Applications and End Users
- 8.7 Value Addition and Profit Pools
- 8.8 Vertical Integration and Outsourcing
- 8.9 Supplier Concentration and Risk
- 8.10 Supply Chain Localization and Resilience
Chapter 9 Australia Motive Lead-Acid Battery Market Regulations and Policies
- 9.1 Relevant Laws, Standards and Compliance Frameworks
- 9.2 Product, Service, Safety and Quality Requirements
- 9.3 Government Policies, Incentives and Subsidies
- 9.4 Imports, Exports and Trade Barriers
- 9.5 Public Procurement and Local Content Requirements
- 9.6 Environmental and Sustainability Compliance
- 9.7 Upcoming Policy Changes and Market Implications
Chapter 10 Australia Motive Lead-Acid Battery Market Hotspots and Opportunities
- 10.1 Market Opportunity Mapping and Growth Hotspots
- 10.2 High-Growth Applications and Customer Groups
- 10.3 Underserved Markets and White-Space Opportunities
- 10.4 Emerging Technology and Product Opportunities
- 10.5 New Capacity and Investment Hotspots
- 10.6 Market Entry and Expansion Opportunities
- 10.7 Distribution and Partnership Opportunities
- 10.8 Near-Term and Long-Term Commercial Potential
- 10.9 Opportunity Attractiveness and Execution Risks
Chapter 11 Australia Motive Lead-Acid Battery Market Outlook, 2025-2035
- 11.1 Market Size and Analysis
- 11.1.1 Revenue (Market Measurement: 2025: USD 165.5 million → 2035: USD 235.2 million)
- 11.1.2 Market Volume and Quantity Sold
- 11.1.3 Historical Market Size, 2018-2025
- 11.1.4 Base-Year Market Size, 2025
- 11.2 Market Forecast, 2025-2035
- 11.2.1 Revenue Forecast to 2035
- 11.2.2 Volume Forecast to 2035
- 11.2.3 CAGR and Year-on-Year Growth
- 11.2.4 Incremental Revenue Opportunity
- 11.3 Forecast Assumptions and Scenario Analysis
- 11.3.1 Base-Case Forecast
- 11.3.2 Optimistic and Conservative Scenarios
- 11.3.3 Technology, Pricing and Policy Sensitivities
- 11.4 Market Attractiveness and Growth Outlook
Chapter 12 Australia Motive Lead-Acid Battery Market Segmentation and Outlook
- 12.1 Segmentation Summary and Market Shares, 2025
- 12.2 Largest and Fastest-Growing Segments
- 12.3 By Product Type - Market Size and Forecast, 2025-2035
- 12.3.1 Segment Definition and Scope
- 12.3.2 Historical Market Size, 2018-2025
- 12.3.3 Revenue Forecast, 2025-2035
- 12.3.4 Volume Forecast, 2025-2035
- 12.3.5 Base-Year Market Share, 2025
- 12.3.6 Segment CAGR and Growth Drivers
- 12.3.7 Subsegment Market Size and Forecast
- 12.3.7.1 Flooded Traction Batteries
- 12.3.7.2 Valve-Regulated Gel Batteries
- 12.3.7.3 Absorbent Glass Mat Batteries
- 12.3.8 Subsegment Pricing and Adoption Trends
- 12.3.9 Leading Suppliers and Competition
- 12.3.10 Regional Demand and Opportunities
- 12.4 By End-Use Industry - Market Size and Forecast, 2025-2035
- 12.4.1 Segment Definition and Scope
- 12.4.2 Historical Market Size, 2018-2025
- 12.4.3 Revenue Forecast, 2025-2035
- 12.4.4 Volume Forecast, 2025-2035
- 12.4.5 Base-Year Market Share, 2025
- 12.4.6 Segment CAGR and Growth Drivers
- 12.4.7 Subsegment Market Size and Forecast
- 12.4.7.1 Warehousing and Retail Distribution
- 12.4.7.2 Manufacturing
- 12.4.7.3 Transport Infrastructure
- 12.4.7.4 Resources and Facility Operations
- 12.4.8 Subsegment Pricing and Adoption Trends
- 12.4.9 Leading Suppliers and Competition
- 12.4.10 Regional Demand and Opportunities
- 12.5 By Application - Market Size and Forecast, 2025-2035
- 12.5.1 Segment Definition and Scope
- 12.5.2 Historical Market Size, 2018-2025
- 12.5.3 Revenue Forecast, 2025-2035
- 12.5.4 Volume Forecast, 2025-2035
- 12.5.5 Base-Year Market Share, 2025
- 12.5.6 Segment CAGR and Growth Drivers
- 12.5.7 Subsegment Market Size and Forecast
- 12.5.7.1 Electric Forklifts
- 12.5.7.2 Airport Ground Support Equipment
- 12.5.7.3 Automated Material Handling
- 12.5.7.4 Mobile Utility Equipment
- 12.5.8 Subsegment Pricing and Adoption Trends
- 12.5.9 Leading Suppliers and Competition
- 12.5.10 Regional Demand and Opportunities
- 12.6 By Sales Channel - Market Size and Forecast, 2025-2035
- 12.6.1 Segment Definition and Scope
- 12.6.2 Historical Market Size, 2018-2025
- 12.6.3 Revenue Forecast, 2025-2035
- 12.6.4 Volume Forecast, 2025-2035
- 12.6.5 Base-Year Market Share, 2025
- 12.6.6 Segment CAGR and Growth Drivers
- 12.6.7 Subsegment Market Size and Forecast
- 12.6.7.1 Battery Specialist Direct Sales
- 12.6.7.2 Equipment Dealer Networks
- 12.6.7.3 Technical Distributors
- 12.6.8 Subsegment Pricing and Adoption Trends
- 12.6.9 Leading Suppliers and Competition
- 12.6.10 Regional Demand and Opportunities
- 12.7 Segment Growth Comparison
- 12.8 Segment Attractiveness and Priority Matrix
Chapter 13 Australia Motive Lead-Acid Battery End-Use and Application Market Outlook
- 13.1 End-Use Industry and Customer Demand Structure
- 13.2 Leading Applications and Customer Groups
- 13.3 End-Use Market Size, Share and Forecast
- 13.4 Major End-Use Industry Deep Dives
- 13.4.1 Customer Requirements and Use Cases
- 13.4.2 Demand and Replacement Cycles
- 13.4.3 Technical and Regulatory Considerations
- 13.4.4 Purchasing and Procurement Models
- 13.4.5 Leading Vendors and Distribution Channels
- 13.4.6 Forecast and Commercial Opportunities
- 13.5 Emerging Applications and Cross-Segment Demand
- 13.6 End-Use Industry Investment Priorities
Chapter 14 Australia Motive Lead-Acid Battery Geographic Market Outlook, 2025-2035
- 14.1 Domestic Market Distribution and Demand Clusters
- 14.2 State- or Province-Wise Market Size and Forecast, 2025-2035
- 14.3 City and Metropolitan Market Outlook
- 14.4 Industrial, Manufacturing and Commercial Clusters
- 14.5 Geographic Concentration of Key End Users
- 14.6 Local Pricing and Purchasing Differences
- 14.7 Domestic Production Facilities and Capacity Map
- 14.8 Local Infrastructure and Project Pipeline
- 14.9 State-Level Policy and Incentive Differences
- 14.10 Subnational Investment Hotspots and Opportunities
- 14.11 Distribution and Logistics Networks
- 14.12 Domestic Competitive Footprint
Chapter 15 Australia Motive Lead-Acid Battery Technology, Innovation and Sustainability Outlook
- 15.1 Technology Landscape and Maturity
- 15.2 Product, Process and Service Innovation
- 15.3 AI, Automation and Digital Tools in the Industry
- 15.4 Technology Adoption and Performance Benchmarking
- 15.5 Innovation Pipeline and R&D Investment
- 15.6 Patent and Intellectual Property Trends
- 15.7 Energy Efficiency and Resource Management
- 15.8 Sustainability, Recycling and Circularity
- 15.9 Technology Roadmap, 2025-2035
- 15.10 Risks of Obsolescence and Technology Substitution
Chapter 16 Australia Motive Lead-Acid Battery Market Key Strategic Imperatives
- 16.1 Growth and Market Entry Priorities
- 16.2 High-Return Products and Segments
- 16.3 Pricing, Profitability and Cost Optimization
- 16.4 Technology Investment and Product Differentiation
- 16.5 Supply Chain Localization and Resilience
- 16.6 Distribution and Customer Acquisition
- 16.7 Partnership, Acquisition and Capacity Strategy
- 16.8 Regional Expansion Priorities
- 16.9 Short-, Medium- and Long-Term Actions
Chapter 17 Competition Outlook
- 17.1 Industry Competition Characteristics
- 17.2 Market Structure and Concentration
- 17.3 Market Share and Competitive Positioning, 2025
- 17.4 Company-Wise Revenue and Product Benchmarking
- 17.5 Production and Service Capacity Benchmarking
- 17.6 Technology, Pricing and Differentiation
- 17.7 Regional Footprint and Distribution Strength
- 17.8 Mergers, Acquisitions and Strategic Alliances
- 17.9 New Entrants and Competitive Threats
- 17.10 Porter's Five Forces and Industry Attractiveness
- 17.11 Competitive Outlook, 2025-2035
Chapter 18 Company Profiles
- 18.1 Company Coverage and Selection Criteria
- 18.2 Century Yuasa Batteries
- 18.2.1 Business Description
- 18.2.2 Company Ownership and Geographic Presence
- 18.2.3 Product and Service Portfolio
- 18.2.4 Manufacturing and Operating Footprint
- 18.2.5 Production Capacity and Expansion Plans
- 18.2.6 Financial Performance and Investment
- 18.2.7 Market Share and Competitive Position
- 18.2.8 Technology and Innovation Capabilities
- 18.2.9 Strategic Alliances or Partnerships
- 18.2.10 Recent Developments
- 18.2.11 Growth Strategy and Outlook
- 18.3 EnerSys
- 18.4 Industrial Batteries Australia
- 18.5 Triathlon Battery Solutions
- 18.6 Crown Equipment
- 18.7 Other Relevant Market Participants
Note: Every listed company is profiled on the structure shown under the first company. The company list is preliminary and may change based on research findings, market developments, data availability and client requirements.
Chapter 19 Disclaimer
- 19.1 Research and Forecast Disclaimer
- 19.2 Data Source and Estimation Limitations
Note: The depth of individual sections depends on data availability for this market. Volume, capacity, trade and other unit-based metrics are included where applicable.

