
Renewable growth turns batteries into core grid assets
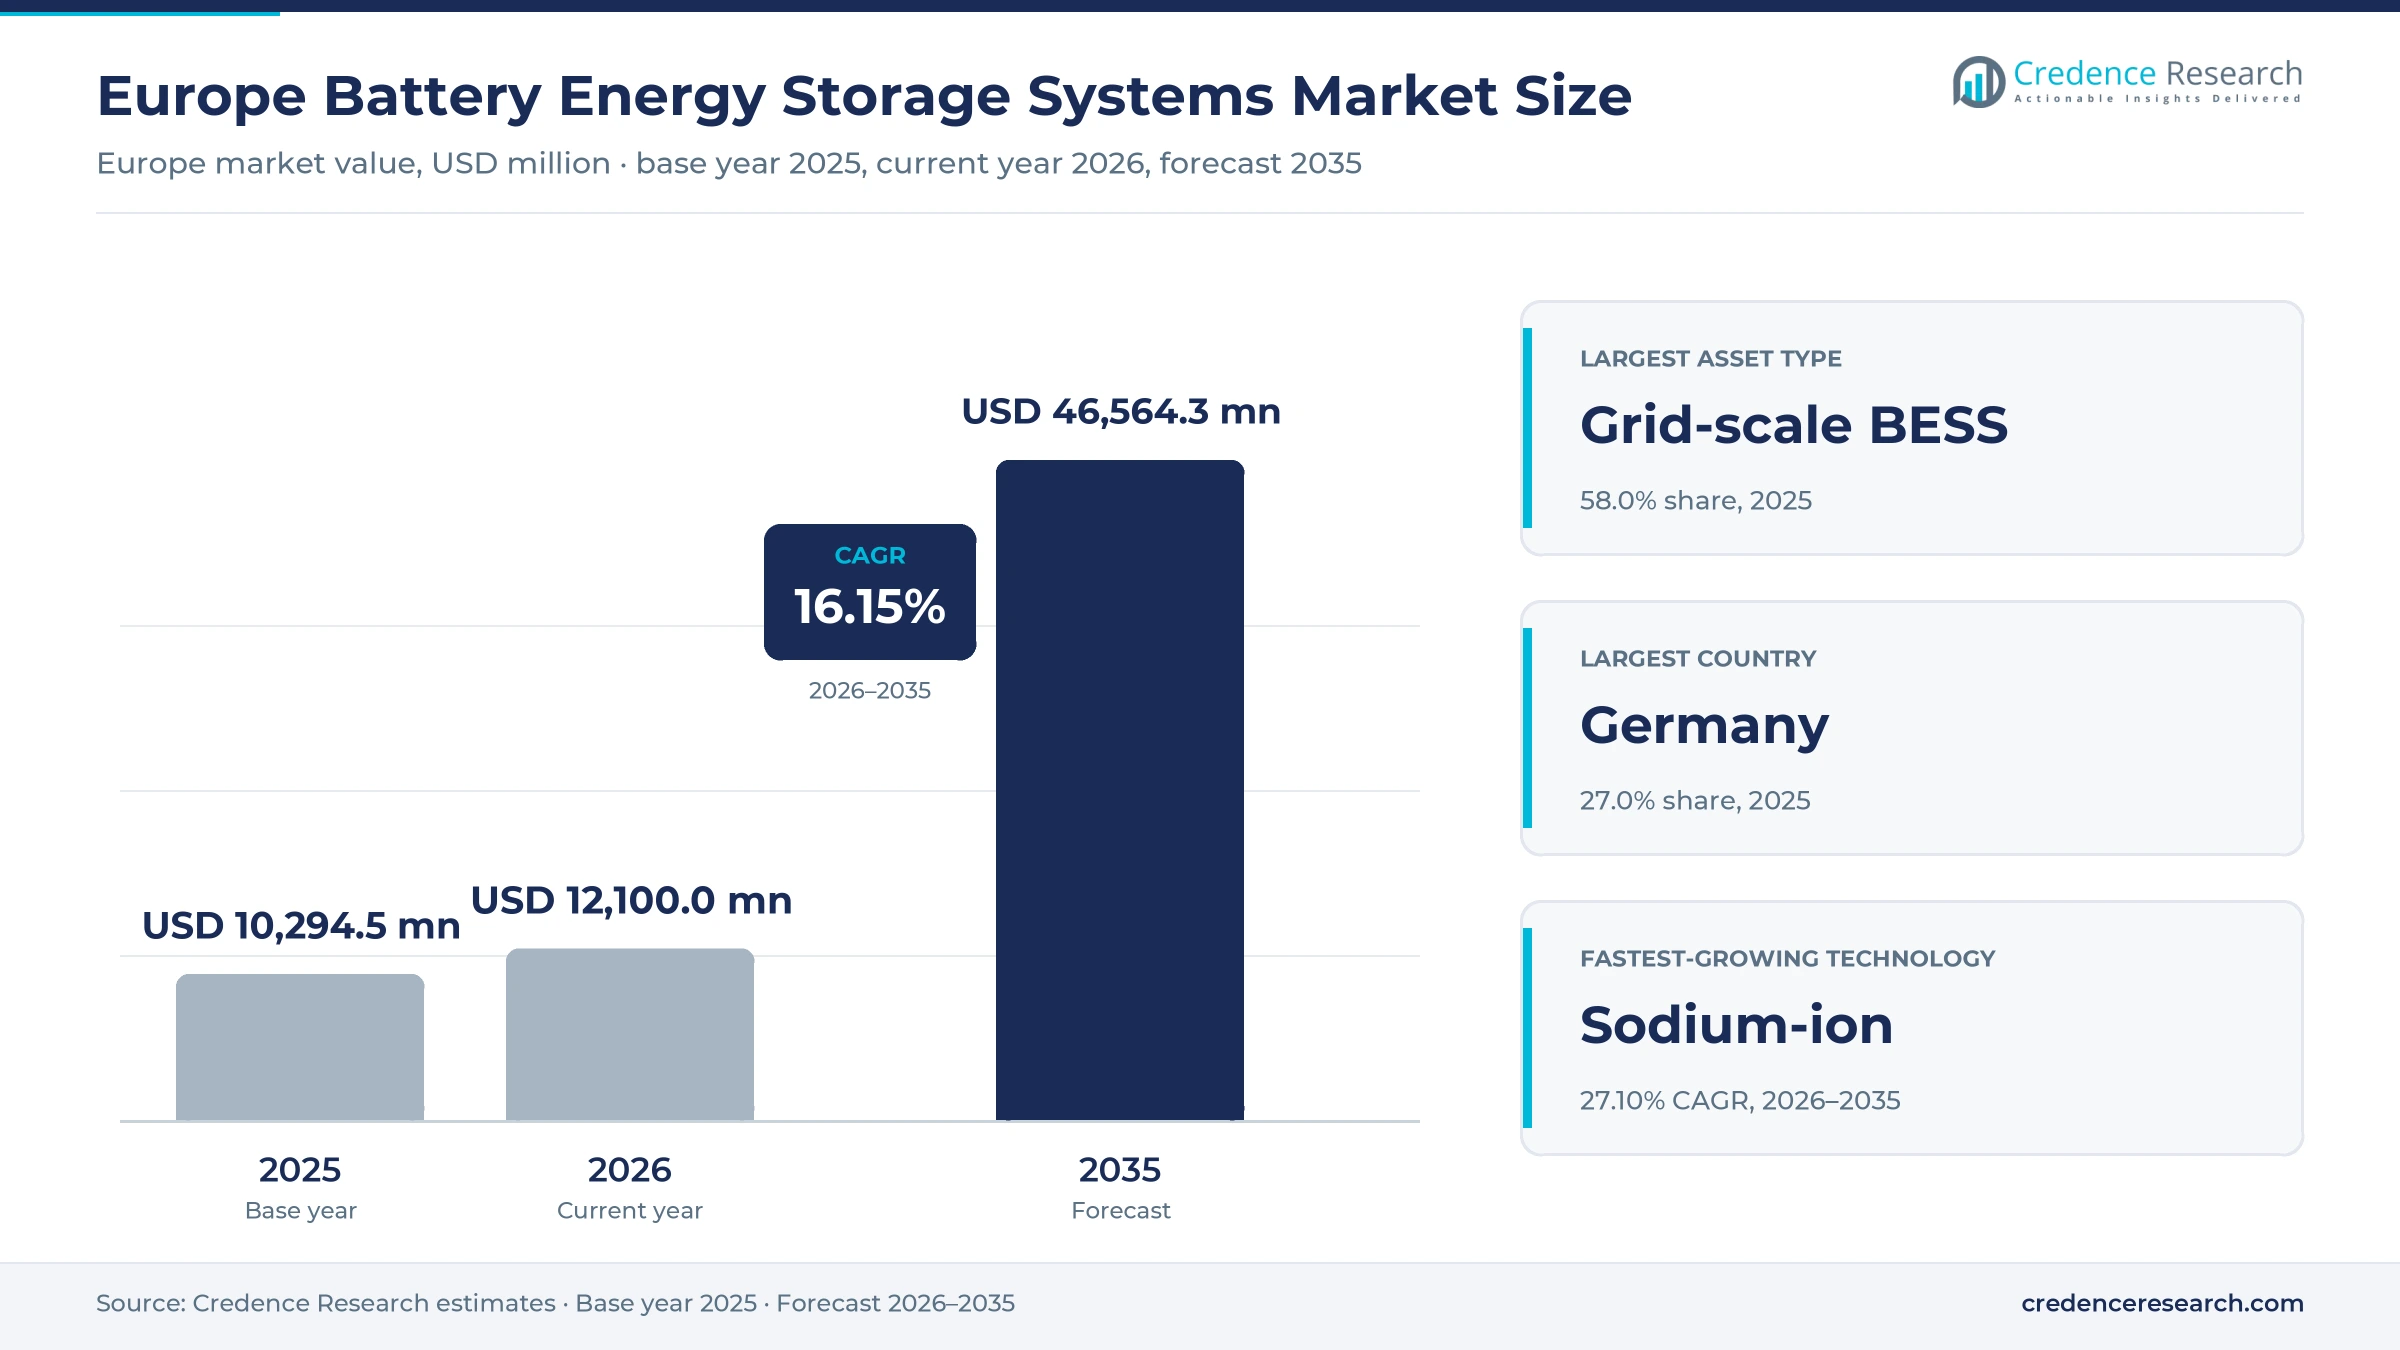
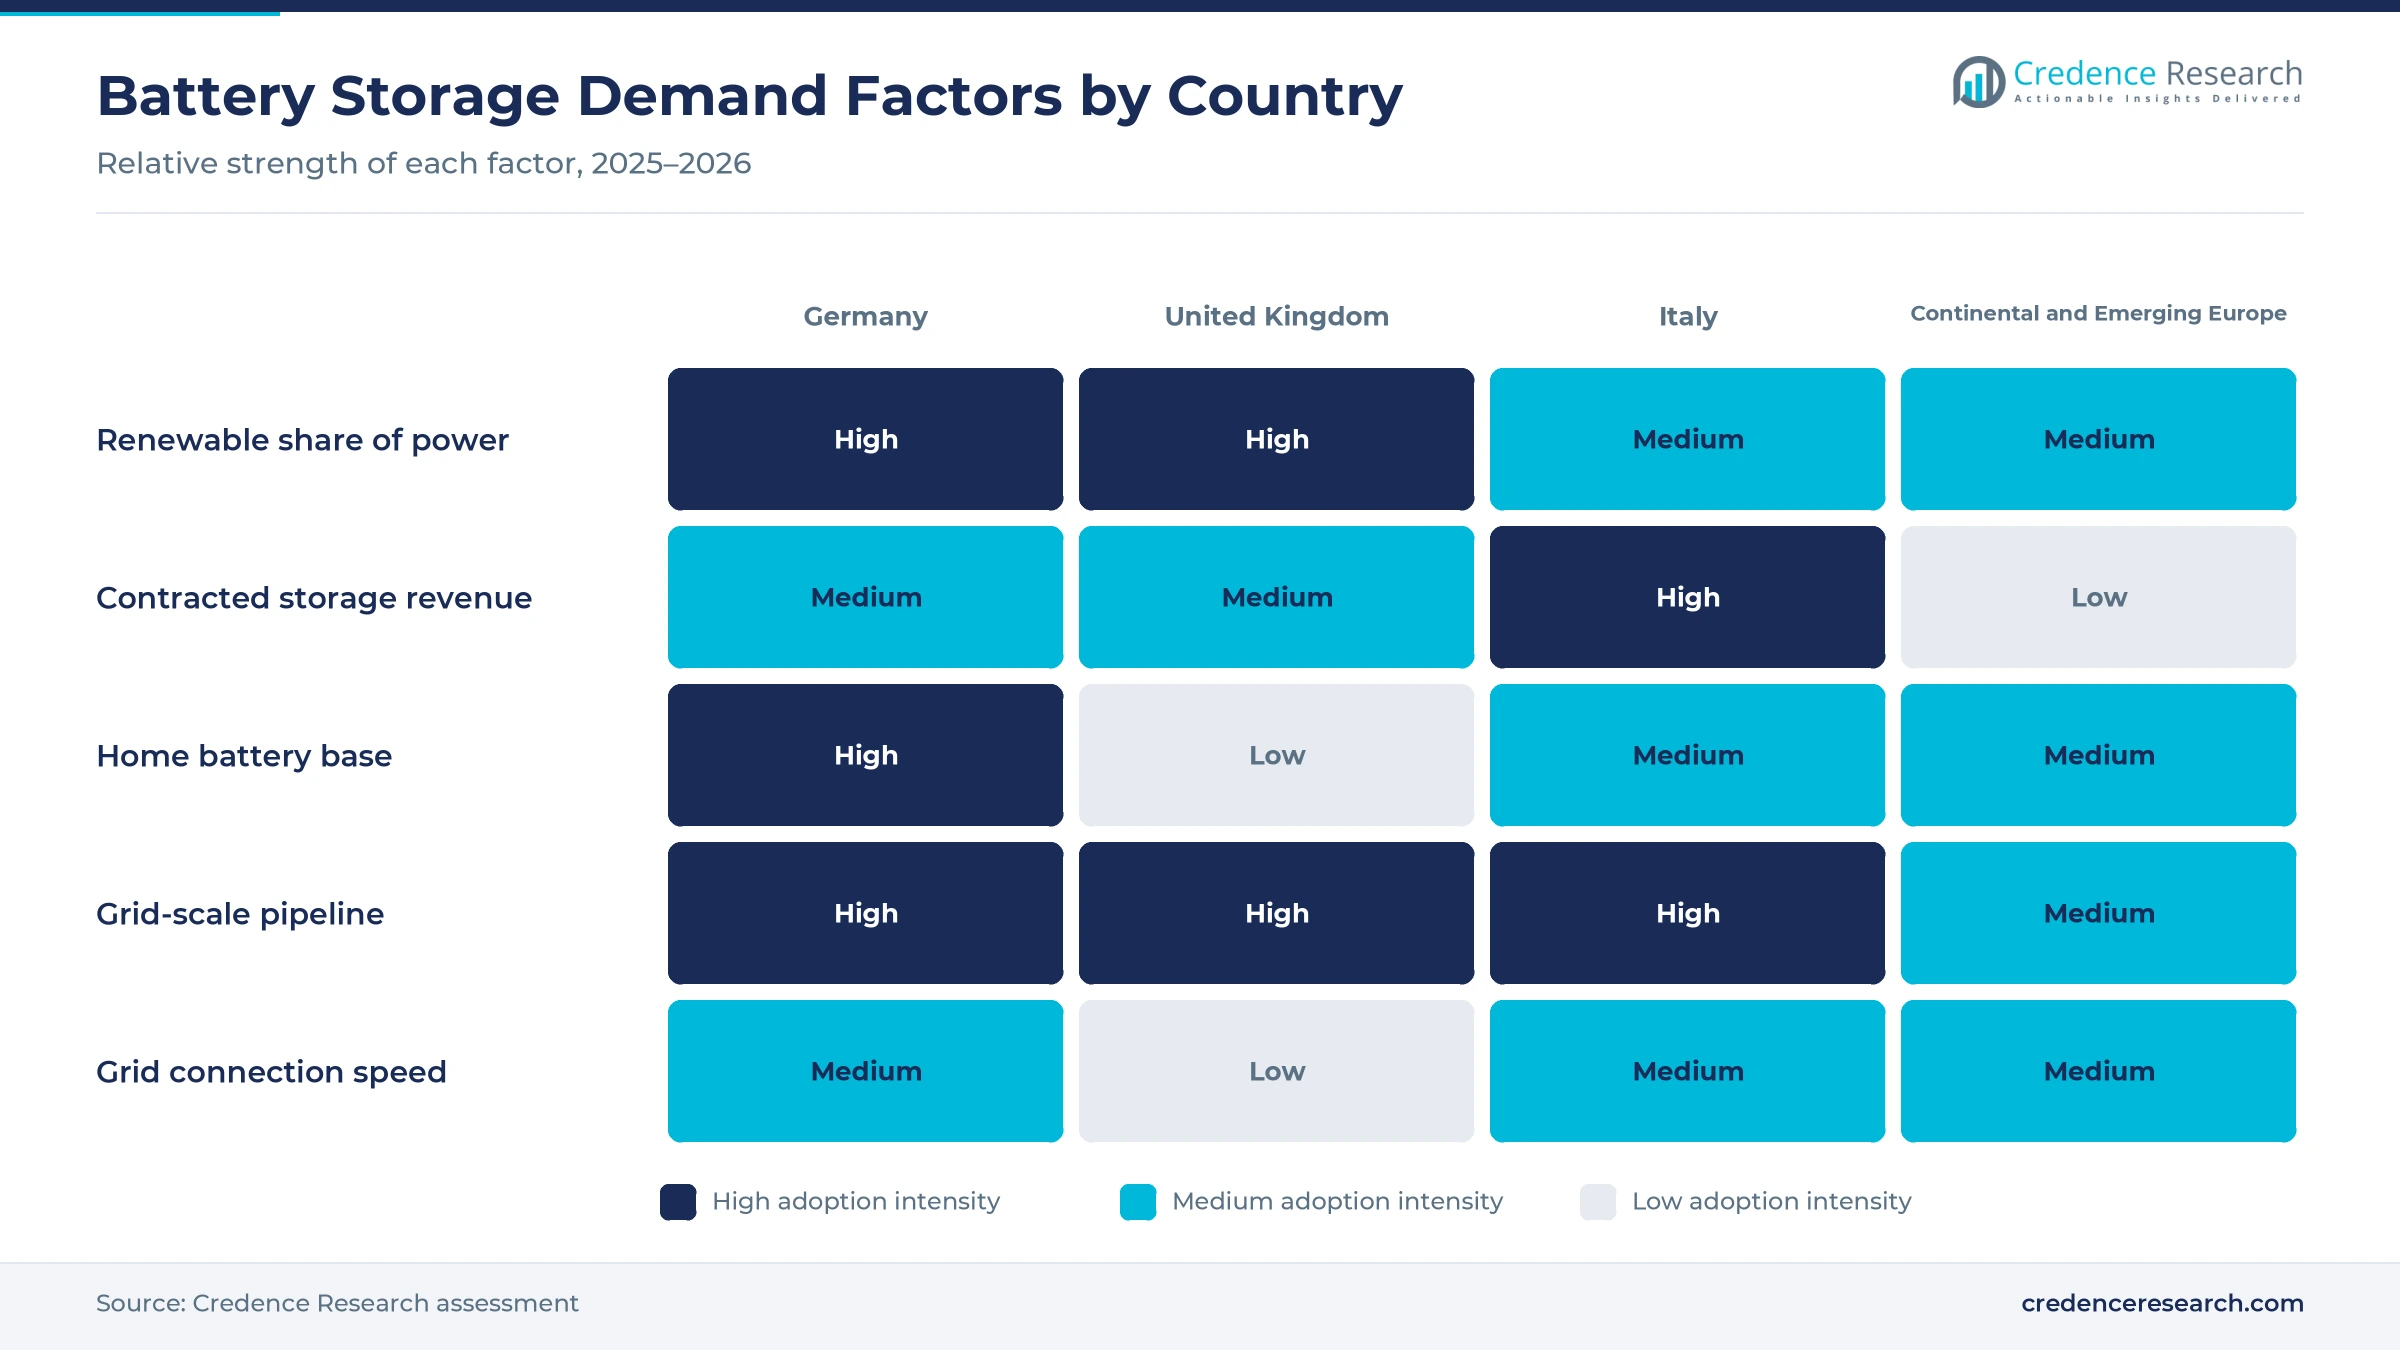
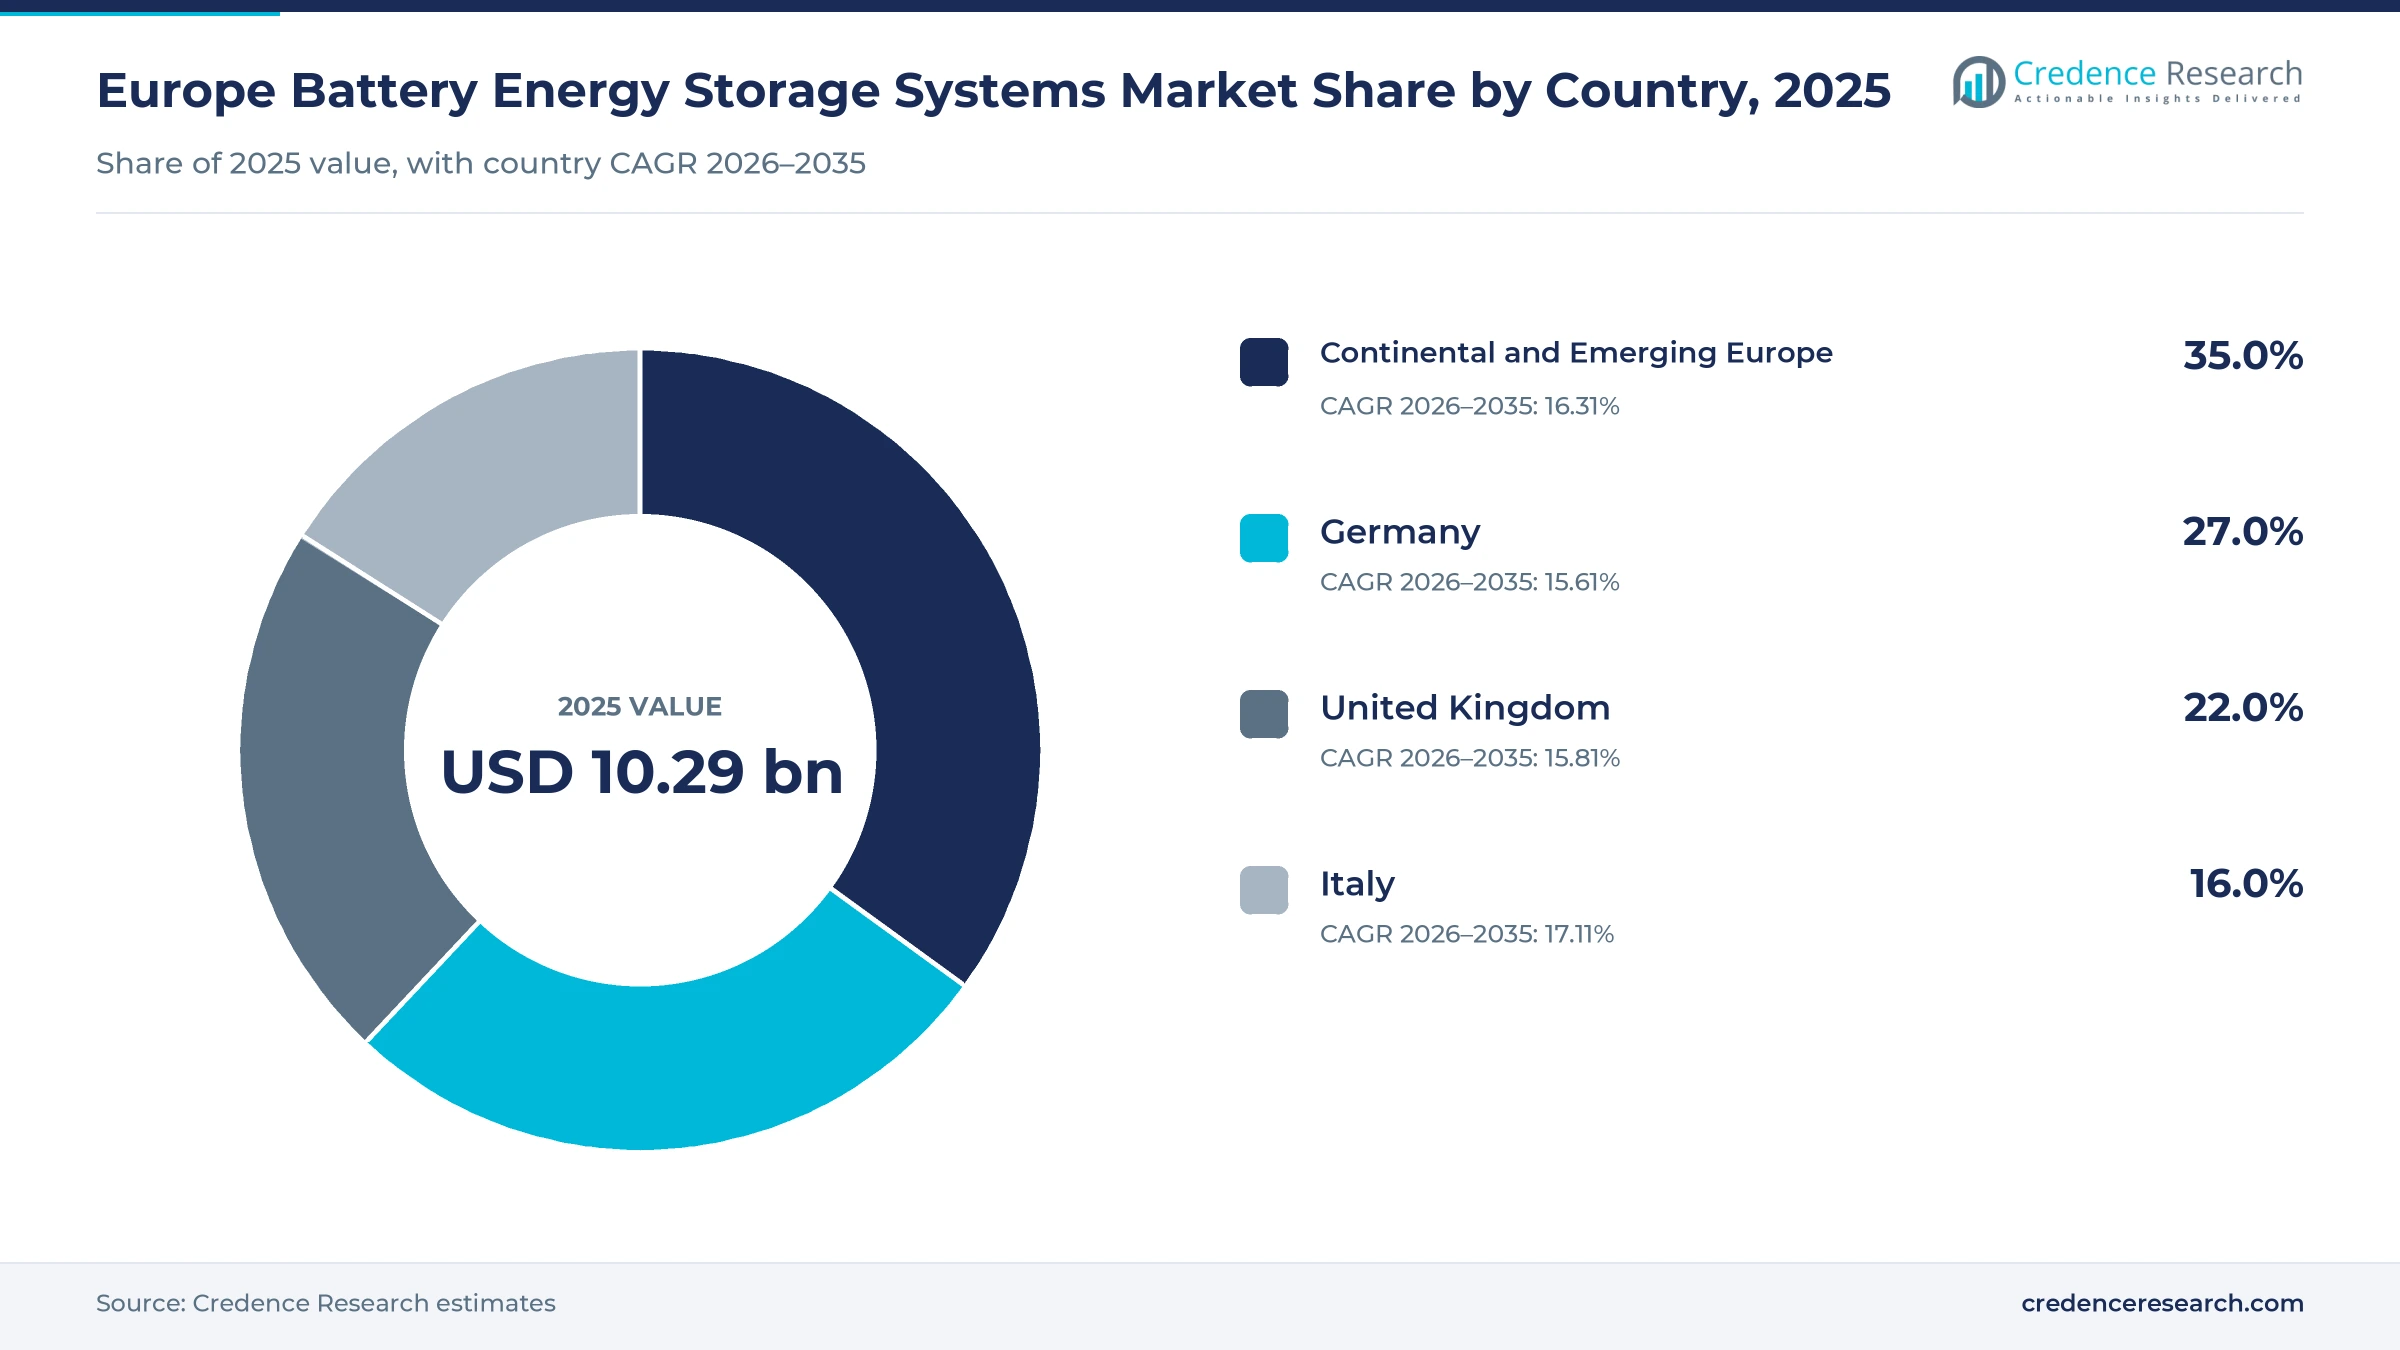
The Europe battery energy storage systems market was valued at USD 10.29 billion in 2025 and is projected to increase from USD 12.10 billion in 2026 to USD 46.56 billion by 2035, registering a CAGR of 16.15% during 2026–2035. Demand comes from utilities, independent power producers, companies and households that need to shift solar and wind output into evening peaks and earn revenue from balancing services. Germany held the largest country share, 27.0% in 2025, because its large home battery base now sits alongside a growing pipeline of utility projects. Italy is the fastest-growing country at 17.11% a year, as long-term capacity contracts awarded by its grid operator secure revenue for new grid-scale sites. In turn, the reformed European electricity market rules recognize storage as a flexibility resource, so developers can combine wholesale trading, capacity payments and ancillary services within one business case.
Which battery installations and buyers does the estimate count?
The estimate measures spending across Europe on new stationary battery energy storage systems, including grid-scale, commercial and industrial, residential and community or microgrid installations. It counts battery racks, power conversion, energy management software, integration and commissioning for lithium-ion, flow, sodium-ion and advanced lead-acid systems. Values are stated in USD million at current prices and cover standalone sites as well as batteries paired with solar, wind or several generation assets.
The estimate excludes electric vehicle batteries, pumped hydro, thermal storage and hydrogen storage, as well as land, grid reinforcement and long-term operating revenue. The value chain runs from cell makers and system integrators through engineering contractors and developers to the utilities, investors, companies and households that own and operate the assets.
Europe Battery Energy Storage Systems Market Insights
- The Europe battery energy storage systems market was valued at USD 10.29 billion in 2025 and is projected to reach USD 46.56 billion by 2035, at a 16.15% CAGR during 2026–2035.
- Germany held a 27.0% share of 2025 value, because it combines the largest home battery base in Europe with fast utility project growth.
- Grid-scale BESS led asset types with a 58.0% share of 2025 value, as utility-scale projects delivered more than half of new European capacity.
- Italy awarded storage capacity in its first long-term MACSE auction on Sept. 30, 2025, setting a model for contracted battery revenue.
- Sodium-ion systems grow fastest among technologies at 27.10% a year during 2026–2035, as suppliers sign the first large European orders.
Grid-scale units lead while sodium-ion gains fastest
Why do grid-scale batteries hold the largest share?
Based on asset type, the market is categorized into grid-scale BESS, commercial and industrial BESS, residential BESS and community and microgrid BESS. Grid-Scale BESS led with a 58.0% share of 2025 value, because utilities and developers now build sites of 100 MWh and more. Commercial and Industrial BESS grows fastest at 17.07% a year, as factories use batteries to cut peak charges.
How long will lithium-ion keep its lead?
Based on technology, the market is categorized into lithium-ion, flow batteries, sodium-ion and advanced lead-acid systems. Lithium-Ion led with a 93.0% share of 2025 value, because lithium iron phosphate packs offer proven safety, density and supply depth. Sodium-Ion grows fastest at 27.10% a year from a small base, as large suppliers launch containerized sodium products.
Which owners account for most battery spending?
Based on end-use sector, the market is categorized into utilities and independent power producers, commercial and industrial enterprises, data centers and critical infrastructure, and residential prosumers. Utilities and Independent Power Producers led with a 57.0% share of 2025 value, because they own most grid-scale sites. Data Centers and Critical Infrastructure grows fastest at 18.30% a year, as operators replace diesel backup with batteries.
Are standalone sites or hybrid plants winning more capacity?
Based on project type, the market is categorized into standalone BESS, solar-plus-storage, wind-plus-storage and multi-asset hybrid systems. Standalone BESS led with a 52.0% share of 2025 value, because grid-connected sites can trade freely across balancing and wholesale markets. Multi-Asset Hybrid Systems grow fastest at 17.23% a year, as owners share one connection across several assets.
| Segment Group | Leading Sub-segment | Share, 2025 | Fastest-growing Sub-segment | CAGR, 2026–2035 |
|---|---|---|---|---|
| By Asset Type | Grid-Scale BESS | 58.0% | Commercial and Industrial BESS | 17.07% |
| By Technology | Lithium-Ion | 93.0% | Sodium-Ion | 27.10% |
| By End-Use Sector | Utilities and Independent Power Producers | 57.0% | Data Centers and Critical Infrastructure | 18.30% |
| By Project Type | Standalone BESS | 52.0% | Multi-Asset Hybrid Systems | 17.23% |
Request a Free Sample
Fill in your details and we'll send you a free sample report.
- Sample data tables & charts
- Research methodology
Flexibility needs, lower prices and market rules lift demand
How does renewable growth raise demand for flexibility?
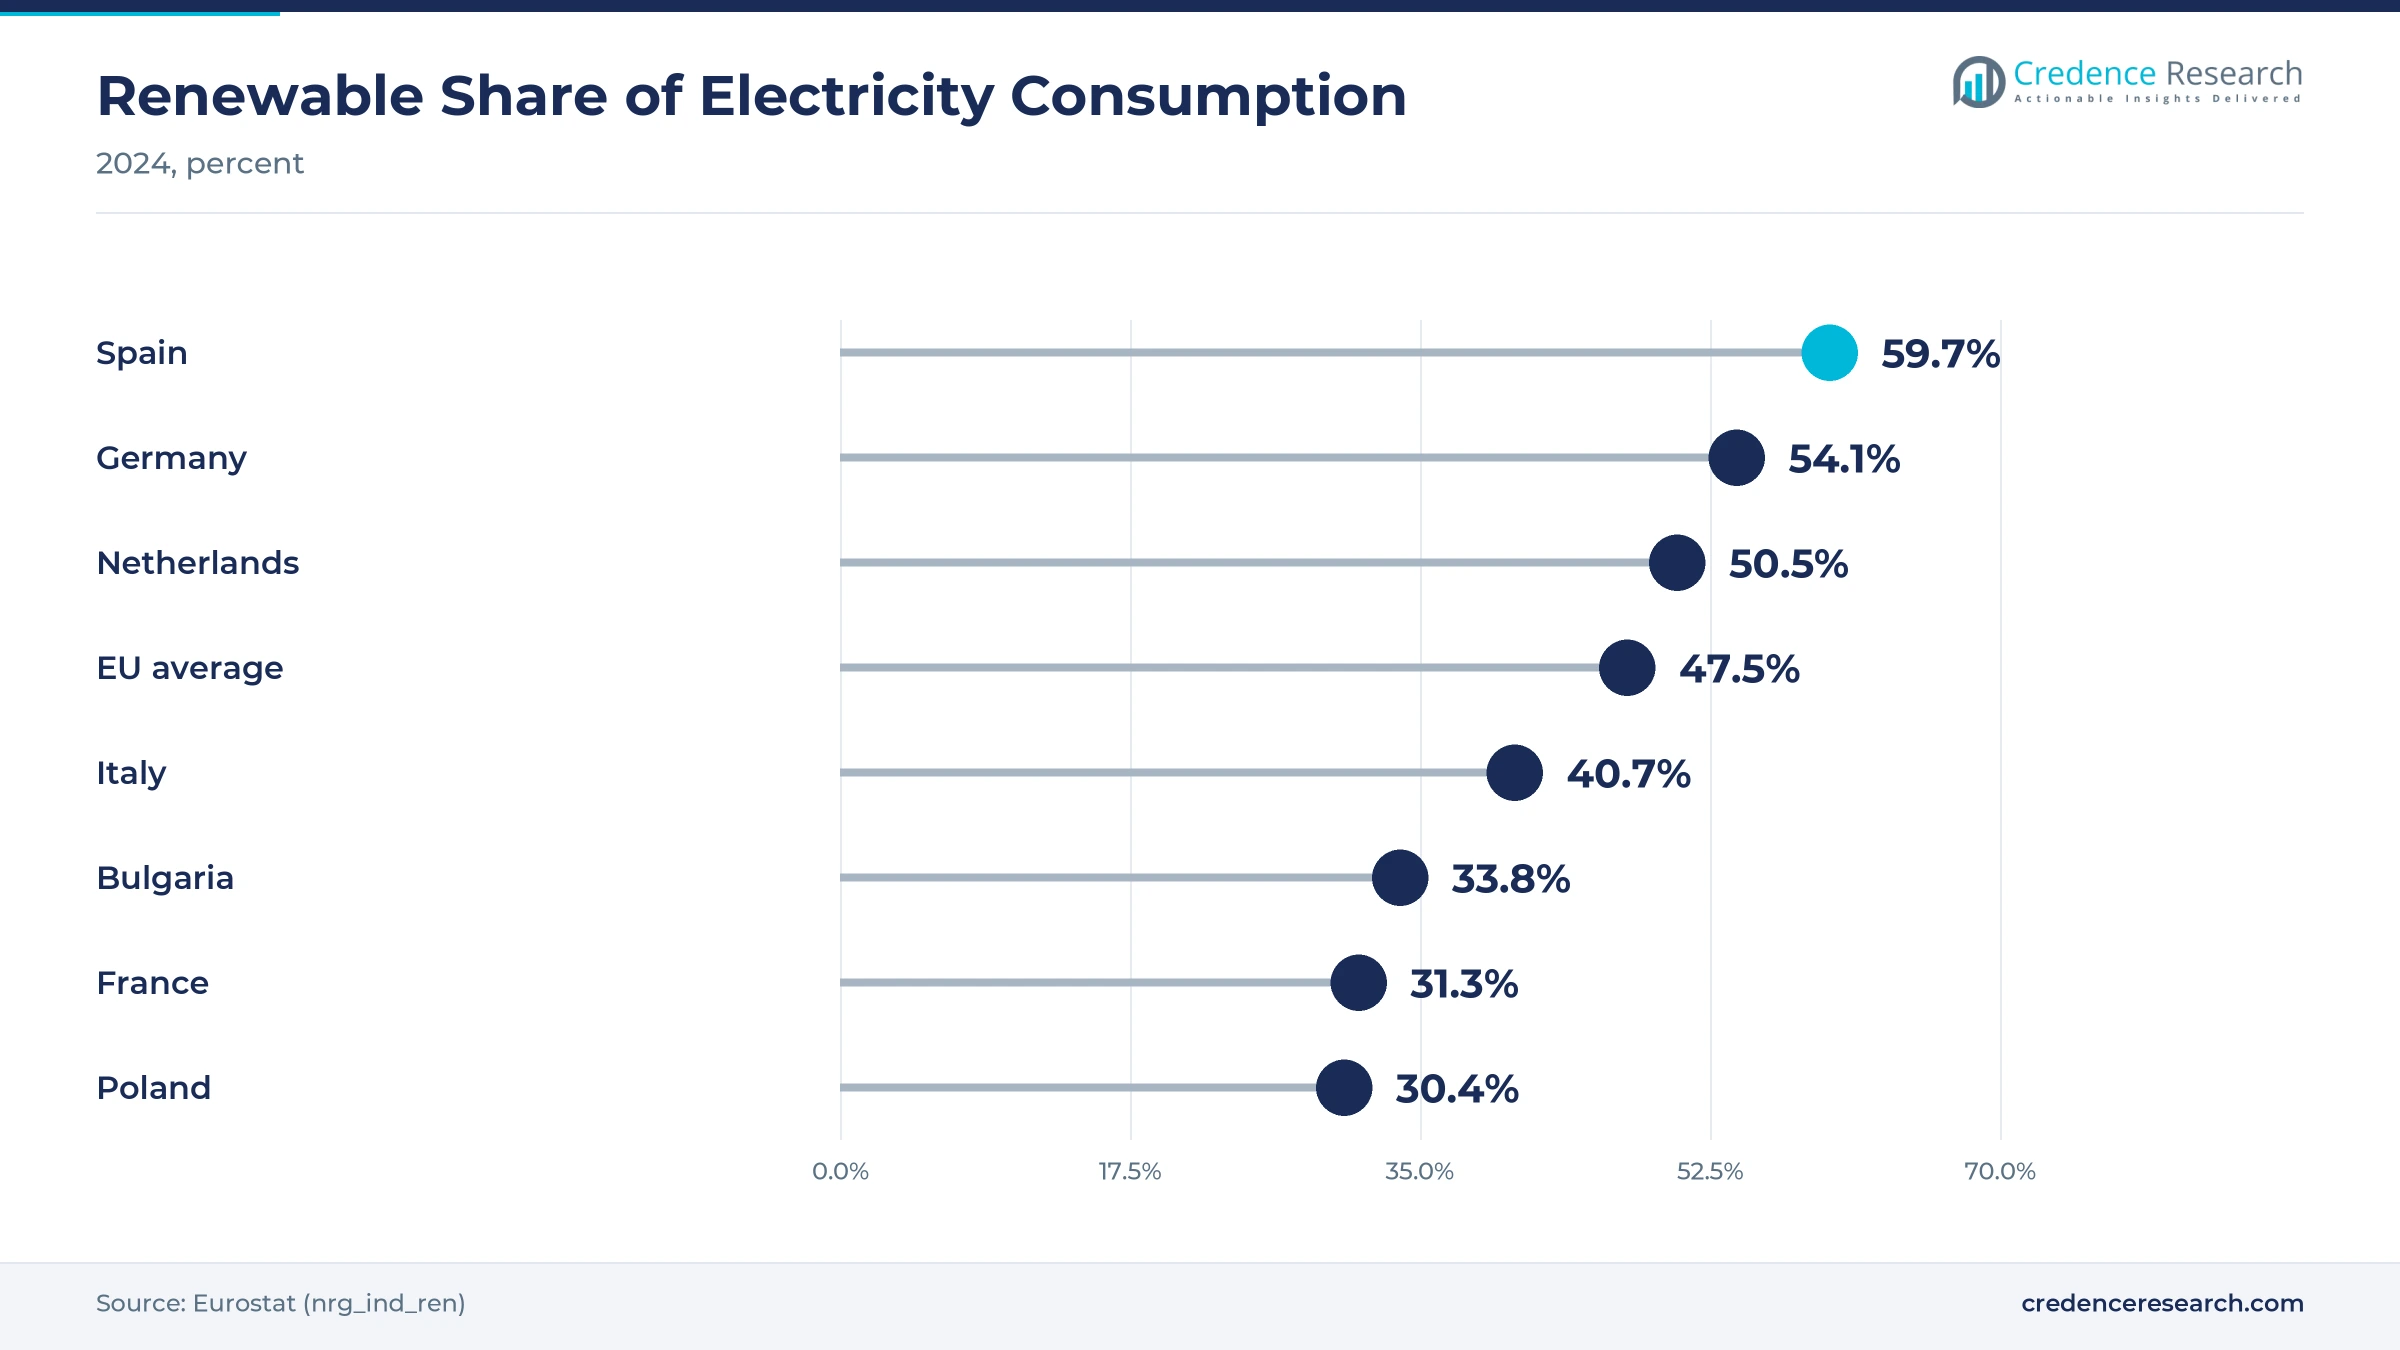
Renewable growth raises demand for flexibility, because solar and wind output does not follow evening demand peaks. Renewable sources supplied 46.9% of net electricity generated in the European Union in 2024, and wind and solar made up 39.1% and 22.4% of that renewable output, according to Eurostat. The British government expects 23 to 27 GW of battery capacity to be needed by 2030, alongside 4 to 6 GW of long-duration storage, under its Clean Power 2030 Action Plan. As a result, utilities and independent power producers held a 57.0% share of 2025 value as they add batteries beside new solar parks and growing offshore wind capacity in the North Sea.
Why do falling system prices widen the business case?
Falling system prices widen the business case, because cheaper batteries let projects clear auctions and merchant markets at lower revenue. Italy awarded capacity in its first MACSE auction at an average of 12,959 euros per MWh a year, far below the 37,000-euro reserve price, according to trade press reports. Europe installed 36 GWh of new battery capacity in 2025, up 48% from 2024, and total operational capacity passed 100 GWh for the first time. Sungrow now supplies full packages with batteries, converters, medium-voltage equipment and commissioning for Italian solar plants. Consequently, developers can now justify sites that would not have cleared auctions or merchant markets a few years ago.
How does market reform recognize storage revenue?
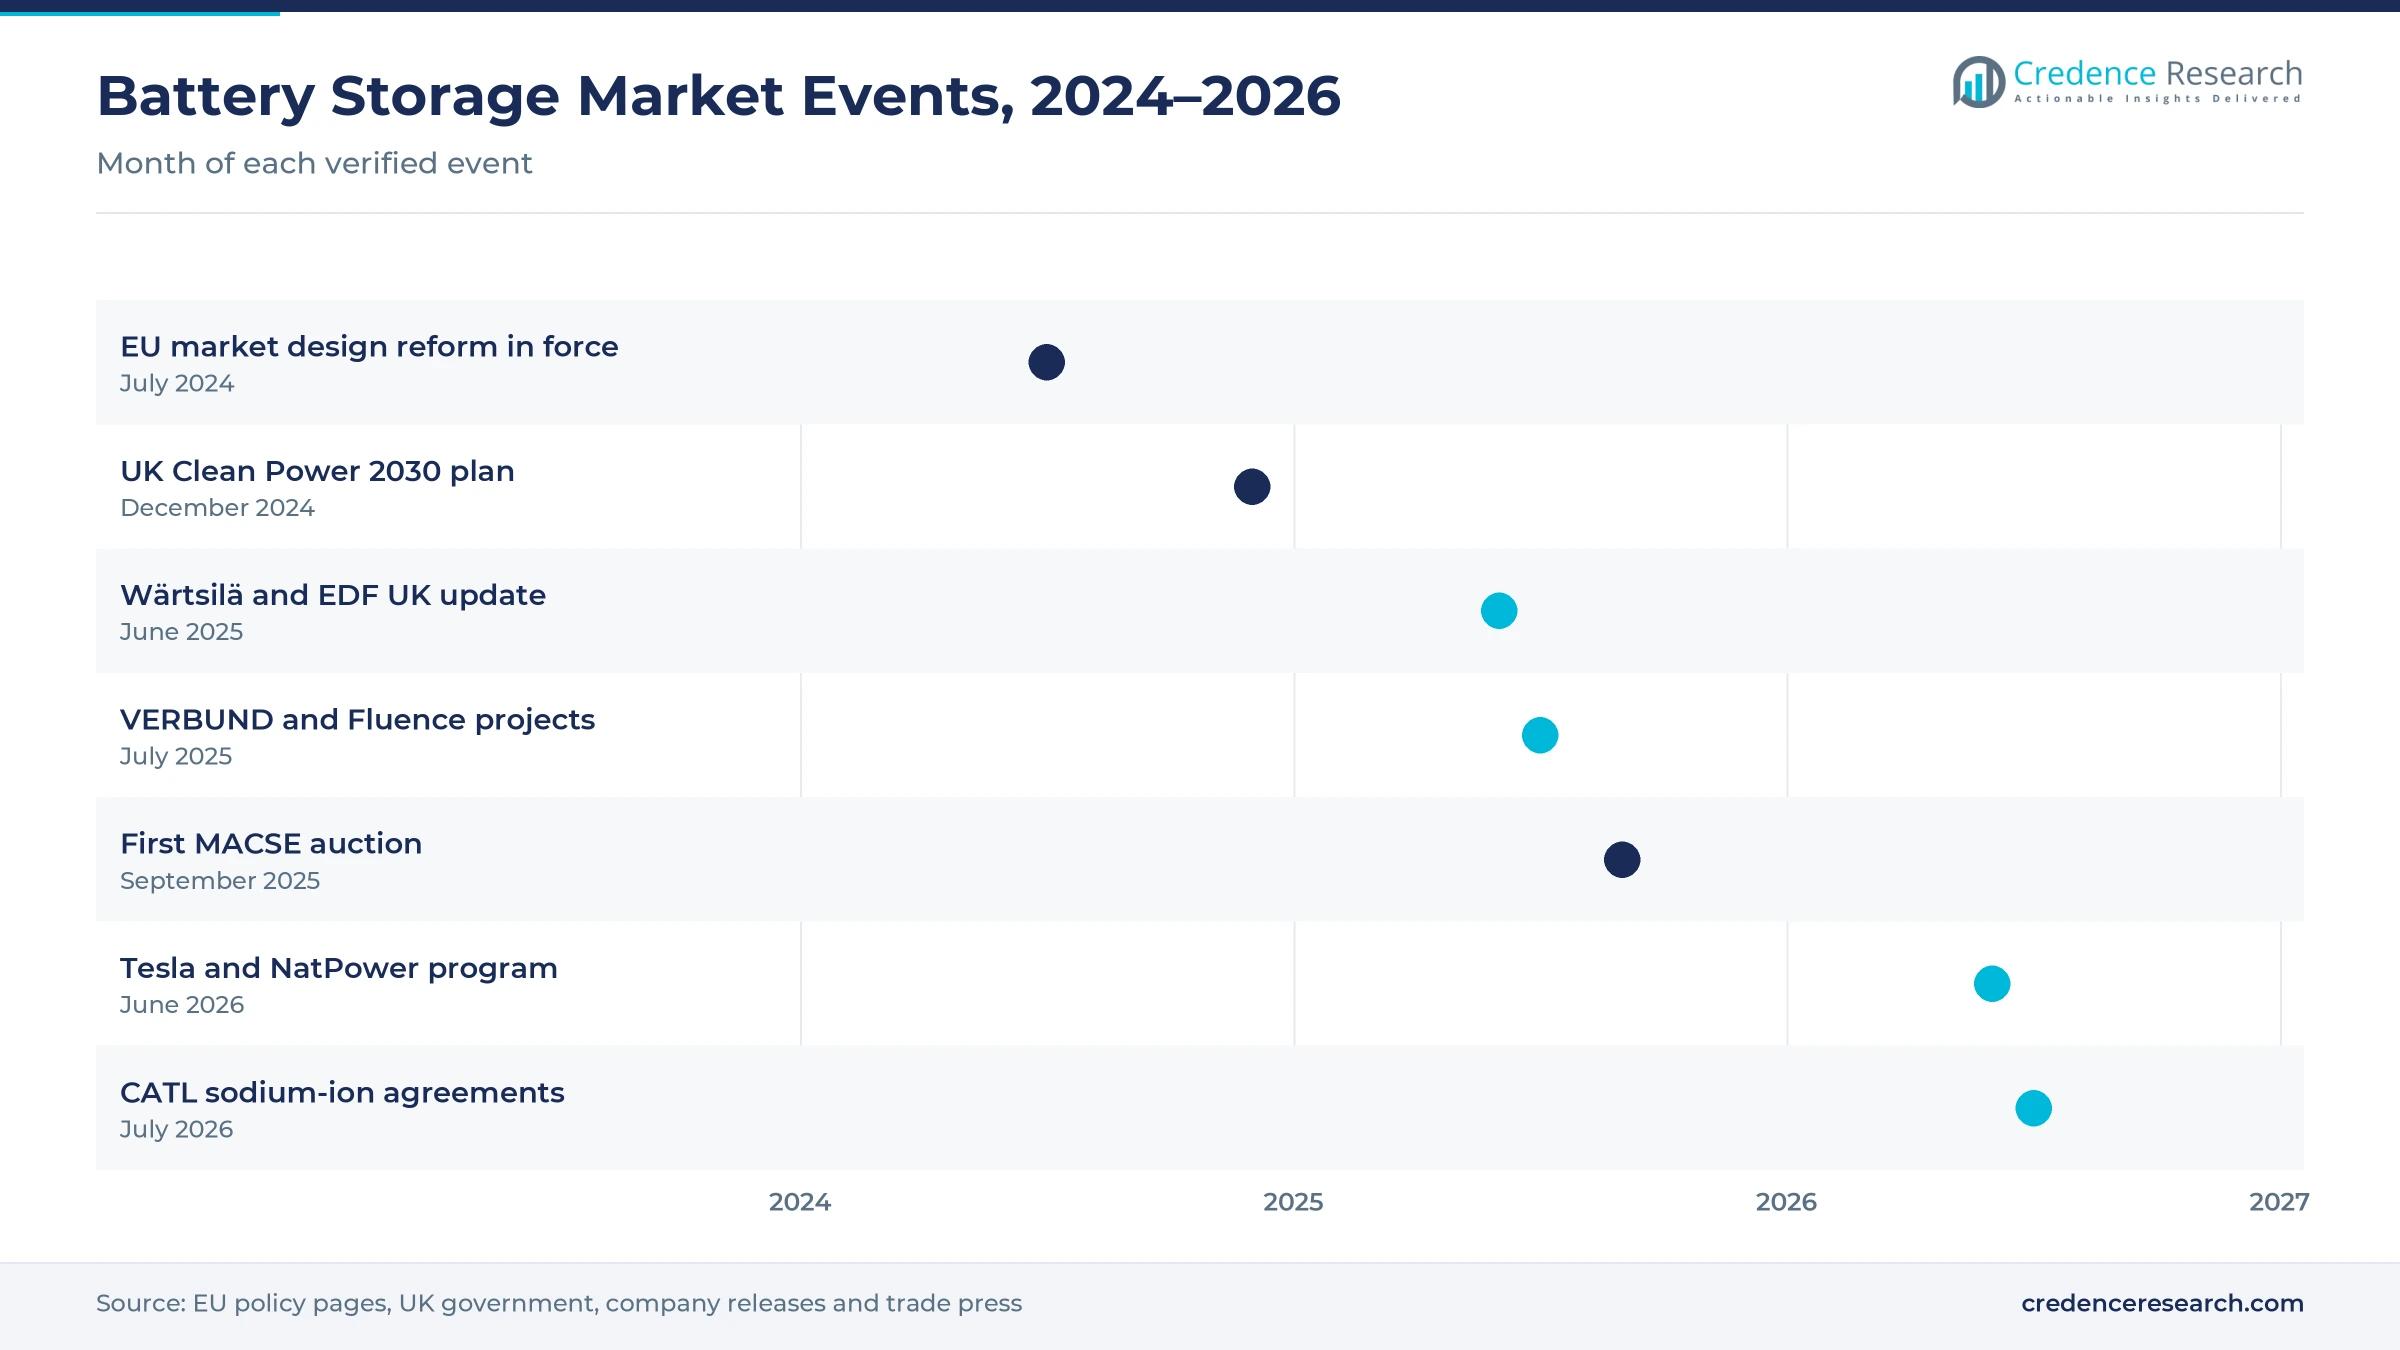
Market reform recognizes storage revenue, because European rules now treat batteries as a source of fossil-free flexibility rather than as generators or consumers. The reformed European electricity market design entered into force on July 16, 2024, and member states had until Jan. 17, 2025, to transpose it into national law. Italy held its first auction under the MACSE scheme on Sept. 30, 2025, and awarded all 10 GWh on offer for systems due to operate in 2028. Britain also plans a fivefold rise in battery capacity by 2030. In turn, contracted revenue lowers financing costs and lets lenders support larger Italian sites.
Why do large utility orders sustain spending?
Large utility orders sustain spending, because utilities now buy batteries in portfolios rather than as single pilot sites. VERBUND and Fluence launched two German projects with more than 92 MW and 186 MWh in July 2025, including a 50 MW, 100 MWh site in Rhineland-Palatinate. Wärtsilä and EDF Renewables reported 404.5 MW and 709 MWh across eight British sites in June 2025, with six already operating. Vattenfall also awarded Fluence a 254 MW, 1,000 MWh four-hour project at Brunsbüttel in October 2026, with grid connection planned for late 2028. As a result, standalone BESS led project types with a 52.0% share of 2025 value.
Utility-scale and longer duration reshape project design
Why is the shift to utility-scale sites gathering pace?
The shift to utility-scale sites is gathering pace, because large projects earn more from balancing and wholesale markets than home systems earn from self-consumption. Utility-scale projects delivered more than half of new European installations in 2025 for the first time, according to SolarPower Europe, while residential demand remained subdued. Germany added about 6.57 GWh in 2025, yet home additions fell 6.4% to 4.19 GWh, according to Battery Charts data. Britain energized a record 2.3 GW of grid-scale batteries in 2025, taking capacity to 7.5 GW. Consequently, residential BESS loses share as Commercial and Industrial BESS and grid-scale units gain value across most European countries.
How is the rise of longer-duration systems changing design?
The rise of longer-duration systems is changing design, because evening peaks and solar surpluses now last longer than one hour. British government statistics show that average discharge duration for grid-scale batteries has moved above one hour and is still rising. Vattenfall chose a four-hour design for its Brunsbüttel project, storing 1,000 MWh behind a 254 MW connection. VERBUND and Fluence also chose two-hour systems for both German sites announced in July 2025. In turn, buyers now compare battery fleets with long-duration flexibility assets such as pumped hydro when they plan new capacity for the next decade.
Can sodium-ion chemistry open a new supply option?
Sodium-ion chemistry opens a new supply option, because it avoids lithium and performs well in cold weather and long cycling duty. CATL signed a memorandum of understanding with Alfen on July 16, 2026, for 5 GWh of Tener Sodium systems in the Netherlands and other western European countries from 2027. CATL then agreed on July 21, 2026, to deploy 2 GWh with Solarpro in central and eastern Europe. Each Tener Sodium unit stores more than 30 MWh and offers one to eight hours of duration. As a result, sodium-ion systems grow fastest among technologies at 27.10% a year, drawing on a wider base of sodium-ion cell supply.
Where do hybrid solar sites create an opening?
Hybrid solar sites create an opening, because operating solar plants already hold grid connections that can carry battery output. Sungrow agreed to supply 240 MWh of batteries for two operating solar plants of 45 MW and 53 MW in Viterbo, Lazio, owned by independent producer BNZ. Tesla agreed in June 2026 to supply more than 25 GWh of Megapack systems to NatPower for five projects in Italy and the United Kingdom. Multi-asset hybrid systems grow fastest among project types at 17.23% a year. Consequently, owners of distributed solar generation can add batteries without waiting several years for new transmission connections.
Grid queues, revenue risk and supply exposure slow builds
How do grid connection queues delay projects?
Grid connection queues delay projects, because transmission operators hold far more applications than they can connect each year. Developers with financed projects can wait several years for a connection date. As a result, equipment orders slip and some sites lose their planned revenue windows. Operators respond with queue reforms, flexible connection offers and co-location at existing solar or wind plants. However, these reforms take time to clear older applications that block viable projects.
Why does merchant revenue risk worry lenders?
Merchant revenue risk worries lenders, because balancing prices fall as more batteries compete for the same services. Projects that rely only on trading spreads can miss forecast returns within a few years. Consequently, banks ask for higher equity shares or contracted income before they lend. Developers respond with tolling agreements, capacity contracts and optimization services that share price risk. In turn, contracted income often lowers the expected upside for equity investors.
What supply chain exposure do buyers face?
Buyers face supply chain exposure, because most battery cells used in Europe come from a few Asian manufacturers. Trade measures, shipping delays or price swings can raise project costs at short notice. In turn, some buyers diversify suppliers or wait for European cell plants to scale up. Integrators respond with longer framework agreements and second-source qualification of alternative cells. As a result, new chemistries such as sodium-ion also gain attention from cautious buyers.
Can permitting and fire rules slow local approvals?
Permitting and fire rules can slow local approvals, because residents and councils raise safety concerns about large lithium-ion sites. Planning authorities may ask for extra spacing, water supplies and emergency plans. As a result, approval times vary widely between countries and regions. Suppliers respond with tested container designs, gas detection and early engagement with local fire services. Consequently, clear national safety guidance could shorten approval times for future sites.
Germany leads while Italy adds capacity fastest
| Country | Value, 2025 (USD billion) | Share, 2025 | CAGR, 2026–2035 |
|---|---|---|---|
| Continental and Emerging Europe | 3.60 | 35.0% | 16.31% |
| Germany | 2.78 | 27.0% | 15.61% |
| United Kingdom | 2.26 | 22.0% | 15.81% |
| Italy | 1.65 | 16.0% | 17.11% |
A large home base and new utility sites keep Germany ahead
Germany held a 27.0% share of 2025 value and grows at 15.61% a year. The country had about 24 GWh of stationary battery capacity at the end of 2025, much of it in home systems paired with rooftop solar. Utility projects are now catching up, with VERBUND and Fluence building in Rhineland-Palatinate and Saxony and Vattenfall planning a 1,000 MWh site at Brunsbüttel. However, slower home sales mean growth shifts toward grid-scale and commercial sites.
Clean power targets support the United Kingdom
The United Kingdom held a 22.0% share of 2025 value and grows at 15.81% a year. Grid-scale battery power capacity reached 7.5 GW in 2025 after a record year of new connections, and the government plans for 23 to 27 GW by 2030. Wärtsilä and EDF Renewables operate or build eight sites across England. As a result, Britain remains the most mature merchant battery market in Europe.
Why does Italy grow fastest?
Italy held a 16.0% share of 2025 value and grows fastest at 17.11% a year. Its first MACSE auction in September 2025 awarded long-term contracts for systems due to operate in 2028, giving developers revenue certainty that merchant markets cannot. Sungrow is supplying batteries for solar plants in Lazio, and Tesla plans Megapack deliveries to NatPower projects in Italy. In turn, Italy moves from a home battery market to a grid-scale leader.
Emerging markets broaden demand across the continent
Continental and emerging Europe held a 35.0% share of 2025 value and grows at 16.31% a year. Ukraine and Bulgaria entered the five largest European markets in 2025, as batteries supported grid resilience and solar integration. CATL and Solarpro plan sodium-ion systems in central and eastern Europe, while Alfen builds Dutch projects. Consequently, demand now spreads well beyond the three largest countries in the region.
Auctions, orders and supply deals, 2024–2026
| Development | Status and market relevance |
|---|---|
| In July 2024, the reformed European electricity market design entered into force, recognizing storage as fossil-free flexibility. | Sets the rules for storage revenue |
| In July 2025, VERBUND and Fluence launched two German projects with more than 92 MW and 186 MWh. | Adds utility capacity in Germany |
| In September 2025, Italy held its first MACSE auction and awarded all capacity on offer for 2028 delivery. | Creates long-term contracted revenue |
| In June 2026, Tesla agreed to supply more than 25 GWh of Megapack systems to NatPower in Italy and the United Kingdom. | Largest announced supply program |
| In July 2026, CATL signed a memorandum of understanding with Alfen for 5 GWh of sodium-ion systems. | Brings sodium-ion to western Europe |
Lithium-ion leads while new chemistries enter
- Lithium-ion systems dominate new projects because lithium iron phosphate cells offer high efficiency, long life and a deep supplier base.
- Flow batteries store energy in liquid electrolytes, which allows long duration and very long cycle life at sites with space.
- Sodium-ion systems use abundant materials and handle cold weather well, although commercial units are only now entering Europe.
- Advanced lead-acid systems remain in backup and small off-grid uses, because they are cheap upfront but heavier and shorter-lived.
Need a Custom Version of This Report?
Tailor the scope, geography, or segments to your exact requirements.
- Custom geography or segment scope
- Direct access to our analyst team
Integrators and cell makers compete on bankability
Competition runs between cell makers that sell integrated containers and system integrators that combine cells, converters and software. Fluence supplies utility projects in Germany for VERBUND and Vattenfall, while Wärtsilä delivers and services a portfolio of British sites for EDF Renewables. Tesla sells Megapack systems and agreed a large supply program with NatPower for Italy and the United Kingdom. Sungrow supplies full packages to solar owners in Italy, and CATL is bringing sodium-ion products to Europe through Alfen and Solarpro. Owners often split orders between a cell supplier and a separate integrator to reduce risk. Suppliers compete on bankability, warranties, safety records, software that maximizes trading revenue and long-term service rather than on hardware price alone, because lenders review supplier strength before they finance a project, and several also supply grid-connected assets worldwide.
Which suppliers have verified European battery activity?
| Company | Type | Role in the market |
|---|---|---|
| Fluence Energy | System integrator | VERBUND projects in Germany, July 2025, and Vattenfall Brunsbüttel award |
| Wärtsilä Energy Storage | System integrator | 404.5 MW across eight British sites with EDF Renewables |
| Tesla | Integrated supplier | Megapack supply program with NatPower for Italy and the United Kingdom |
| Sungrow | Integrated supplier | 240 MWh for solar plants in Lazio, Italy |
| CATL | Cell and system maker | Sodium-ion agreements with Alfen and Solarpro, July 2026 |
| Alfen | Integrator and developer partner | Partner for 5 GWh of sodium-ion systems from 2027 |
Credence Research sees grid-scale assets dominating
Credence Research's view is that Europe battery storage spending will grow quickly through 2035, because renewable output keeps rising and market rules now pay for flexibility. Grid-scale assets should keep the largest share, while sodium-ion systems and multi-asset hybrid plants add value fastest from small bases. Germany will stay the largest country, although Italy gains share as contracted capacity comes online. However, grid queues and falling balancing prices will reward owners that secure contracts and suppliers that offer strong warranties.
Installed capacity, prices and pipelines anchor the model
The report uses 2025 as the base year, with values in USD million at current prices. Market values come from the Credence Research model, which combines installed capacity, annual additions, system prices by asset type and chemistry, and announced project pipelines. The four country groups follow the client brief, while their shares and growth rates and the splits by asset type, technology, end-use sector and project type are Credence Research estimates. Sources used are official statistics, European and national policy documents, industry association data, company announcements and trade press, and no interviews or surveys were used.
Flexibility markets shape battery fleets through 2035
The Europe battery energy storage systems market is expected to reach USD 46.56 billion by 2035, a 16.15% CAGR during 2026–2035, as flexibility needs grow with solar and wind output. Spending is projected to rise from USD 12.10 billion in 2026 as contracted capacity and utility portfolios move into construction. Growth should be strongest in Italy, sodium-ion systems and hybrid plants, while Germany keeps the largest country share. In contrast, slow grid connections and thinner merchant margins could delay some projects.
Frequently Asked Questions
How big is the Europe battery energy storage systems market?
Which country leads demand?
Which country grows fastest?
Which asset type holds the largest share?
Which technology grows fastest?
How do European rules affect battery owners?
Who are the leading companies in this market?
What are the main risks to growth?
Table of Content
Chapter 1 Market Segmentation
- 1.1 Segmentation Framework
- 1.1.1 Product and Service Classification
- 1.1.2 Application and End-Use Classification
- 1.1.3 Technology and Solution Classification
- 1.1.4 Customer and Distribution Channel Classification
- 1.1.5 Geographic Segmentation
- 1.1.6 Market Segment Definitions and Boundaries
- 1.2 By Asset Type
- 1.2.1 Grid-Scale BESS
- 1.2.2 Commercial and Industrial BESS
- 1.2.3 Residential BESS
- 1.2.4 Community and Microgrid BESS
- 1.3 By Technology
- 1.3.1 Lithium-Ion
- 1.3.2 Flow Batteries
- 1.3.3 Sodium-Ion
- 1.3.4 Advanced Lead-Acid
- 1.4 By End-Use Sector
- 1.4.1 Utilities and Independent Power Producers
- 1.4.2 Commercial and Industrial Enterprises
- 1.4.3 Data Centers and Critical Infrastructure
- 1.4.4 Residential Prosumers
- 1.5 By Project Type
- 1.5.1 Standalone BESS
- 1.5.2 Solar-Plus-Storage
- 1.5.3 Wind-Plus-Storage
- 1.5.4 Multi-Asset Hybrid Systems
- 1.6 By Country
- 1.6.1 Germany
- 1.6.2 United Kingdom
- 1.6.3 Italy
- 1.6.4 Continental and Emerging Europe
Chapter 2 Introduction
- 2.1 Report Objectives and Scope
- 2.2 Product Definition and Industry Terminology
- 2.3 Market Inclusions and Exclusions
- 2.4 Research Process
- 2.4.1 Primary Research and Expert Interviews
- 2.4.2 Secondary Research and Source Review
- 2.4.3 Top-Down and Bottom-Up Estimation
- 2.4.4 Data Triangulation and Verification
- 2.5 Market Size Measurement Basis
- 2.5.1 2025: USD 10.29 billion → 2035: USD 46.56 billion
- 2.6 Historical and Forecast Reference Periods
- 2.6.1 Historical Period: 2018-2025
- 2.6.2 Base Year: 2025
- 2.6.3 Forecast Period: 2025-2035
- 2.7 Research Assumptions and Limitations
Chapter 3 Executive Summary
- 3.1 Market Snapshot and Key Findings
- 3.2 Base-Year Market Size, 2025
- 3.3 Forecast Market Size, 2035
- 3.4 Revenue and Volume Growth Outlook
- 3.5 Key Demand and Supply Indicators
- 3.6 Leading Market Segments
- 3.7 Fastest-Growing Market Opportunities
- 3.8 Regional Performance Highlights
- 3.9 Technology and Industry Transformation
- 3.10 Competitive Landscape Summary
- 3.11 Analyst View and Strategic Implications
Chapter 4 Europe Battery Energy Storage Systems Market Trends and Developments
- 4.1 Historical Industry Development, 2018-2025
- 4.2 Recent Market Trends and Developments
- 4.3 Demand and Customer Behavior Trends
- 4.4 Technology and Product Innovation
- 4.5 Artificial Intelligence, Automation and Digitalization
- 4.6 Local Manufacturing and Supply Chain Realignment
- 4.7 Industry Partnerships, Mergers and Acquisitions
- 4.8 Sustainability and Circular Economy Developments
- 4.9 Government and Private Sector Investment Trends
- 4.10 Emerging Business Models and Commercialization
- 4.11 Industry Developments and Announcements
Chapter 5 Europe Battery Energy Storage Systems Market Production, Supply and Demand Analysis
- 5.1 Demand Trend and Consumption Analysis, 2018-2025
- 5.2 Demand Forecast, 2025-2035
- 5.3 Production and Output Trend, 2018-2025
- 5.4 Production and Output Forecast, 2025-2035
- 5.5 Installed Capacity and Capacity Utilization
- 5.6 Company-Wise Production Plants and Statistics
- 5.6.1 Installed Production Capacity
- 5.6.2 Actual Production
- 5.6.3 Planned Capacity and Expansion Targets
- 5.7 Supply Chain Structure and Procurement Trends
- 5.8 Supply-Demand Gap and Bottlenecks
- 5.9 Import Dependence and Sourcing Structure
- 5.10 Contract Manufacturing and Outsourcing
- 5.11 Regional Supply and Demand Concentration
Chapter 6 Europe Battery Energy Storage Systems Market Pricing Analysis
- 6.1 Pricing Structure and Measurement
- 6.2 Historical Pricing Trends, 2018-2025
- 6.3 Pricing Outlook, 2025-2035
- 6.4 Average Selling Price and Unit Economics
- 6.5 Pricing by Product and Market Segment
- 6.6 Geographic Pricing Differences
- 6.7 Key Input, Energy, Labor and Logistics Costs
- 6.8 Contract Pricing and Purchasing Models
- 6.9 Pricing Sensitivity and Competitive Positioning
- 6.10 Price, Margin and Profitability Implications
Chapter 7 Europe Battery Energy Storage Systems Market Dynamics
- 7.1 Market Growth Drivers
- 7.1.1 Demand-Side Drivers
- 7.1.2 Technology and Innovation Drivers
- 7.1.3 Infrastructure and Investment Drivers
- 7.1.4 Regulatory and Policy Drivers
- 7.2 Market Restraints
- 7.2.1 Cost and Affordability Constraints
- 7.2.2 Technology and Adoption Barriers
- 7.2.3 Supply Chain and Operational Constraints
- 7.3 Market Challenges
- 7.3.1 Competitive Pressure and Margin Erosion
- 7.3.2 Skills, Infrastructure and Implementation Gaps
- 7.4 Emerging Market Opportunities
- 7.5 Market Dynamics Impact and Time-Horizon Assessment
Chapter 8 Europe Battery Energy Storage Systems Value Chain Analysis
- 8.1 Industry Value Chain Overview
- 8.2 Upstream Suppliers and Critical Inputs
- 8.3 Technology and Component Providers
- 8.4 Manufacturing or Service Delivery
- 8.5 Distribution, Channel Partners and Integrators
- 8.6 Downstream Applications and End Users
- 8.7 Value Addition and Profit Pools
- 8.8 Vertical Integration and Outsourcing
- 8.9 Supplier Concentration and Risk
- 8.10 Supply Chain Localization and Resilience
Chapter 9 Europe Battery Energy Storage Systems Market Regulations and Policies
- 9.1 Relevant Laws, Standards and Compliance Frameworks
- 9.2 Product, Service, Safety and Quality Requirements
- 9.3 Government Policies, Incentives and Subsidies
- 9.4 Imports, Exports and Trade Barriers
- 9.5 Public Procurement and Local Content Requirements
- 9.6 Environmental and Sustainability Compliance
- 9.7 Upcoming Policy Changes and Market Implications
Chapter 10 Europe Battery Energy Storage Systems Market Hotspots and Opportunities
- 10.1 Market Opportunity Mapping and Growth Hotspots
- 10.2 High-Growth Applications and Customer Groups
- 10.3 Underserved Markets and White-Space Opportunities
- 10.4 Emerging Technology and Product Opportunities
- 10.5 New Capacity and Investment Hotspots
- 10.6 Market Entry and Expansion Opportunities
- 10.7 Distribution and Partnership Opportunities
- 10.8 Near-Term and Long-Term Commercial Potential
- 10.9 Opportunity Attractiveness and Execution Risks
Chapter 11 Europe Battery Energy Storage Systems Market Outlook, 2025-2035
- 11.1 Market Size and Analysis
- 11.1.1 Revenue (Market Measurement: 2025: USD 10.29 billion → 2035: USD 46.56 billion)
- 11.1.2 Market Volume and Quantity Sold
- 11.1.3 Historical Market Size, 2018-2025
- 11.1.4 Base-Year Market Size, 2025
- 11.2 Market Forecast, 2025-2035
- 11.2.1 Revenue Forecast to 2035
- 11.2.2 Volume Forecast to 2035
- 11.2.3 CAGR and Year-on-Year Growth
- 11.2.4 Incremental Revenue Opportunity
- 11.3 Forecast Assumptions and Scenario Analysis
- 11.3.1 Base-Case Forecast
- 11.3.2 Optimistic and Conservative Scenarios
- 11.3.3 Technology, Pricing and Policy Sensitivities
- 11.4 Market Attractiveness and Growth Outlook
Chapter 12 Europe Battery Energy Storage Systems Market Segmentation and Outlook
- 12.1 Segmentation Summary and Market Shares, 2025
- 12.2 Largest and Fastest-Growing Segments
- 12.3 By Asset Type - Market Size and Forecast, 2025-2035
- 12.3.1 Segment Definition and Scope
- 12.3.2 Historical Market Size, 2018-2025
- 12.3.3 Revenue Forecast, 2025-2035
- 12.3.4 Volume Forecast, 2025-2035
- 12.3.5 Base-Year Market Share, 2025
- 12.3.6 Segment CAGR and Growth Drivers
- 12.3.7 Subsegment Market Size and Forecast
- 12.3.7.1 Grid-Scale BESS
- 12.3.7.2 Commercial and Industrial BESS
- 12.3.7.3 Residential BESS
- 12.3.7.4 Community and Microgrid BESS
- 12.3.8 Subsegment Pricing and Adoption Trends
- 12.3.9 Leading Suppliers and Competition
- 12.3.10 Regional Demand and Opportunities
- 12.4 By Technology - Market Size and Forecast, 2025-2035
- 12.4.1 Segment Definition and Scope
- 12.4.2 Historical Market Size, 2018-2025
- 12.4.3 Revenue Forecast, 2025-2035
- 12.4.4 Volume Forecast, 2025-2035
- 12.4.5 Base-Year Market Share, 2025
- 12.4.6 Segment CAGR and Growth Drivers
- 12.4.7 Subsegment Market Size and Forecast
- 12.4.7.1 Lithium-Ion
- 12.4.7.2 Flow Batteries
- 12.4.7.3 Sodium-Ion
- 12.4.7.4 Advanced Lead-Acid
- 12.4.8 Subsegment Pricing and Adoption Trends
- 12.4.9 Leading Suppliers and Competition
- 12.4.10 Regional Demand and Opportunities
- 12.5 By End-Use Sector - Market Size and Forecast, 2025-2035
- 12.5.1 Segment Definition and Scope
- 12.5.2 Historical Market Size, 2018-2025
- 12.5.3 Revenue Forecast, 2025-2035
- 12.5.4 Volume Forecast, 2025-2035
- 12.5.5 Base-Year Market Share, 2025
- 12.5.6 Segment CAGR and Growth Drivers
- 12.5.7 Subsegment Market Size and Forecast
- 12.5.7.1 Utilities and Independent Power Producers
- 12.5.7.2 Commercial and Industrial Enterprises
- 12.5.7.3 Data Centers and Critical Infrastructure
- 12.5.7.4 Residential Prosumers
- 12.5.8 Subsegment Pricing and Adoption Trends
- 12.5.9 Leading Suppliers and Competition
- 12.5.10 Regional Demand and Opportunities
- 12.6 By Project Type - Market Size and Forecast, 2025-2035
- 12.6.1 Segment Definition and Scope
- 12.6.2 Historical Market Size, 2018-2025
- 12.6.3 Revenue Forecast, 2025-2035
- 12.6.4 Volume Forecast, 2025-2035
- 12.6.5 Base-Year Market Share, 2025
- 12.6.6 Segment CAGR and Growth Drivers
- 12.6.7 Subsegment Market Size and Forecast
- 12.6.7.1 Standalone BESS
- 12.6.7.2 Solar-Plus-Storage
- 12.6.7.3 Wind-Plus-Storage
- 12.6.7.4 Multi-Asset Hybrid Systems
- 12.6.8 Subsegment Pricing and Adoption Trends
- 12.6.9 Leading Suppliers and Competition
- 12.6.10 Regional Demand and Opportunities
- 12.7 By Country - Market Size and Forecast, 2025-2035
- 12.7.1 Segment Definition and Scope
- 12.7.2 Historical Market Size, 2018-2025
- 12.7.3 Revenue Forecast, 2025-2035
- 12.7.4 Volume Forecast, 2025-2035
- 12.7.5 Base-Year Market Share, 2025
- 12.7.6 Segment CAGR and Growth Drivers
- 12.7.7 Subsegment Market Size and Forecast
- 12.7.7.1 Germany
- 12.7.7.2 United Kingdom
- 12.7.7.3 Italy
- 12.7.7.4 Continental and Emerging Europe
- 12.7.8 Subsegment Pricing and Adoption Trends
- 12.7.9 Leading Suppliers and Competition
- 12.7.10 Regional Demand and Opportunities
- 12.8 Segment Growth Comparison
- 12.9 Segment Attractiveness and Priority Matrix
Chapter 13 Europe Battery Energy Storage Systems End-Use and Application Market Outlook
- 13.1 End-Use Industry and Customer Demand Structure
- 13.2 Leading Applications and Customer Groups
- 13.3 End-Use Market Size, Share and Forecast
- 13.4 Major End-Use Industry Deep Dives
- 13.4.1 Customer Requirements and Use Cases
- 13.4.2 Demand and Replacement Cycles
- 13.4.3 Technical and Regulatory Considerations
- 13.4.4 Purchasing and Procurement Models
- 13.4.5 Leading Vendors and Distribution Channels
- 13.4.6 Forecast and Commercial Opportunities
- 13.5 Emerging Applications and Cross-Segment Demand
- 13.6 End-Use Industry Investment Priorities
Chapter 14 Europe Battery Energy Storage Systems Geographic Market Outlook, 2025-2035
- 14.1 Regional Market Size and Country-Level Shares, 2025
- 14.2 Country Market Size Comparison, 2025
- 14.3 Country Market Forecasts, 2025-2035
- 14.4 Subregional Industrial and Demand Clusters
- 14.5 Intra-Regional Pricing and Cost Differences
- 14.6 Cross-Border Trade and Supply Networks
- 14.7 Regional Supply and Demand Balances
- 14.8 Country Opportunity Comparison and Prioritization
Note: Every listed country is covered on the structure shown under the first country.
Chapter 15 Europe Battery Energy Storage Systems Technology, Innovation and Sustainability Outlook
- 15.1 Technology Landscape and Maturity
- 15.2 Product, Process and Service Innovation
- 15.3 AI, Automation and Digital Tools in the Industry
- 15.4 Technology Adoption and Performance Benchmarking
- 15.5 Innovation Pipeline and R&D Investment
- 15.6 Patent and Intellectual Property Trends
- 15.7 Energy Efficiency and Resource Management
- 15.8 Sustainability, Recycling and Circularity
- 15.9 Technology Roadmap, 2025-2035
- 15.10 Risks of Obsolescence and Technology Substitution
Chapter 16 Europe Battery Energy Storage Systems Market Key Strategic Imperatives
- 16.1 Growth and Market Entry Priorities
- 16.2 High-Return Products and Segments
- 16.3 Pricing, Profitability and Cost Optimization
- 16.4 Technology Investment and Product Differentiation
- 16.5 Supply Chain Localization and Resilience
- 16.6 Distribution and Customer Acquisition
- 16.7 Partnership, Acquisition and Capacity Strategy
- 16.8 Regional Expansion Priorities
- 16.9 Short-, Medium- and Long-Term Actions
Chapter 17 Competition Outlook
- 17.1 Industry Competition Characteristics
- 17.2 Market Structure and Concentration
- 17.3 Market Share and Competitive Positioning, 2025
- 17.4 Company-Wise Revenue and Product Benchmarking
- 17.5 Production and Service Capacity Benchmarking
- 17.6 Technology, Pricing and Differentiation
- 17.7 Regional Footprint and Distribution Strength
- 17.8 Mergers, Acquisitions and Strategic Alliances
- 17.9 New Entrants and Competitive Threats
- 17.10 Porter's Five Forces and Industry Attractiveness
- 17.11 Competitive Outlook, 2025-2035
Chapter 18 Company Profiles
- 18.1 Company Coverage and Selection Criteria
- 18.2 CATL
- 18.2.1 Business Description
- 18.2.2 Company Ownership and Geographic Presence
- 18.2.3 Product and Service Portfolio
- 18.2.4 Manufacturing and Operating Footprint
- 18.2.5 Production Capacity and Expansion Plans
- 18.2.6 Financial Performance and Investment
- 18.2.7 Market Share and Competitive Position
- 18.2.8 Technology and Innovation Capabilities
- 18.2.9 Strategic Alliances or Partnerships
- 18.2.10 Recent Developments
- 18.2.11 Growth Strategy and Outlook
- 18.3 Sungrow
- 18.4 Tesla
- 18.5 Fluence Energy
- 18.6 BYD
- 18.7 Wärtsilä Energy Storage
- 18.8 Saft
- 18.9 Nidec Conversion
- 18.10 Alfen
- 18.11 Siemens Energy
- 18.12 Other Relevant Market Participants
Note: Every listed company is profiled on the structure shown under the first company. The company list is preliminary and may change based on research findings, market developments, data availability and client requirements.
Chapter 19 Disclaimer
- 19.1 Research and Forecast Disclaimer
- 19.2 Data Source and Estimation Limitations
Note: The depth of individual sections depends on data availability for this market. Volume, capacity, trade and other unit-based metrics are included where applicable.

