
Batteries and home devices now need automated dispatch
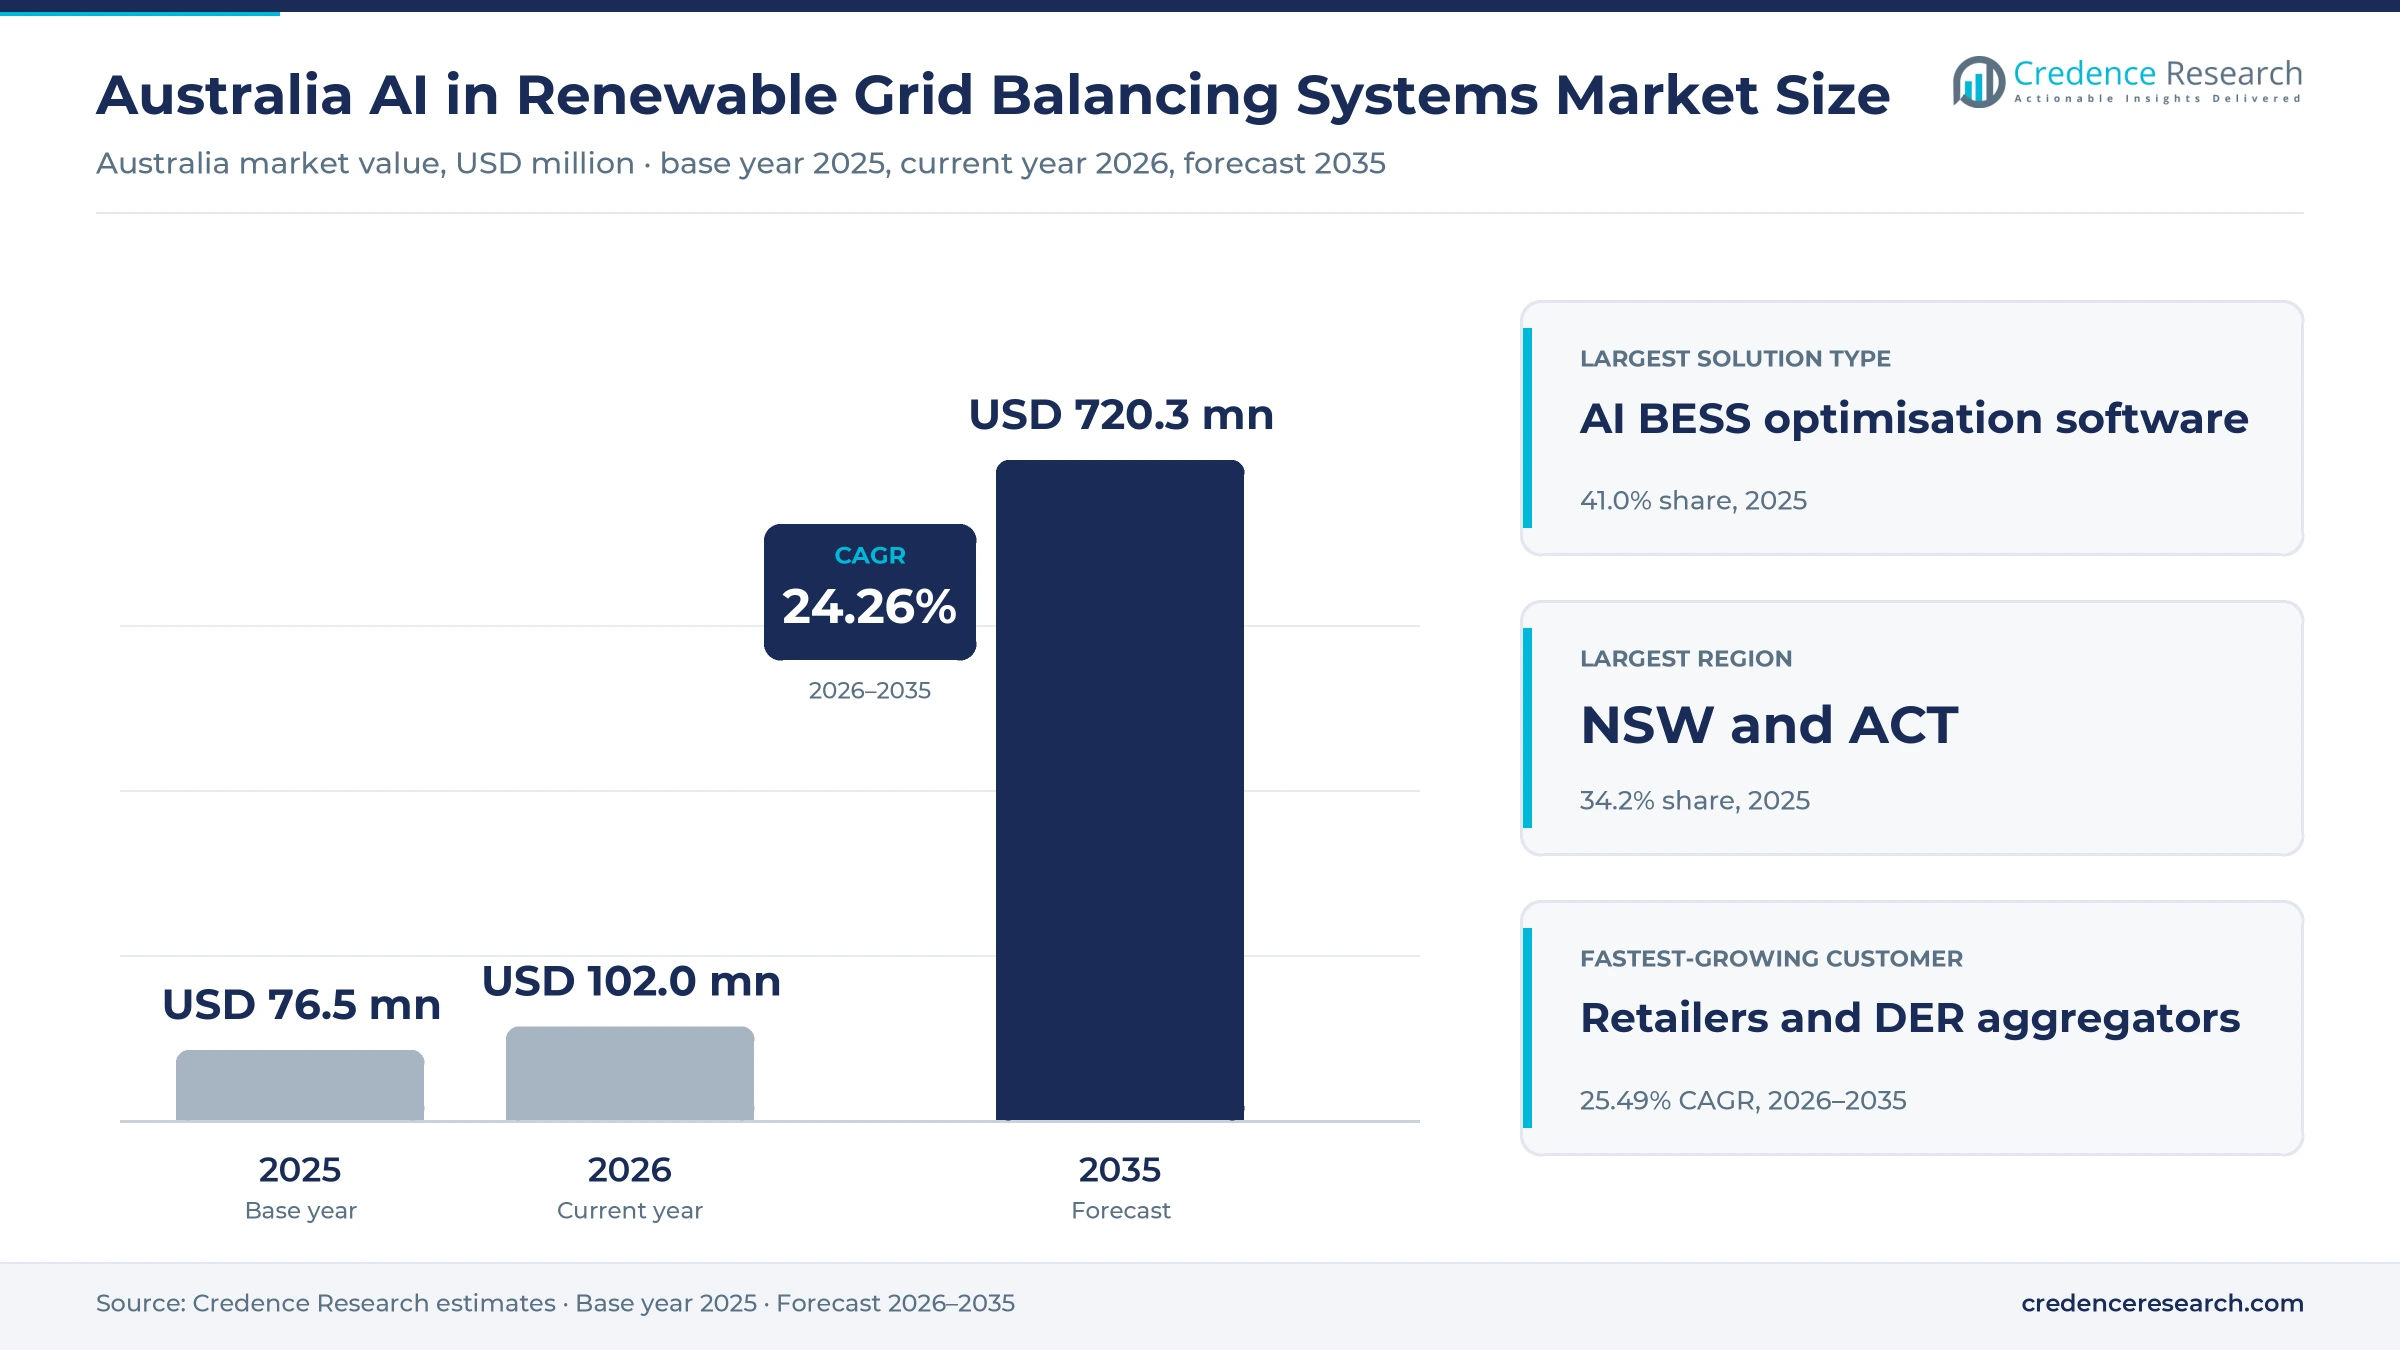
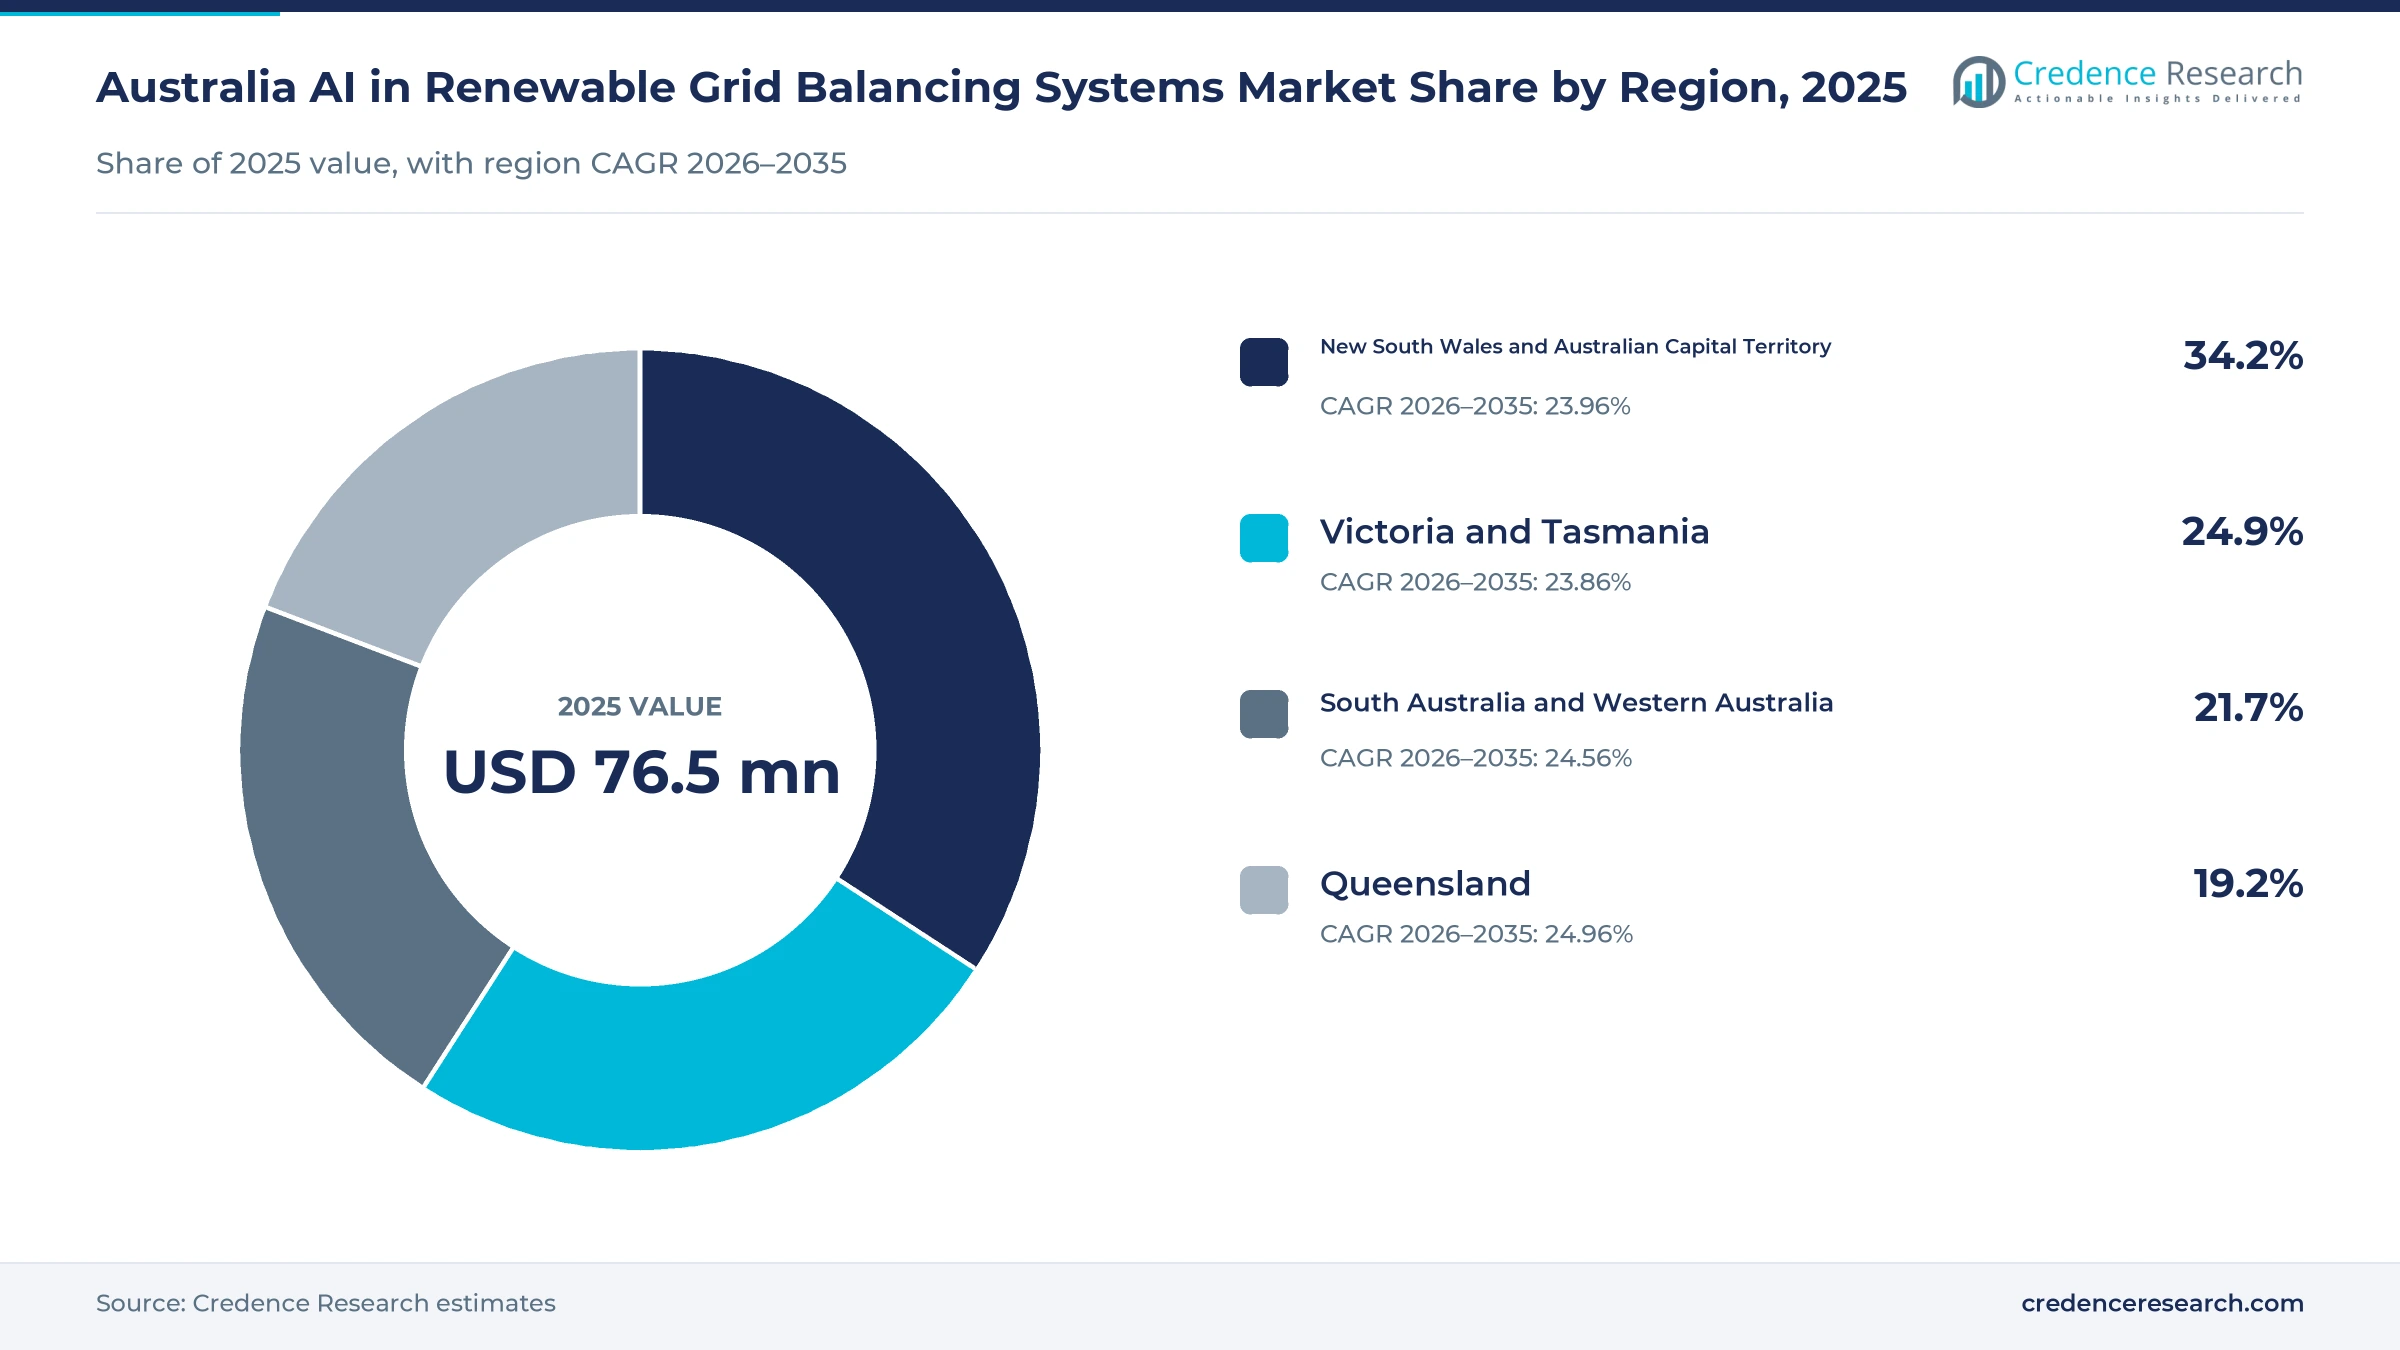
The Australia AI in renewable grid balancing systems market was valued at USD 76.5 million in 2025 and is projected to increase from USD 102.0 million in 2026 to USD 720.3 million by 2035, registering a CAGR of 24.26% during 2026–2035. Demand comes from battery owners that need automated bidding across energy and frequency markets, from networks that manage rooftop solar exports and from retailers that pool home batteries into virtual power plants. New South Wales and the Australian Capital Territory held the largest regional share, 34.2% in 2025, because the zone hosts large new batteries at Eraring and Liddell and the largest network customer base. Queensland is the fastest-growing region at 24.96% a year, as several large batteries entered commissioning there in 2026. The AEMC rule that lets aggregated household and business resources join central dispatch from May 2027 is also shifting spending toward platforms that orchestrate many small devices.
Which balancing software and services does the estimate count?
The estimate measures spending on software and services that use machine learning to forecast prices, renewable output and demand, and then bid, dispatch or limit batteries, solar, wind and flexible loads. It counts battery bidding optimizers, distributed energy resource management and virtual power plant platforms, grid management systems with forecasting modules, and the integration and managed trading services sold around them.
The estimate excludes battery cells, inverters, transformers and other hardware, as well as wholesale energy revenue earned by the assets themselves. The value chain runs from software vendors and integrators through asset owners, networks and retailers to AEMO dispatch, where bids and device limits finally settle each five-minute interval.
Australia AI in Renewable Grid Balancing Systems Market Insights
- The Australia AI in renewable grid balancing systems market was valued at USD 76.5 million in 2025 and is projected to reach USD 720.3 million by 2035, registering a CAGR of 24.26% during 2026–2035.
- New South Wales and the Australian Capital Territory held a 34.2% share of 2025 value, because the Eraring and Liddell batteries and the largest network customer base sit in the zone.
- AI BESS optimisation software led with a 41.0% share of 2025 value, because NEM grid-scale battery capacity more than doubled in a year and passed 9 GW by June 2026.
- Batteries set NEM prices in 36% of dispatch intervals in the June quarter of 2026, up from 17% a year earlier, which makes bidding quality a direct driver of asset earnings.
- Retailers and DER aggregators grow fastest at 25.49% a year during 2026–2035, as about 600,000 households with batteries become candidates for orchestrated dispatch.
Battery bidding software and cloud platforms lead spending
Why does battery bidding software lead spending?
Based on solution type, the market is categorized into AI BESS optimisation software, AI-powered DERMS and VPP platforms, AI grid management systems, and professional and managed services. AI BESS Optimisation Software led with a 41.0% share of 2025 value, because every grid-scale battery needs automated bids for energy and frequency markets. AI-Powered DERMS and VPP Platforms grow fastest at 25.21% a year, as retailers enroll subsidized home batteries into dispatchable fleets.
How do asset operators shape software budgets?
Based on customer type, the market is categorized into storage and renewable asset operators, network and system operators, and retailers and DER aggregators. Storage and Renewable Asset Operators led with a 52.0% share of 2025 value, because battery and wind owners pay for bidding tools that protect margins every interval. Retailers and DER Aggregators grow fastest at 25.49% a year, as virtual power plant offers spread across new home battery customers.
Which balancing tasks absorb most software value?
Based on application, the market is categorized into energy and ancillary-service co-optimisation, distributed flexibility dispatch and network balancing and renewable forecasting. Energy and Ancillary-Service Co-Optimisation led with a 49.0% share of 2025 value, because batteries must split capacity between arbitrage and frequency services. Distributed Flexibility Dispatch grows fastest at 25.33% a year, as small devices gain access to scheduling and flexible trading.
Why do cloud platforms dominate deployments?
Based on deployment model, the market is categorized into cloud-hosted platforms, on-premises systems and hybrid deployments. Cloud-Hosted Platforms led with a 58.0% share of 2025 value, because vendors update forecasting models and bid logic centrally for many sites at once. Cloud-Hosted Platforms grow fastest at 24.54% a year, as asset owners move bidding and portfolio dashboards off local servers.
| Segment Group | Leading Sub-segment | Share, 2025 | Fastest-growing Sub-segment | CAGR, 2026–2035 |
|---|---|---|---|---|
| By Solution Type | AI BESS Optimisation Software | 41.0% | AI-Powered DERMS and VPP Platforms | 25.21% |
| By Customer Type | Storage and Renewable Asset Operators | 52.0% | Retailers and DER Aggregators | 25.49% |
| By Application | Energy and Ancillary-Service Co-Optimisation | 49.0% | Distributed Flexibility Dispatch | 25.33% |
| By Deployment Model | Cloud-Hosted Platforms | 58.0% | Cloud-Hosted Platforms | 24.54% |
Request a Free Sample
Fill in your details and we'll send you a free sample report.
- Sample data tables & charts
- Research methodology
Battery growth, dispatch reform and grid data lift demand
Why does battery dispatch complexity lift software demand?
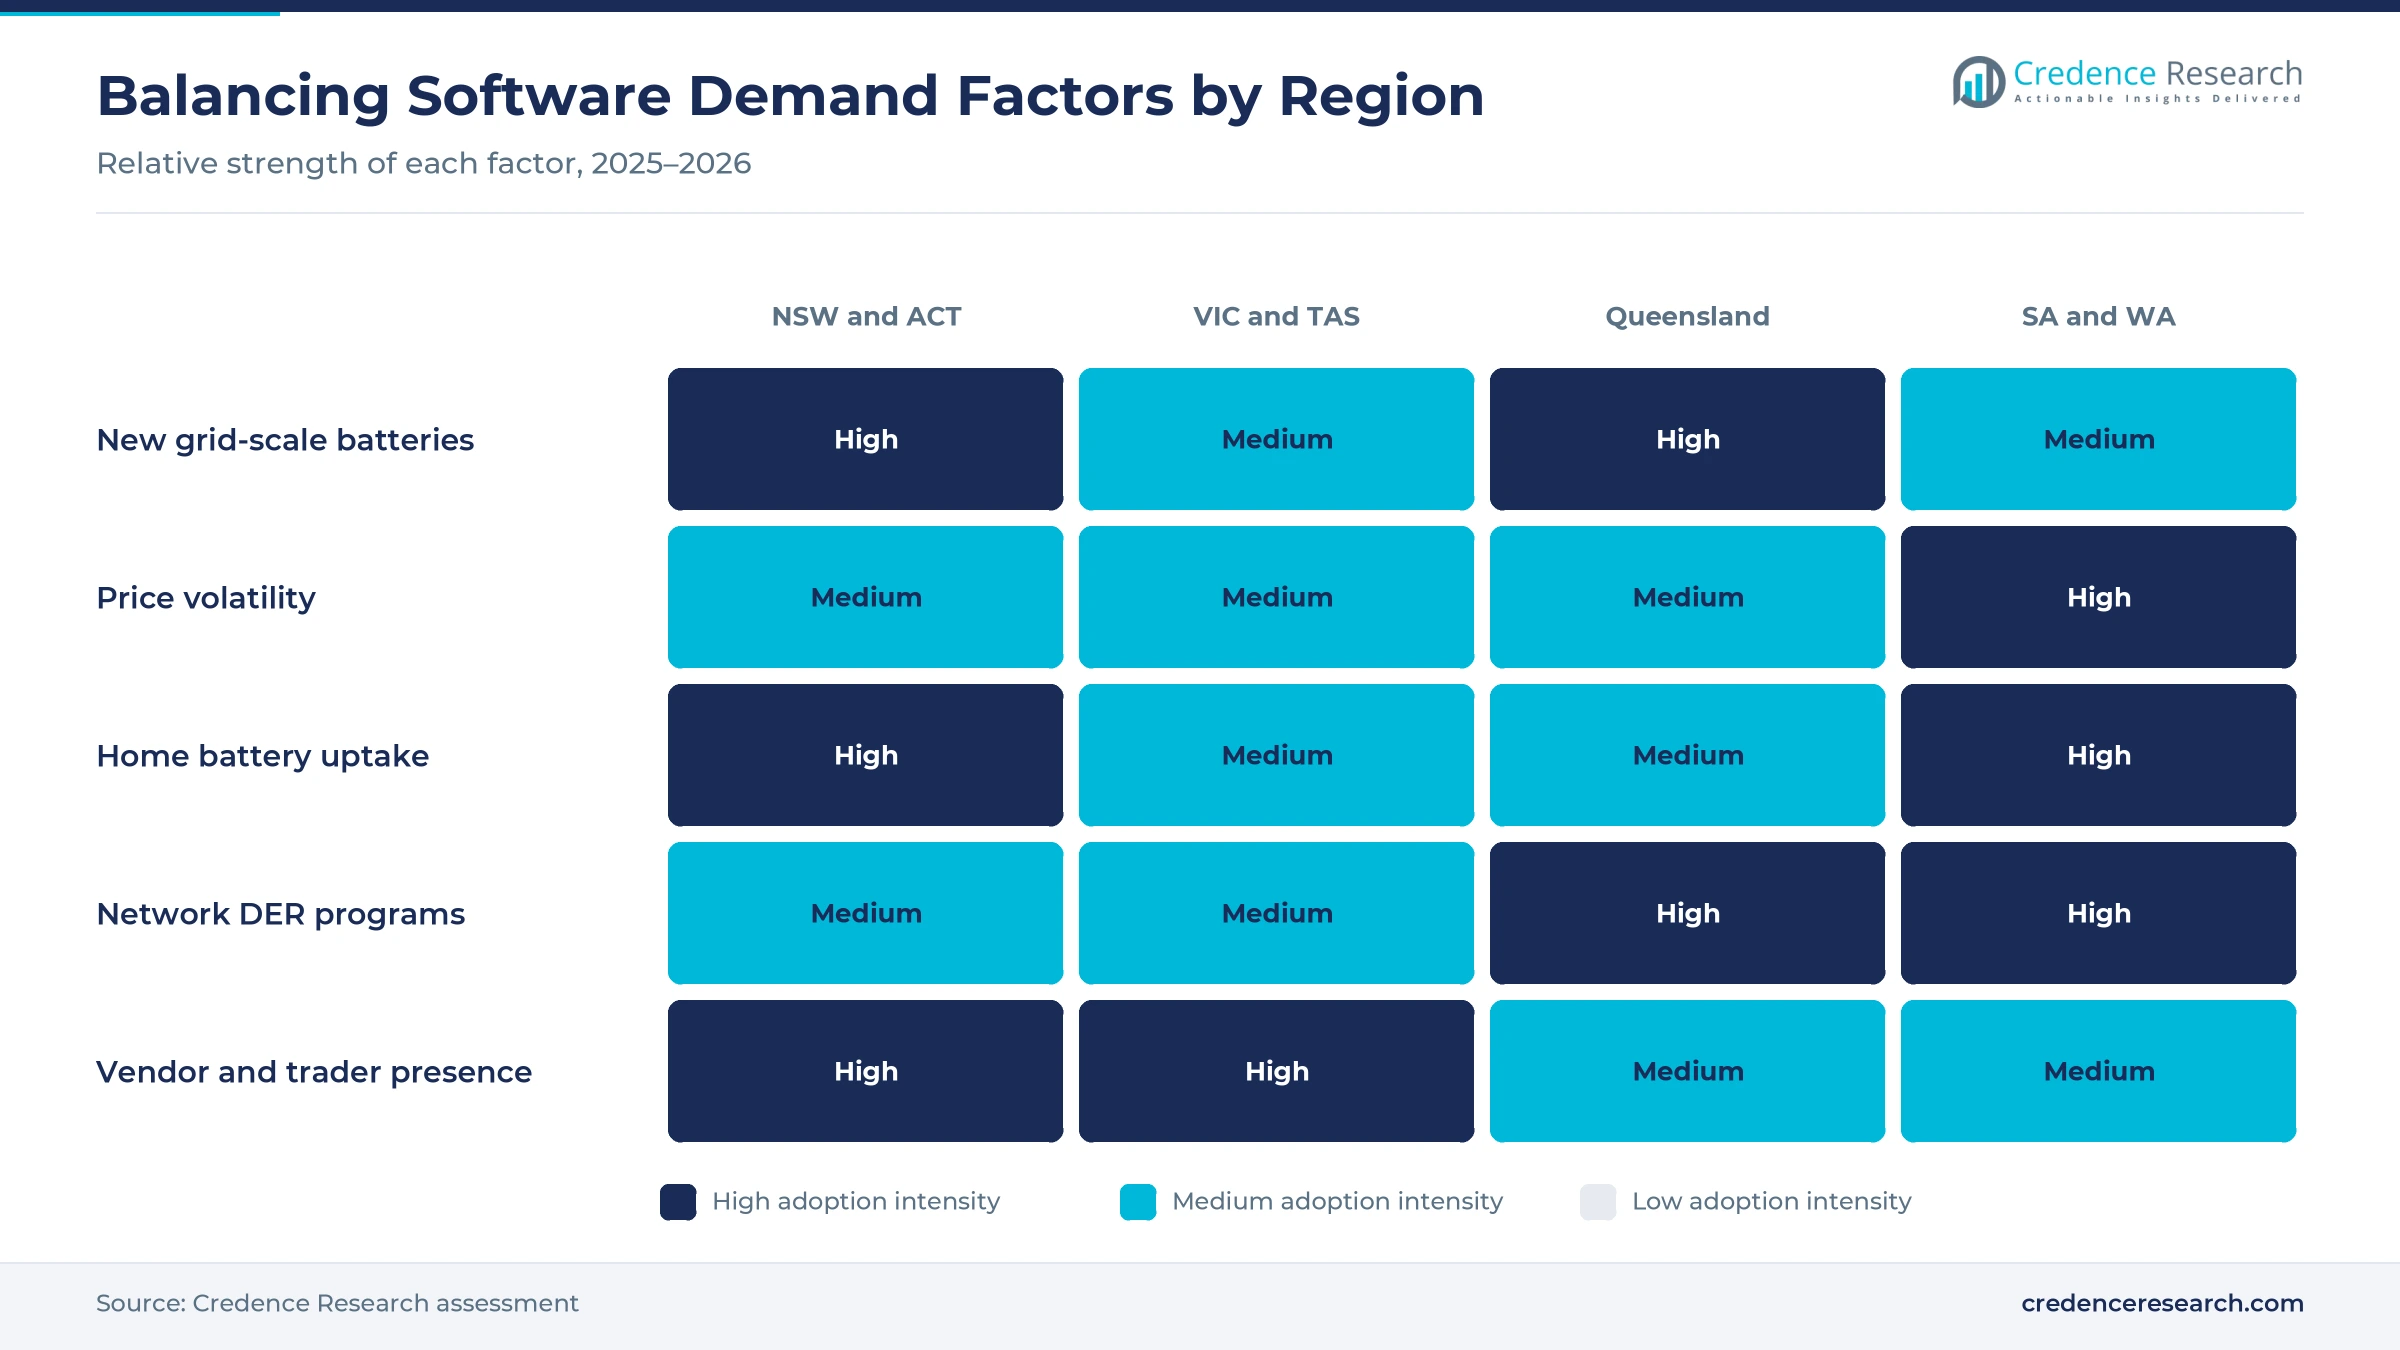
Grid-scale batteries now set prices across much of the day, so each operator needs software that forecasts, bids and rebids every five-minute interval across energy and frequency markets. AEMO reported that NEM grid-scale battery capacity more than doubled over the year and exceeded 9 GW, in its June quarter 2026 energy dynamics release. Batteries set prices in 36% of dispatch intervals in that quarter, up from 17% a year earlier, according to an Energy-Storage.News analysis of the AEMO data. The average spread between charging and discharging prices fell 85% to A$51/MWh over the same period, which leaves far less room for weak bids. As a result, AI BESS optimisation software holds 41.0% of 2025 value.
How do market reforms bring home batteries into dispatch?
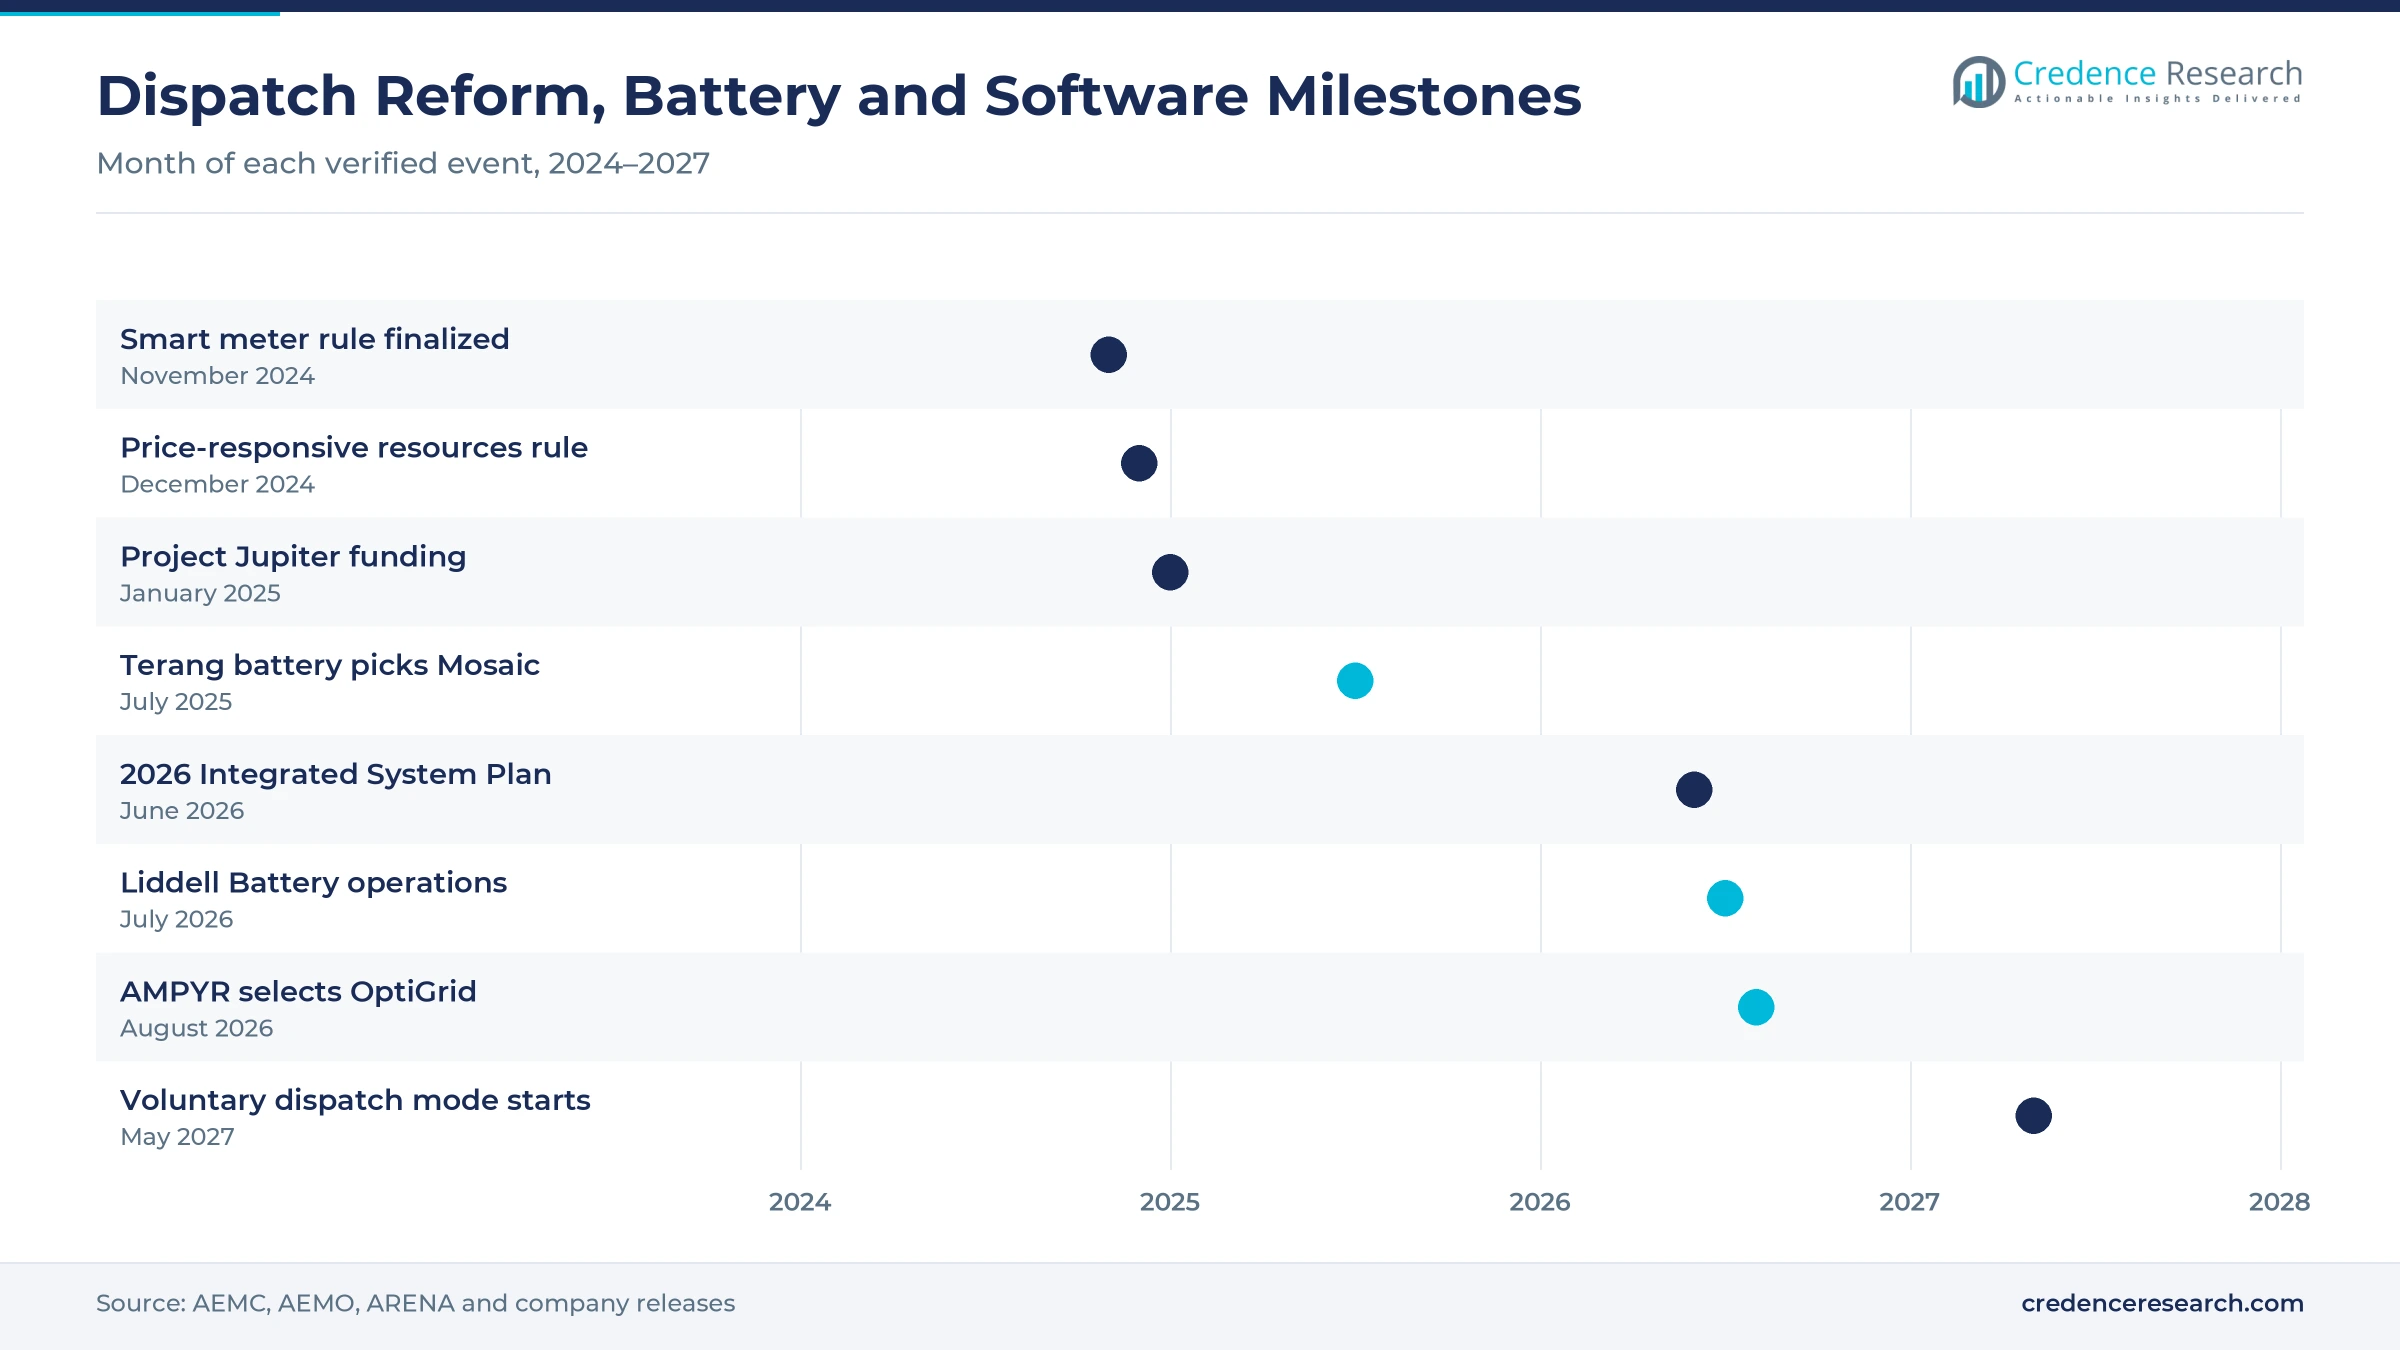
Rule changes now let aggregated household and business devices compete in wholesale dispatch, which creates demand for platforms that can bid thousands of small assets as one unit. The AEMC made its rule on integrating price-responsive resources on Dec. 19, 2024, and the voluntary dispatch mode starts on May 23, 2027. Flexible trading arrangements are scheduled to go live on Nov. 1, 2026, adding secondary settlement points so customers can use separate providers for batteries or EV chargers. The Clean Energy Regulator also requires on-grid batteries claiming the Cheaper Home Batteries discount to be able to join a virtual power plant. In turn, retailers and DER aggregators grow fastest at 25.49% a year.
Why does network digitalization widen the platform base?
Networks need near real-time visibility of rooftop solar and batteries to keep voltages and exports within limits, and that visibility depends on meters and grid software. The AEMC finalized its accelerated smart meter rule on Nov. 28, 2024, targeting universal deployment across the NEM by 2030 and better network access to power quality data, according to its final rule release. Energy Queensland deployed the GE Vernova GridOS DERMS Gateway to register solar systems under IEEE 2030.5 and to issue dynamic operating envelopes. The IEA found that one in three Australian households has rooftop solar, the highest penetration in the world, in its Australia 2023 energy policy review. As a result, network balancing and renewable forecasting holds a large share of spending.
How do new firming contracts add optimized assets?
Government underwriting and utility investment keep adding large batteries, and each new asset needs a bidding and control platform before it can earn. A federal pilot tender for dispatchable capacity in Victoria and South Australia drew more than 100 bids and selected six batteries under the Capacity Investment Scheme. AGL Energy reported that its 500 MW Liddell Battery began operations in July 2026, while Origin Energy completed the 460 MW, 1,770 MWh first stage of its Eraring battery at the end of 2025. FRV Australia chose Fluence Mosaic to bid its 100 MW, 200 MWh Terang battery in Victoria in July 2025. In turn, growing energy storage pipelines feed recurring subscription revenue for optimizer vendors.
Thinner spreads and orchestrated homes reshape software
How is the rise of AI bidding changing battery trading?
Thinner price spreads are pushing battery owners from simple time-of-day schedules toward machine learning forecasts that capture short price spikes. The volume-weighted average battery discharge price in the NEM fell from A$427/MWh to A$101/MWh between the June quarters of 2025 and 2026. FCAS made up only 8.3% of estimated battery revenue in that quarter, so most earnings now depend on arbitrage timing. AMPYR Australia selected OptiGrid in August 2026 after testing its OptiBidder platform against rival systems on a digital twin of a proposed battery. As a result, energy and ancillary-service co-optimisation keeps 49.0% of 2025 value while vendors compete on forecast accuracy.
Why is home battery orchestration an emerging shift?
Household batteries are becoming a large flexible resource, which shifts software spending toward platforms that pool many small devices. AEMO reported that household battery capacity grew by 3,283 MWh, or 41%, in its June quarter 2026 review, and its 2026 Integrated System Plan explainer counts about 600,000 households with batteries. The Clean Energy Regulator cut the Cheaper Home Batteries certificate factor from 8.4 to 6.8 from May 2026, which makes VPP payments a larger part of what each buyer earns. Tesla already manages 3,000 solar and Powerwall systems on Housing SA properties under an earlier state program. In turn, AI-powered DERMS and VPP platforms grow fastest at 25.21% a year.
Is there an opening in a live WA DER marketplace?
Western Australia is building a wholesale-linked marketplace for distributed resources, which opens a new buyer group for orchestration software. ARENA awarded Western Power A$20.8 million for Project Jupiter on Jan. 30, 2025, describing it as the first live DER marketplace in Australia integrated with the wholesale market, in its funding announcement. About 40% of households on the South West Interconnected System have rooftop solar, with around 30,000 new systems installed each year. Synergy, AEMO and Energy Policy WA are partners in the three-year project. As a result, vendors that integrate with Western Power and Synergy can win early contracts in the zone.
Can large new loads open a flexibility services market?
Data center growth adds large and fast-moving demand, which creates an opening for forecasting and flexible connection tools that balance new loads against renewable output. AEMO counted 17 proposed data center projects with a combined maximum connection capacity of 9 GW in the NEM connection process by the end of June 2026. New South Wales accounted for 52% of that capacity, Victoria for 31% and South Australia for 17%. AEMO also forecasts that electricity consumption will nearly double by 2050 in its 2026 Integrated System Plan. In turn, operators that pair energy management software with grid forecasts can sell flexibility to both networks and large users.
Revenue squeeze, standards and low enrollment slow uptake
How does revenue compression squeeze software budgets?
Lower wholesale prices and narrower spreads reduce the margin that battery owners can share with software vendors. Estimated NEM battery net revenue fell from A$130.5 million to A$57.5 million between the June quarters of 2025 and 2026, so owners now scrutinize every subscription and performance fee. As a result, vendors face pressure to cut fixed fees and prove uplift on each site. Performance-linked contracts and benchmark trials help vendors defend pricing when spreads stay thin.
Why do device standards slow distributed integration?
Home batteries, inverters and chargers use many communication protocols, which raises integration cost for every VPP and distributed energy resource management platform. Energy Queensland registers devices under IEEE 2030.5 and the SA HB 218:2023 handbook before they can receive dynamic limits, and older inverters often lack support. In turn, retailers spend more time on device onboarding than on dispatch strategy. Vendors respond with single integration layers that connect many manufacturers through one gateway.
How does low VPP enrollment limit home battery value?
Many households buy batteries for self-consumption and backup, and they do not join a virtual power plant even when the device is capable. As a result, a large share of new home storage remains outside coordinated dispatch, which limits the fleet size that aggregators can bid. Customers often worry about battery wear and loss of control over their own energy. Retailers respond with clearer payment terms, reserve limits and app controls that keep a minimum charge for each home.
Why does rule timing create planning risk for vendors?
Several reforms that create demand for balancing platforms phase in over 2026 and 2027, which makes product roadmaps sensitive to detailed procedures. The voluntary dispatch mode does not start until May 23, 2027, and AEMO has consulted separately on guidelines and an incentive procedure for participants. In turn, aggregators delay some platform purchases until the rules settle. Vendors respond with modular products that can switch on scheduling features when each reform starts.
NSW and ACT lead while Queensland adds batteries fastest
| Region | Value, 2025 (USD million) | Share, 2025 | CAGR, 2026–2035 |
|---|---|---|---|
| New South Wales and Australian Capital Territory | 26.2 | 34.2% | 23.96% |
| Victoria and Tasmania | 19.0 | 24.9% | 23.86% |
| South Australia and Western Australia | 16.6 | 21.7% | 24.56% |
| Queensland | 14.7 | 19.2% | 24.96% |
Why do NSW and the ACT hold the top share?
New South Wales and the Australian Capital Territory held a 34.2% share of 2025 value and grow at 23.96% a year, because the zone hosts the largest new gentailer batteries and the largest network customer base. The Liddell and Eraring batteries both sit in the Hunter and Central Coast region. AMPYR is building its 300 MW, 600 MWh Bulabul Battery in the Central-West Orana Renewable Energy Zone. As a result, the zone buys both large battery optimizers and network software for Endeavour Energy and other networks.
How do Victoria and Tasmania use balancing software?
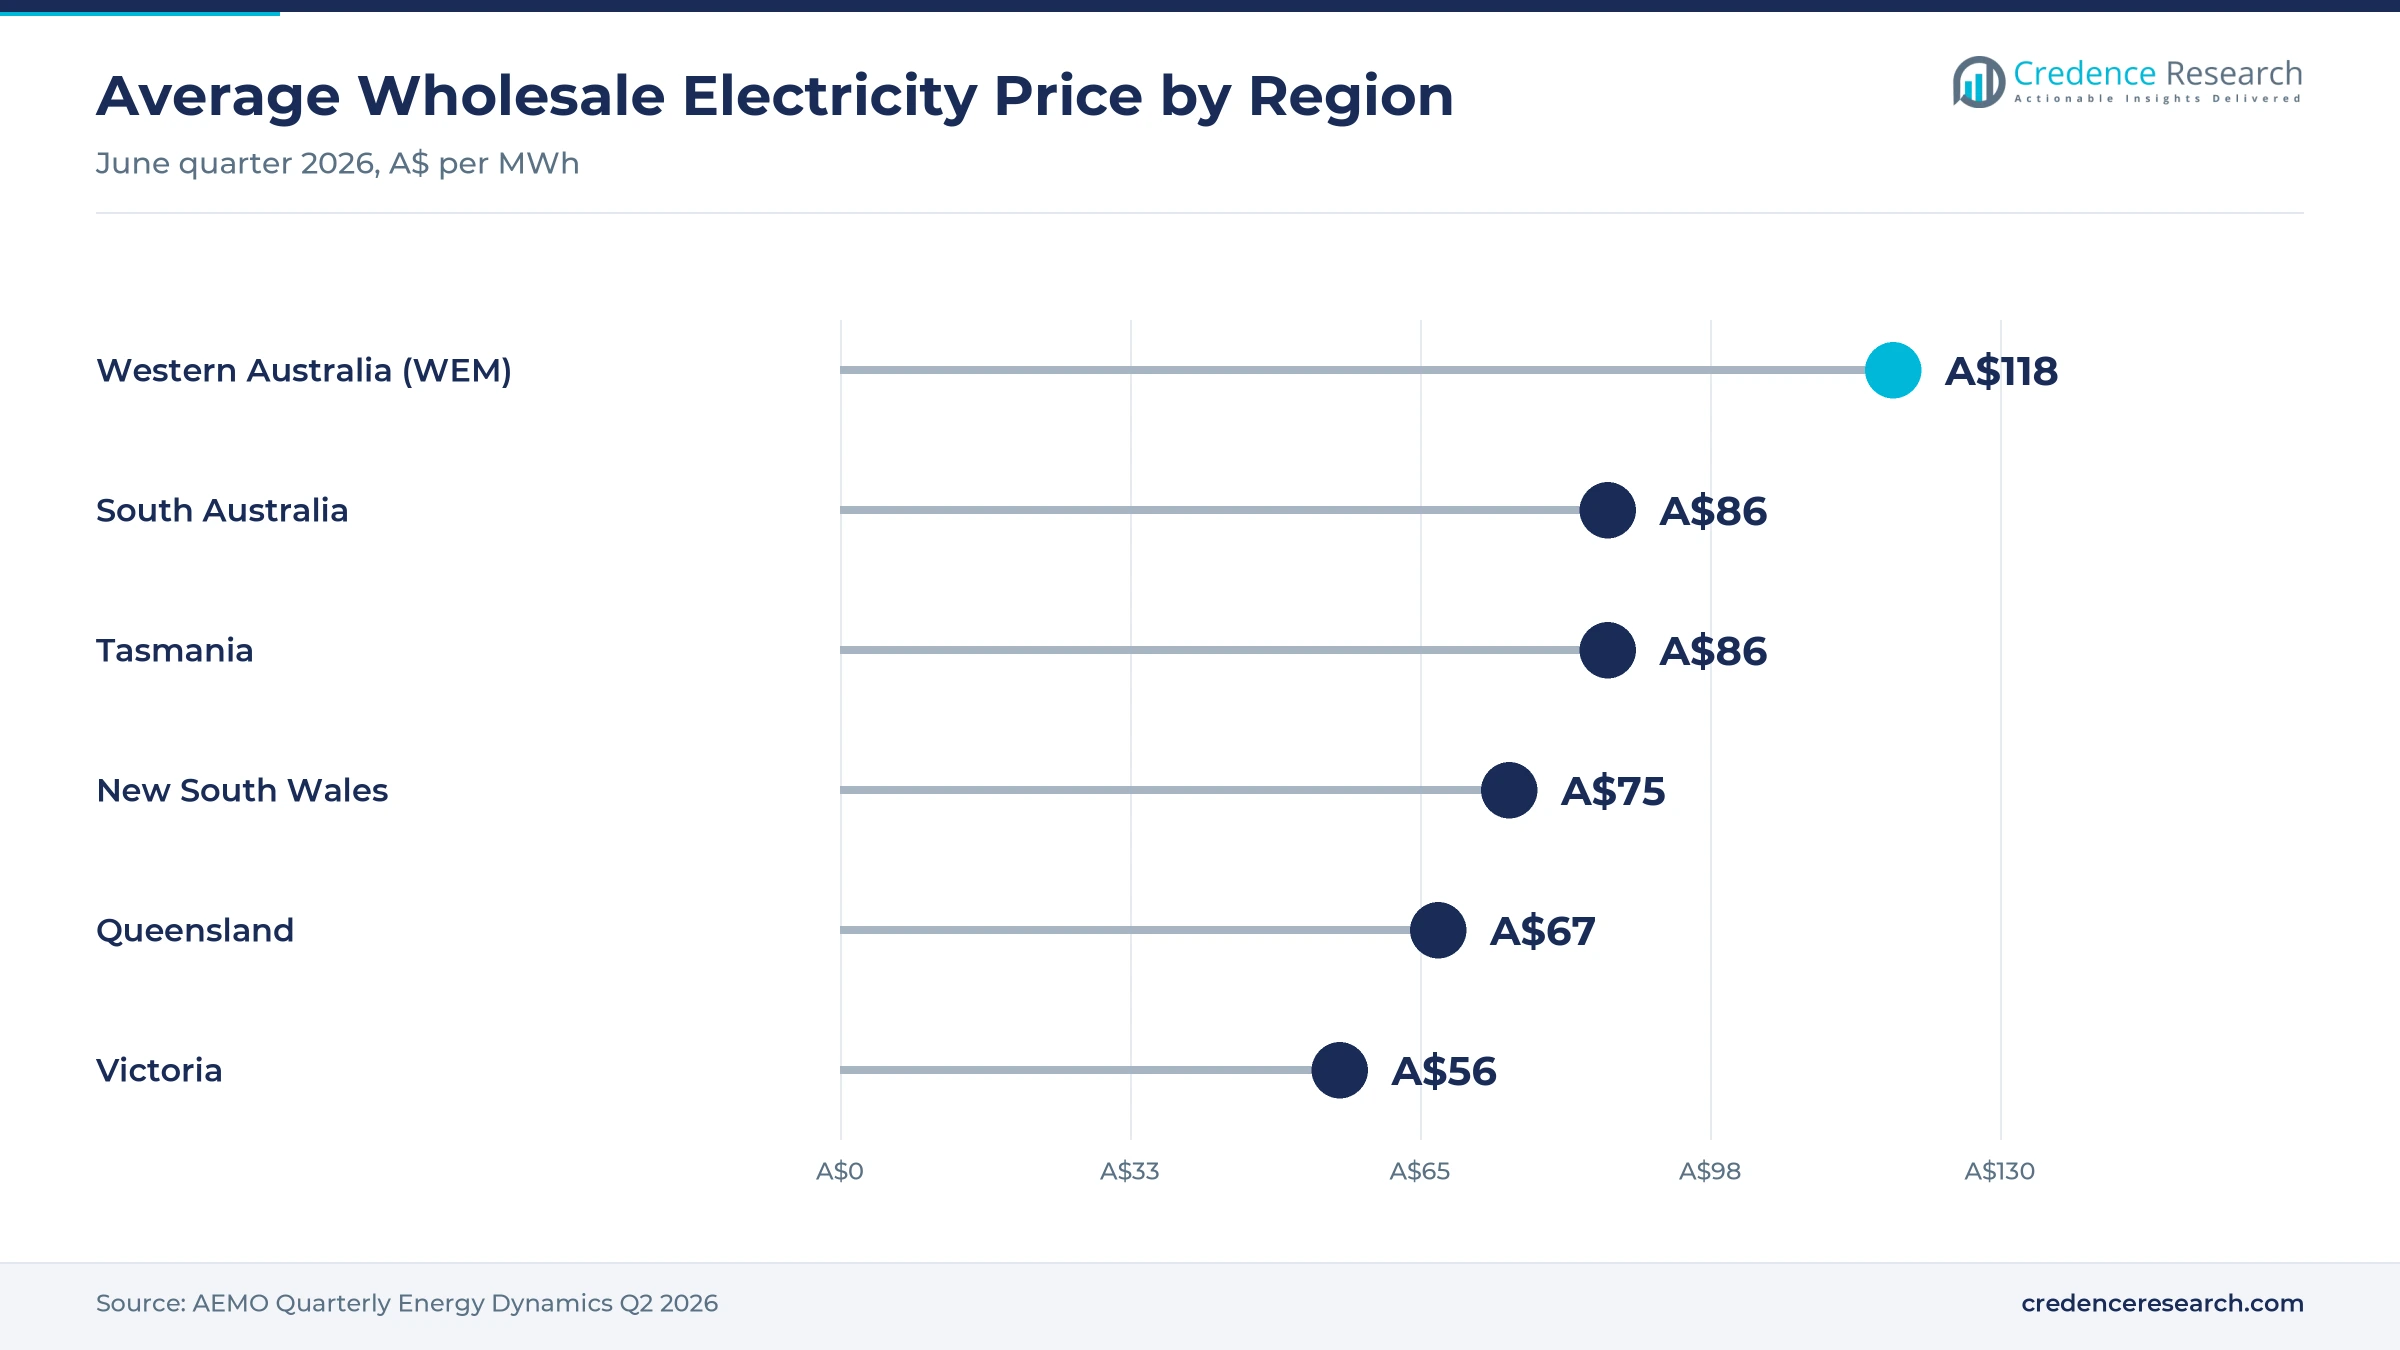
Victoria and Tasmania held a 24.9% share of 2025 value and grow at 23.86% a year, because Victoria has many wind farms and new batteries that trade against volatile prices. The Victorian average wholesale price fell 60% to A$56/MWh in the June quarter of 2026, the largest regional decline in the NEM. Battery arbitrage revenue in Victoria fell A$32.7 million over the same period. In turn, owners such as FRV at Terang rely on automated bidding to protect thinner margins.
Why does Queensland add batteries fastest?
Queensland held a 19.2% share of 2025 value and grows fastest at 24.96% a year, because large batteries are entering service across the state. The 300 MW, 1,200 MWh Stanwell battery, the 222 MW, 593 MWh Woolooga battery and the 180 MW, 360 MWh Broadsound Energy Park began commissioning in the June quarter of 2026. Energy Queensland also manages solar connections through a GE Vernova DERMS gateway. As a result, the state combines fast growth in battery optimizers with network platform demand.
How do South Australia and WA test new dispatch models?
South Australia and Western Australia held a 21.7% share of 2025 value and grow at 24.56% a year, because both states run high shares of rooftop solar on small grids. A wind lull pushed South Australian prices to the A$20,300/MWh market cap during June 21-22, 2026, which rewards fast battery response. Western Australia has added more than 1 GW of grid-scale battery capacity since mid-2025 and 288 MWh of residential batteries in the June quarter. In turn, South Australia-based OptiGrid and Western Power programs anchor local demand.
Optimizer contracts, DER marketplaces and big batteries
| Development | Status and market relevance |
|---|---|
| In January 2025, ARENA awarded Western Power A$20.8 million for Project Jupiter, a DER marketplace in the SWIS. | Links aggregated home devices to the WA wholesale market |
| In July 2025, FRV Australia selected Fluence Mosaic to bid its 100 MW, 200 MWh Terang battery in Victoria. | Adds an AI bidding contract on a new NEM battery |
| In March 2026, AGL Energy began commissioning the first 250 MW of its 500 MW Liddell Battery in NSW. | Full operations began in July 2026 |
| In April 2026, Hitachi Energy was chosen to deliver Powerlink's Central Queensland synchronous condenser project. | Adds system strength for a high-renewables grid |
| In August 2026, AMPYR Australia selected OptiGrid's OptiBidder platform after digital twin benchmarking. | Covers batteries in NSW and South Australia |
Price forecasting, DERMS gateways and digital twins
- Machine learning price forecasts analyze system load, transmission headroom, generator activity and weather to predict energy and FCAS prices for the next interval and the next day.
- Co-optimized bid engines split battery capacity between arbitrage and frequency services and create market-compliant bids and rebid reasons that go directly to AEMO.
- DERMS gateways register home solar and batteries under IEEE 2030.5 and send dynamic operating envelopes that set safe export and import limits for each site.
- Digital twin benchmarking tests rival bidding strategies on a simulated battery before purchase, which lets owners compare optimizers on the same contract positions.
Need a Custom Version of This Report?
Tailor the scope, geography, or segments to your exact requirements.
- Custom geography or segment scope
- Direct access to our analyst team
Optimizers, grid vendors and gentailers compete for fleets
Competition combines specialist battery optimizers, global grid software vendors and gentailers that run their own trading desks. Fluence sells Mosaic, which uses machine learning forecasts to bid renewable and storage assets on the NEM, while South Australia-based OptiGrid won AMPYR Australia with its OptiBidder platform. Energy One provides automated bidding and dispatch for Shell Energy's battery and demand response portfolio, and Tesla manages household Powerwall fleets in South Australia. GE Vernova supplies a DERMS gateway to Energy Queensland, Schneider Electric supplies its EcoStruxure ADMS to Endeavour Energy, and Siemens markets Gridscale X to networks through its Australia and New Zealand grid software team. Hitachi Energy delivers synchronous condenser and system strength projects for Powerlink in Central Queensland. AGL Energy and Origin Energy operate large batteries at Liddell and Eraring. Rivals compete on forecast accuracy, market compliance, device reach and proof of revenue uplift.
Which optimizers, grid vendors and gentailers lead?
| Company | Type | Role in the market |
|---|---|---|
| Tesla | VPP operator | Manages household Powerwall fleets in South Australia |
| Fluence | Battery optimizer | Mosaic AI bidding software for NEM storage and renewables |
| Siemens | Grid software vendor | Gridscale X grid management software for networks |
| Schneider Electric | Grid software vendor | EcoStruxure ADMS at Endeavour Energy |
| GE Vernova | Grid software vendor | GridOS DERMS Gateway at Energy Queensland |
| Hitachi Energy | Grid technology integrator | Synchronous condenser project for Powerlink |
| Energy One | Trading software provider | Automated bidding and dispatch for Shell Energy |
| AGL Energy | Gentailer | Operates the 500 MW Liddell Battery in NSW |
| Origin Energy | Gentailer | Operates the Eraring battery in NSW |
| OptiGrid | Battery optimizer | OptiBidder platform selected by AMPYR Australia |
Credence Research view on balancing software demand
Credence Research's view is that Australian balancing software demand will grow quickly because batteries now set prices in a large share of intervals and every new site needs automated bids. Battery optimizers remain the core of spending, yet VPP platforms and retailer aggregation add the fastest growth as home batteries spread. Thinner price spreads will favor vendors that prove revenue uplift on each site rather than those that sell flat licenses. Vendors with strong device reach, market compliance and forecasting accuracy should gain the most share by 2035.
How the balancing software estimate was built
The report uses 2025 as the base year on a calendar basis, and market values come from the Credence Research model. That model combines system operator data on battery capacity, dispatch and prices, rule maker determinations, regulator program rules, agency funding releases and company announcements on software contracts and battery projects. Segment splits, zone shares and zone growth rates are Credence Research estimates. Sources used are system operator reports, rule determinations, regulator and agency releases, international agency reviews and company releases, and no interviews or surveys were used.
Dispatch mode and home batteries shape demand to 2035
The Australia AI in renewable grid balancing systems market is expected to reach USD 720.3 million by 2035, a 24.26% CAGR during 2026–2035, as batteries, home devices and flexible loads move into automated dispatch. Growth should be strongest in VPP platforms, retailer aggregation and Queensland, because these areas gain most from new batteries and the voluntary dispatch mode. Thinner spreads, device standards and low VPP enrollment could slow some sales, while universal smart meters by 2030 should widen the data base for network balancing.
Frequently Asked Questions
How big is the Australia AI in renewable grid balancing systems market?
Which solution type leads balancing software spending?
Which region leads the market?
How large is the NEM grid-scale battery fleet?
How often do batteries set NEM prices?
When can aggregated home batteries join central dispatch?
Who are the leading companies in Australian grid balancing software?
What are the main challenges for balancing software vendors?
Table of Content
Chapter 1 Market Segmentation
- 1.1 Segmentation Framework
- 1.1.1 Product and Service Classification
- 1.1.2 Application and End-Use Classification
- 1.1.3 Technology and Solution Classification
- 1.1.4 Customer and Distribution Channel Classification
- 1.1.5 Geographic Segmentation
- 1.1.6 Market Segment Definitions and Boundaries
- 1.2 By Solution Type
- 1.2.1 AI BESS Optimisation Software
- 1.2.2 AI-Powered DERMS and VPP Platforms
- 1.2.3 AI Grid Management Systems
- 1.2.4 Professional and Managed Services
- 1.3 By Customer Type
- 1.3.1 Storage and Renewable Asset Operators
- 1.3.2 Network and System Operators
- 1.3.3 Retailers and DER Aggregators
- 1.4 By Application
- 1.4.1 Energy and Ancillary-Service Co-Optimisation
- 1.4.2 Distributed Flexibility Dispatch
- 1.4.3 Network Balancing and Renewable Forecasting
- 1.5 By Deployment Model
- 1.5.1 Cloud-Hosted Platforms
- 1.5.2 On-Premises Systems
- 1.5.3 Hybrid Deployments
Chapter 2 Introduction
- 2.1 Report Objectives and Scope
- 2.2 Product Definition and Industry Terminology
- 2.3 Market Inclusions and Exclusions
- 2.4 Research Process
- 2.4.1 Primary Research and Expert Interviews
- 2.4.2 Secondary Research and Source Review
- 2.4.3 Top-Down and Bottom-Up Estimation
- 2.4.4 Data Triangulation and Verification
- 2.5 Market Size Measurement Basis
- 2.5.1 2025: USD 76.5 million → 2035: USD 720.3 million
- 2.6 Historical and Forecast Reference Periods
- 2.6.1 Historical Period: 2018-2025
- 2.6.2 Base Year: 2025
- 2.6.3 Forecast Period: 2025-2035
- 2.7 Research Assumptions and Limitations
Chapter 3 Executive Summary
- 3.1 Market Snapshot and Key Findings
- 3.2 Base-Year Market Size, 2025
- 3.3 Forecast Market Size, 2035
- 3.4 Revenue and Volume Growth Outlook
- 3.5 Key Demand and Supply Indicators
- 3.6 Leading Market Segments
- 3.7 Fastest-Growing Market Opportunities
- 3.8 Regional Performance Highlights
- 3.9 Technology and Industry Transformation
- 3.10 Competitive Landscape Summary
- 3.11 Analyst View and Strategic Implications
Chapter 4 Australia AI in Renewable Grid Balancing Systems Market Trends and Developments
- 4.1 Historical Industry Development, 2018-2025
- 4.2 Recent Market Trends and Developments
- 4.3 Demand and Customer Behavior Trends
- 4.4 Technology and Product Innovation
- 4.5 Artificial Intelligence, Automation and Digitalization
- 4.6 Local Manufacturing and Supply Chain Realignment
- 4.7 Industry Partnerships, Mergers and Acquisitions
- 4.8 Sustainability and Circular Economy Developments
- 4.9 Government and Private Sector Investment Trends
- 4.10 Emerging Business Models and Commercialization
- 4.11 Industry Developments and Announcements
Chapter 5 Australia AI in Renewable Grid Balancing Systems Market Production, Supply and Demand Analysis
- 5.1 Demand Trend and Consumption Analysis, 2018-2025
- 5.2 Demand Forecast, 2025-2035
- 5.3 Production and Output Trend, 2018-2025
- 5.4 Production and Output Forecast, 2025-2035
- 5.5 Installed Capacity and Capacity Utilization
- 5.6 Company-Wise Production Plants and Statistics
- 5.6.1 Installed Production Capacity
- 5.6.2 Actual Production
- 5.6.3 Planned Capacity and Expansion Targets
- 5.7 Supply Chain Structure and Procurement Trends
- 5.8 Supply-Demand Gap and Bottlenecks
- 5.9 Import Dependence and Sourcing Structure
- 5.10 Contract Manufacturing and Outsourcing
- 5.11 Regional Supply and Demand Concentration
Chapter 6 Australia AI in Renewable Grid Balancing Systems Market Pricing Analysis
- 6.1 Pricing Structure and Measurement
- 6.2 Historical Pricing Trends, 2018-2025
- 6.3 Pricing Outlook, 2025-2035
- 6.4 Average Selling Price and Unit Economics
- 6.5 Pricing by Product and Market Segment
- 6.6 Geographic Pricing Differences
- 6.7 Key Input, Energy, Labor and Logistics Costs
- 6.8 Contract Pricing and Purchasing Models
- 6.9 Pricing Sensitivity and Competitive Positioning
- 6.10 Price, Margin and Profitability Implications
Chapter 7 Australia AI in Renewable Grid Balancing Systems Market Dynamics
- 7.1 Market Growth Drivers
- 7.1.1 Demand-Side Drivers
- 7.1.2 Technology and Innovation Drivers
- 7.1.3 Infrastructure and Investment Drivers
- 7.1.4 Regulatory and Policy Drivers
- 7.2 Market Restraints
- 7.2.1 Cost and Affordability Constraints
- 7.2.2 Technology and Adoption Barriers
- 7.2.3 Supply Chain and Operational Constraints
- 7.3 Market Challenges
- 7.3.1 Competitive Pressure and Margin Erosion
- 7.3.2 Skills, Infrastructure and Implementation Gaps
- 7.4 Emerging Market Opportunities
- 7.5 Market Dynamics Impact and Time-Horizon Assessment
Chapter 8 Australia AI in Renewable Grid Balancing Systems Value Chain Analysis
- 8.1 Industry Value Chain Overview
- 8.2 Upstream Suppliers and Critical Inputs
- 8.3 Technology and Component Providers
- 8.4 Manufacturing or Service Delivery
- 8.5 Distribution, Channel Partners and Integrators
- 8.6 Downstream Applications and End Users
- 8.7 Value Addition and Profit Pools
- 8.8 Vertical Integration and Outsourcing
- 8.9 Supplier Concentration and Risk
- 8.10 Supply Chain Localization and Resilience
Chapter 9 Australia AI in Renewable Grid Balancing Systems Market Regulations and Policies
- 9.1 Relevant Laws, Standards and Compliance Frameworks
- 9.2 Product, Service, Safety and Quality Requirements
- 9.3 Government Policies, Incentives and Subsidies
- 9.4 Imports, Exports and Trade Barriers
- 9.5 Public Procurement and Local Content Requirements
- 9.6 Environmental and Sustainability Compliance
- 9.7 Upcoming Policy Changes and Market Implications
Chapter 10 Australia AI in Renewable Grid Balancing Systems Market Hotspots and Opportunities
- 10.1 Market Opportunity Mapping and Growth Hotspots
- 10.2 High-Growth Applications and Customer Groups
- 10.3 Underserved Markets and White-Space Opportunities
- 10.4 Emerging Technology and Product Opportunities
- 10.5 New Capacity and Investment Hotspots
- 10.6 Market Entry and Expansion Opportunities
- 10.7 Distribution and Partnership Opportunities
- 10.8 Near-Term and Long-Term Commercial Potential
- 10.9 Opportunity Attractiveness and Execution Risks
Chapter 11 Australia AI in Renewable Grid Balancing Systems Market Outlook, 2025-2035
- 11.1 Market Size and Analysis
- 11.1.1 Revenue (Market Measurement: 2025: USD 76.5 million → 2035: USD 720.3 million)
- 11.1.2 Market Volume and Quantity Sold
- 11.1.3 Historical Market Size, 2018-2025
- 11.1.4 Base-Year Market Size, 2025
- 11.2 Market Forecast, 2025-2035
- 11.2.1 Revenue Forecast to 2035
- 11.2.2 Volume Forecast to 2035
- 11.2.3 CAGR and Year-on-Year Growth
- 11.2.4 Incremental Revenue Opportunity
- 11.3 Forecast Assumptions and Scenario Analysis
- 11.3.1 Base-Case Forecast
- 11.3.2 Optimistic and Conservative Scenarios
- 11.3.3 Technology, Pricing and Policy Sensitivities
- 11.4 Market Attractiveness and Growth Outlook
Chapter 12 Australia AI in Renewable Grid Balancing Systems Market Segmentation and Outlook
- 12.1 Segmentation Summary and Market Shares, 2025
- 12.2 Largest and Fastest-Growing Segments
- 12.3 By Solution Type - Market Size and Forecast, 2025-2035
- 12.3.1 Segment Definition and Scope
- 12.3.2 Historical Market Size, 2018-2025
- 12.3.3 Revenue Forecast, 2025-2035
- 12.3.4 Volume Forecast, 2025-2035
- 12.3.5 Base-Year Market Share, 2025
- 12.3.6 Segment CAGR and Growth Drivers
- 12.3.7 Subsegment Market Size and Forecast
- 12.3.7.1 AI BESS Optimisation Software
- 12.3.7.2 AI-Powered DERMS and VPP Platforms
- 12.3.7.3 AI Grid Management Systems
- 12.3.7.4 Professional and Managed Services
- 12.3.8 Subsegment Pricing and Adoption Trends
- 12.3.9 Leading Suppliers and Competition
- 12.3.10 Regional Demand and Opportunities
- 12.4 By Customer Type - Market Size and Forecast, 2025-2035
- 12.4.1 Segment Definition and Scope
- 12.4.2 Historical Market Size, 2018-2025
- 12.4.3 Revenue Forecast, 2025-2035
- 12.4.4 Volume Forecast, 2025-2035
- 12.4.5 Base-Year Market Share, 2025
- 12.4.6 Segment CAGR and Growth Drivers
- 12.4.7 Subsegment Market Size and Forecast
- 12.4.7.1 Storage and Renewable Asset Operators
- 12.4.7.2 Network and System Operators
- 12.4.7.3 Retailers and DER Aggregators
- 12.4.8 Subsegment Pricing and Adoption Trends
- 12.4.9 Leading Suppliers and Competition
- 12.4.10 Regional Demand and Opportunities
- 12.5 By Application - Market Size and Forecast, 2025-2035
- 12.5.1 Segment Definition and Scope
- 12.5.2 Historical Market Size, 2018-2025
- 12.5.3 Revenue Forecast, 2025-2035
- 12.5.4 Volume Forecast, 2025-2035
- 12.5.5 Base-Year Market Share, 2025
- 12.5.6 Segment CAGR and Growth Drivers
- 12.5.7 Subsegment Market Size and Forecast
- 12.5.7.1 Energy and Ancillary-Service Co-Optimisation
- 12.5.7.2 Distributed Flexibility Dispatch
- 12.5.7.3 Network Balancing and Renewable Forecasting
- 12.5.8 Subsegment Pricing and Adoption Trends
- 12.5.9 Leading Suppliers and Competition
- 12.5.10 Regional Demand and Opportunities
- 12.6 By Deployment Model - Market Size and Forecast, 2025-2035
- 12.6.1 Segment Definition and Scope
- 12.6.2 Historical Market Size, 2018-2025
- 12.6.3 Revenue Forecast, 2025-2035
- 12.6.4 Volume Forecast, 2025-2035
- 12.6.5 Base-Year Market Share, 2025
- 12.6.6 Segment CAGR and Growth Drivers
- 12.6.7 Subsegment Market Size and Forecast
- 12.6.7.1 Cloud-Hosted Platforms
- 12.6.7.2 On-Premises Systems
- 12.6.7.3 Hybrid Deployments
- 12.6.8 Subsegment Pricing and Adoption Trends
- 12.6.9 Leading Suppliers and Competition
- 12.6.10 Regional Demand and Opportunities
- 12.7 Segment Growth Comparison
- 12.8 Segment Attractiveness and Priority Matrix
Chapter 13 Australia AI in Renewable Grid Balancing Systems End-Use and Application Market Outlook
- 13.1 End-Use Industry and Customer Demand Structure
- 13.2 Leading Applications and Customer Groups
- 13.3 End-Use Market Size, Share and Forecast
- 13.4 Major End-Use Industry Deep Dives
- 13.4.1 Customer Requirements and Use Cases
- 13.4.2 Demand and Replacement Cycles
- 13.4.3 Technical and Regulatory Considerations
- 13.4.4 Purchasing and Procurement Models
- 13.4.5 Leading Vendors and Distribution Channels
- 13.4.6 Forecast and Commercial Opportunities
- 13.5 Emerging Applications and Cross-Segment Demand
- 13.6 End-Use Industry Investment Priorities
Chapter 14 Australia AI in Renewable Grid Balancing Systems Geographic Market Outlook, 2025-2035
- 14.1 Domestic Market Distribution and Demand Clusters
- 14.2 State- or Province-Wise Market Size and Forecast, 2025-2035
- 14.3 City and Metropolitan Market Outlook
- 14.4 Industrial, Manufacturing and Commercial Clusters
- 14.5 Geographic Concentration of Key End Users
- 14.6 Local Pricing and Purchasing Differences
- 14.7 Domestic Production Facilities and Capacity Map
- 14.8 Local Infrastructure and Project Pipeline
- 14.9 State-Level Policy and Incentive Differences
- 14.10 Subnational Investment Hotspots and Opportunities
- 14.11 Distribution and Logistics Networks
- 14.12 Domestic Competitive Footprint
Chapter 15 Australia AI in Renewable Grid Balancing Systems Technology, Innovation and Sustainability Outlook
- 15.1 Technology Landscape and Maturity
- 15.2 Product, Process and Service Innovation
- 15.3 AI, Automation and Digital Tools in the Industry
- 15.4 Technology Adoption and Performance Benchmarking
- 15.5 Innovation Pipeline and R&D Investment
- 15.6 Patent and Intellectual Property Trends
- 15.7 Energy Efficiency and Resource Management
- 15.8 Sustainability, Recycling and Circularity
- 15.9 Technology Roadmap, 2025-2035
- 15.10 Risks of Obsolescence and Technology Substitution
Chapter 16 Australia AI in Renewable Grid Balancing Systems Market Key Strategic Imperatives
- 16.1 Growth and Market Entry Priorities
- 16.2 High-Return Products and Segments
- 16.3 Pricing, Profitability and Cost Optimization
- 16.4 Technology Investment and Product Differentiation
- 16.5 Supply Chain Localization and Resilience
- 16.6 Distribution and Customer Acquisition
- 16.7 Partnership, Acquisition and Capacity Strategy
- 16.8 Regional Expansion Priorities
- 16.9 Short-, Medium- and Long-Term Actions
Chapter 17 Competition Outlook
- 17.1 Industry Competition Characteristics
- 17.2 Market Structure and Concentration
- 17.3 Market Share and Competitive Positioning, 2025
- 17.4 Company-Wise Revenue and Product Benchmarking
- 17.5 Production and Service Capacity Benchmarking
- 17.6 Technology, Pricing and Differentiation
- 17.7 Regional Footprint and Distribution Strength
- 17.8 Mergers, Acquisitions and Strategic Alliances
- 17.9 New Entrants and Competitive Threats
- 17.10 Porter's Five Forces and Industry Attractiveness
- 17.11 Competitive Outlook, 2025-2035
Chapter 18 Company Profiles
- 18.1 Company Coverage and Selection Criteria
- 18.2 Tesla
- 18.2.1 Business Description
- 18.2.2 Company Ownership and Geographic Presence
- 18.2.3 Product and Service Portfolio
- 18.2.4 Manufacturing and Operating Footprint
- 18.2.5 Production Capacity and Expansion Plans
- 18.2.6 Financial Performance and Investment
- 18.2.7 Market Share and Competitive Position
- 18.2.8 Technology and Innovation Capabilities
- 18.2.9 Strategic Alliances or Partnerships
- 18.2.10 Recent Developments
- 18.2.11 Growth Strategy and Outlook
- 18.3 Fluence
- 18.4 Siemens
- 18.5 Schneider Electric
- 18.6 GE Vernova
- 18.7 Hitachi Energy
- 18.8 Energy One
- 18.9 AGL Energy
- 18.10 Origin Energy
- 18.11 OptiGrid
- 18.12 Other Relevant Market Participants
Note: Every listed company is profiled on the structure shown under the first company. The company list is preliminary and may change based on research findings, market developments, data availability and client requirements.
Chapter 19 Disclaimer
- 19.1 Research and Forecast Disclaimer
- 19.2 Data Source and Estimation Limitations
Note: The depth of individual sections depends on data availability for this market. Volume, capacity, trade and other unit-based metrics are included where applicable.

