
Export cargo and parcel density pull shippers to providers
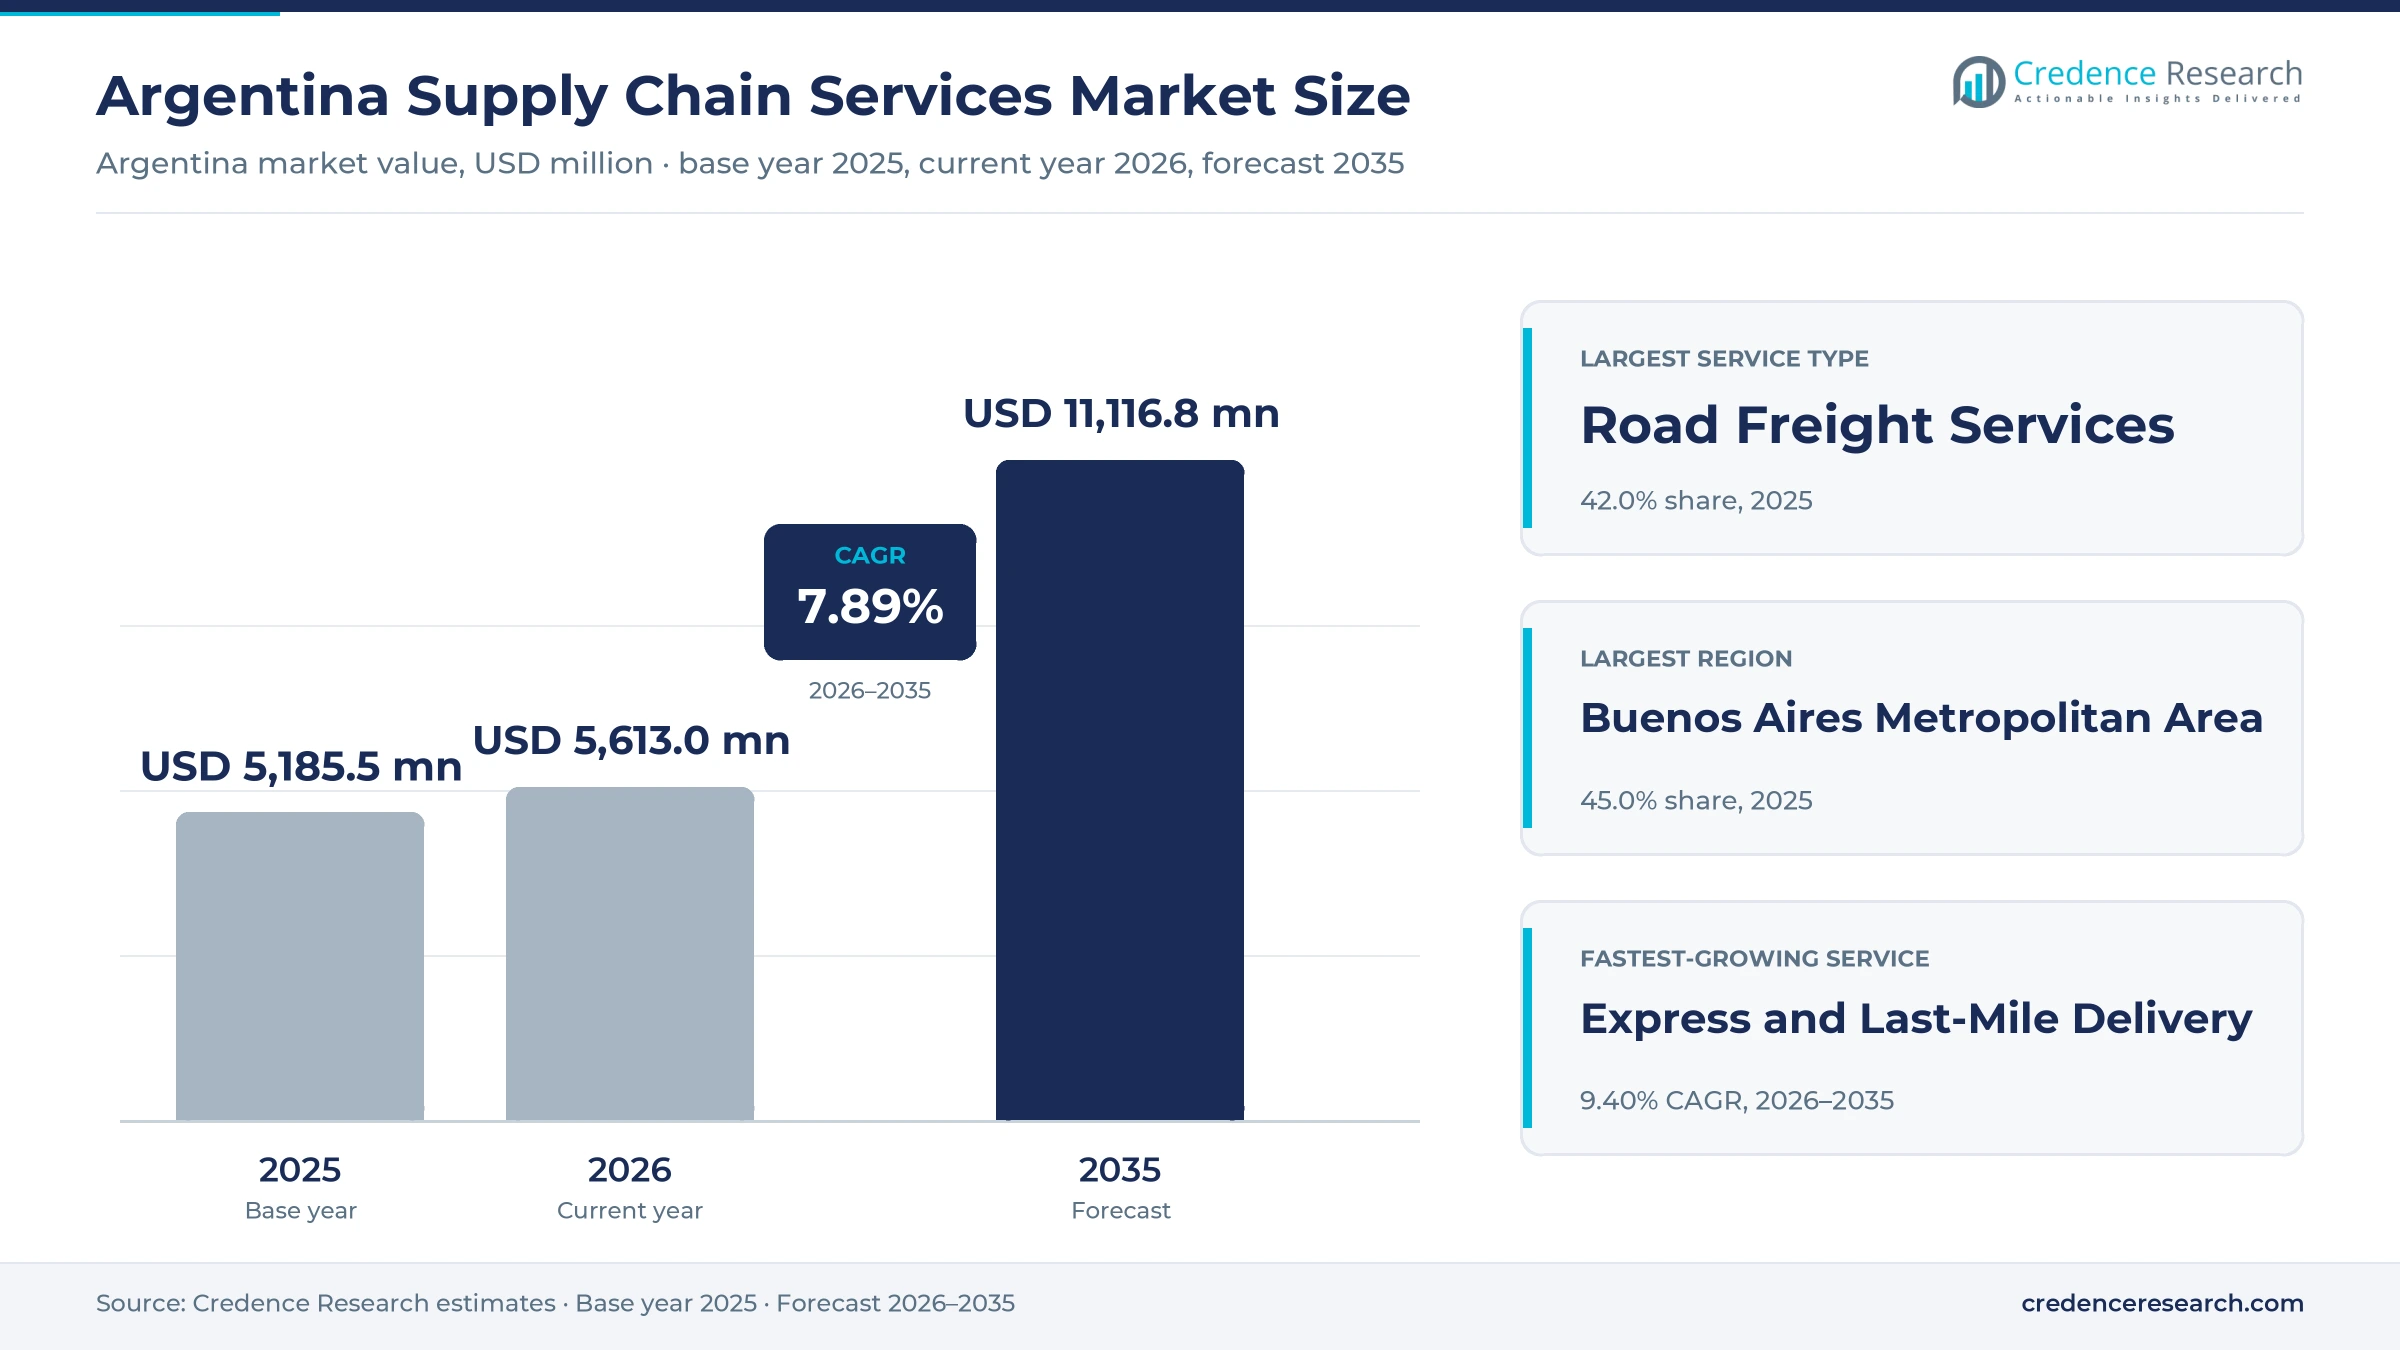
The Argentina supply chain services market was valued at USD 5.19 billion in 2025 and is projected to increase from USD 5.61 billion in 2026 to USD 11.12 billion by 2035, registering a CAGR of 7.89% during 2026–2035. Demand comes from grain and food exporters, manufacturers, online retailers, laboratories and mining and energy companies that buy freight, storage, forwarding and delivery from outside providers. The Buenos Aires Metropolitan Area held the largest regional share, 45.0% in 2025, because the zone concentrates consumers, the main container port and what La Nación describes as the most automated logistics hub in the country. Patagonia is the fastest-growing region at 9.24% a year, as Vaca Muerta crude and gold exports lift demand for long-distance supply lines. The freight rail concession tender, with bids scheduled for Nov. 11, 2026, could change how bulk cargo reaches the ports, because rail moves only a small part of national cargo today.
What does the Argentine logistics provider estimate count?
The estimate measures the fees that shippers in Argentina pay to outside providers for road freight, warehousing and contract logistics, international freight forwarding, cold chain logistics and express delivery. Buyers range from enterprise shippers on multi-year contracts to small merchants and individual senders who book single parcels.
The estimate excludes trucks and warehouses that shippers run themselves, port terminal charges and the value of the goods carried. The value chain runs from carriers, warehouse developers and technology vendors through integrated operators and forwarders to the companies that buy their services in each province.
Argentina Supply Chain Services Market Insights
- The Argentina supply chain services market was valued at USD 5.19 billion in 2025 and is projected to reach USD 11.12 billion by 2035, registering a CAGR of 7.89% during 2026–2035.
- The Buenos Aires Metropolitan Area held a 45.0% share of 2025 value, supported by the port that handled 85% of national container traffic that year.
- Road freight services led with a 42.0% share of 2025 value, because rail carries less than 5% of cargo moved across the country.
- Courier imports reached USD 855 million from January to August 2026, up 71.1% on the year, according to iProfesional, which lifts express and last-mile work.
- Andreani completed a USD 30 million investment in a General Pacheco plant in April 2026, with capacity to process up to 26,000 packages per hour.
Road freight leads while express delivery grows fastest
Why do road freight services hold the largest share?
Based on service type, the market is categorized into Road Freight Services, Warehousing and Contract Logistics, International Freight Forwarding, Cold Chain Logistics and Express and Last-Mile Delivery. Road Freight Services led with a 42.0% share of 2025 value, because Córdoba to Rosario takes four days by rail against about nine hours for a modern train, according to El Economista in August 2026. Express and Last-Mile Delivery grows fastest at 9.40% a year, as courier imports reached USD 855 million from January to August 2026, up 71.1%, according to iProfesional, citing INDEC data.
How much room does rail have against road-led services?
Based on mode of transport, the market is categorized into Road-Led Services, Ocean-Led Services, Air-Led Services, Rail-Led Services and Multimodal Services. Road-Led Services led with a 66.0% share of 2025 value, because grain makes up about four-fifths of current rail freight, according to El Economista, which leaves most other inland cargo on trucks. Rail-Led Services grow fastest at 9.89% a year from a small base, as the government aims to lift rail from under 5% of cargo to 20% to 25% in a few years, according to El Economista on Aug. 31, 2026.
Which industries buy the most outside logistics?
Based on end-use industry, the market is categorized into Agriculture and Food, Manufacturing and Materials, Retail and Consumer Services, Healthcare and Pharmaceuticals and Mining and Energy. Agriculture and Food led with a 30.0% share of 2025 value, because the soy complex alone exported USD 21.44 billion, 24.6% of the 2025 total, according to INDEC data reported by Bichos de Campo. Mining and Energy grows fastest at 9.30% a year, as Patagonia gained 1.2 percentage points of national exports in 2025, according to Ámbito.
Why do dedicated contracts remain the main buying model?
Based on business model, the market is categorized into Dedicated Contract Services, Shared-User Contract Services, Spot Transaction Services and Managed Platform Services. Dedicated Contract Services led with a 40.0% share of 2025 value, because large shippers want assigned sites and staff, as with the three-year Volkswagen parts contract that CEVA Logistics signed in July 2022. Managed Platform Services grow fastest at 9.63% a year, as Andreani lets small sellers on Tienda Nube add a shipping button to reach the whole country, according to Forbes Argentina in May 2026.
| Segment Group | Leading Sub-segment | Share, 2025 | Fastest-growing Sub-segment | CAGR, 2026–2035 |
|---|---|---|---|---|
| By Service Type | Road Freight Services | 42.0% | Express and Last-Mile Delivery | 9.40% |
| By Mode of Transport | Road-Led Services | 66.0% | Rail-Led Services | 9.89% |
| By End-Use Industry | Agriculture and Food | 30.0% | Mining and Energy | 9.30% |
| By Business Model | Dedicated Contract Services | 40.0% | Managed Platform Services | 9.63% |
Request a Free Sample
Fill in your details and we'll send you a free sample report.
- Sample data tables & charts
- Research methodology
Parcels, exports and outsourcing widen provider workloads
How does e-commerce fulfillment density change network design?
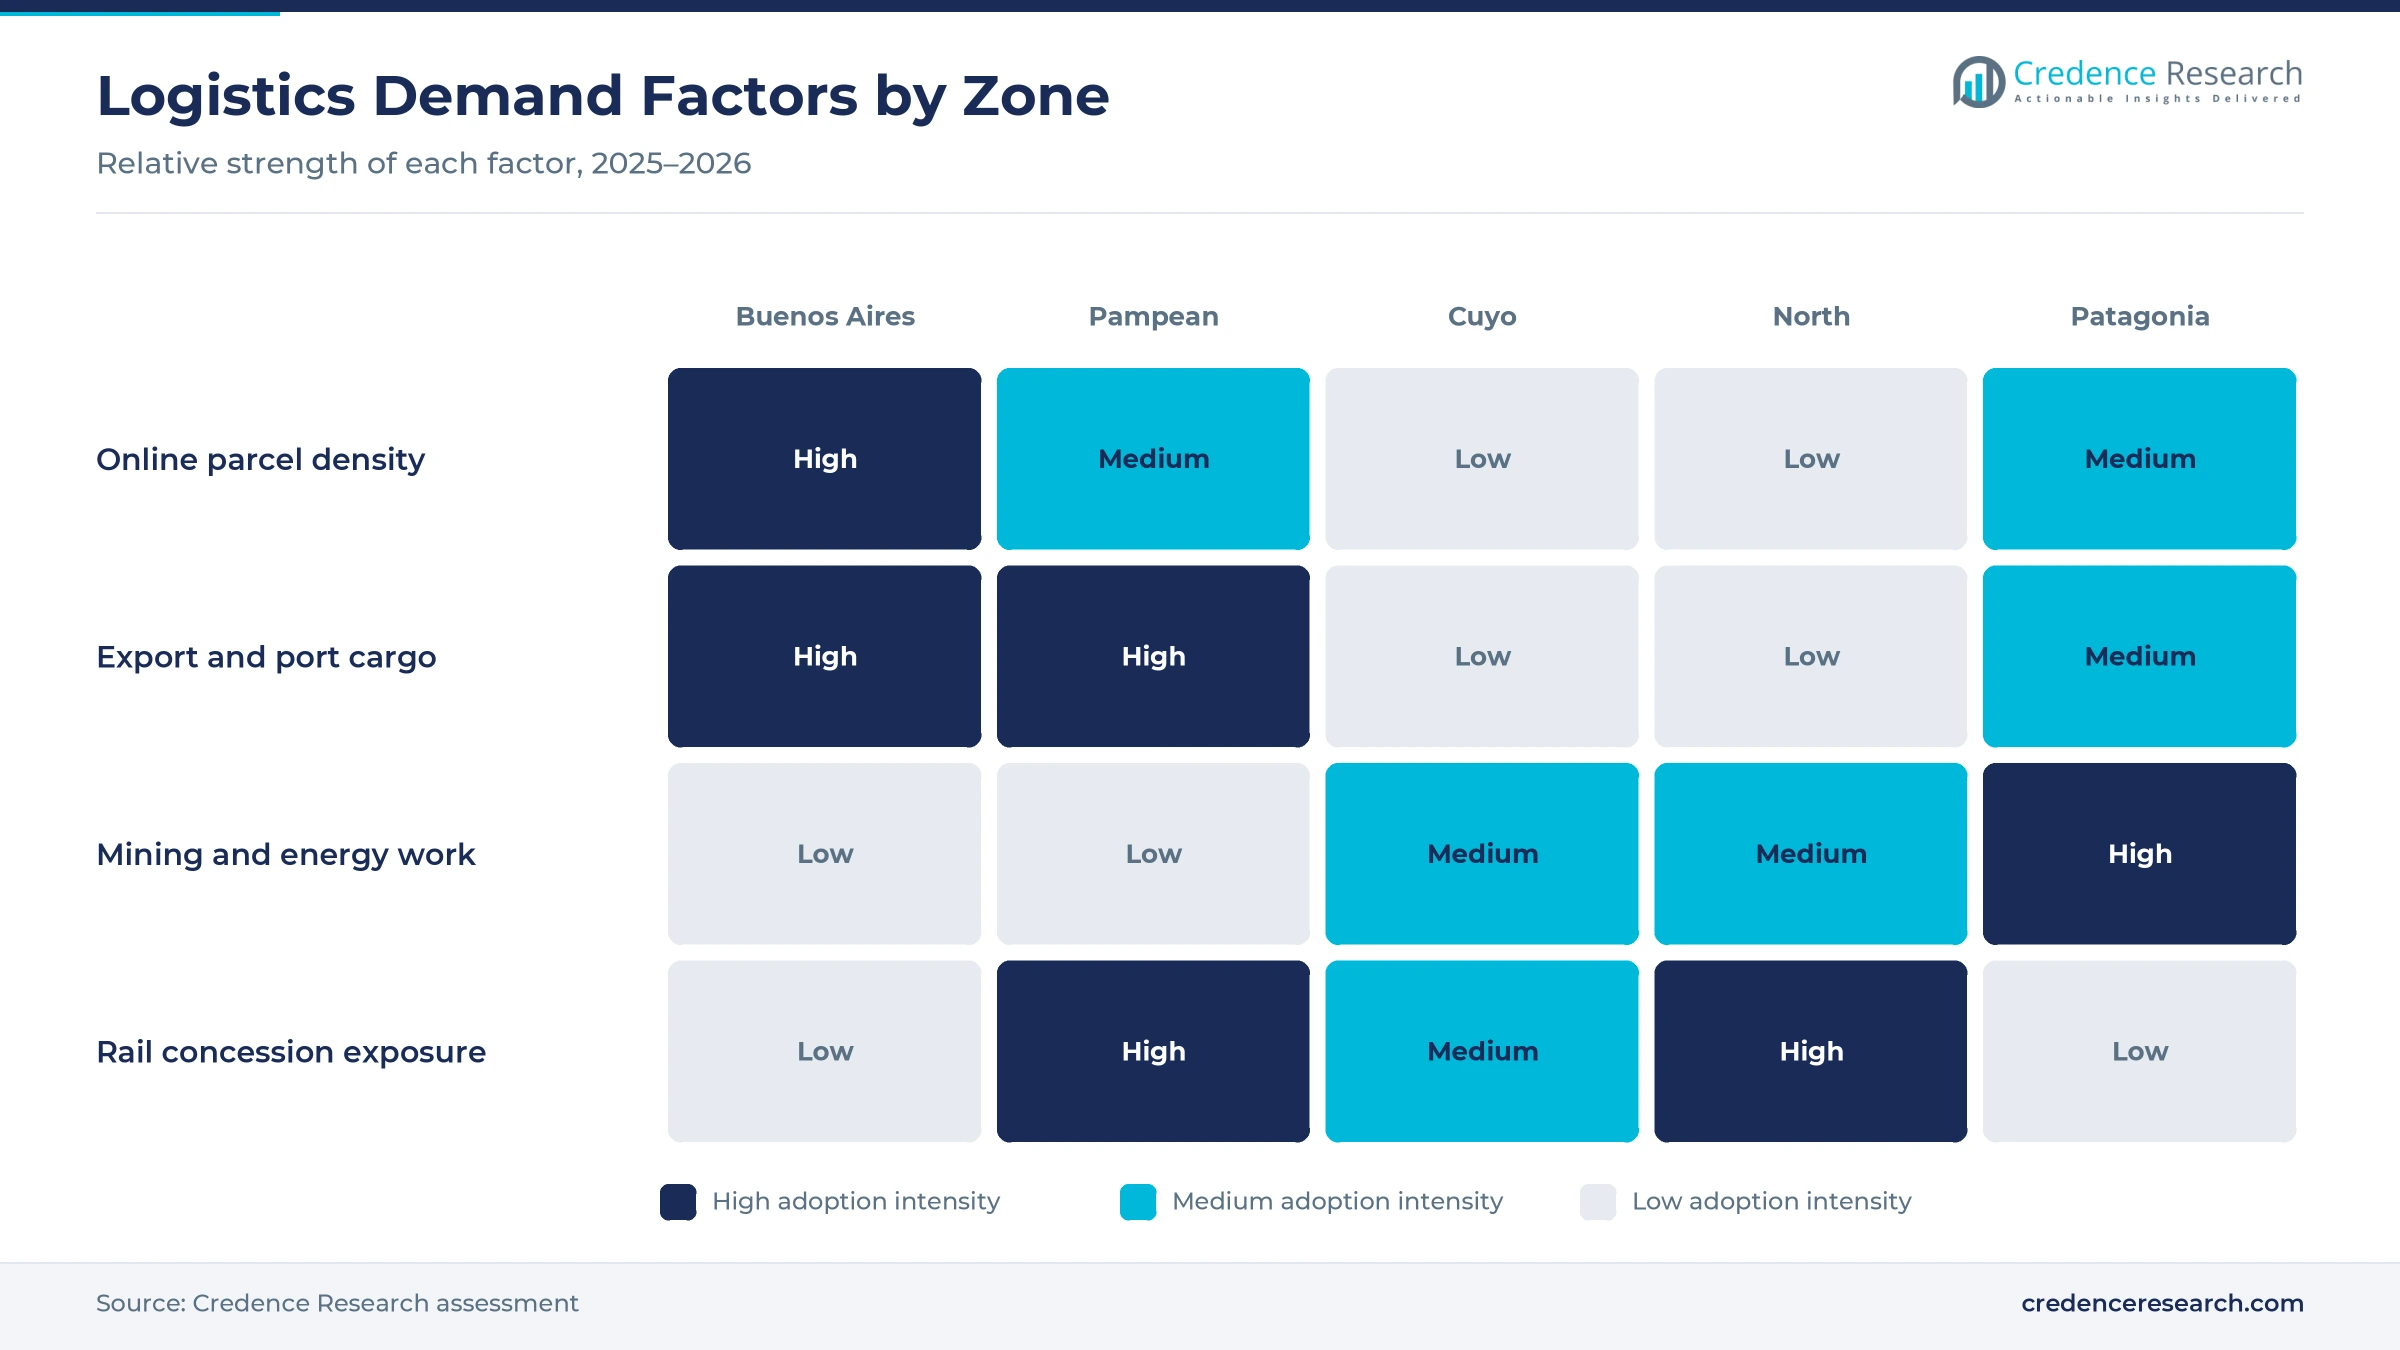
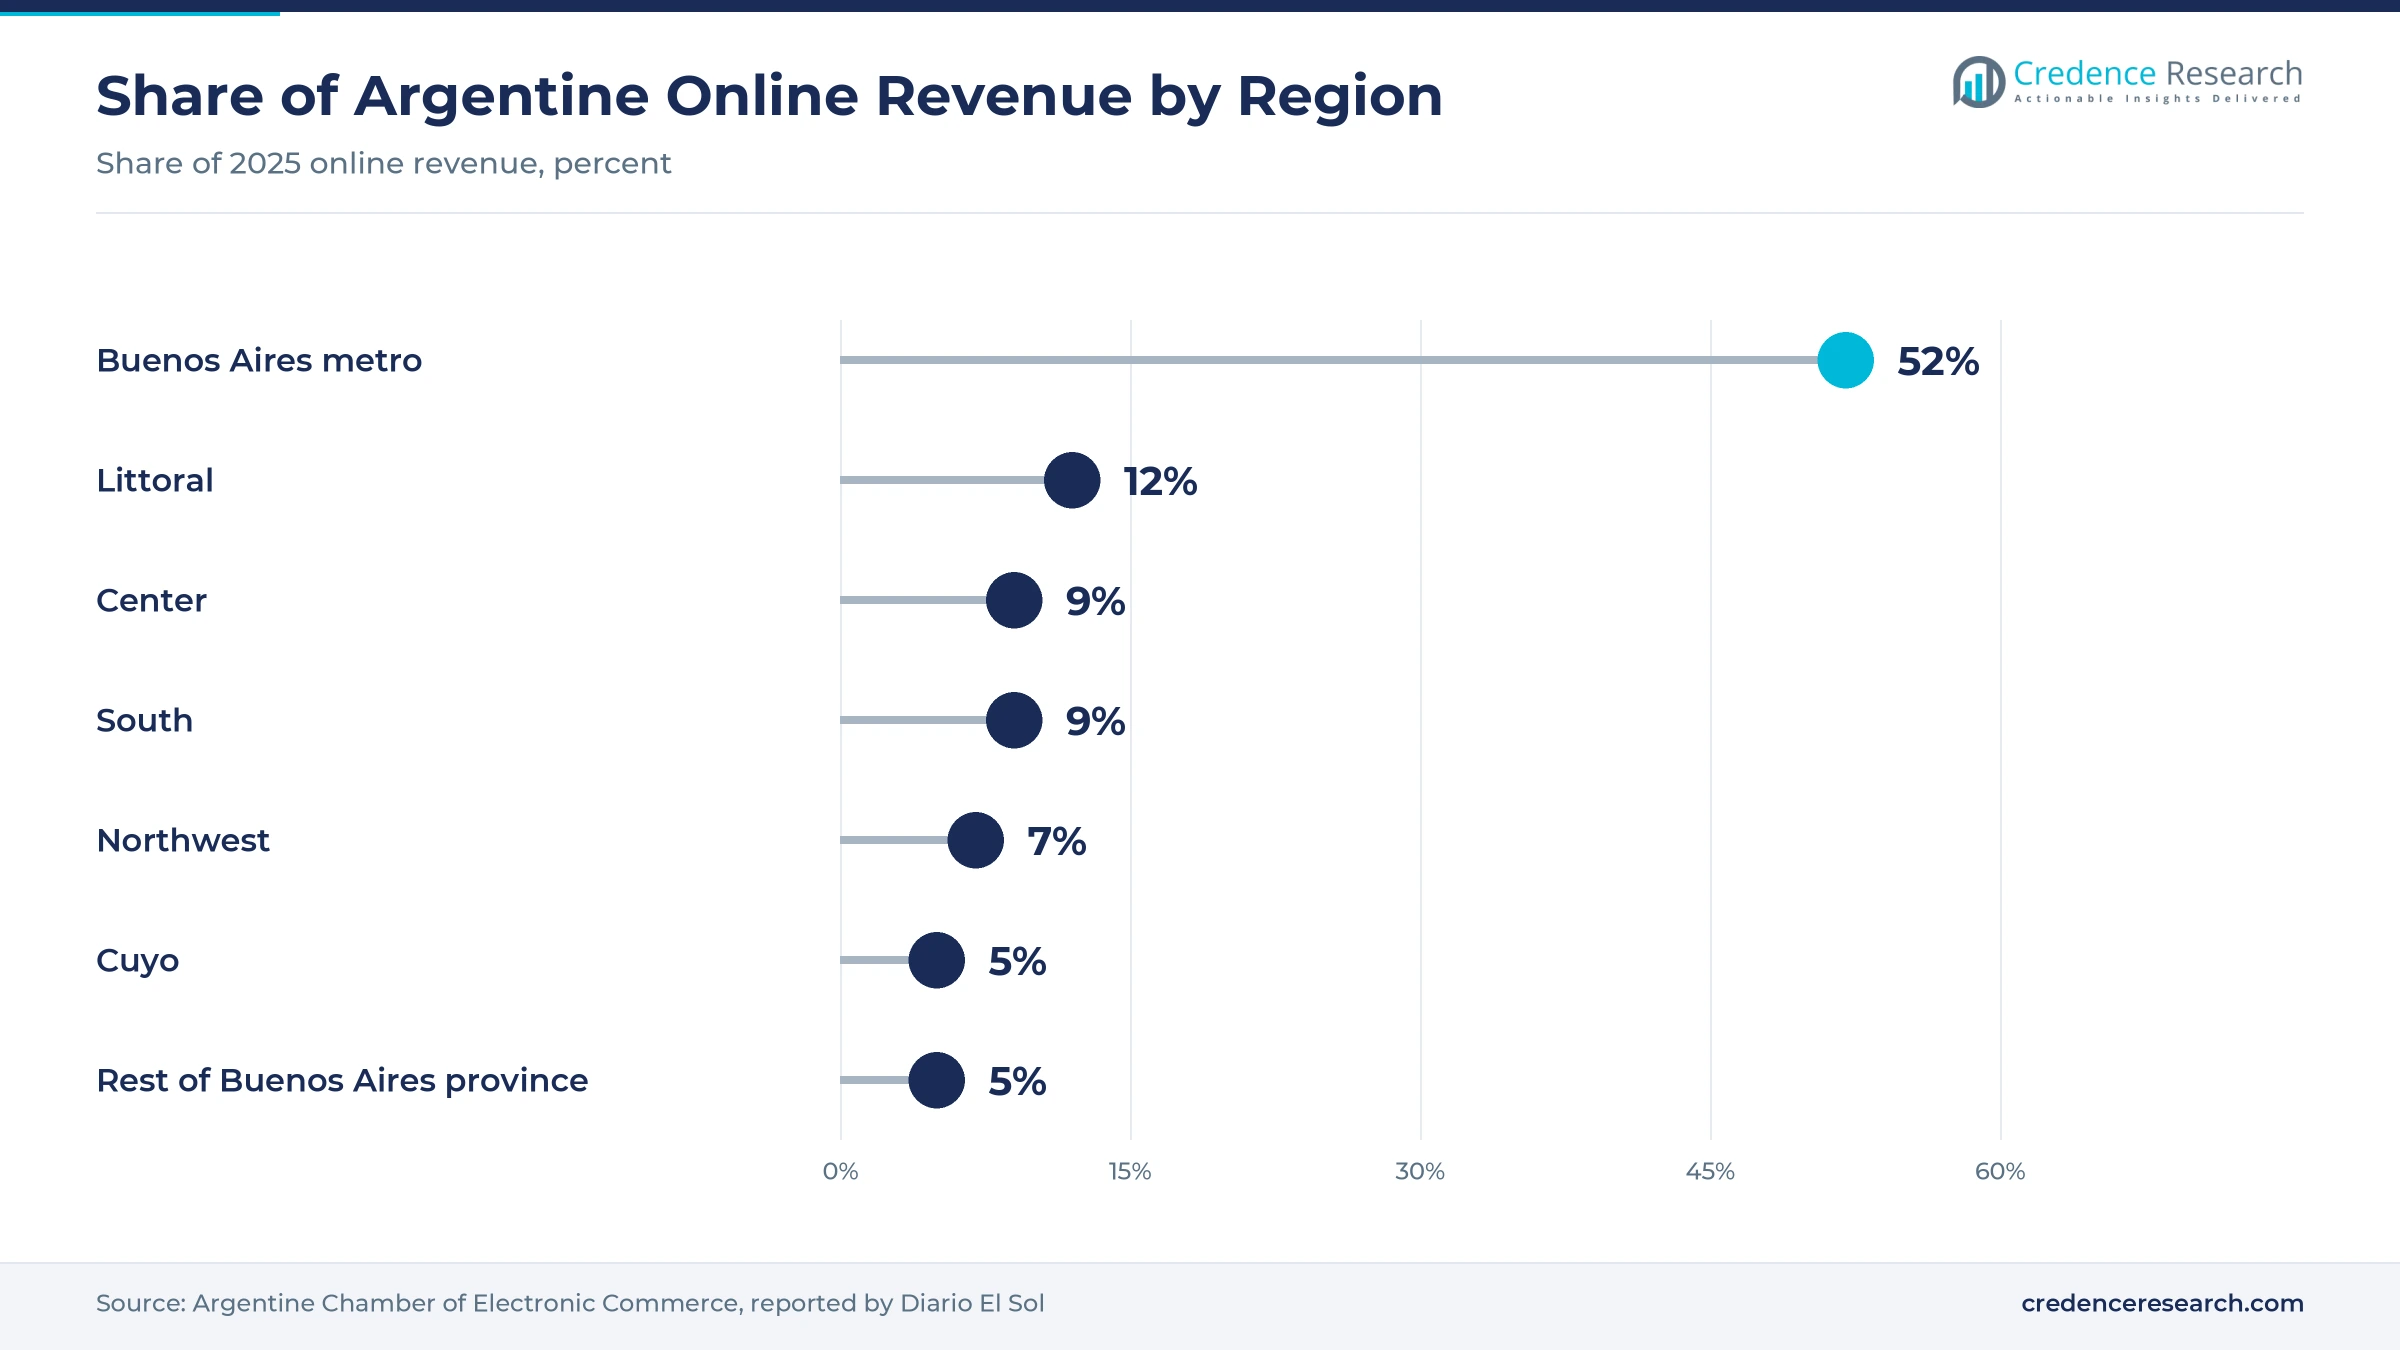
Heavier baskets and clustered demand push retailers toward providers with automated sorting near the capital, because few sellers can fund those sites alone. Online sales moved 645 million units in 2025, up more than 28%, while orders grew only 3%, according to the Argentine Chamber of Electronic Commerce as reported by Revista Mercado. The metropolitan area produced 52% of online revenue, according to chamber data reported by Diario El Sol in March 2026. Andreani completed a USD 30 million plant in General Pacheco able to process up to 26,000 packages per hour, according to La Nación on April 28, 2026. As a result, express and last-mile delivery grows fastest among service types at 9.40% a year.
Why does export shipment recovery lift forwarding work?
Higher trade volumes return cargo to forwarders, customs brokers and inland carriers after several weak years at the ports. Goods exports reached USD 87.08 billion in 2025, against imports of USD 75.79 billion, according to INDEC in its release of Jan. 20, 2026. National container traffic rose 45% to 2.1 million TEU in 2025, according to Container News from a low of 1.47 million TEU in 2024 on World Bank data. The beef trade alone shipped about USD 3.81 billion in 2025, according to the Argentine Beef Promotion Institute, citing INDEC data. In turn, freight forwarding and ocean-led contracts win back volume that shrank through 2024.
What pushes shippers toward integrated outsourcing?
Shippers that once bought trucks and storage separately now ask one provider to manage customs, warehousing and transport together, which enlarges each contract. Andreani created an international cargo company offering customs clearance, bonded storage and forwarding, according to El Cronista on Sept. 22, 2025. An ARLOG survey of more than 500 professionals found that 80% of logistics companies planned investments in 2026, and 70% of them would add warehouse capacity, according to BAE Negocios. IDB Invest arranged up to USD 100 million for developer Plaza Logística on Dec. 16, 2025. This capacity supports third-party logistics contracts for shippers that stop running their own sites. Managed platform services also grow fastest by business model at 9.63% a year.
How do courier rules add cross-border parcel work?
Looser import rules created a new stream of small shipments that need clearance, sorting and home delivery from specialist providers. The tax agency ARCA raised the courier limit to USD 3,000 per shipment under General Resolution 5608, according to its notice of December 2024. Door-to-door purchases then reached USD 894 million in 2025, up 274.2%, according to NoticiasNQN. Andreani was processing 500,000 international packages a month in April 2026 and expected 700,000 to 800,000 by August, according to Oscar Andreani. iProfesional reported a projection of courier imports above USD 1.2 billion in 2026. As a result, air-led services gain steady express cargo through the capital.
Automation, mining cargo and rail reshape provider networks
How is the shift toward automated hubs changing service levels?
Providers are replacing manual sorting with automated lines and predictive routing, which raises throughput and tightens delivery promises for shippers. Andreani inaugurated a Chinese-made sorter at a 20,000 square meter plant that can expand by another 70,000 square meters, according to Forbes Argentina in May 2026. The same company handles about 5 million shipments a month and uses artificial intelligence to predict volume and routes. In the ARLOG survey published on Nov. 10, 2025, 79% of companies planning to invest named storage technology, robotics, automation, artificial intelligence or security systems. As a result, warehouse management systems now feature more often in provider tenders.
Why is the rise in mining and energy cargo reshaping portfolios?
Oil and gold projects far from the capital create contract work that needs traceability, security and long-distance fleets rather than bulk haulage alone. Patagonia raised its share of national exports to 14.5% in 2025 from 13.3% in 2024, as Neuquén crude and Santa Cruz gold grew, according to Ámbito. Andreani chief executive Carlos Cirimelo named mining among the segments growing the most, according to Forbes Argentina in May 2026. DHL Express opened a Neuquén branch in early 2025, reaching 28 branches nationwide, according to Revista Mercado. Mining and Energy therefore grows fastest among end-use industries at 9.30% a year.
Can the freight rail concession open multimodal contracts?
The Belgrano Cargas tender gives providers an opening to design rail and truck services for inland shippers that today have no practical alternative to road. The 50-year concession covers more than 7,500 kilometers of track in 16 provinces and requires at least USD 800 million in works during its first five years, according to El Economista. Grain makes up about 80% of rail cargo, which ties early demand to the grain trade in the interior. Bidders are selected on investment commitments rather than price, according to the same report. Rail-led services therefore grow fastest by mode at 9.89% a year.
Is there room for new inland hubs and regional delivery?
Demand outside the capital is still served largely from Buenos Aires, which leaves an opening for regional storage and faster delivery in the provinces. Mercado Libre announced a USD 91 million, 60,000 square meter center in Estación Juárez Celman, Córdoba, to serve the center, northwest and northeast, according to El Economista. Urbano plans USD 30 million over three years, mainly in Junín, Córdoba, Mendoza and Santa Fe, according to El Cronista in October 2024. Mercado Libre also added air delivery to four Patagonian destinations in May 2026. In turn, home delivery routes become more viable in smaller provincial cities served from Buenos Aires today.
Truck costs, flat volumes and roads test Argentine providers
How do truck operating costs squeeze provider margins?
Road costs are rising faster than shippers can reprice contracts, which puts pressure on carriers in the largest service type. The FADEEAC transport cost index rose 22.2% in the first half of 2026 and 47% on the year, with diesel up 34% to June, according to Memo on July 16, 2026. Dedicated and spot carriers therefore absorb losses between price reviews. Many providers respond with indexation clauses and shorter contract terms, which protect margins but make budgeting harder for shippers.
Why do flat domestic volumes limit new capacity returns?
New automated capacity is arriving while domestic shipment counts have stopped growing, which leaves sites underused during weak consumer periods. Andreani expects to finish 2026 with volumes similar to 2025 despite its new Pacheco plant, according to Forbes Argentina in May 2026. Online orders grew only 3% in 2025, according to the electronic commerce chamber. As a result, providers compete harder on rates for the same shippers, and many diversify into cross-border and mining work.
How do road and rail gaps raise delivery costs?
Long distances and poor roads raise transit times, which hurts shippers in the north and south more than those near the capital. Road infrastructure was the top pending issue for 90% of respondents in the ARLOG survey reported by BAE Negocios on Nov. 10, 2025. Rail offers little relief today, since Córdoba to Rosario takes four days. Shippers therefore hold more inventory in the interior, while providers wait for concession works that begin only after the award.
Why does operator financial strain worry shippers?
Financial stress at a large parcel network shows the credit and continuity risk that shippers carry when they rely on one provider. OCA Log, which controlled OCA, was in preventive insolvency proceedings with claims above ARS 101.2 billion when COC Global Enterprise agreed to take control, according to El Cronista on Dec. 12, 2025. OCA itself has about 9,500 workers and 760 service points nationwide. Shippers respond by splitting volume between providers, which limits the scale gains from outsourcing.
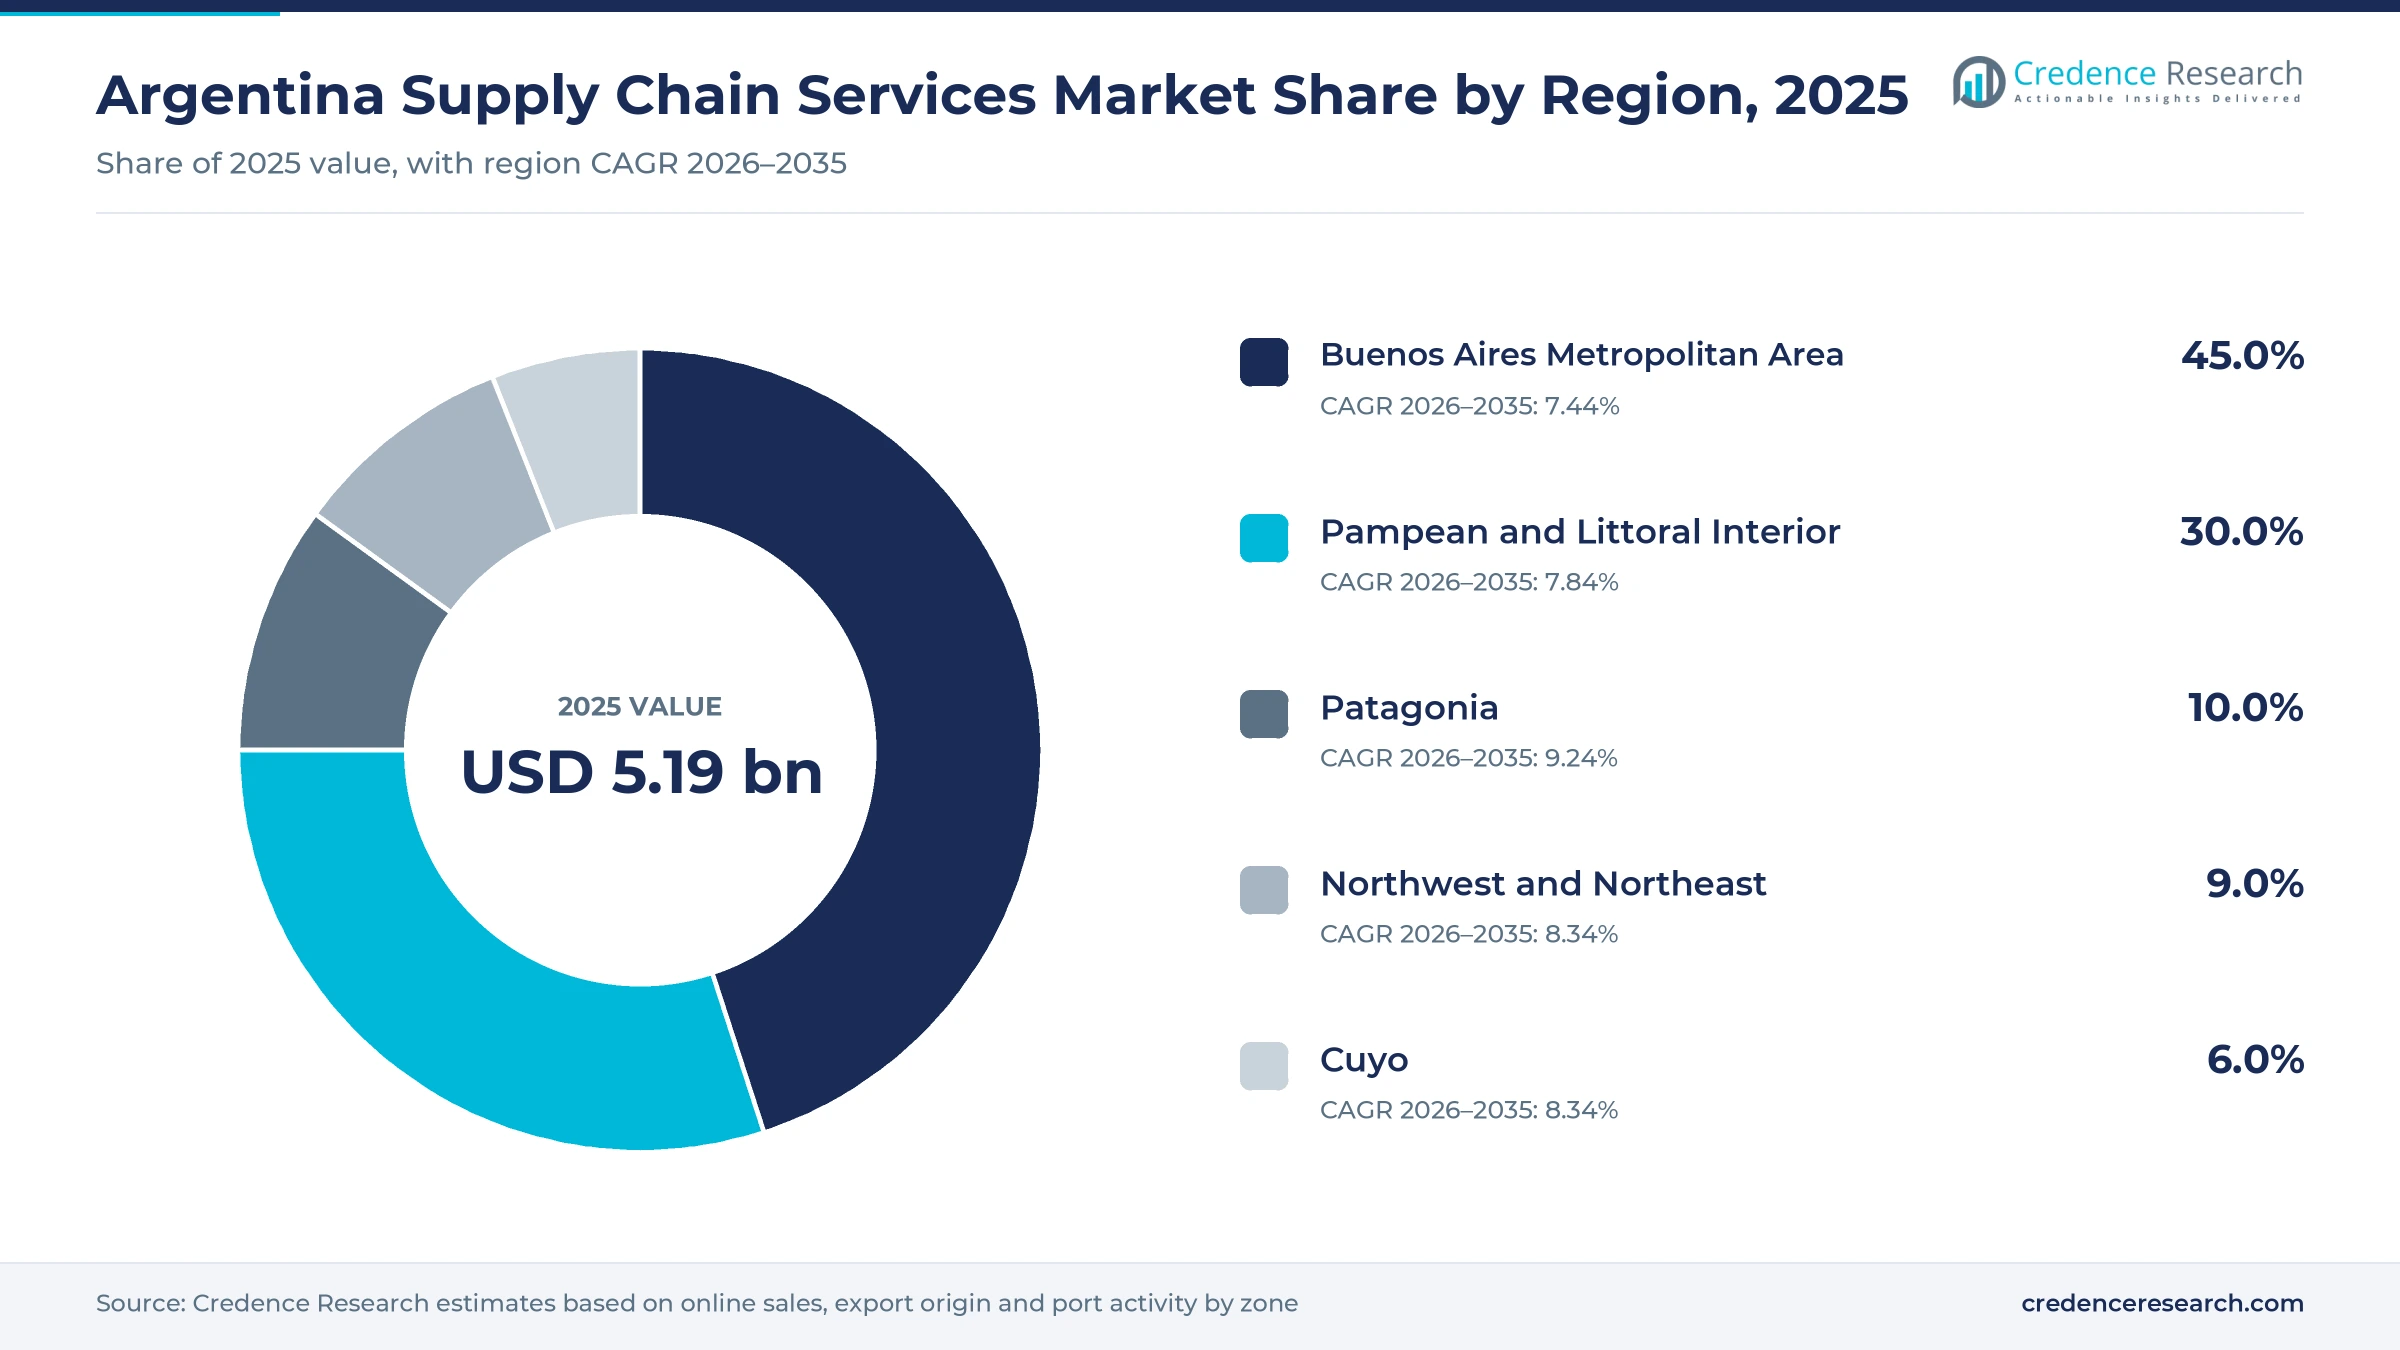
Buenos Aires leads while Patagonia grows fastest
| Region | Value, 2025 (USD billion) | Share, 2025 | CAGR, 2026–2035 |
|---|---|---|---|
| Buenos Aires Metropolitan Area | 2.33 | 45.0% | 7.44% |
| Pampean and Littoral Interior | 1.56 | 30.0% | 7.84% |
| Patagonia | 0.52 | 10.0% | 9.24% |
| Northwest and Northeast | 0.47 | 9.0% | 8.34% |
| Cuyo | 0.31 | 6.0% | 8.34% |
Port traffic and parcel hubs keep Buenos Aires ahead
The Buenos Aires Metropolitan Area held a 45.0% share of 2025 value and grows at 7.44% a year. The Port of Buenos Aires handled 1.78 million TEU in 2025, 85% of the national total, according to Container News. The zone also generated 52% of online revenue, according to chamber data, and hosts the Andreani Pacheco plant. Mercado Libre announced a USD 115 million center of more than 100,000 square meters in Escobar in March 2026. Parcel and contract work therefore stay concentrated around the capital, where those hubs sit.
Grain ports and factories anchor the Pampean interior
The Pampean and Littoral Interior held a 30.0% share of 2025 value and grows at 7.84% a year. The Port of Rosario moved 3,570,924 metric tons in 2025, up 63.1%, according to the Santa Fe production ministry as reported by La Capital. CEVA Logistics took on inbound parts and line feeding for the Volkswagen plant in Córdoba under a contract announced in July 2022. The planned Mercado Libre center in Córdoba should add regional storage and distribution work for local providers.
Why does Patagonia grow fastest?
Patagonia held a 10.0% share of 2025 value and grows fastest at 9.24% a year. The south supplied 14.5% of national exports in 2025, led by Neuquén crude and Santa Cruz gold, according to Ámbito, while it produced 9% of online revenue, according to chamber data. Mercado Libre added air delivery to four Patagonian destinations in May 2026, and DHL Express opened a Neuquén branch in early 2025. Providers are therefore adding long-distance capacity for both energy projects and household parcels.
Inland centers could lift the northwest and northeast
The Northwest and Northeast held a 9.0% share of 2025 value and grows at 8.34% a year. The northwest supplied 5.8% of national exports in 2025 and the northeast 1.3%, according to Ámbito, which leaves a thin base of contract cargo. The rail concession spans 16 provinces, and long hauls to the ports give northern shippers a strong interest in its outcome. The planned Córdoba center is also intended to speed Mercado Libre deliveries to both northern zones.
Wine exports and new branches support Cuyo
Cuyo held a 6.0% share of 2025 value and grows at 8.34% a year. The zone supplied 5% of national exports in 2025, according to Ámbito, and the same share of online revenue, according to chamber data reported by Diario El Sol. DHL Express announced a Mendoza branch in October 2024 alongside a service that helps local wineries export, according to El Cronista. Urbano also lists Mendoza among its planned expansion sites, which should widen delivery options for merchants in the zone.
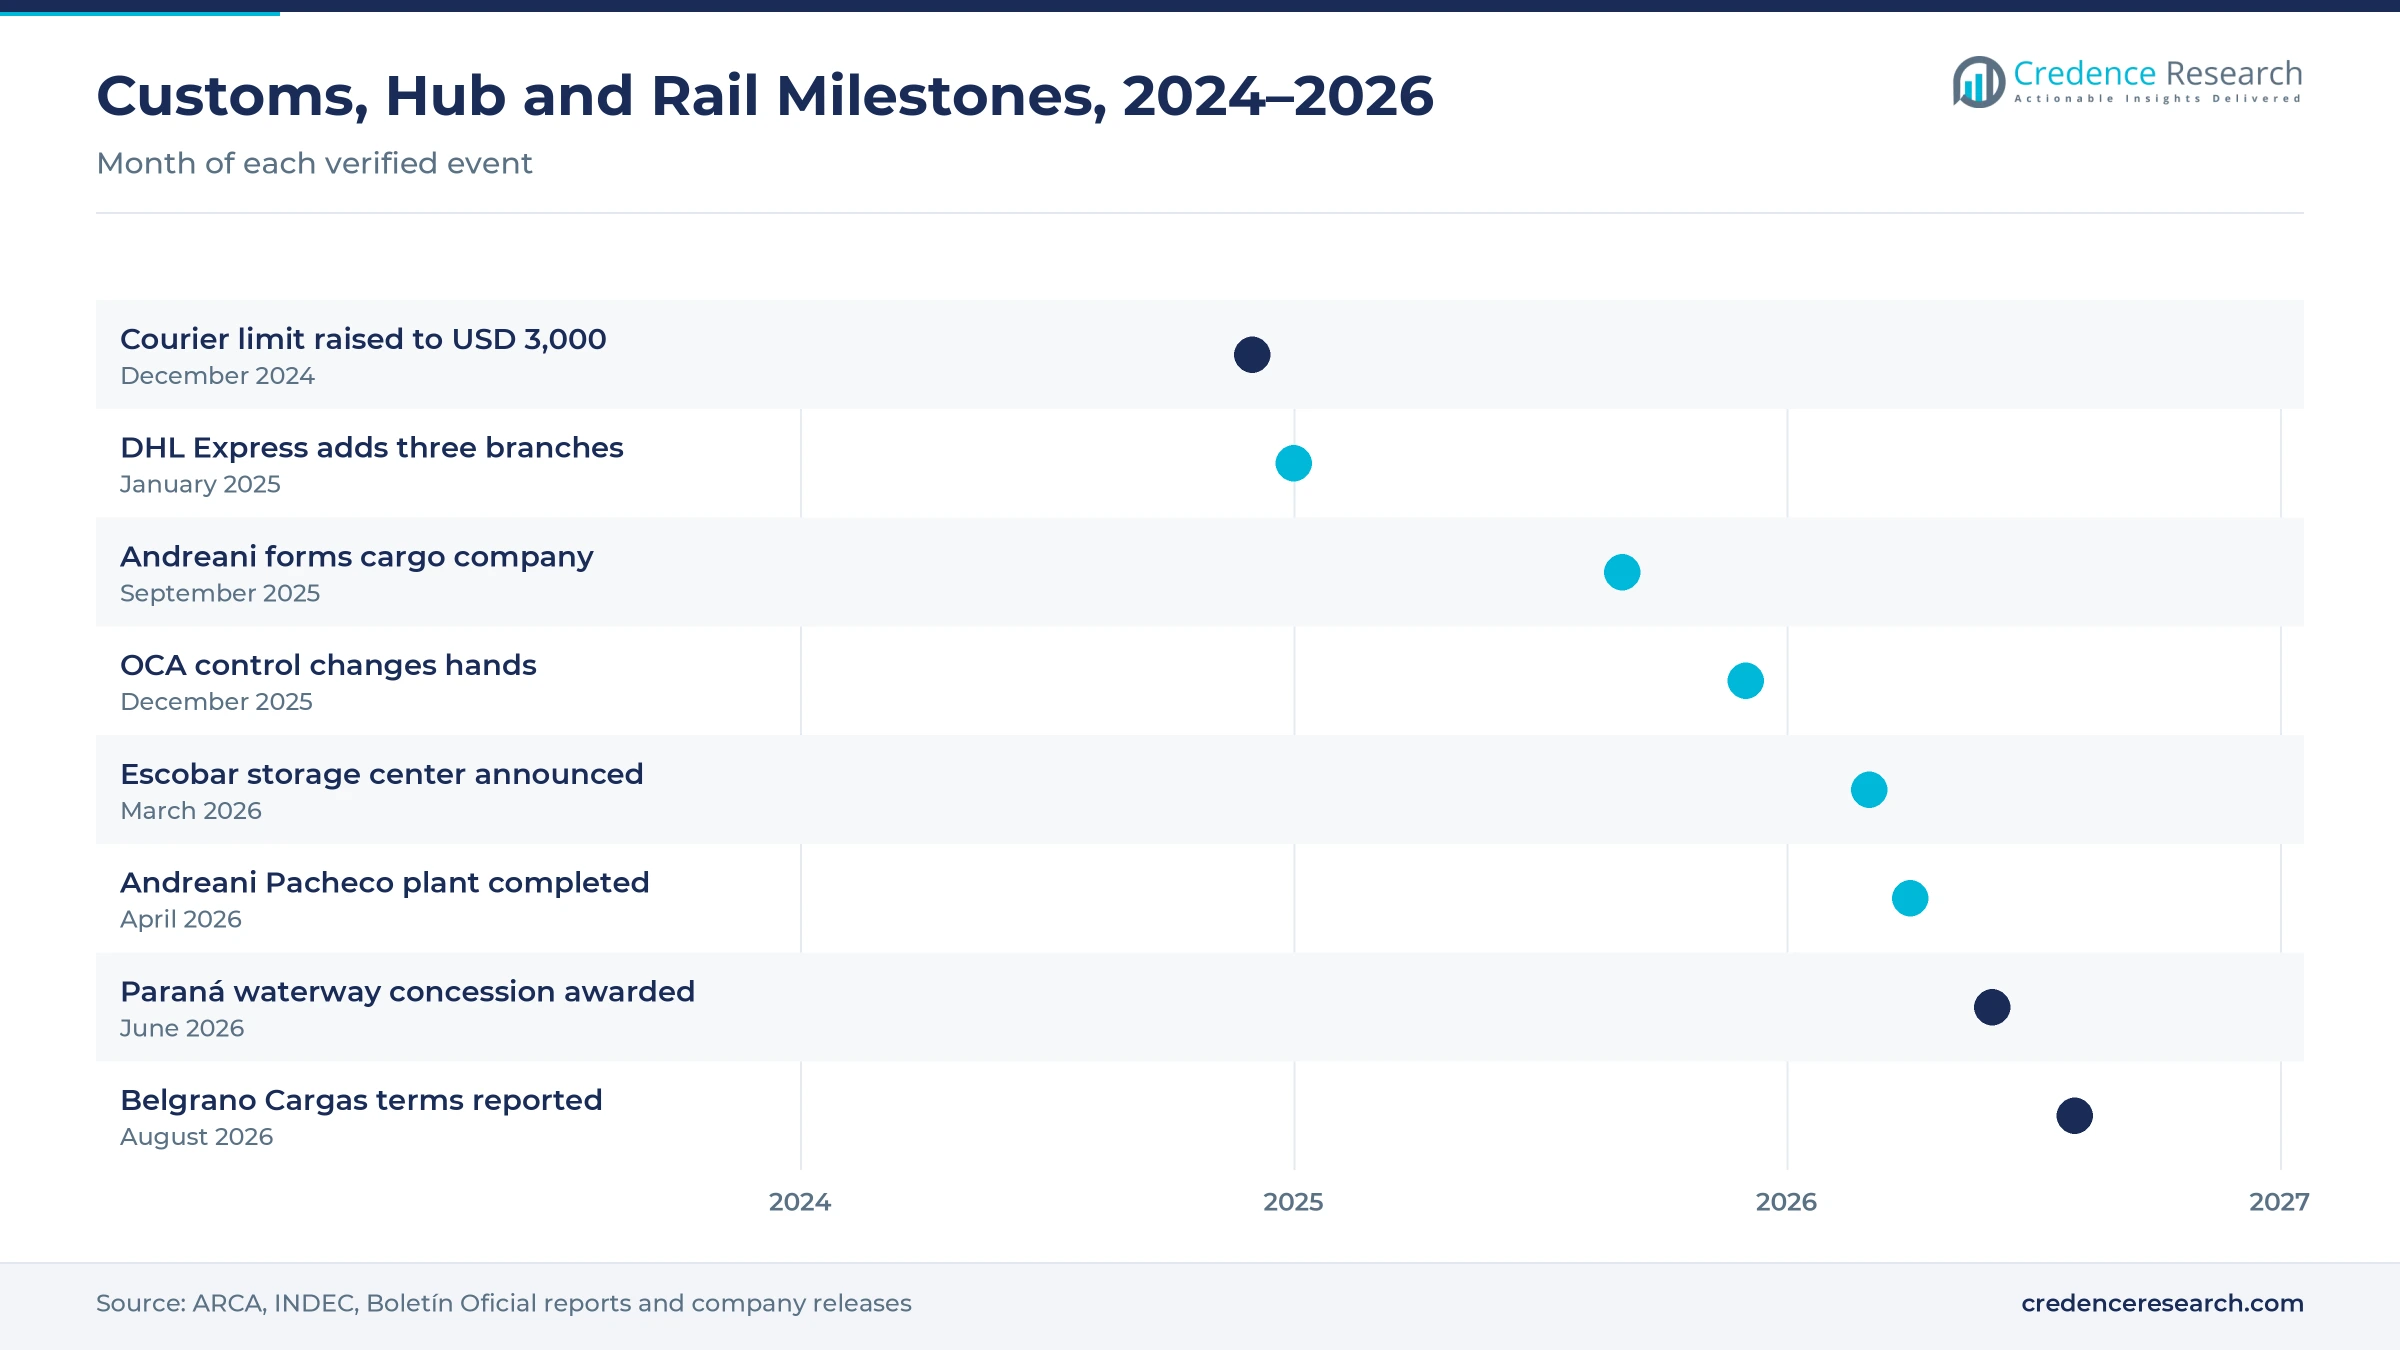
Customs, port, hub and rail milestones, 2024–2026
| Development | Status and market relevance |
|---|---|
| In December 2024, ARCA raised the courier import limit to USD 3,000 per shipment under General Resolution 5608. | Adds cross-border parcels for local providers |
| In September 2025, Andreani formed an international cargo company covering customs clearance, forwarding and bonded storage. | Moves a domestic operator into forwarding |
| In December 2025, COC Global Enterprise agreed to become the majority shareholder of OCA, which runs 760 service points. | Changes control of a national parcel network |
| In April 2026, Andreani completed a USD 30 million plant in General Pacheco with capacity for 26,000 packages per hour. | Raises parcel sorting capacity near the capital |
| In June 2026, Argentina awarded the Paraná waterway concession to Jan de Nul and Servimagnus for 25 years. | Sets channel works and tolls for grain exports |
Sorters, routing tools and bonded sites set service levels
- Automated sorters analyze size, weight and destination to reduce errors, which is how the Andreani Pacheco plant reaches up to 26,000 packages per hour.
- Routing software predicts incoming volume and weight to set vehicles and routes, and Andreani has used artificial intelligence for this work for about two years.
- Bonded and free-zone sites let forwarders consolidate and deconsolidate cargo under customs control, which Andreani added to its services through its new international cargo company in 2025.
Need a Custom Version of This Report?
Tailor the scope, geography, or segments to your exact requirements.
- Custom geography or segment scope
- Direct access to our analyst team
Andreani and OCA face global forwarders and contract rivals
Competition in Argentina supply chain services splits between national networks with dense domestic coverage and global groups that link Argentina to foreign trade. Andreani handles about 5 million shipments a month and is adding a Miami hub, while OCA runs 760 service points and more than 3,500 vehicles under new controlling owners. TASA Logística bought the Argentine contract logistics business of Kuehne+Nagel in 2020, adding three storage centers and 230 employees, and now reports 475,000 square meters across Argentina, Chile, Paraguay and Uruguay. CELSUR focuses on outsourced operations for automotive, chemical and consumer goods clients from General Rodríguez and Pilar. CEVA Logistics signed a three-year Volkswagen parts contract in Córdoba in July 2022, while DHL Express reached 28 branches and runs its own Miami to Buenos Aires freighter. Providers compete on coverage, automation, customs skills and the ability to run several modes under one contract.
Which companies shape Argentine logistics provision?
| Company | Type | Role in the market |
|---|---|---|
| Andreani Grupo Logístico | National integrated operator | Handles about 5 million shipments a month and runs an automated plant in General Pacheco |
| OCA | National parcel network | Runs 760 service points and more than 3,500 vehicles, with COC Global Enterprise as new majority owner |
| TASA Logística | Contract logistics provider | Reports 475,000 square meters in four countries and bought a Kuehne+Nagel business in 2020 |
| CELSUR Logística | Contract logistics provider | Runs about 180,000 square meters for automotive, chemical and consumer goods clients |
| CEVA Logistics Argentina | Contract logistics provider | Announced a three-year contract for inbound parts and line feeding at Volkswagen in Córdoba in July 2022 |
| DHL Argentina | Express and global logistics group | DHL Express reached 28 branches and runs six weekly Miami to Buenos Aires flights |
Credence Research view on Argentine logistics providers
Credence Research's view is that providers of Argentina supply chain services will win work by combining domestic parcel density with customs and forwarding skills, because shippers want fewer contracts for more steps. Express delivery and mining and energy work should grow fastest, while dedicated road contracts keep the largest share of spending. The rail concession is the largest swing factor, since bids are due on Nov. 11, 2026, and the works take years. Truck cost inflation and flat domestic volumes are the main risks, so providers with a balance of domestic, cross-border and resource cargo look best placed through 2035.
How the Argentine logistics provider estimate was built
The report uses 2025 as the base year on a calendar basis, and market values come from the Credence Research model. That model draws on INDEC trade statistics, World Bank port traffic data, online sales data from the national electronic commerce chamber, customs rules, tender terms and company announcements. Segment splits and zone shares and growth rates are Credence Research estimates built from online sales, export origin and port activity by zone. Sources used are official statistics, regulations, trade body releases, news reports and company releases, and Credence Research conducted no interviews or surveys of its own for this report.
Express, rail and resource cargo lead growth to 2035
Argentina supply chain services spending is expected to reach USD 11.12 billion by 2035, a 7.89% CAGR during 2026–2035, as parcel networks densify and exporters return cargo to forwarders and carriers. Growth should come from express delivery, rail-led services, mining and energy clients and the southern provinces. Lower tolls on the Paraná waterway and rail works would help bulk shippers, while renewed truck cost inflation or weak consumption would slow new tenders. Investment in automated hubs and inland storage is expected to decide which providers gain share by 2035.
Frequently Asked Questions
How big is the Argentina supply chain services market?
Which service type leads in Argentina?
Which region leads the Argentine market?
How did the courier rule change affect providers?
How much did Argentine trade recover in 2025?
What could the Belgrano Cargas tender change?
Which companies are active in the Argentine market?
What are the main challenges for providers in Argentina?
Table of Content
Chapter 1 Market Segmentation
- 1.1 Segmentation Framework
- 1.1.1 Product and Service Classification
- 1.1.2 Application and End-Use Classification
- 1.1.3 Technology and Solution Classification
- 1.1.4 Customer and Distribution Channel Classification
- 1.1.5 Geographic Segmentation
- 1.1.6 Market Segment Definitions and Boundaries
- 1.2 By Service Type
- 1.2.1 Road Freight Services
- 1.2.2 Warehousing and Contract Logistics
- 1.2.3 International Freight Forwarding
- 1.2.4 Cold Chain Logistics
- 1.2.5 Express and Last-Mile Delivery
- 1.3 By Mode of Transport
- 1.3.1 Road-Led Services
- 1.3.2 Ocean-Led Services
- 1.3.3 Air-Led Services
- 1.3.4 Rail-Led Services
- 1.3.5 Multimodal Services
- 1.4 By End-Use Industry
- 1.4.1 Agriculture and Food
- 1.4.2 Manufacturing and Materials
- 1.4.3 Retail and Consumer Services
- 1.4.4 Healthcare and Pharmaceuticals
- 1.4.5 Mining and Energy
- 1.5 By Business Model
- 1.5.1 Dedicated Contract Services
- 1.5.2 Shared-User Contract Services
- 1.5.3 Spot Transaction Services
- 1.5.4 Managed Platform Services
Chapter 2 Introduction
- 2.1 Report Objectives and Scope
- 2.2 Product Definition and Industry Terminology
- 2.3 Market Inclusions and Exclusions
- 2.4 Research Process
- 2.4.1 Primary Research and Expert Interviews
- 2.4.2 Secondary Research and Source Review
- 2.4.3 Top-Down and Bottom-Up Estimation
- 2.4.4 Data Triangulation and Verification
- 2.5 Market Size Measurement Basis
- 2.5.1 2025: USD 5.19 billion → 2035: USD 11.12 billion
- 2.6 Historical and Forecast Reference Periods
- 2.6.1 Historical Period: 2018-2025
- 2.6.2 Base Year: 2025
- 2.6.3 Forecast Period: 2025-2035
- 2.7 Research Assumptions and Limitations
Chapter 3 Executive Summary
- 3.1 Market Snapshot and Key Findings
- 3.2 Base-Year Market Size, 2025
- 3.3 Forecast Market Size, 2035
- 3.4 Revenue and Volume Growth Outlook
- 3.5 Key Demand and Supply Indicators
- 3.6 Leading Market Segments
- 3.7 Fastest-Growing Market Opportunities
- 3.8 Regional Performance Highlights
- 3.9 Technology and Industry Transformation
- 3.10 Competitive Landscape Summary
- 3.11 Analyst View and Strategic Implications
Chapter 4 Argentina Supply Chain Services Market Trends and Developments
- 4.1 Historical Industry Development, 2018-2025
- 4.2 Recent Market Trends and Developments
- 4.3 Demand and Customer Behavior Trends
- 4.4 Technology and Product Innovation
- 4.5 Artificial Intelligence, Automation and Digitalization
- 4.6 Local Manufacturing and Supply Chain Realignment
- 4.7 Industry Partnerships, Mergers and Acquisitions
- 4.8 Sustainability and Circular Economy Developments
- 4.9 Government and Private Sector Investment Trends
- 4.10 Emerging Business Models and Commercialization
- 4.11 Industry Developments and Announcements
Chapter 5 Argentina Supply Chain Services Market Supply and Demand Analysis
- 5.1 Demand Trend and Consumption Analysis, 2018-2025
- 5.2 Demand Forecast, 2025-2035
- 5.3 Supply Chain Structure and Procurement Trends
- 5.4 Supply-Demand Gap and Bottlenecks
- 5.5 Import Dependence and Sourcing Structure
- 5.6 Regional Supply and Demand Concentration
Chapter 6 Argentina Supply Chain Services Market Pricing Analysis
- 6.1 Pricing Structure and Measurement
- 6.2 Historical Pricing Trends, 2018-2025
- 6.3 Pricing Outlook, 2025-2035
- 6.4 Pricing by Product and Market Segment
- 6.5 Geographic Pricing Differences
- 6.6 Key Input, Energy, Labor and Logistics Costs
- 6.7 Contract Pricing and Purchasing Models
- 6.8 Pricing Sensitivity and Competitive Positioning
- 6.9 Price, Margin and Profitability Implications
Chapter 7 Argentina Supply Chain Services Market Dynamics
- 7.1 Market Growth Drivers
- 7.1.1 Demand-Side Drivers
- 7.1.2 Technology and Innovation Drivers
- 7.1.3 Infrastructure and Investment Drivers
- 7.1.4 Regulatory and Policy Drivers
- 7.2 Market Restraints
- 7.2.1 Cost and Affordability Constraints
- 7.2.2 Technology and Adoption Barriers
- 7.2.3 Supply Chain and Operational Constraints
- 7.3 Market Challenges
- 7.3.1 Competitive Pressure and Margin Erosion
- 7.3.2 Skills, Infrastructure and Implementation Gaps
- 7.4 Emerging Market Opportunities
- 7.5 Market Dynamics Impact and Time-Horizon Assessment
Chapter 8 Argentina Supply Chain Services Value Chain Analysis
- 8.1 Industry Value Chain Overview
- 8.2 Upstream Suppliers and Critical Inputs
- 8.3 Technology and Component Providers
- 8.4 Manufacturing or Service Delivery
- 8.5 Distribution, Channel Partners and Integrators
- 8.6 Downstream Applications and End Users
- 8.7 Value Addition and Profit Pools
- 8.8 Vertical Integration and Outsourcing
- 8.9 Supplier Concentration and Risk
- 8.10 Supply Chain Localization and Resilience
Chapter 9 Argentina Supply Chain Services Market Regulations and Policies
- 9.1 Relevant Laws, Standards and Compliance Frameworks
- 9.2 Product, Service, Safety and Quality Requirements
- 9.3 Government Policies, Incentives and Subsidies
- 9.4 Imports, Exports and Trade Barriers
- 9.5 Public Procurement and Local Content Requirements
- 9.6 Data Protection, AI and Cybersecurity Compliance
- 9.7 Upcoming Policy Changes and Market Implications
Chapter 10 Argentina Supply Chain Services Market Hotspots and Opportunities
- 10.1 Market Opportunity Mapping and Growth Hotspots
- 10.2 High-Growth Applications and Customer Groups
- 10.3 Underserved Markets and White-Space Opportunities
- 10.4 Emerging Technology and Product Opportunities
- 10.5 New Capacity and Investment Hotspots
- 10.6 Market Entry and Expansion Opportunities
- 10.7 Distribution and Partnership Opportunities
- 10.8 Near-Term and Long-Term Commercial Potential
- 10.9 Opportunity Attractiveness and Execution Risks
Chapter 11 Argentina Supply Chain Services Market Outlook, 2025-2035
- 11.1 Market Size and Analysis
- 11.1.1 Revenue (Market Measurement: 2025: USD 5.19 billion → 2035: USD 11.12 billion)
- 11.1.2 Historical Market Size, 2018-2025
- 11.1.3 Base-Year Market Size, 2025
- 11.2 Market Forecast, 2025-2035
- 11.2.1 Revenue Forecast to 2035
- 11.2.2 CAGR and Year-on-Year Growth
- 11.2.3 Incremental Revenue Opportunity
- 11.3 Forecast Assumptions and Scenario Analysis
- 11.3.1 Base-Case Forecast
- 11.3.2 Optimistic and Conservative Scenarios
- 11.3.3 Technology, Pricing and Policy Sensitivities
- 11.4 Market Attractiveness and Growth Outlook
Chapter 12 Argentina Supply Chain Services Market Segmentation and Outlook
- 12.1 Segmentation Summary and Market Shares, 2025
- 12.2 Largest and Fastest-Growing Segments
- 12.3 By Service Type - Market Size and Forecast, 2025-2035
- 12.3.1 Segment Definition and Scope
- 12.3.2 Historical Market Size, 2018-2025
- 12.3.3 Revenue Forecast, 2025-2035
- 12.3.4 Base-Year Market Share, 2025
- 12.3.5 Segment CAGR and Growth Drivers
- 12.3.6 Subsegment Market Size and Forecast
- 12.3.6.1 Road Freight Services
- 12.3.6.2 Warehousing and Contract Logistics
- 12.3.6.3 International Freight Forwarding
- 12.3.6.4 Cold Chain Logistics
- 12.3.6.5 Express and Last-Mile Delivery
- 12.3.7 Subsegment Pricing and Adoption Trends
- 12.3.8 Leading Suppliers and Competition
- 12.3.9 Regional Demand and Opportunities
- 12.4 By Mode of Transport - Market Size and Forecast, 2025-2035
- 12.4.1 Segment Definition and Scope
- 12.4.2 Historical Market Size, 2018-2025
- 12.4.3 Revenue Forecast, 2025-2035
- 12.4.4 Base-Year Market Share, 2025
- 12.4.5 Segment CAGR and Growth Drivers
- 12.4.6 Subsegment Market Size and Forecast
- 12.4.6.1 Road-Led Services
- 12.4.6.2 Ocean-Led Services
- 12.4.6.3 Air-Led Services
- 12.4.6.4 Rail-Led Services
- 12.4.6.5 Multimodal Services
- 12.4.7 Subsegment Pricing and Adoption Trends
- 12.4.8 Leading Suppliers and Competition
- 12.4.9 Regional Demand and Opportunities
- 12.5 By End-Use Industry - Market Size and Forecast, 2025-2035
- 12.5.1 Segment Definition and Scope
- 12.5.2 Historical Market Size, 2018-2025
- 12.5.3 Revenue Forecast, 2025-2035
- 12.5.4 Base-Year Market Share, 2025
- 12.5.5 Segment CAGR and Growth Drivers
- 12.5.6 Subsegment Market Size and Forecast
- 12.5.6.1 Agriculture and Food
- 12.5.6.2 Manufacturing and Materials
- 12.5.6.3 Retail and Consumer Services
- 12.5.6.4 Healthcare and Pharmaceuticals
- 12.5.6.5 Mining and Energy
- 12.5.7 Subsegment Pricing and Adoption Trends
- 12.5.8 Leading Suppliers and Competition
- 12.5.9 Regional Demand and Opportunities
- 12.6 By Business Model - Market Size and Forecast, 2025-2035
- 12.6.1 Segment Definition and Scope
- 12.6.2 Historical Market Size, 2018-2025
- 12.6.3 Revenue Forecast, 2025-2035
- 12.6.4 Base-Year Market Share, 2025
- 12.6.5 Segment CAGR and Growth Drivers
- 12.6.6 Subsegment Market Size and Forecast
- 12.6.6.1 Dedicated Contract Services
- 12.6.6.2 Shared-User Contract Services
- 12.6.6.3 Spot Transaction Services
- 12.6.6.4 Managed Platform Services
- 12.6.7 Subsegment Pricing and Adoption Trends
- 12.6.8 Leading Suppliers and Competition
- 12.6.9 Regional Demand and Opportunities
- 12.7 Segment Growth Comparison
- 12.8 Segment Attractiveness and Priority Matrix
Chapter 13 Argentina Supply Chain Services End-Use and Application Market Outlook
- 13.1 End-Use Industry and Customer Demand Structure
- 13.2 Leading Applications and Customer Groups
- 13.3 End-Use Market Size, Share and Forecast
- 13.4 Major End-Use Industry Deep Dives
- 13.4.1 Customer Requirements and Use Cases
- 13.4.2 Demand and Replacement Cycles
- 13.4.3 Technical and Regulatory Considerations
- 13.4.4 Purchasing and Procurement Models
- 13.4.5 Leading Vendors and Distribution Channels
- 13.4.6 Forecast and Commercial Opportunities
- 13.5 Emerging Applications and Cross-Segment Demand
- 13.6 End-Use Industry Investment Priorities
Chapter 14 Argentina Supply Chain Services Geographic Market Outlook, 2025-2035
- 14.1 Domestic Market Distribution and Demand Clusters
- 14.2 State- or Province-Wise Market Size and Forecast, 2025-2035
- 14.3 City and Metropolitan Market Outlook
- 14.4 Industrial, Manufacturing and Commercial Clusters
- 14.5 Geographic Concentration of Key End Users
- 14.6 Local Pricing and Purchasing Differences
- 14.7 Domestic Production Facilities and Capacity Map
- 14.8 Local Infrastructure and Project Pipeline
- 14.9 State-Level Policy and Incentive Differences
- 14.10 Subnational Investment Hotspots and Opportunities
- 14.11 Distribution and Logistics Networks
- 14.12 Domestic Competitive Footprint
Chapter 15 Argentina Supply Chain Services Technology, Innovation and Sustainability Outlook
- 15.1 Technology Landscape and Maturity
- 15.2 Product, Process and Service Innovation
- 15.3 AI, Automation and Digital Tools in the Industry
- 15.4 Technology Adoption and Performance Benchmarking
- 15.5 Innovation Pipeline and R&D Investment
- 15.6 Energy Efficiency and Resource Management
- 15.7 Sustainability, Recycling and Circularity
- 15.8 Technology Roadmap, 2025-2035
- 15.9 Risks of Obsolescence and Technology Substitution
Chapter 16 Argentina Supply Chain Services Market Key Strategic Imperatives
- 16.1 Growth and Market Entry Priorities
- 16.2 High-Return Products and Segments
- 16.3 Pricing, Profitability and Cost Optimization
- 16.4 Technology Investment and Product Differentiation
- 16.5 Supply Chain Localization and Resilience
- 16.6 Distribution and Customer Acquisition
- 16.7 Partnership, Acquisition and Capacity Strategy
- 16.8 Regional Expansion Priorities
- 16.9 Short-, Medium- and Long-Term Actions
Chapter 17 Competition Outlook
- 17.1 Industry Competition Characteristics
- 17.2 Market Structure and Concentration
- 17.3 Market Share and Competitive Positioning, 2025
- 17.4 Company-Wise Revenue and Product Benchmarking
- 17.5 Production and Service Capacity Benchmarking
- 17.6 Technology, Pricing and Differentiation
- 17.7 Regional Footprint and Distribution Strength
- 17.8 Mergers, Acquisitions and Strategic Alliances
- 17.9 New Entrants and Competitive Threats
- 17.10 Porter's Five Forces and Industry Attractiveness
- 17.11 Competitive Outlook, 2025-2035
Chapter 18 Company Profiles
- 18.1 Company Coverage and Selection Criteria
- 18.2 Andreani Grupo Logístico
- 18.2.1 Business Description
- 18.2.2 Company Ownership and Geographic Presence
- 18.2.3 Product and Service Portfolio
- 18.2.4 Manufacturing and Operating Footprint
- 18.2.5 Financial Performance and Investment
- 18.2.6 Market Share and Competitive Position
- 18.2.7 Technology and Innovation Capabilities
- 18.2.8 Strategic Alliances or Partnerships
- 18.2.9 Recent Developments
- 18.2.10 Growth Strategy and Outlook
- 18.3 OCA
- 18.4 CEVA Logistics Argentina
- 18.5 Kuehne+Nagel Argentina
- 18.6 DHL Argentina
- 18.7 CELSUR Logística
- 18.8 TASA Logística
- 18.9 AXIS Logística
- 18.10 Craft Argentina
- 18.11 DSV Argentina
- 18.12 Other Relevant Market Participants
Note: Every listed company is profiled on the structure shown under the first company. The company list is preliminary and may change based on research findings, market developments, data availability and client requirements.
Chapter 19 Disclaimer
- 19.1 Research and Forecast Disclaimer
- 19.2 Data Source and Estimation Limitations
Note: The depth of individual sections depends on data availability for this market. Volume, capacity, trade and other unit-based metrics are included where applicable.

