
Protein exports and drug rules set temperature demand
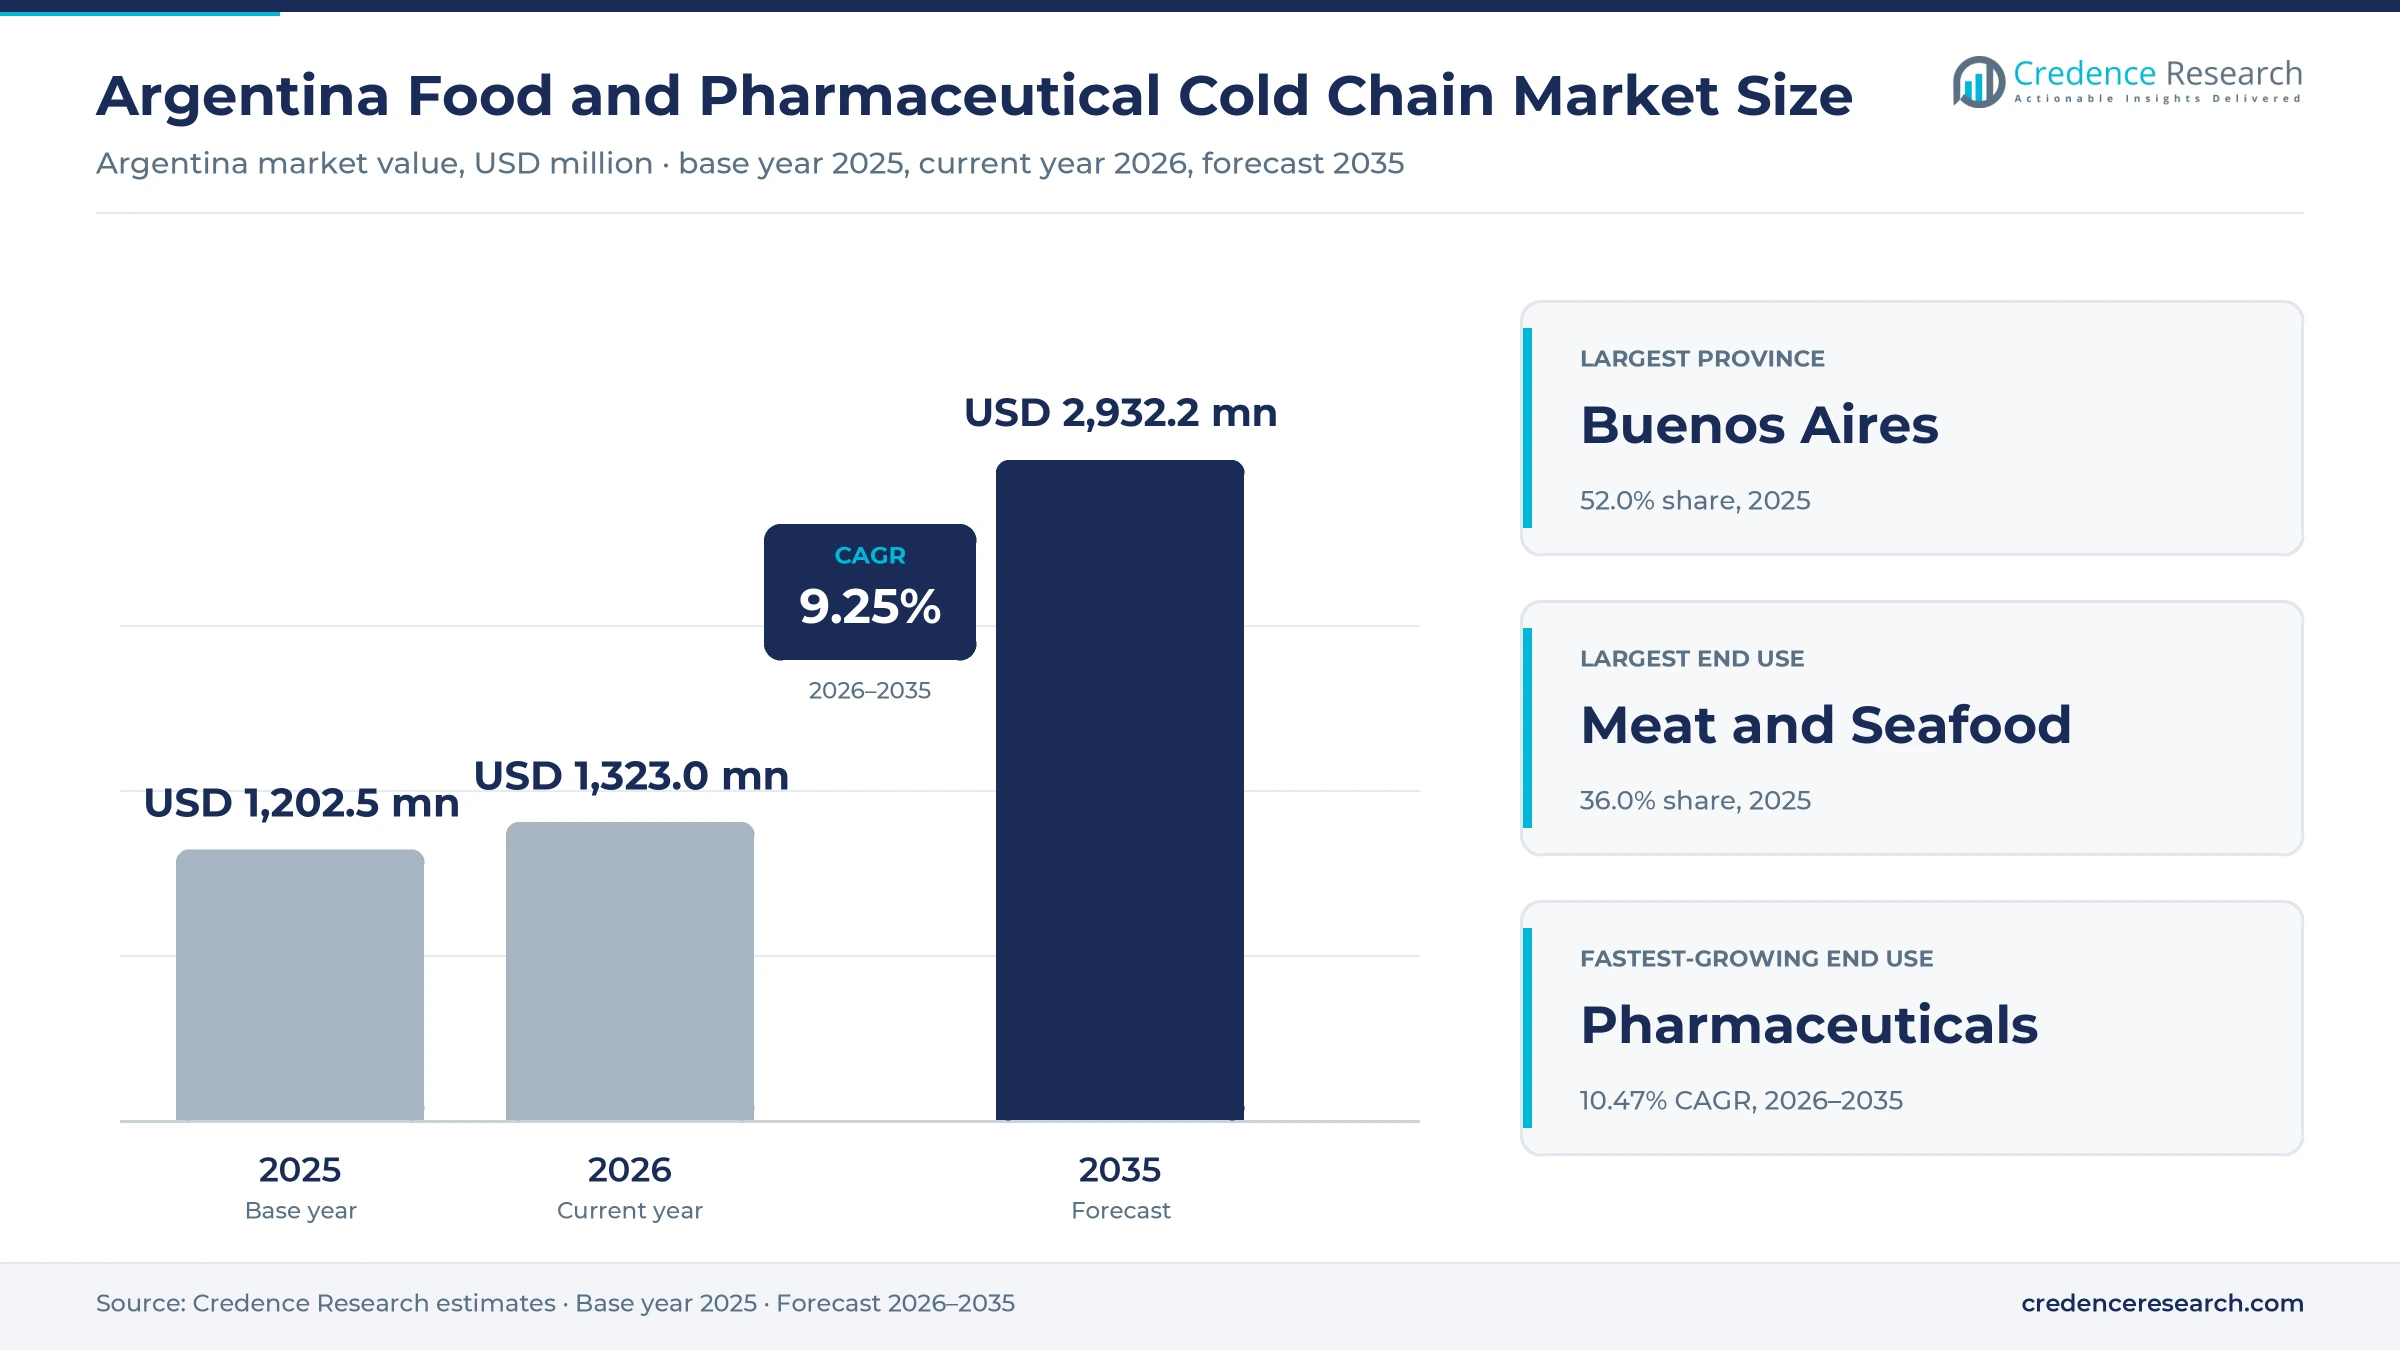
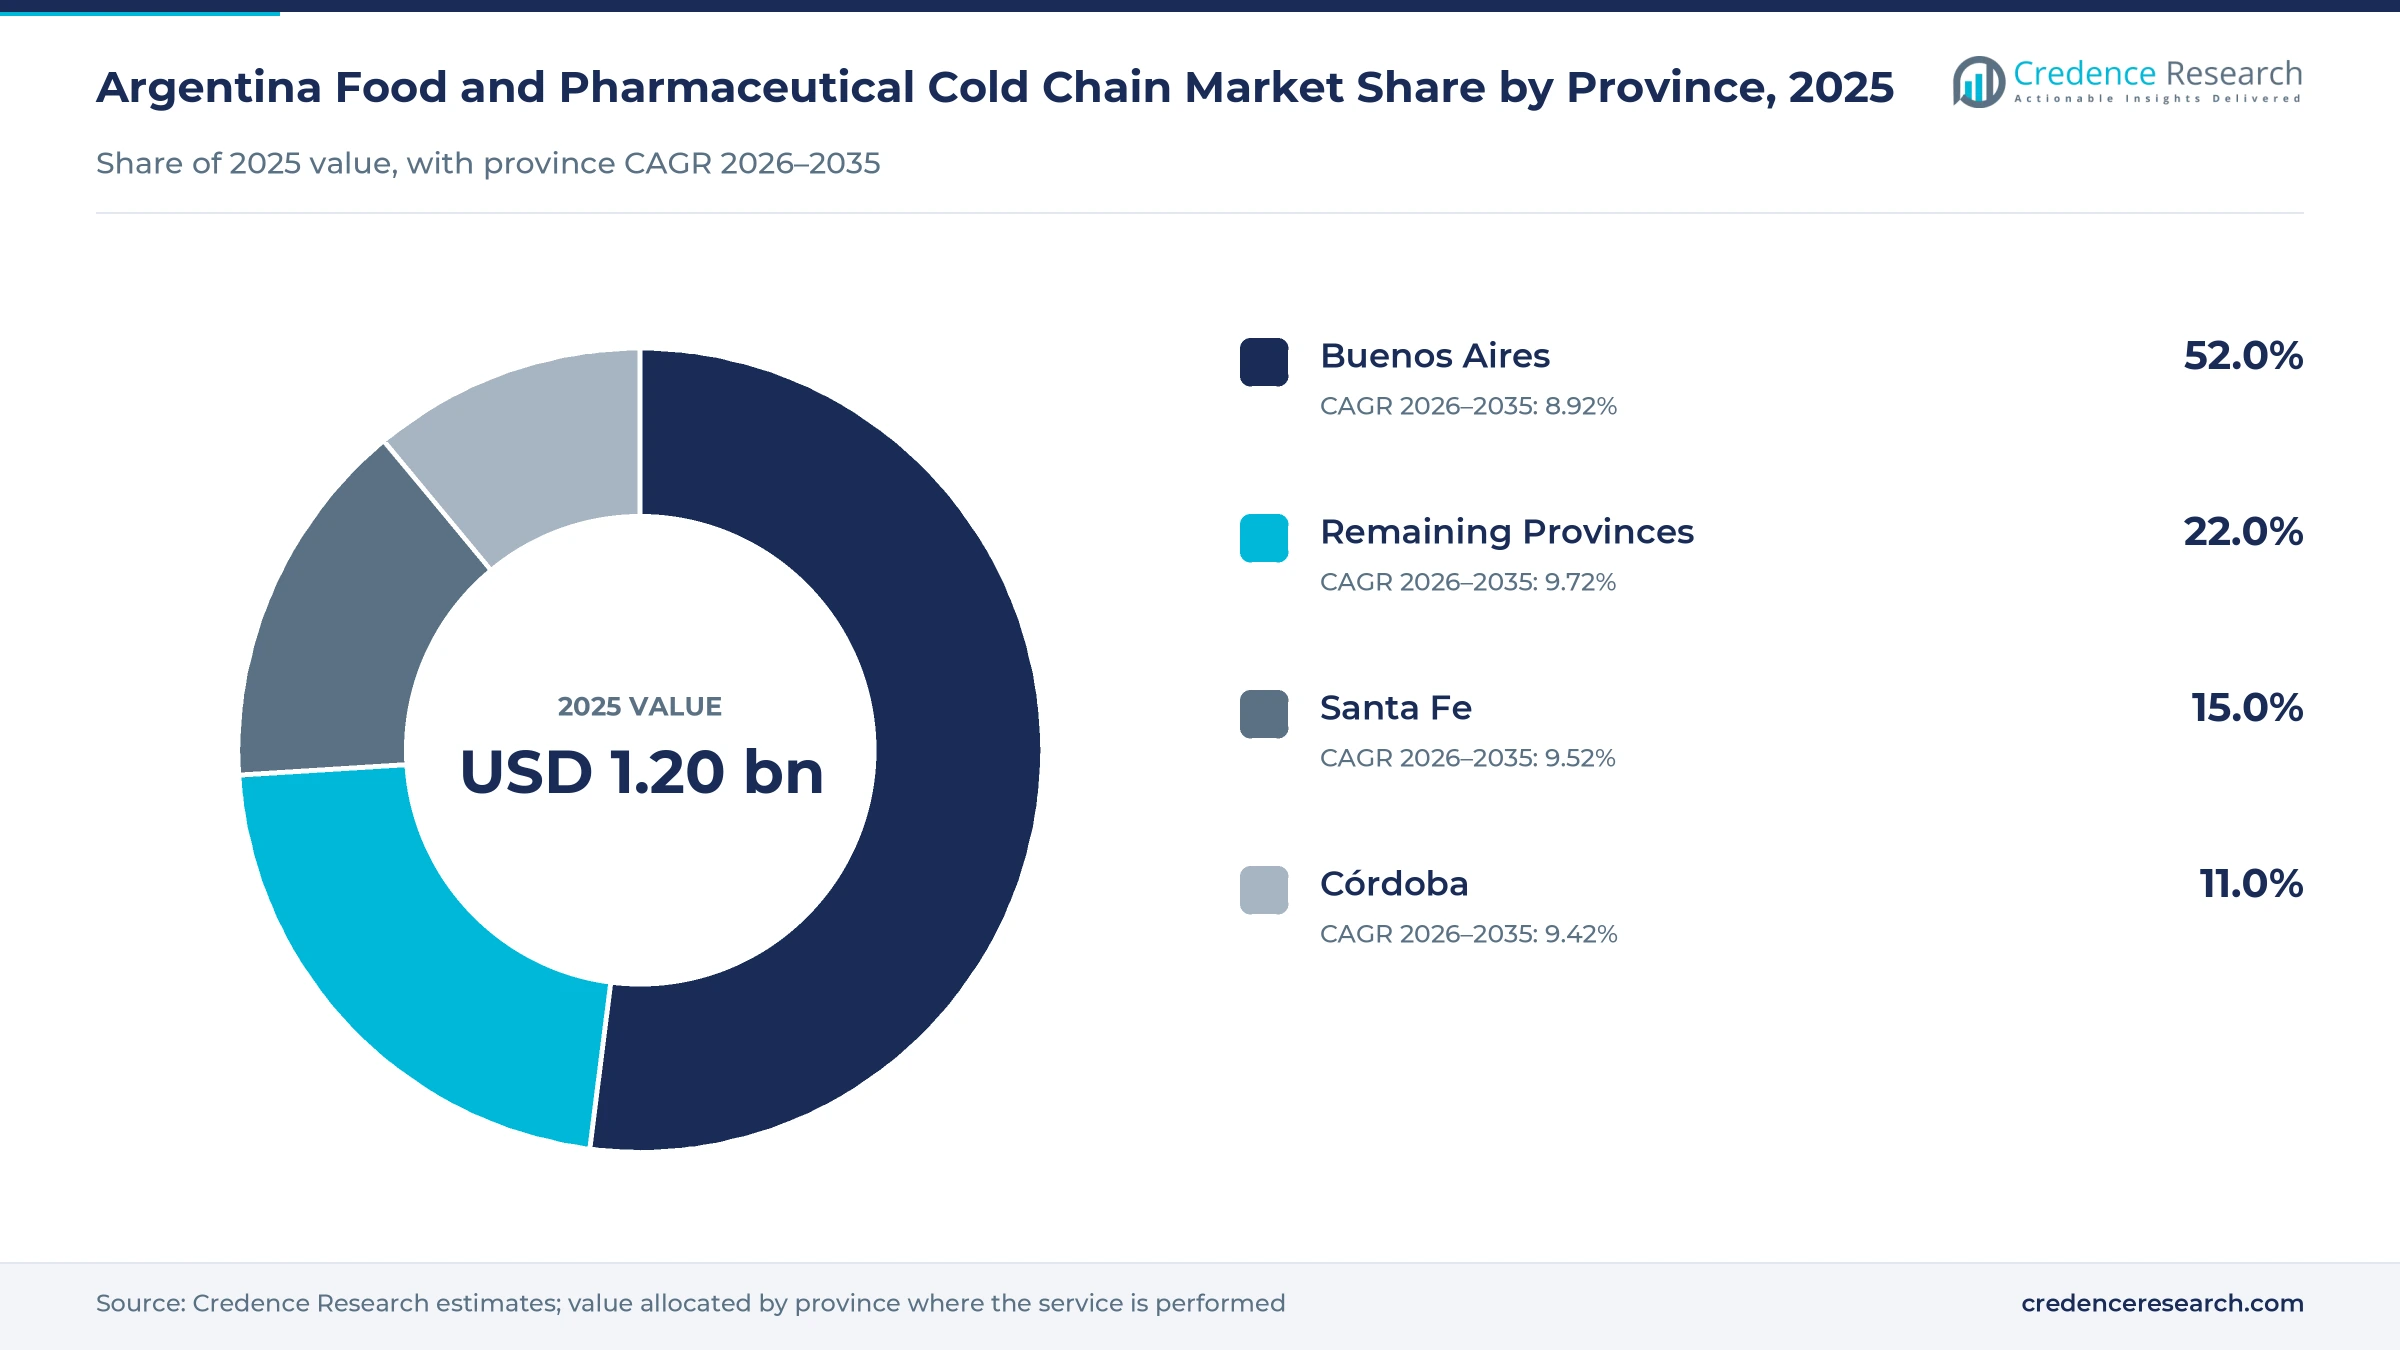
The Argentina food and pharmaceutical cold chain market was valued at USD 1.20 billion in 2025 and is projected to increase from USD 1.32 billion in 2026 to USD 2.93 billion by 2035, registering a CAGR of 9.25% during 2026–2035. Demand comes from beef packers, seafood processors, dairies, fruit and vegetable shippers, supermarkets, drug makers, distributors and hospitals that need goods held at frozen, chilled or 2 °C to 8 °C ranges from plant to point of use. Buenos Aires held the largest provincial share, 52.0% in 2025, because the province and the capital city concentrate consumers, drug laboratories, Ezeiza airport cargo terminals and the main multi-temperature warehouses. The remaining provinces form the fastest-growing zone at 9.72% a year, as coastal fishing ports, fruit packers and inland meat plants add refrigerated volume. Beef export earnings rose 28.1% in 2025, while China's safeguard quotas from January 2026 and a larger U.S. in-quota allowance are shifting frozen cargo toward new routes.
Which temperature-controlled services does the estimate count?
The estimate measures spending on refrigerated transport, cold storage and controlled handling services for meat, seafood, dairy, produce, processed food and pharmaceuticals moved within, out of and into Argentina. It includes road-led, ocean-led and air-led networks, whether buyers use integrated contracts, single shipments or managed specialty programs. Spending is measured at the prices that manufacturers, retailers, distributors, hospitals and foodservice buyers pay to logistics providers.
The estimate excludes the value of the goods themselves, refrigeration equipment sold to shippers and cold rooms that processors run only for their own use. The value chain runs from packing plants, dairies, fishing ports and drug laboratories through reefer trucks, port and airport terminals and public warehouses to supermarkets, pharmacies, hospitals and export customers.
Argentina Food and Pharmaceutical Cold Chain Market Insights
- The Argentina food and pharmaceutical cold chain market was valued at USD 1.20 billion in 2025 and is projected to reach USD 2.93 billion by 2035, registering a CAGR of 9.25% during 2026–2035.
- Buenos Aires held a 52.0% share of 2025 value, because the province and city concentrate consumers, laboratories, airport cargo terminals and public cold stores.
- Refrigerated transport led service types with a 46.0% share of 2025 value, as long road hauls link packing plants, dairies, ports and supermarkets.
- Beef exports reached 842,594 metric tons carcass weight in 2025, worth about USD 3.81 billion, and China took 69.7% of shipped volume, according to provisional INDEC data.
- ANMAT widened the national medicine traceability list in September 2025, adding high-risk products such as insulins, coagulation factors and oncology drugs to serialized tracking.
Pharmaceutical handling grows fastest among end uses
Why does refrigerated transport take the largest share?
Based on service type, the market is categorized into Refrigerated Transport, Cold Storage and Controlled Handling Services. Refrigerated Transport led with a 46.0% share of 2025 value, because packing plants, dairies and fishing ports ship chilled and frozen loads hundreds of kilometers to terminals and supermarkets. Controlled Handling Services grow fastest at 10.13% a year, as drug distributors add validated packing, temperature mapping and serialized tracking for refrigerated medicines.
How do meat and seafood shippers anchor spending?
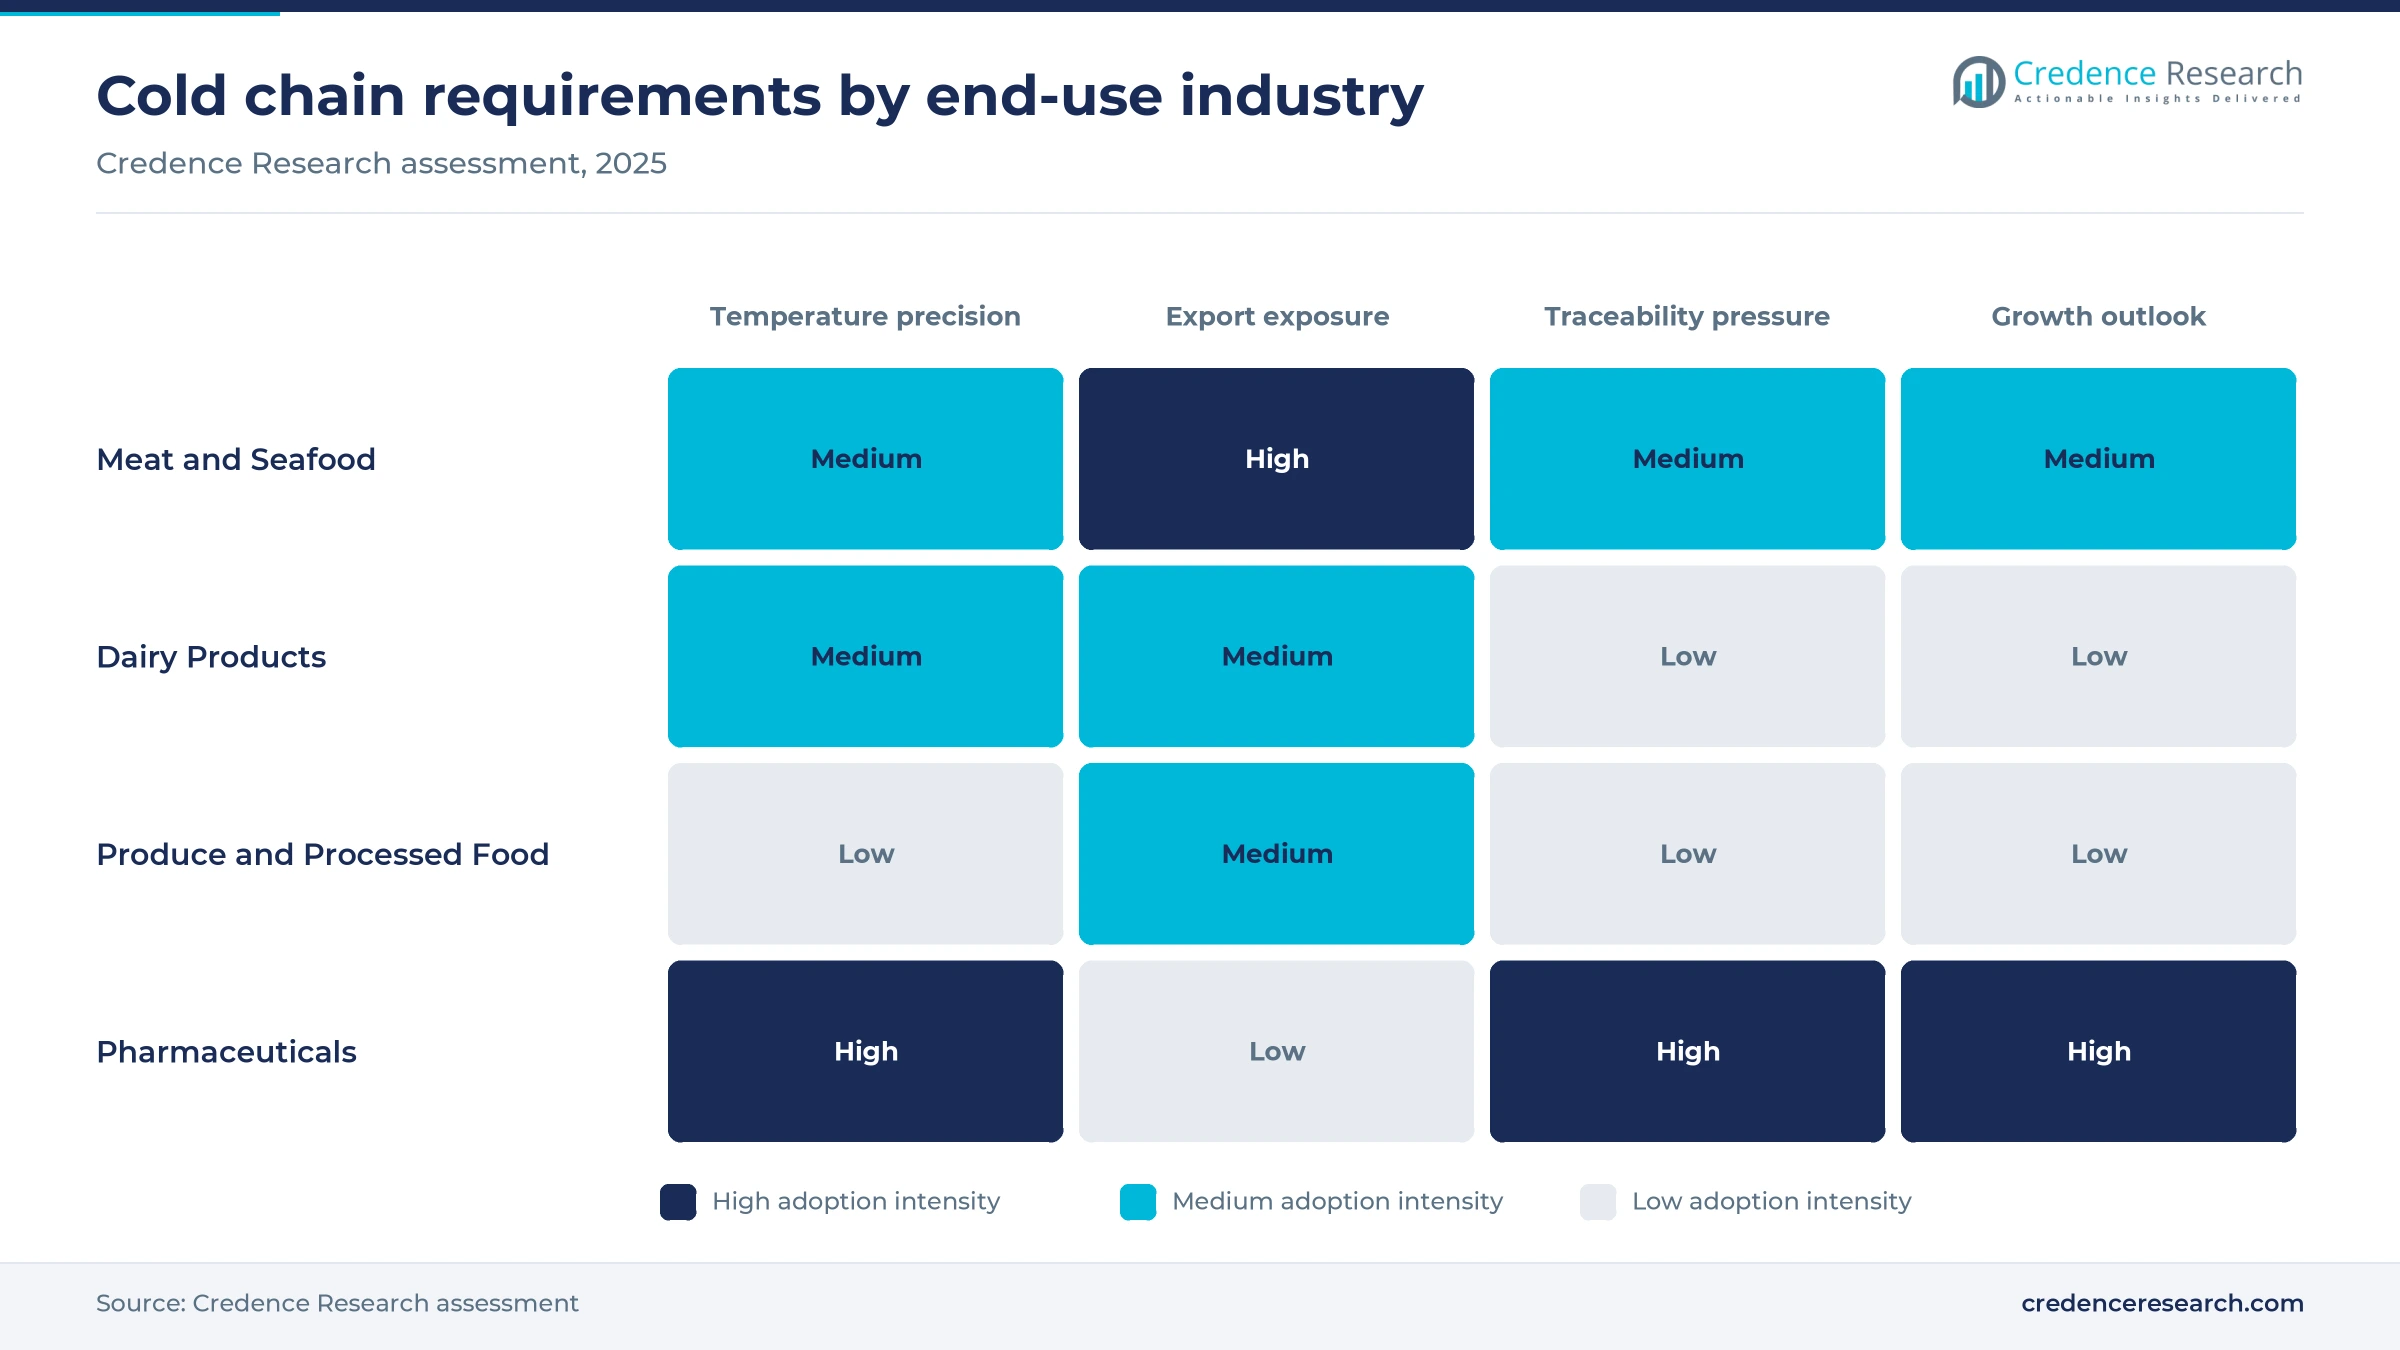
Based on end-use industry, the market is categorized into Meat and Seafood, Dairy Products, Produce and Processed Food and Pharmaceuticals. Meat and Seafood led with a 36.0% share of 2025 value, because beef and shrimp exports need frozen or chilled handling from plant to vessel. Pharmaceuticals grow fastest at 10.47% a year, as biologics, insulins and vaccines need validated 2 °C to 8 °C storage and delivery.
Where does domestic distribution outweigh export flows?
Based on shipment flow, the market is categorized into Domestic Distribution, Export-Linked Services and Import-Linked Services. Domestic Distribution led with a 58.0% share of 2025 value, because supermarkets, butchers, pharmacies and hospitals across 24 jurisdictions receive frequent refrigerated deliveries. Export-Linked Services grow fastest at 9.92% a year, as beef, shrimp and dairy shippers chase new quotas and buyers abroad.
Why do shippers favor integrated contract logistics?
Based on business model, the market is categorized into Integrated Contract Logistics, Transactional Logistics and Managed Specialty Logistics. Integrated Contract Logistics led with a 44.0% share of 2025 value, because large food and drug companies outsource storage, picking and delivery under multi-year contracts. Managed Specialty Logistics grow fastest at 10.40% a year, as clinical trial and biologic shippers pay for active containers and qualified couriers.
| Segment Group | Leading Sub-segment | Share, 2025 | Fastest-growing Sub-segment | CAGR, 2026–2035 |
|---|---|---|---|---|
| By Service Type | Refrigerated Transport | 46.0% | Controlled Handling Services | 10.13% |
| By End-Use Industry | Meat and Seafood | 36.0% | Pharmaceuticals | 10.47% |
| By Shipment Flow | Domestic Distribution | 58.0% | Export-Linked Services | 9.92% |
| By Business Model | Integrated Contract Logistics | 44.0% | Managed Specialty Logistics | 10.40% |
Request a Free Sample
Fill in your details and we'll send you a free sample report.
- Sample data tables & charts
- Research methodology
Drug assurance, dairy and protein exports lift demand
How does pharmaceutical temperature assurance raise demand?
Drug makers and distributors must show that refrigerated medicines stayed within range from plant to pharmacy, which raises spending on validated storage and monitored delivery. INDEC reported first-quarter 2026 pharmaceutical billing of ARS 3.05 trillion, up 32.7% from a year earlier, with domestic production at 66.1% of the total, according to its pharmaceutical industry report. ANMAT Disposition 6223/2025, published on Sept. 3, 2025, updated the national traceability list to 495 active ingredients, including insulins, coagulation factors and oncology drugs, according to law firm Beccar Varela. Andreani's special products plant near Buenos Aires holds up to 3,700 pallets at 2 °C to 8 °C, according to El Cronista. As a result, pharmaceuticals grow fastest among end uses at 10.47% a year.
Why does the dairy output recovery lift chilled distribution?
A recovery in milk output is filling more chilled trucks and cold rooms between dairies in the central provinces and retailers across the country. Argentina produced about 11.62 billion liters of milk in 2025, up 9.7% from 2024, according to the dairy chain observatory OCLA as reported by Bichos de Campo. Dairy exports rose 20% to USD 1.69 billion in 2025, with mozzarella making up 13% of shipments, according to DatamarNews. OCLA's survey of 25 processors points to about 3.1% more milk in 2026, which keeps cheese, yogurt and fresh milk volumes rising. In turn, Santa Fe and Córdoba, which host much of the dairy chain, grow at 9.52% and 9.42% a year.
How does protein export logistics shape reefer demand?
Beef and other protein exports need frozen and chilled capacity from slaughter plants to container terminals, which makes export volume a direct driver of spending. Argentina shipped 842,594 metric tons of beef in carcass weight in 2025, worth about USD 3.81 billion, and China took 69.7% of volume, according to provisional INDEC data compiled by the Argentine Beef Export Consortium. Shipments rose 10% to about 411,700 metric tons in the first half of 2026 and filled 27,124 TEUs of containers, according to DatamarNews. Export value also climbed 44.7% in that half, which gives packers more cash to book reefer space early. As a result, export-linked services grow fastest among shipment flows at 9.92% a year.
Why do seafood exports add deep-frozen volume?
Shrimp and other fishery exports depend on deep-frozen storage and reefer containers at coastal ports, which adds volume outside the central provinces. Argentina exported 549,416 metric tons of fishery products worth USD 2.01 billion in 2025, up 4.3% in value, according to the Secretariat of Agriculture, Livestock and Fisheries as reported by Economis. Shrimp was the main product with USD 867 million and 119,775 metric tons, which reversed the decline of earlier years. Global buyers of frozen seafood expect unbroken low temperatures from vessel to store, so exporters need freezing and storage close to landing sites. In turn, the provinces outside the central belt gain the fastest provincial growth in the forecast.
Multi-temperature hubs and serialized tracking spread
Shift toward multi-temperature hubs around Buenos Aires
Cold storage operators are concentrating capacity in large multi-temperature hubs on the edges of Greater Buenos Aires, close to consumers and export gateways. Americold's Mercado Central site offers 13,500 pallet positions across frozen, chilled, ambient and dry ranges for the city and its suburbs, according to the company. Its Pilar site adds 9,000 frozen positions and four freezing tunnels, and SENASA authorizes it to export beef, pork and poultry. Frío Dock runs a refrigerated warehousing site in Tortuguitas that holds about 2,280 pallets at a constant minus 25 °C, according to Mecalux. As a result, Buenos Aires keeps the largest provincial share, and cold storage holds a large base within service types.
Rise of serialized tracking for refrigerated medicines
Serialized tracking is spreading from controlled drugs to a wider set of high-value medicines, many of which travel under refrigeration. ANMAT's Disposition 6223/2025 replaced the 2016 traceability annexes and gave product holders 45 business days to comply, according to Beccar Varela. The rule followed a fentanyl contamination case in which ANMAT suspended the maker and the distributor, according to Diario de Cuyo. Argentina scored 2.9 out of 5 for tracking and tracing in the 2023 Logistics Performance Index, below Brazil at 3.2, according to the World Bank. As a result, controlled handling services grow fastest among service types at 10.13% a year, as distributors tie temperature logs to serial numbers.
Opening in active containers for clinical and biologic cargo
Active temperature-controlled containers create an opening for specialty forwarders that move clinical trial and biologic shipments through Ezeiza. Vanner Logistics holds a direct agreement with Envirotainer as the only national agent in Argentina for active cold chain services, according to the Pangea Network. Marken opened a GMP and GDP compliant depot in Buenos Aires in November 2016 with a full range of storage temperatures. DHL Group plans to invest EUR 2 billion in health logistics by 2030, with 10% earmarked for Latin America, and launched the DHL Health Logistics brand in April 2025, according to Mercado. In turn, managed specialty logistics grow fastest among business models at 10.40% a year.
Opening in U.S. lean beef and diversified export routes
Diversified export markets create an opening for packers and logistics providers that can serve buyers beyond China. China's safeguard measure, in force from Jan. 1, 2026 for three years, adds a 55% tariff on beef imports above country quotas, according to BusinessDay. A U.S. proclamation of Feb. 6, 2026 added 80,000 metric tons of in-quota access for Argentine lean beef trimmings for 2026 in four quarterly tranches, according to the White House. The United States took 19.5% of Argentine beef shipments in the first half of 2026, second after China at 53%, according to DatamarNews. As a result, meat and seafood keep the largest end-use share at 36.0% of 2025 value.
Road distances, inflation and trade quotas limit growth
Long road hauls and weak logistics scores raise costs
Argentina ranked 73rd with an overall score of 2.8 in the 2023 Logistics Performance Index, and its infrastructure score of 2.8 trailed Brazil at 3.2. Because most perishable cargo moves by truck, the state of national freight transportation sets transit times and fuel costs for every reefer load. Shippers in distant provinces pay the most, and spoilage risk rises on long summer routes. Operators can respond with regional cross-docks and truck telematics that flag temperature breaks early.
Peso inflation complicates long service contracts
Fast price changes in pesos make multi-year storage and transport contracts hard to price for both sides. INDEC data show pharmaceutical billing rising 32.7% in nominal pesos in just one year to the first quarter of 2026. Providers that sign fixed tariffs can lose margin within months, while shippers face frequent renegotiation. Indexation clauses tied to official inflation data can protect providers, but they make annual budgets harder for shippers to plan.
Shifting trade quotas can strand protein volumes
Export rules in destination markets change quickly, which can leave frozen beef waiting in cold stores. China's above-quota tariff of 55% from 2026 and a U.S. quota increase that applies only to 2026 show how fast access can move. Packers then redirect cargo, and cold stores near ports can fill or empty at short notice. Providers that serve several exporters and markets spread this risk better than single-client sites.
Weak domestic beef consumption limits chilled retail volume
Local beef consumption is near a record low as cheaper poultry and pork keep gaining share, according to the USDA Foreign Agricultural Service. This reduces chilled beef flows to butchers and supermarkets, which are a core load for domestic reefer fleets. Distributors offset part of the loss with poultry, pork, dairy and frozen meals, but those loads often carry lower margins per pallet than premium beef.
Buenos Aires leads while outer provinces grow fastest
| Province | Value, 2025 (USD billion) | Share, 2025 | CAGR, 2026–2035 |
|---|---|---|---|
| Buenos Aires | 0.63 | 52.0% | 8.92% |
| Remaining Provinces | 0.26 | 22.0% | 9.72% |
| Santa Fe | 0.18 | 15.0% | 9.52% |
| Córdoba | 0.13 | 11.0% | 9.42% |
Buenos Aires concentrates gateways, labs and cold stores
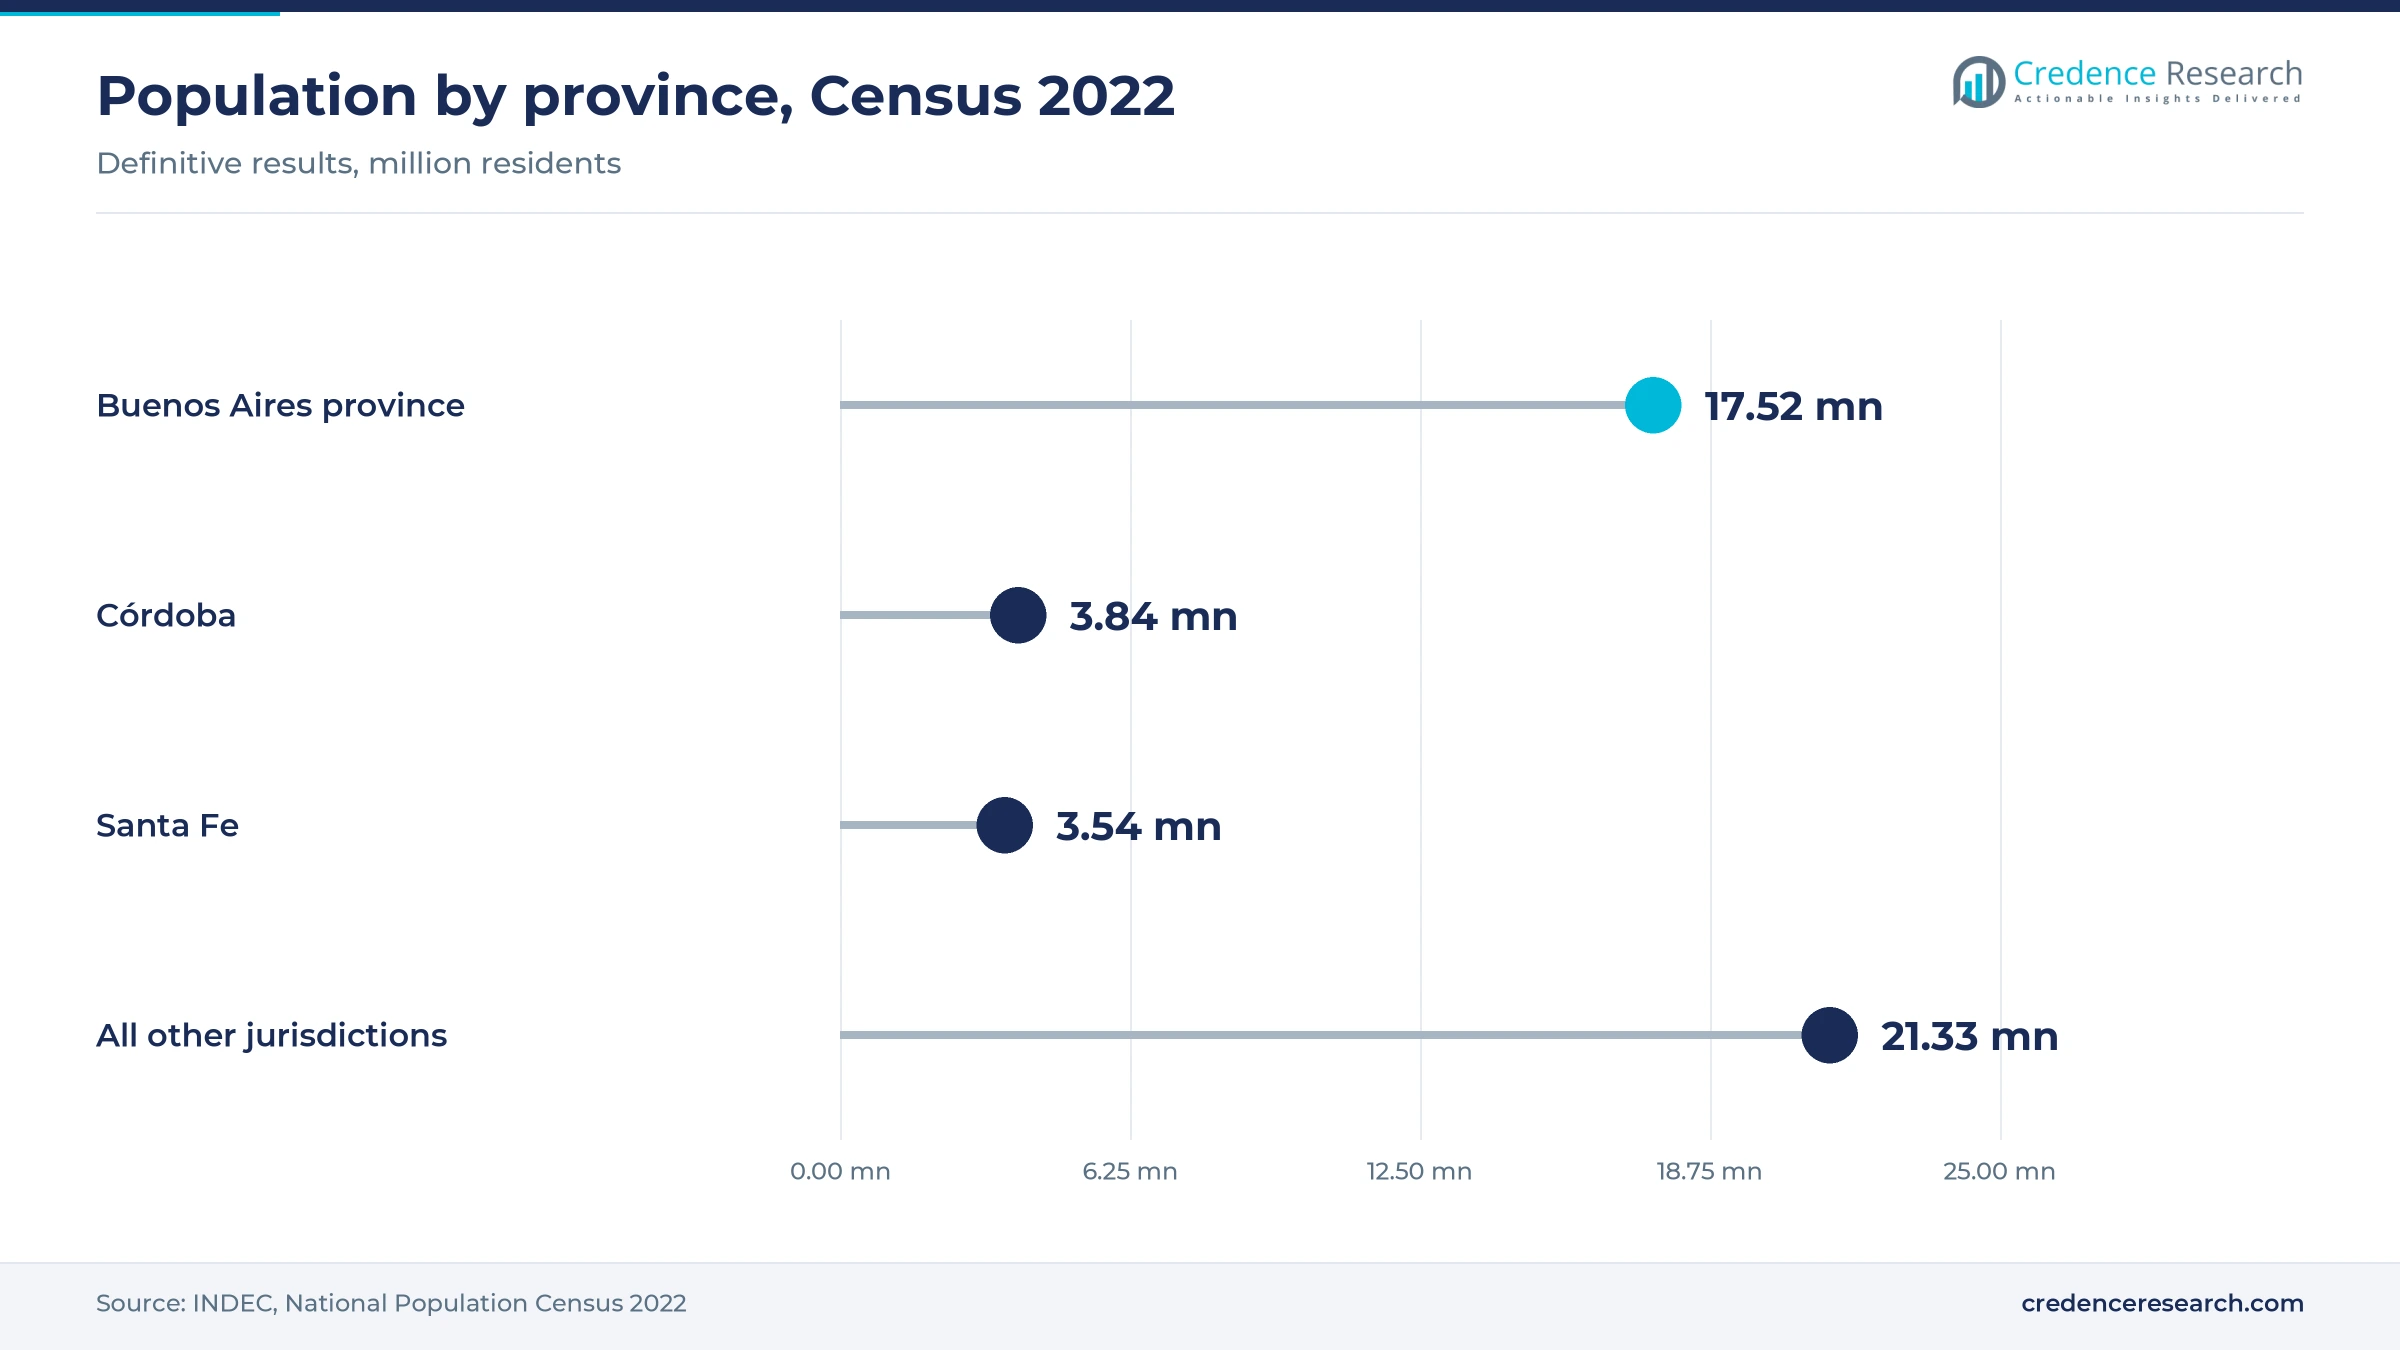
Buenos Aires held 52.0% of 2025 value and grows at 8.92% a year, because the province and the capital city concentrate demand, drug laboratories and gateway infrastructure. The province alone counted 17.52 million residents in the 2022 census, the largest population of any jurisdiction. Vaccines arriving at Ezeiza airport move by refrigerated truck to Andreani's special products plant, while Americold and Frío Dock run large frozen and chilled sites nearby. Growth trails the national rate slightly because the base is already large.
Santa Fe links meat plants, dairies and river ports
Santa Fe held 15.0% of 2025 value and grows at 9.52% a year, as the province combines export packing plants, dairies and river ports. It counted 3.54 million residents in the 2022 census, but its cold chain spending is larger than its population share because of export processing. Andreani opened a logistics center in Santo Tomé in 2013 that is licensed to handle medicines and has cold rooms. Rising milk output and beef exports keep Santa Fe ahead of Córdoba in value.
Córdoba gains from dairy output and central location
Córdoba held 11.0% of 2025 value and grows at 9.42% a year, as its dairies and food plants supply chilled products to the whole country. The province counted 3.84 million residents in the 2022 census and sits on the main road between Buenos Aires, Cuyo and the northwest. DSV runs an office in Córdoba alongside its Buenos Aires and Ezeiza sites. National milk output grew 9.7% in 2025, which lifts chilled loads leaving Córdoba dairies.
Remaining provinces grow fastest on seafood and fruit
The remaining provinces held 22.0% of 2025 value and grow fastest at 9.72% a year, as coastal fishing ports, fruit valleys and northern meat plants add refrigerated volume from a smaller base. Shrimp exports of USD 867 million in 2025 depend on freezing and storage near landing sites. Long distances to Buenos Aires terminals push shippers toward new cold storage close to production. As a result, providers that open regional cross-docks win share in these provinces.
Rules, quotas and investments from 2025 to 2026
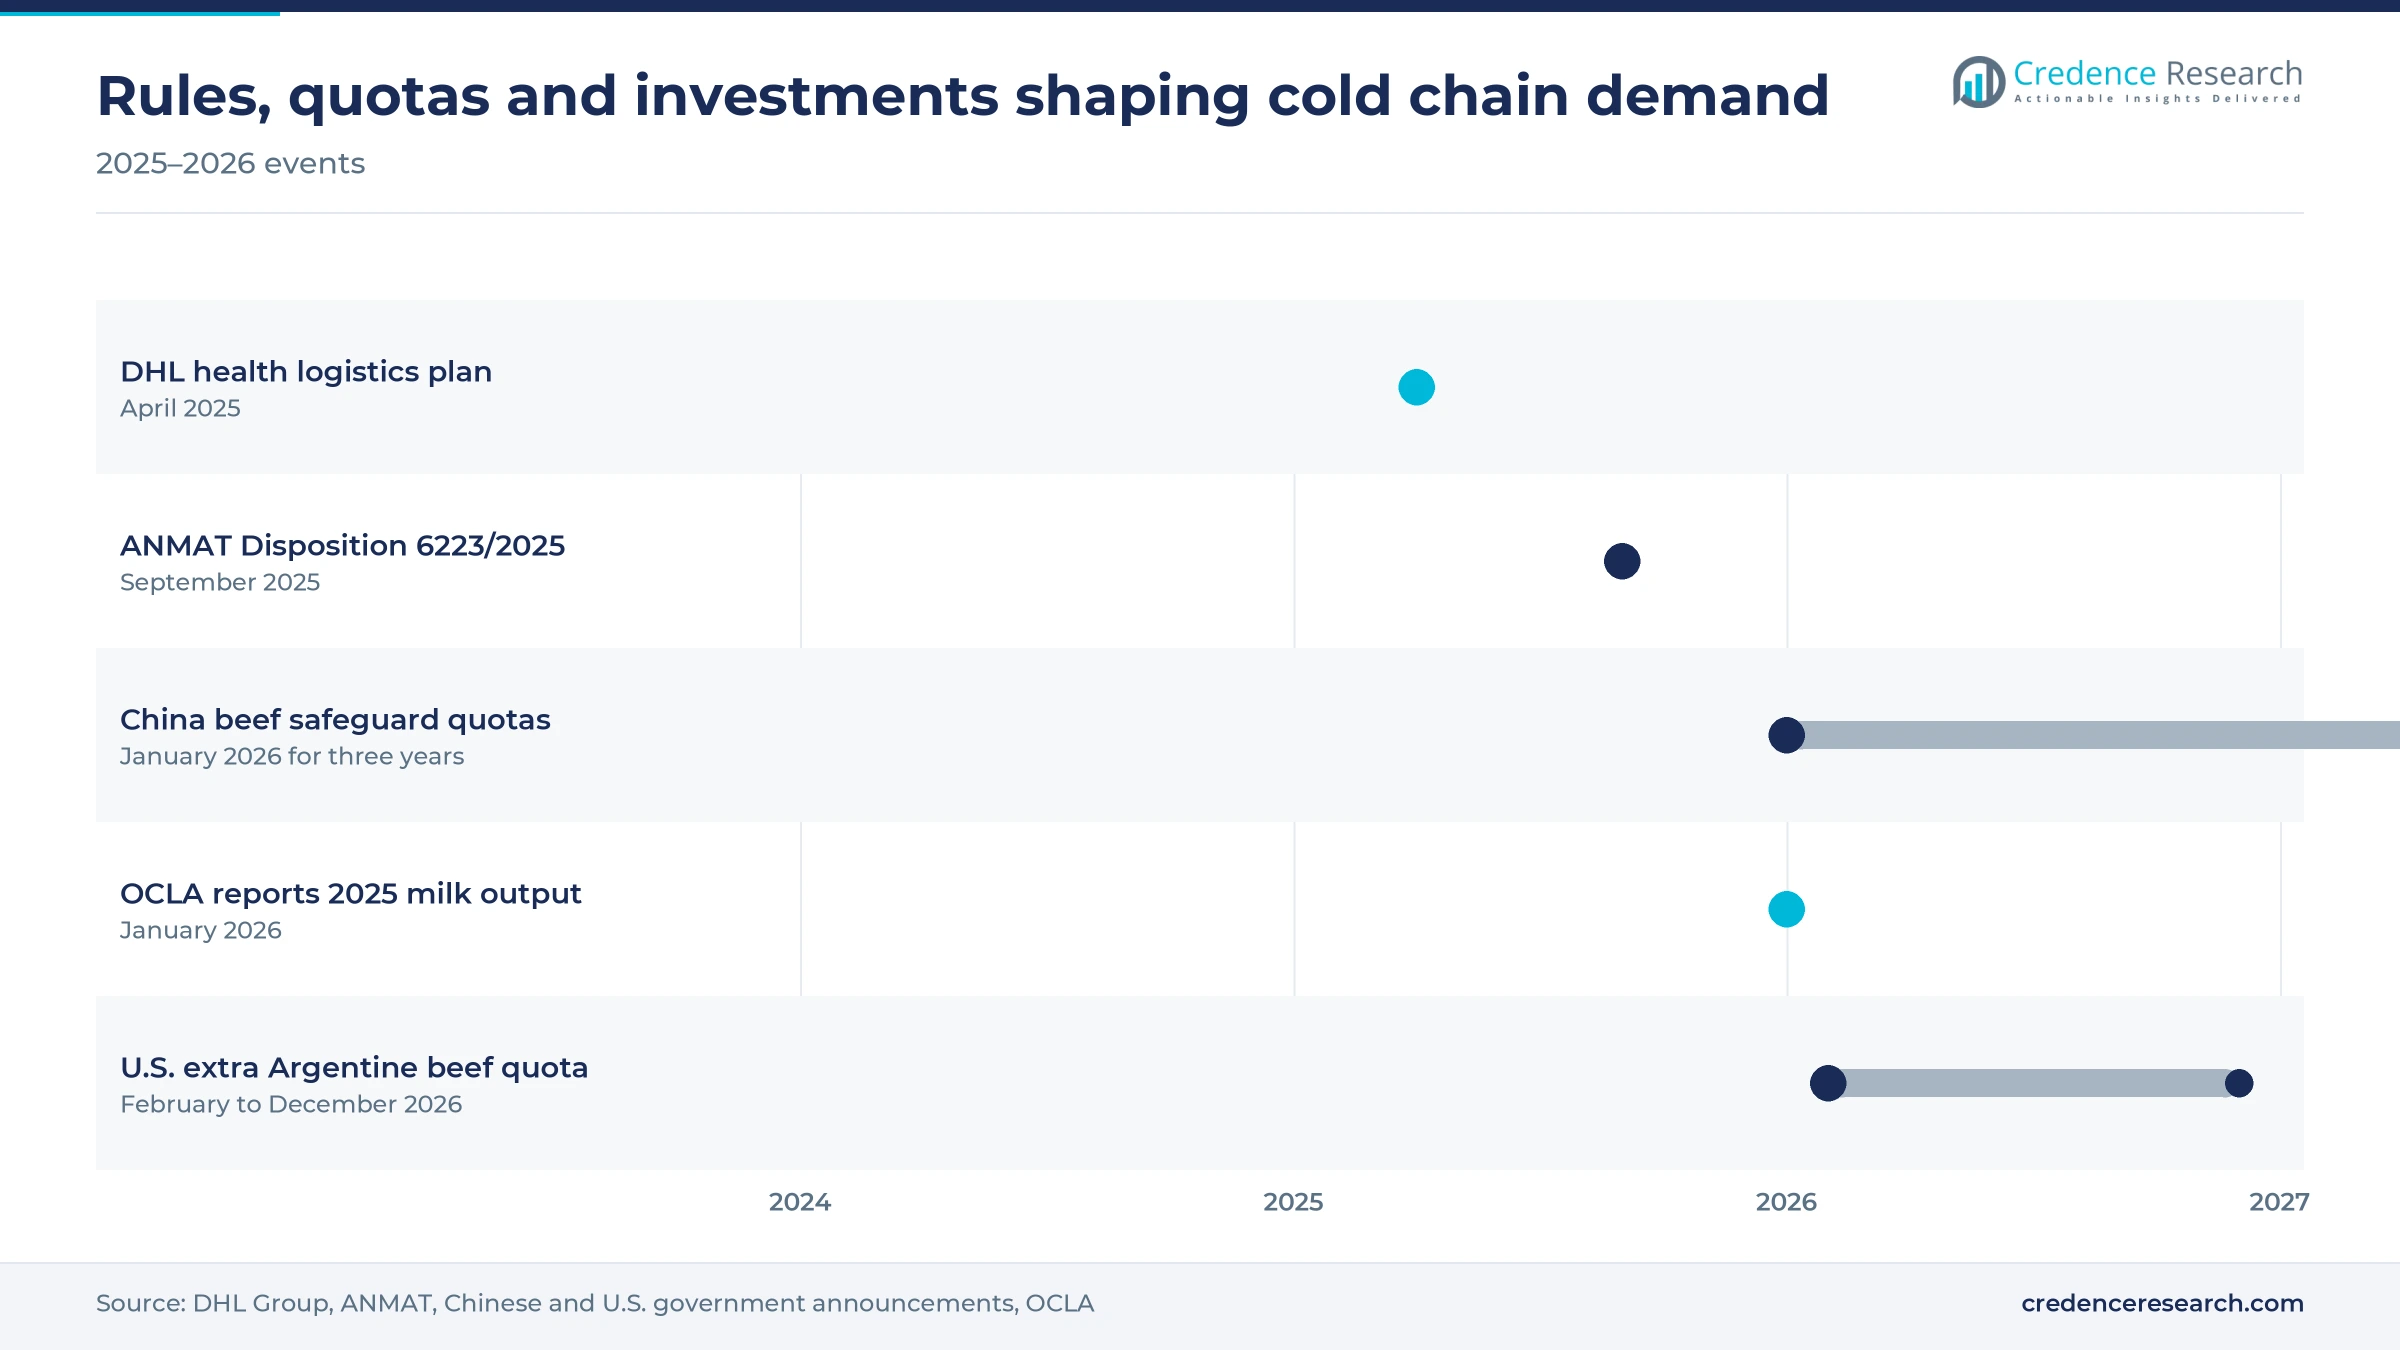
| Development | Status and market relevance |
|---|---|
| In April 2025, DHL Group announced a EUR 2 billion health logistics investment plan to 2030 under the new DHL Health Logistics brand, with 10% earmarked for Latin America. | Announced; adds GDP-certified sites and cold-chain capacity across the region |
| In September 2025, ANMAT published Disposition 6223/2025, updating the national medicine traceability list to 495 active ingredients, including insulins and coagulation factors. | In force; product holders had 45 business days to comply |
| In December 2025, China announced beef safeguard quotas with an extra 55% tariff on above-quota imports, effective Jan. 1, 2026 for three years. | In force; pushes Argentine packers toward other markets |
| In February 2026, a U.S. proclamation added 80,000 metric tons of in-quota access for Argentine lean beef trimmings for 2026 in four quarterly tranches. | In force through December 2026; supports frozen beef exports |
Active containers and freezing tunnels widen capacity
- Active containers such as Envirotainer units keep biologic and clinical trial shipments at set temperatures on long air legs, and Vanner Logistics offers them as a national agent.
- Serialized traceability under ANMAT rules links each pack to a GTIN and serial number, which lets distributors match movement records with storage conditions.
- Freezing tunnels at Americold Pilar handle up to 50 pallets each, which lets exporters bring beef, pork and poultry to frozen temperature before loading.
- Low-temperature racking at sites such as Frío Dock in Tortuguitas holds about 2,280 pallets at a constant minus 25 °C close to Buenos Aires consumers.
Need a Custom Version of This Report?
Tailor the scope, geography, or segments to your exact requirements.
- Custom geography or segment scope
- Direct access to our analyst team
Local operators compete with global forwarders
Competition splits between local logistics groups with national networks and global forwarders that control air and ocean capacity. Grupo Logístico Andreani is the leading local name in medicine distribution, with special products plants for 2 °C to 8 °C storage and a long record in national vaccine logistics. TASA Logística expanded its storage network in 2020 by buying the Argentine contract logistics business of Kuehne+Nagel, which kept its air and sea forwarding. Americold and Frío Dock compete in frozen and multi-temperature storage around Buenos Aires, while DSV runs forwarding from Buenos Aires, Córdoba and Ezeiza. Marken and Vanner Logistics focus on clinical trial and biologic shipments that need active containers and GMP-grade depots. Providers win contracts on validated temperature control, export licenses from SENASA, national reach and the ability to tie temperature data to ANMAT traceability records.
Local operators and global forwarders active in Argentina
| Company | Type | Role in the market |
|---|---|---|
| Grupo Logístico Andreani | National 3PL | Medicine distribution and vaccine logistics with 2 °C to 8 °C special products plants |
| TASA Logística | National 3PL | Contract storage and distribution; acquired Kuehne+Nagel contract logistics in 2020 |
| Americold | Cold storage operator | Multi-temperature sites at Mercado Central and Pilar with SENASA export approval |
| Frío Dock | Cold storage operator | Frozen warehouse in Tortuguitas at minus 25 °C |
| Kuehne+Nagel | Global forwarder | Air and sea forwarding after selling its domestic contract logistics to TASA in 2020 |
| DSV | Global forwarder | Air, sea and road forwarding from Buenos Aires, Córdoba and Ezeiza |
| Marken | Clinical logistics specialist | GMP and GDP compliant drug depot in Buenos Aires |
| Vanner Logistics | Specialty forwarder | National agent for Envirotainer active containers |
| DHL | Global logistics group | Health logistics network with planned Latin American investment |
Export access and drug traceability set the pace
Credence Research's view is that export access and drug traceability, more than domestic consumption, will set the pace of growth in Argentina. Beef and shrimp exports already generate most of the frozen volume, and new quotas in the United States and safeguards in China will move that volume between routes rather than remove it. On the medicine side, the expanded ANMAT traceability list raises the value of every validated pallet and delivery. Providers that combine SENASA export approvals, GDP-grade storage and temperature data linked to serial numbers are best placed to win the largest contracts through 2035.
Trade, industry and census data feed the model
The report uses 2025 as the base year and forecasts to 2035. Market values come from the Credence Research model, which combines export volumes and values from INDEC and the Secretariat of Agriculture, Livestock and Fisheries, pharmaceutical industry statistics from INDEC, census population by province, regulatory texts from ANMAT and company disclosures on facilities. Provincial and segment splits are Credence Research estimates based on population, the location of plants, ports and warehouses, and the mix of cargo. No interviews or surveys were conducted for this edition of the report.
Export diversification carries growth to 2035
The market is expected to grow from USD 1.32 billion in 2026 to USD 2.93 billion by 2035 at 9.25% a year. Export-linked services will gain share as packers spread beef across China, the United States, Israel and Europe, and as shrimp shipments recover. Pharmaceutical handling will remain the fastest-growing end use because traceability rules now reach insulins, coagulation factors and oncology drugs. The remaining provinces will keep the highest growth as storage moves closer to fishing ports and fruit valleys, while Buenos Aires stays the largest hub.
Frequently Asked Questions
How big is the Argentina food and pharmaceutical cold chain market?
Which province leads the market?
Which zone grows fastest?
Which end use holds the largest share?
Which end use grows fastest?
How do beef exports affect cold chain demand?
What changed in medicine traceability rules?
Which companies are active in the market?
Table of Content
Chapter 1 Market Segmentation
- 1.1 Segmentation Framework
- 1.1.1 Product and Service Classification
- 1.1.2 Application and End-Use Classification
- 1.1.3 Technology and Solution Classification
- 1.1.4 Customer and Distribution Channel Classification
- 1.1.5 Geographic Segmentation
- 1.1.6 Market Segment Definitions and Boundaries
- 1.2 By Service Type
- 1.2.1 Refrigerated Transport
- 1.2.2 Cold Storage
- 1.2.3 Controlled Handling Services
- 1.3 By End-Use Industry
- 1.3.1 Meat and Seafood
- 1.3.2 Dairy Products
- 1.3.3 Produce and Processed Food
- 1.3.4 Pharmaceuticals
- 1.4 By Shipment Flow
- 1.4.1 Domestic Distribution
- 1.4.2 Export-Linked Services
- 1.4.3 Import-Linked Services
- 1.5 By Business Model
- 1.5.1 Integrated Contract Logistics
- 1.5.2 Transactional Logistics
- 1.5.3 Managed Specialty Logistics
- 1.6 By Province
- 1.6.1 Buenos Aires
- 1.6.2 Santa Fe
- 1.6.3 Córdoba
- 1.6.4 Remaining Provinces
Chapter 2 Introduction
- 2.1 Report Objectives and Scope
- 2.2 Product Definition and Industry Terminology
- 2.3 Market Inclusions and Exclusions
- 2.4 Research Process
- 2.4.1 Primary Research and Expert Interviews
- 2.4.2 Secondary Research and Source Review
- 2.4.3 Top-Down and Bottom-Up Estimation
- 2.4.4 Data Triangulation and Verification
- 2.5 Market Size Measurement Basis
- 2.5.1 2025: USD 1.20 billion → 2035: USD 2.93 billion
- 2.6 Historical and Forecast Reference Periods
- 2.6.1 Historical Period: 2018-2025
- 2.6.2 Base Year: 2025
- 2.6.3 Forecast Period: 2025-2035
- 2.7 Research Assumptions and Limitations
Chapter 3 Executive Summary
- 3.1 Market Snapshot and Key Findings
- 3.2 Base-Year Market Size, 2025
- 3.3 Forecast Market Size, 2035
- 3.4 Revenue and Volume Growth Outlook
- 3.5 Key Demand and Supply Indicators
- 3.6 Leading Market Segments
- 3.7 Fastest-Growing Market Opportunities
- 3.8 Regional Performance Highlights
- 3.9 Technology and Industry Transformation
- 3.10 Competitive Landscape Summary
- 3.11 Analyst View and Strategic Implications
Chapter 4 Argentina Food and Pharmaceutical Cold Chain Market Trends and Developments
- 4.1 Historical Industry Development, 2018-2025
- 4.2 Recent Market Trends and Developments
- 4.3 Demand and Customer Behavior Trends
- 4.4 Technology and Product Innovation
- 4.5 Artificial Intelligence, Automation and Digitalization
- 4.6 Local Manufacturing and Supply Chain Realignment
- 4.7 Industry Partnerships, Mergers and Acquisitions
- 4.8 Sustainability and Circular Economy Developments
- 4.9 Government and Private Sector Investment Trends
- 4.10 Emerging Business Models and Commercialization
- 4.11 Industry Developments and Announcements
Chapter 5 Argentina Food and Pharmaceutical Cold Chain Market Production, Supply and Demand Analysis
- 5.1 Demand Trend and Consumption Analysis, 2018-2025
- 5.2 Demand Forecast, 2025-2035
- 5.3 Production and Output Trend, 2018-2025
- 5.4 Production and Output Forecast, 2025-2035
- 5.5 Installed Capacity and Capacity Utilization
- 5.6 Company-Wise Production Plants and Statistics
- 5.6.1 Installed Production Capacity
- 5.6.2 Actual Production
- 5.6.3 Planned Capacity and Expansion Targets
- 5.7 Supply Chain Structure and Procurement Trends
- 5.8 Supply-Demand Gap and Bottlenecks
- 5.9 Import Dependence and Sourcing Structure
- 5.10 Contract Manufacturing and Outsourcing
- 5.11 Regional Supply and Demand Concentration
Chapter 6 Argentina Food and Pharmaceutical Cold Chain Market Pricing Analysis
- 6.1 Pricing Structure and Measurement
- 6.2 Historical Pricing Trends, 2018-2025
- 6.3 Pricing Outlook, 2025-2035
- 6.4 Average Selling Price and Unit Economics
- 6.5 Pricing by Product and Market Segment
- 6.6 Geographic Pricing Differences
- 6.7 Key Input, Energy, Labor and Logistics Costs
- 6.8 Contract Pricing and Purchasing Models
- 6.9 Pricing Sensitivity and Competitive Positioning
- 6.10 Price, Margin and Profitability Implications
Chapter 7 Argentina Food and Pharmaceutical Cold Chain Market Dynamics
- 7.1 Market Growth Drivers
- 7.1.1 Demand-Side Drivers
- 7.1.2 Technology and Innovation Drivers
- 7.1.3 Infrastructure and Investment Drivers
- 7.1.4 Regulatory and Policy Drivers
- 7.2 Market Restraints
- 7.2.1 Cost and Affordability Constraints
- 7.2.2 Technology and Adoption Barriers
- 7.2.3 Supply Chain and Operational Constraints
- 7.3 Market Challenges
- 7.3.1 Competitive Pressure and Margin Erosion
- 7.3.2 Skills, Infrastructure and Implementation Gaps
- 7.4 Emerging Market Opportunities
- 7.5 Market Dynamics Impact and Time-Horizon Assessment
Chapter 8 Argentina Food and Pharmaceutical Cold Chain Value Chain Analysis
- 8.1 Industry Value Chain Overview
- 8.2 Upstream Suppliers and Critical Inputs
- 8.3 Technology and Component Providers
- 8.4 Manufacturing or Service Delivery
- 8.5 Distribution, Channel Partners and Integrators
- 8.6 Downstream Applications and End Users
- 8.7 Value Addition and Profit Pools
- 8.8 Vertical Integration and Outsourcing
- 8.9 Supplier Concentration and Risk
- 8.10 Supply Chain Localization and Resilience
Chapter 9 Argentina Food and Pharmaceutical Cold Chain Market Regulations and Policies
- 9.1 Relevant Laws, Standards and Compliance Frameworks
- 9.2 Product, Service, Safety and Quality Requirements
- 9.3 Government Policies, Incentives and Subsidies
- 9.4 Imports, Exports and Trade Barriers
- 9.5 Public Procurement and Local Content Requirements
- 9.6 Environmental and Sustainability Compliance
- 9.7 Upcoming Policy Changes and Market Implications
Chapter 10 Argentina Food and Pharmaceutical Cold Chain Market Hotspots and Opportunities
- 10.1 Market Opportunity Mapping and Growth Hotspots
- 10.2 High-Growth Applications and Customer Groups
- 10.3 Underserved Markets and White-Space Opportunities
- 10.4 Emerging Technology and Product Opportunities
- 10.5 New Capacity and Investment Hotspots
- 10.6 Market Entry and Expansion Opportunities
- 10.7 Distribution and Partnership Opportunities
- 10.8 Near-Term and Long-Term Commercial Potential
- 10.9 Opportunity Attractiveness and Execution Risks
Chapter 11 Argentina Food and Pharmaceutical Cold Chain Market Outlook, 2025-2035
- 11.1 Market Size and Analysis
- 11.1.1 Revenue (Market Measurement: 2025: USD 1.20 billion → 2035: USD 2.93 billion)
- 11.1.2 Market Volume and Quantity Sold
- 11.1.3 Historical Market Size, 2018-2025
- 11.1.4 Base-Year Market Size, 2025
- 11.2 Market Forecast, 2025-2035
- 11.2.1 Revenue Forecast to 2035
- 11.2.2 Volume Forecast to 2035
- 11.2.3 CAGR and Year-on-Year Growth
- 11.2.4 Incremental Revenue Opportunity
- 11.3 Forecast Assumptions and Scenario Analysis
- 11.3.1 Base-Case Forecast
- 11.3.2 Optimistic and Conservative Scenarios
- 11.3.3 Technology, Pricing and Policy Sensitivities
- 11.4 Market Attractiveness and Growth Outlook
Chapter 12 Argentina Food and Pharmaceutical Cold Chain Market Segmentation and Outlook
- 12.1 Segmentation Summary and Market Shares, 2025
- 12.2 Largest and Fastest-Growing Segments
- 12.3 By Service Type - Market Size and Forecast, 2025-2035
- 12.3.1 Segment Definition and Scope
- 12.3.2 Historical Market Size, 2018-2025
- 12.3.3 Revenue Forecast, 2025-2035
- 12.3.4 Volume Forecast, 2025-2035
- 12.3.5 Base-Year Market Share, 2025
- 12.3.6 Segment CAGR and Growth Drivers
- 12.3.7 Subsegment Market Size and Forecast
- 12.3.7.1 Refrigerated Transport
- 12.3.7.2 Cold Storage
- 12.3.7.3 Controlled Handling Services
- 12.3.8 Subsegment Pricing and Adoption Trends
- 12.3.9 Leading Suppliers and Competition
- 12.3.10 Regional Demand and Opportunities
- 12.4 By End-Use Industry - Market Size and Forecast, 2025-2035
- 12.4.1 Segment Definition and Scope
- 12.4.2 Historical Market Size, 2018-2025
- 12.4.3 Revenue Forecast, 2025-2035
- 12.4.4 Volume Forecast, 2025-2035
- 12.4.5 Base-Year Market Share, 2025
- 12.4.6 Segment CAGR and Growth Drivers
- 12.4.7 Subsegment Market Size and Forecast
- 12.4.7.1 Meat and Seafood
- 12.4.7.2 Dairy Products
- 12.4.7.3 Produce and Processed Food
- 12.4.7.4 Pharmaceuticals
- 12.4.8 Subsegment Pricing and Adoption Trends
- 12.4.9 Leading Suppliers and Competition
- 12.4.10 Regional Demand and Opportunities
- 12.5 By Shipment Flow - Market Size and Forecast, 2025-2035
- 12.5.1 Segment Definition and Scope
- 12.5.2 Historical Market Size, 2018-2025
- 12.5.3 Revenue Forecast, 2025-2035
- 12.5.4 Volume Forecast, 2025-2035
- 12.5.5 Base-Year Market Share, 2025
- 12.5.6 Segment CAGR and Growth Drivers
- 12.5.7 Subsegment Market Size and Forecast
- 12.5.7.1 Domestic Distribution
- 12.5.7.2 Export-Linked Services
- 12.5.7.3 Import-Linked Services
- 12.5.8 Subsegment Pricing and Adoption Trends
- 12.5.9 Leading Suppliers and Competition
- 12.5.10 Regional Demand and Opportunities
- 12.6 By Business Model - Market Size and Forecast, 2025-2035
- 12.6.1 Segment Definition and Scope
- 12.6.2 Historical Market Size, 2018-2025
- 12.6.3 Revenue Forecast, 2025-2035
- 12.6.4 Volume Forecast, 2025-2035
- 12.6.5 Base-Year Market Share, 2025
- 12.6.6 Segment CAGR and Growth Drivers
- 12.6.7 Subsegment Market Size and Forecast
- 12.6.7.1 Integrated Contract Logistics
- 12.6.7.2 Transactional Logistics
- 12.6.7.3 Managed Specialty Logistics
- 12.6.8 Subsegment Pricing and Adoption Trends
- 12.6.9 Leading Suppliers and Competition
- 12.6.10 Regional Demand and Opportunities
- 12.7 By Province - Market Size and Forecast, 2025-2035
- 12.7.1 Segment Definition and Scope
- 12.7.2 Historical Market Size, 2018-2025
- 12.7.3 Revenue Forecast, 2025-2035
- 12.7.4 Volume Forecast, 2025-2035
- 12.7.5 Base-Year Market Share, 2025
- 12.7.6 Segment CAGR and Growth Drivers
- 12.7.7 Subsegment Market Size and Forecast
- 12.7.7.1 Buenos Aires
- 12.7.7.2 Santa Fe
- 12.7.7.3 Córdoba
- 12.7.7.4 Remaining Provinces
- 12.7.8 Subsegment Pricing and Adoption Trends
- 12.7.9 Leading Suppliers and Competition
- 12.7.10 Regional Demand and Opportunities
- 12.8 Segment Growth Comparison
- 12.9 Segment Attractiveness and Priority Matrix
Chapter 13 Argentina Food and Pharmaceutical Cold Chain End-Use and Application Market Outlook
- 13.1 End-Use Industry and Customer Demand Structure
- 13.2 Leading Applications and Customer Groups
- 13.3 End-Use Market Size, Share and Forecast
- 13.4 Major End-Use Industry Deep Dives
- 13.4.1 Customer Requirements and Use Cases
- 13.4.2 Demand and Replacement Cycles
- 13.4.3 Technical and Regulatory Considerations
- 13.4.4 Purchasing and Procurement Models
- 13.4.5 Leading Vendors and Distribution Channels
- 13.4.6 Forecast and Commercial Opportunities
- 13.5 Emerging Applications and Cross-Segment Demand
- 13.6 End-Use Industry Investment Priorities
Chapter 14 Argentina Food and Pharmaceutical Cold Chain Geographic Market Outlook, 2025-2035
- 14.1 Domestic Market Distribution and Demand Clusters
- 14.2 State- or Province-Wise Market Size and Forecast, 2025-2035
- 14.3 City and Metropolitan Market Outlook
- 14.4 Industrial, Manufacturing and Commercial Clusters
- 14.5 Geographic Concentration of Key End Users
- 14.6 Local Pricing and Purchasing Differences
- 14.7 Domestic Production Facilities and Capacity Map
- 14.8 Local Infrastructure and Project Pipeline
- 14.9 State-Level Policy and Incentive Differences
- 14.10 Subnational Investment Hotspots and Opportunities
- 14.11 Distribution and Logistics Networks
- 14.12 Domestic Competitive Footprint
Chapter 15 Argentina Food and Pharmaceutical Cold Chain Technology, Innovation and Sustainability Outlook
- 15.1 Technology Landscape and Maturity
- 15.2 Product, Process and Service Innovation
- 15.3 AI, Automation and Digital Tools in the Industry
- 15.4 Technology Adoption and Performance Benchmarking
- 15.5 Innovation Pipeline and R&D Investment
- 15.6 Patent and Intellectual Property Trends
- 15.7 Energy Efficiency and Resource Management
- 15.8 Sustainability, Recycling and Circularity
- 15.9 Technology Roadmap, 2025-2035
- 15.10 Risks of Obsolescence and Technology Substitution
Chapter 16 Argentina Food and Pharmaceutical Cold Chain Market Key Strategic Imperatives
- 16.1 Growth and Market Entry Priorities
- 16.2 High-Return Products and Segments
- 16.3 Pricing, Profitability and Cost Optimization
- 16.4 Technology Investment and Product Differentiation
- 16.5 Supply Chain Localization and Resilience
- 16.6 Distribution and Customer Acquisition
- 16.7 Partnership, Acquisition and Capacity Strategy
- 16.8 Regional Expansion Priorities
- 16.9 Short-, Medium- and Long-Term Actions
Chapter 17 Competition Outlook
- 17.1 Industry Competition Characteristics
- 17.2 Market Structure and Concentration
- 17.3 Market Share and Competitive Positioning, 2025
- 17.4 Company-Wise Revenue and Product Benchmarking
- 17.5 Production and Service Capacity Benchmarking
- 17.6 Technology, Pricing and Differentiation
- 17.7 Regional Footprint and Distribution Strength
- 17.8 Mergers, Acquisitions and Strategic Alliances
- 17.9 New Entrants and Competitive Threats
- 17.10 Porter's Five Forces and Industry Attractiveness
- 17.11 Competitive Outlook, 2025-2035
Chapter 18 Company Profiles
- 18.1 Company Coverage and Selection Criteria
- 18.2 Grupo Logístico Andreani
- 18.2.1 Business Description
- 18.2.2 Company Ownership and Geographic Presence
- 18.2.3 Product and Service Portfolio
- 18.2.4 Manufacturing and Operating Footprint
- 18.2.5 Production Capacity and Expansion Plans
- 18.2.6 Financial Performance and Investment
- 18.2.7 Market Share and Competitive Position
- 18.2.8 Technology and Innovation Capabilities
- 18.2.9 Strategic Alliances or Partnerships
- 18.2.10 Recent Developments
- 18.2.11 Growth Strategy and Outlook
- 18.3 DHL
- 18.4 Kuehne+Nagel
- 18.5 DSV
- 18.6 CEVA Logistics
- 18.7 TASA Logística
- 18.8 Americold
- 18.9 Vanner Logistics
- 18.10 Marken
- 18.11 Frío Dock
- 18.12 Other Relevant Market Participants
Note: Every listed company is profiled on the structure shown under the first company. The company list is preliminary and may change based on research findings, market developments, data availability and client requirements.
Chapter 19 Disclaimer
- 19.1 Research and Forecast Disclaimer
- 19.2 Data Source and Estimation Limitations
Note: The depth of individual sections depends on data availability for this market. Volume, capacity, trade and other unit-based metrics are included where applicable.

