
Free trade, corridor reform and export rules lift advice
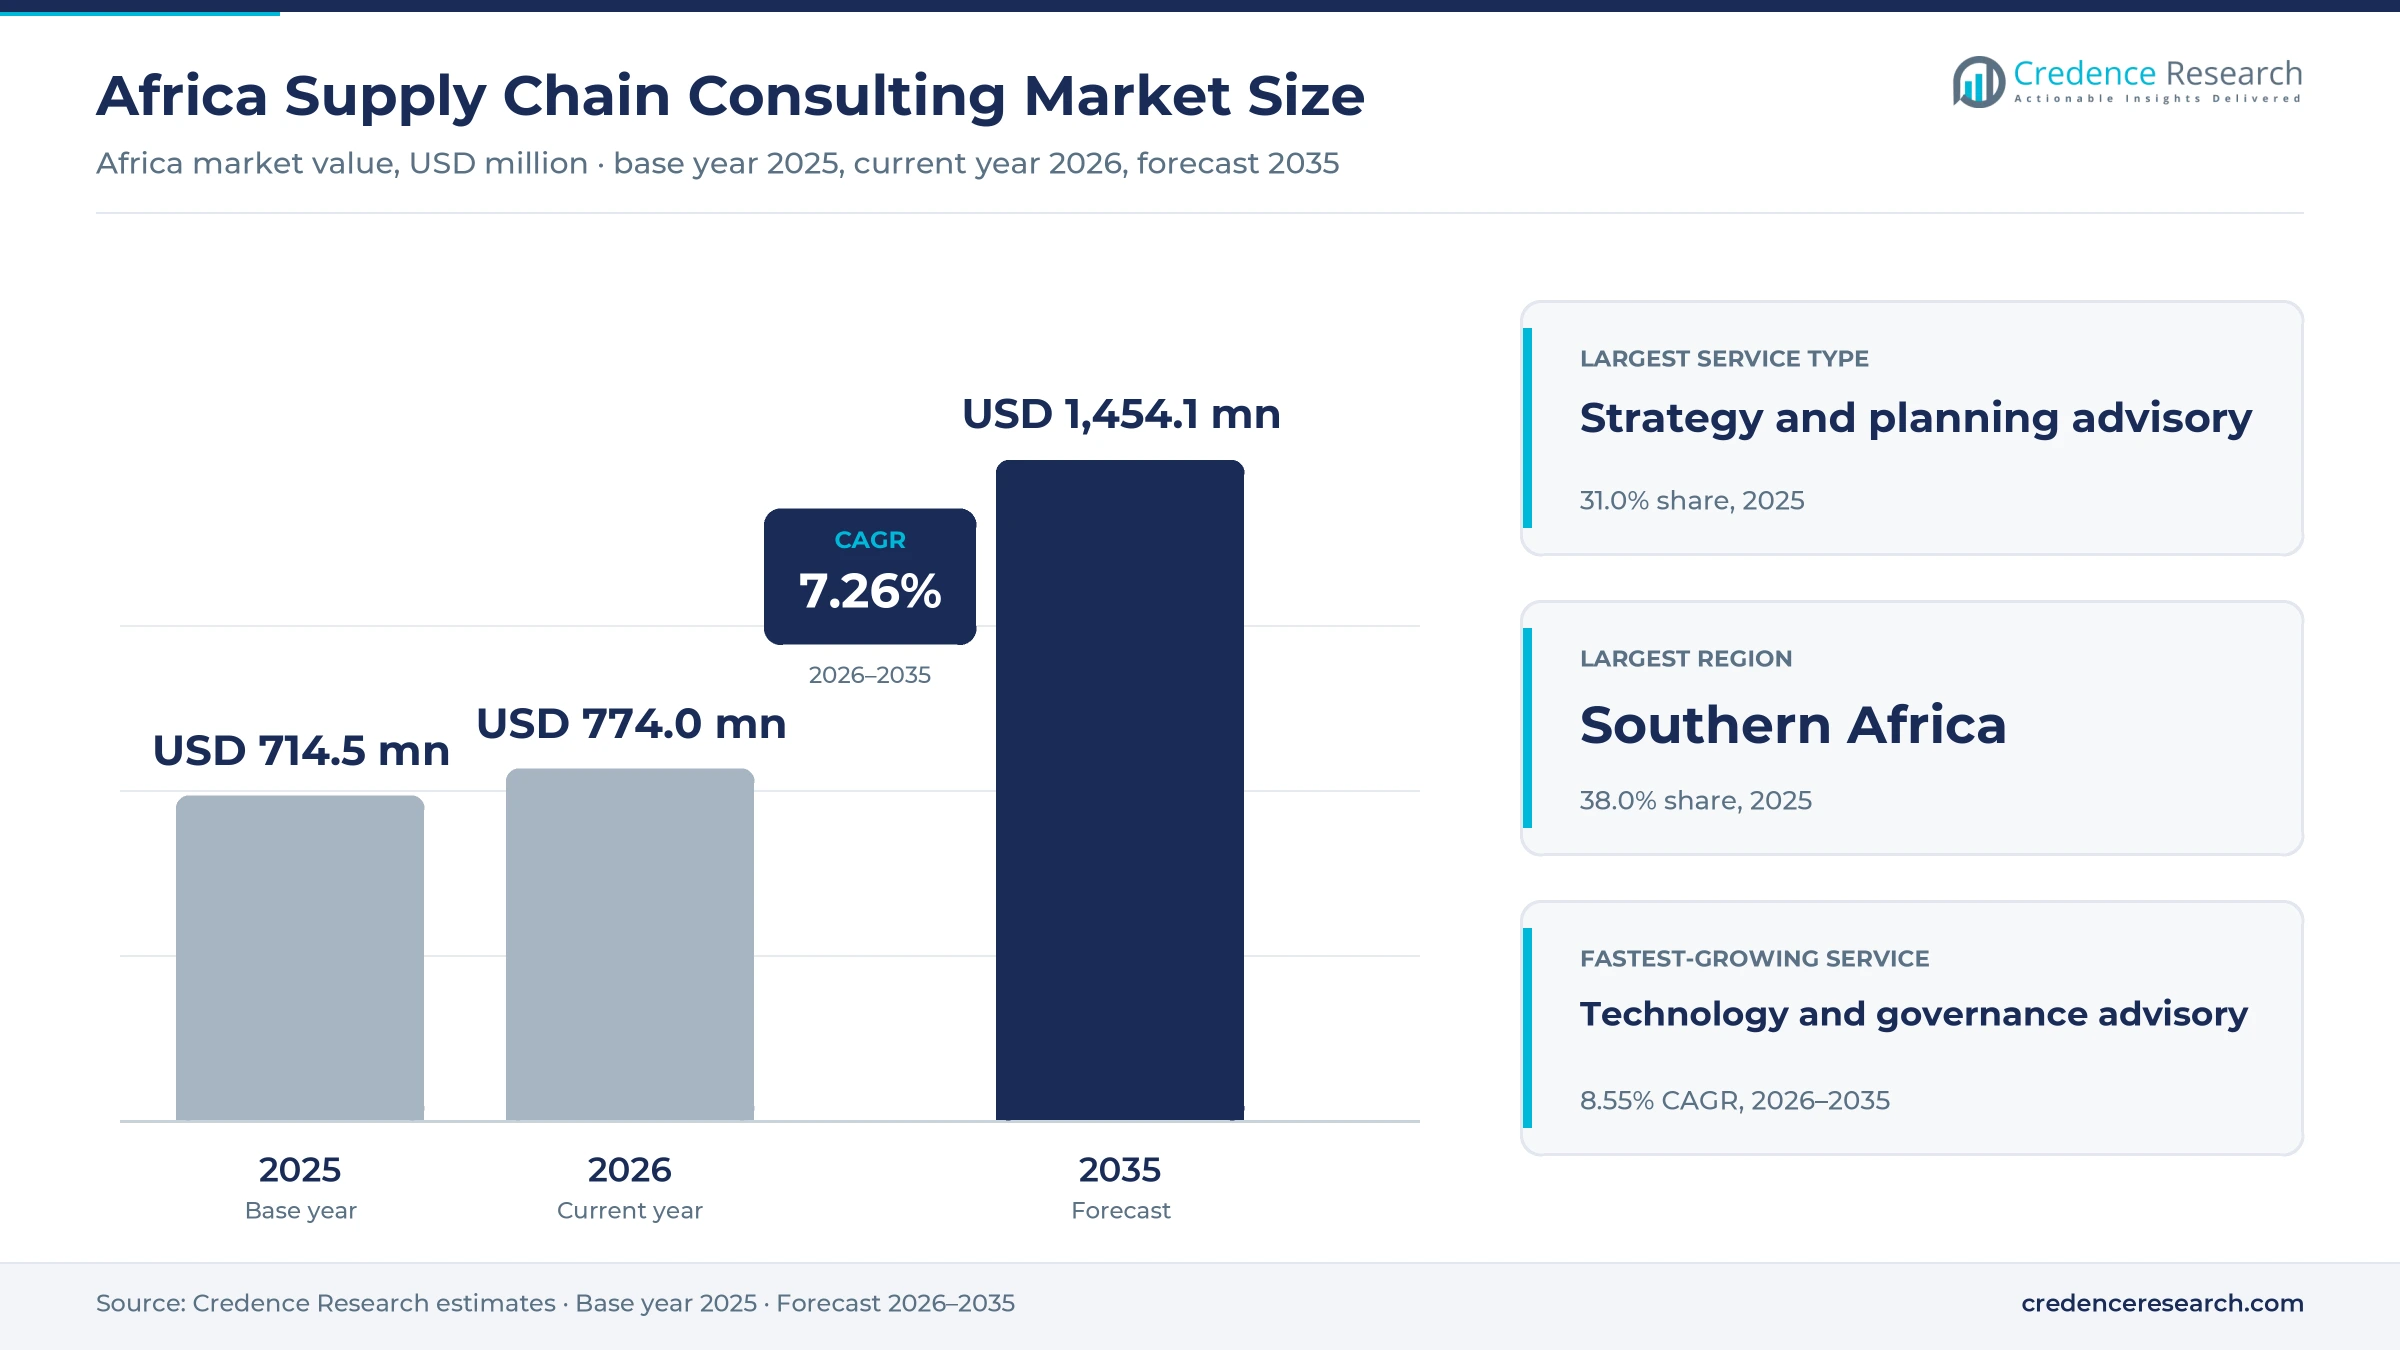
The Africa supply chain consulting market was valued at USD 196.5 million in 2025 and is projected to increase from USD 210.8 million in 2026 to USD 396.1 million by 2035, registering a CAGR of 7.26% during 2026–2035. Demand comes from consumer goods makers, miners, manufacturers, health agencies and donor programs that hire advisers to redesign cross-border networks, run sourcing programs, deploy planning software and prove product origin. Southern Africa held the largest regional share, 38.0% in 2025, because Johannesburg hosts most regional consulting offices and many listed retail, mining and freight groups. Central Africa is the fastest-growing region at 8.37% a year, as copper and cobalt corridors draw new rail and port investment. However, the European Union pushed its deforestation rules back to December 2026 for large operators, which gives cocoa and coffee exporters a short window to finish farm mapping and evidence systems.
Which advisory services and fees does the estimate cover?
The estimate measures fees paid to consulting firms for supply network strategy, procurement and sourcing programs, logistics and distribution design, and planning technology and governance advice across Africa. Buyers include corporate groups, independent growth enterprises, public-sector agencies and programs funded by development partners, which buy through direct contracts, tenders and partner referrals.
The estimate excludes freight, warehousing and customs brokerage services, software licenses, outsourced procurement operations and in-house planning staff. The value chain runs from producers and miners through ports, rail corridors, distributors and retailers, while advisers design the network, set sourcing rules and help clients document each handover for regulators, lenders and buyers.
Africa Supply Chain Consulting Market Insights
- The Africa supply chain consulting market was valued at USD 196.5 million in 2025 and is projected to reach USD 396.1 million by 2035, registering a CAGR of 7.26% during 2026–2035.
- Southern Africa held a 38.0% share of 2025 value, because Johannesburg concentrates regional consulting offices and large retail, mining and freight buyers.
- Strategy and planning advisory led with a 31.0% share of 2025 value, because clients redesign networks before they change sourcing or software.
- South Africa awarded rail access to 11 private operators on 41 routes in August 2025, which opens new network design work for miners and shippers.
- Technology and governance advisory grows fastest at 8.55% a year during 2026–2035, as buyers deploy planning engines, control towers and trade portals.
Strategy work leads while technology advice grows fastest
Why does strategy and planning work earn the largest fee pool?
Based on service type, the market is categorized into strategy and planning advisory, procurement and sourcing transformation, logistics and distribution optimisation, and technology and governance advisory. Strategy and planning advisory led with a 31.0% share of 2025 value, because clients redesign networks before they change suppliers, routes or systems. Technology and governance advisory grows fastest at 8.55% a year, as buyers roll out planning software and digital trade portals.
How do agrifood exporters and miners shape demand?
Based on end-use industry, the market is categorized into consumer goods and agrifood, mining and energy, manufacturing and transport, and healthcare and public supply. Consumer goods and agrifood led with a 34.0% share of 2025 value, because brand owners, grocers and commodity exporters run large sourcing networks. Mining and energy grows fastest at 7.76% a year, as copper and cobalt corridors need new rail, port and offtake planning.
Which buyers commission the most advisory work?
Based on customer type, the market is categorized into corporate groups, independent growth enterprises, public-sector agencies and development-funded programmes. Corporate groups led with a 52.0% share of 2025 value, because listed retail, mining and telecom groups run multi-country programs. Independent growth enterprises grow fastest at 8.18% a year, as mid-sized exporters and manufacturers expand across borders for the first time.
Why is hybrid delivery gaining ground with clients?
Based on delivery model, the market is categorized into on-site delivery, hybrid delivery and remote delivery. On-site delivery led with a 48.0% share of 2025 value, because warehouse, port and mine site work needs advisers in the field. Hybrid delivery grows fastest at 7.91% a year, as firms pair field teams with offshore planning hubs that configure software remotely.
| Segment Group | Leading Sub-segment | Share, 2025 | Fastest-growing Sub-segment | CAGR, 2026–2035 |
|---|---|---|---|---|
| By Service Type | Strategy and planning advisory | 31.0% | Technology and governance advisory | 8.55% |
| By End-Use Industry | Consumer goods and agrifood | 34.0% | Mining and energy | 7.76% |
| By Customer Type | Corporate groups | 52.0% | Independent growth enterprises | 8.18% |
| By Delivery Model | On-site delivery | 48.0% | Hybrid delivery | 7.91% |
Request a Free Sample
Fill in your details and we'll send you a free sample report.
- Sample data tables & charts
- Research methodology
Trade integration, digital planning and traceability
What makes regional trade integration a fee driver?
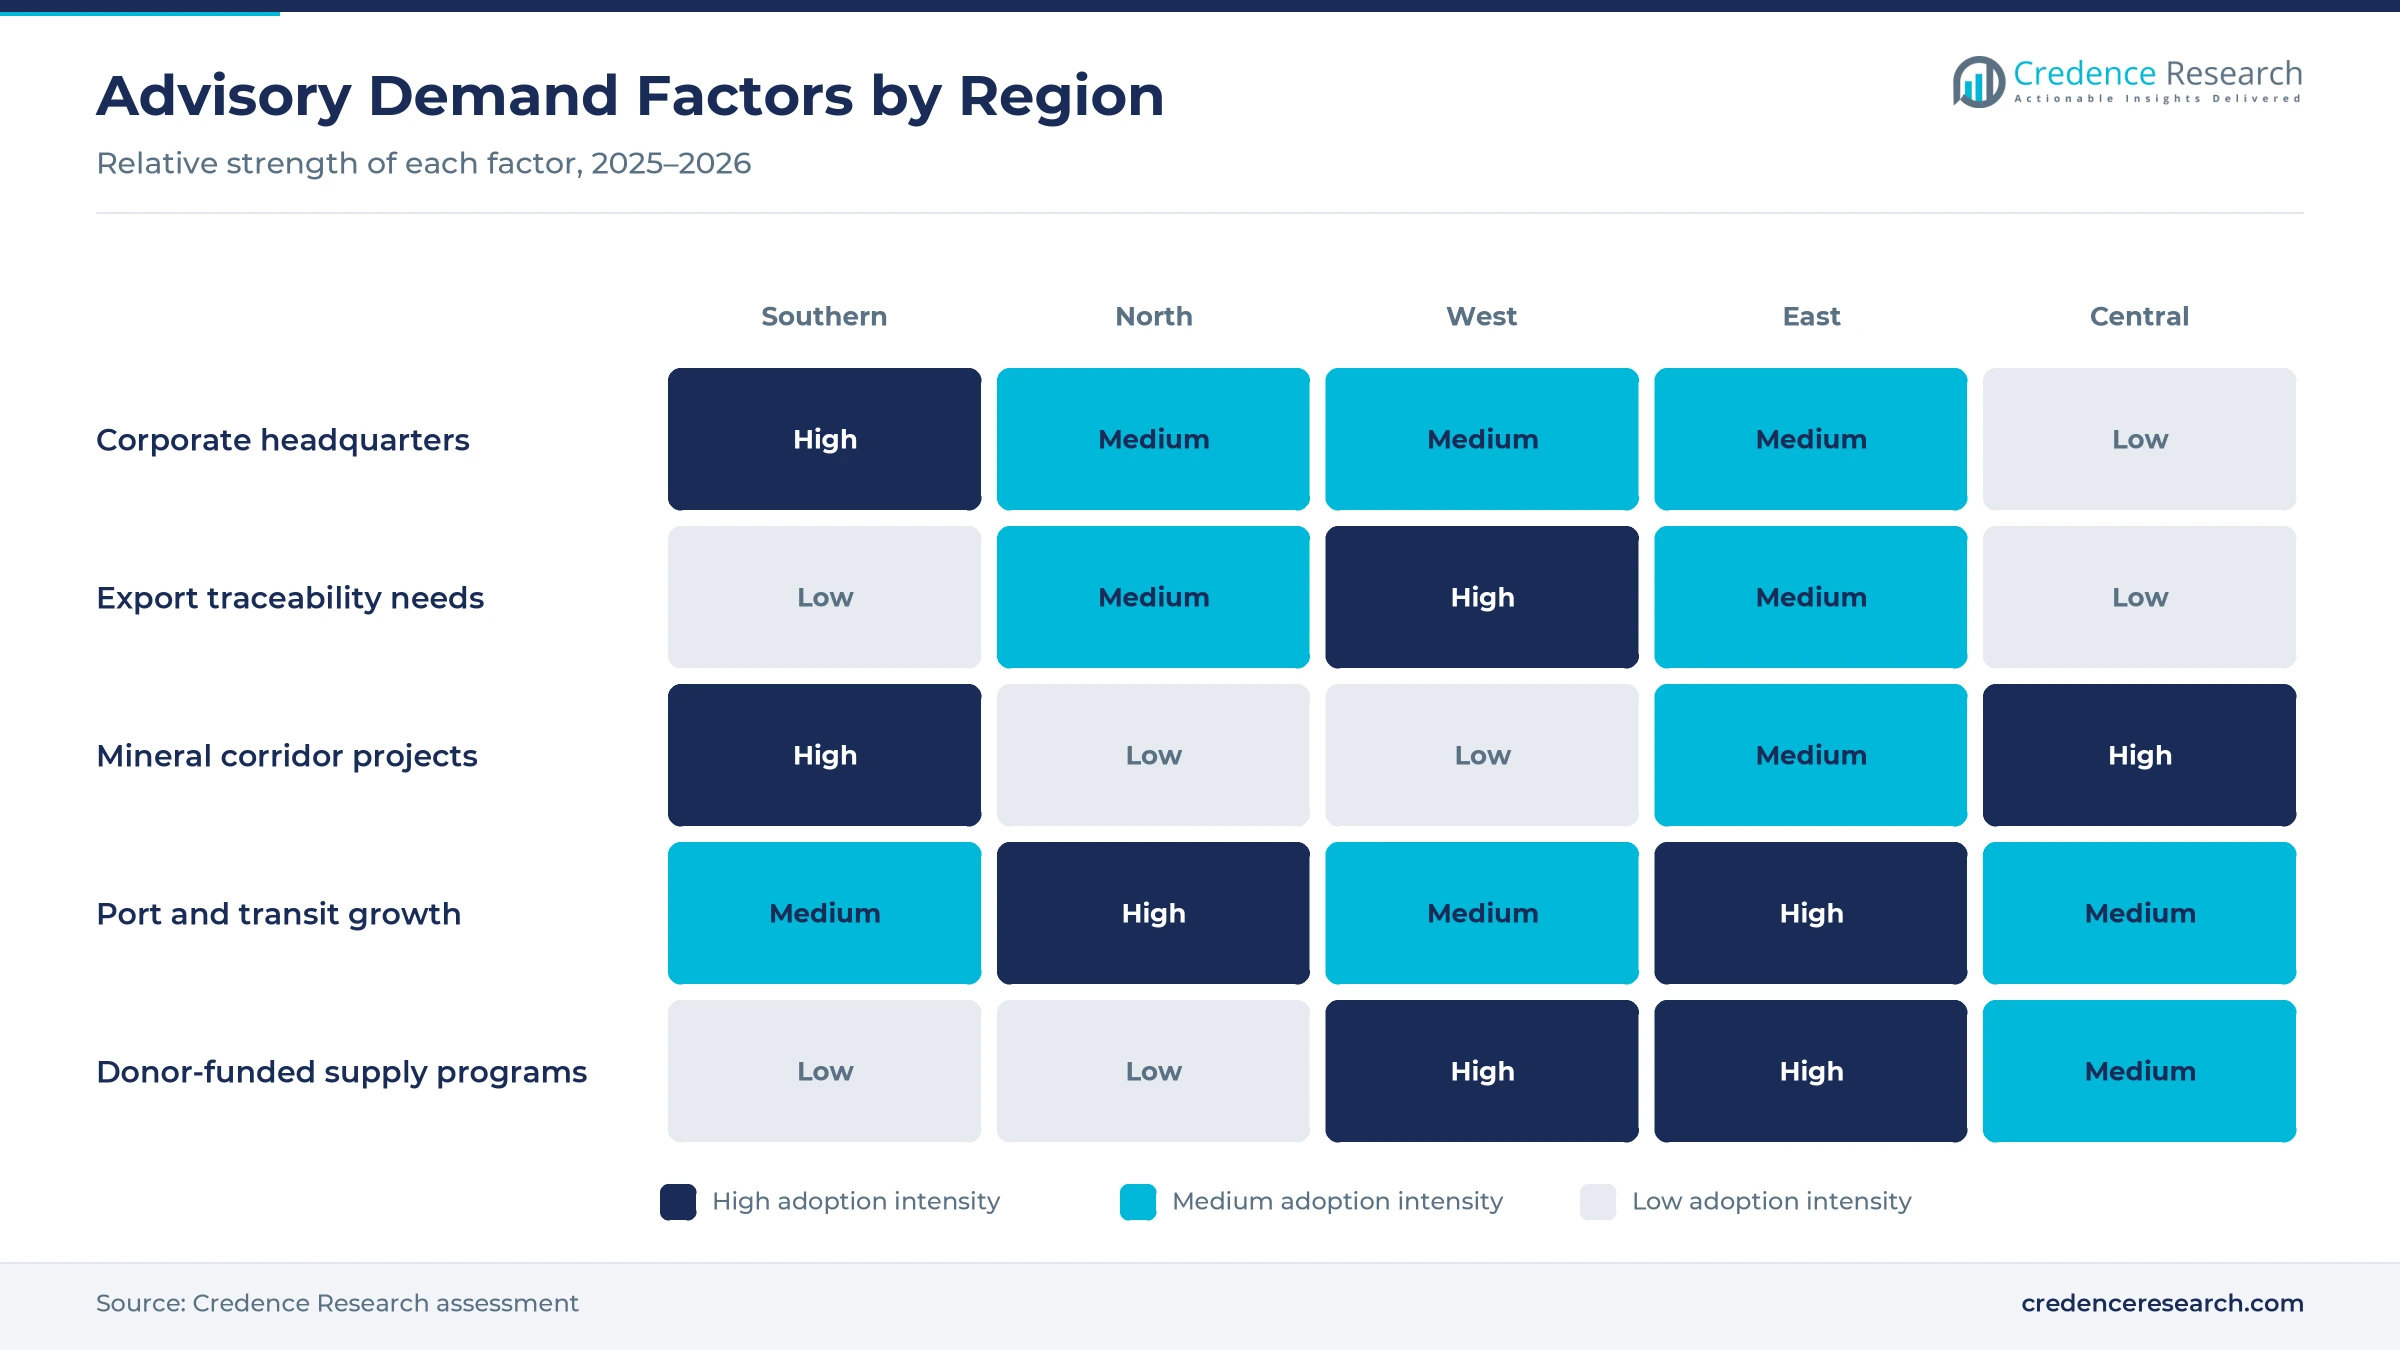
Cross-border network redesign lifts demand, because manufacturers and distributors must decide where to place plants, warehouses and hubs as tariff barriers fall between African states. Fifty countries had ratified the continental free trade agreement after Somalia joined on Oct. 20, 2025, in a planned 54-country market with combined GDP of more than $3.4 trillion, according to the International Trade Administration. The same update noted that 25 countries had finalized their tariff concession schedules, including Ghana, Nigeria and South Africa. The secretariat launched a guided trade initiative in October 2022 for eight countries, including Kenya, Rwanda, Egypt and Tunisia, which tested the rules on real shipments. As a result, strategy and planning advisory leads with 31.0% of 2025 value, because network studies come before sourcing changes.
Why are software-led planning programs spreading?
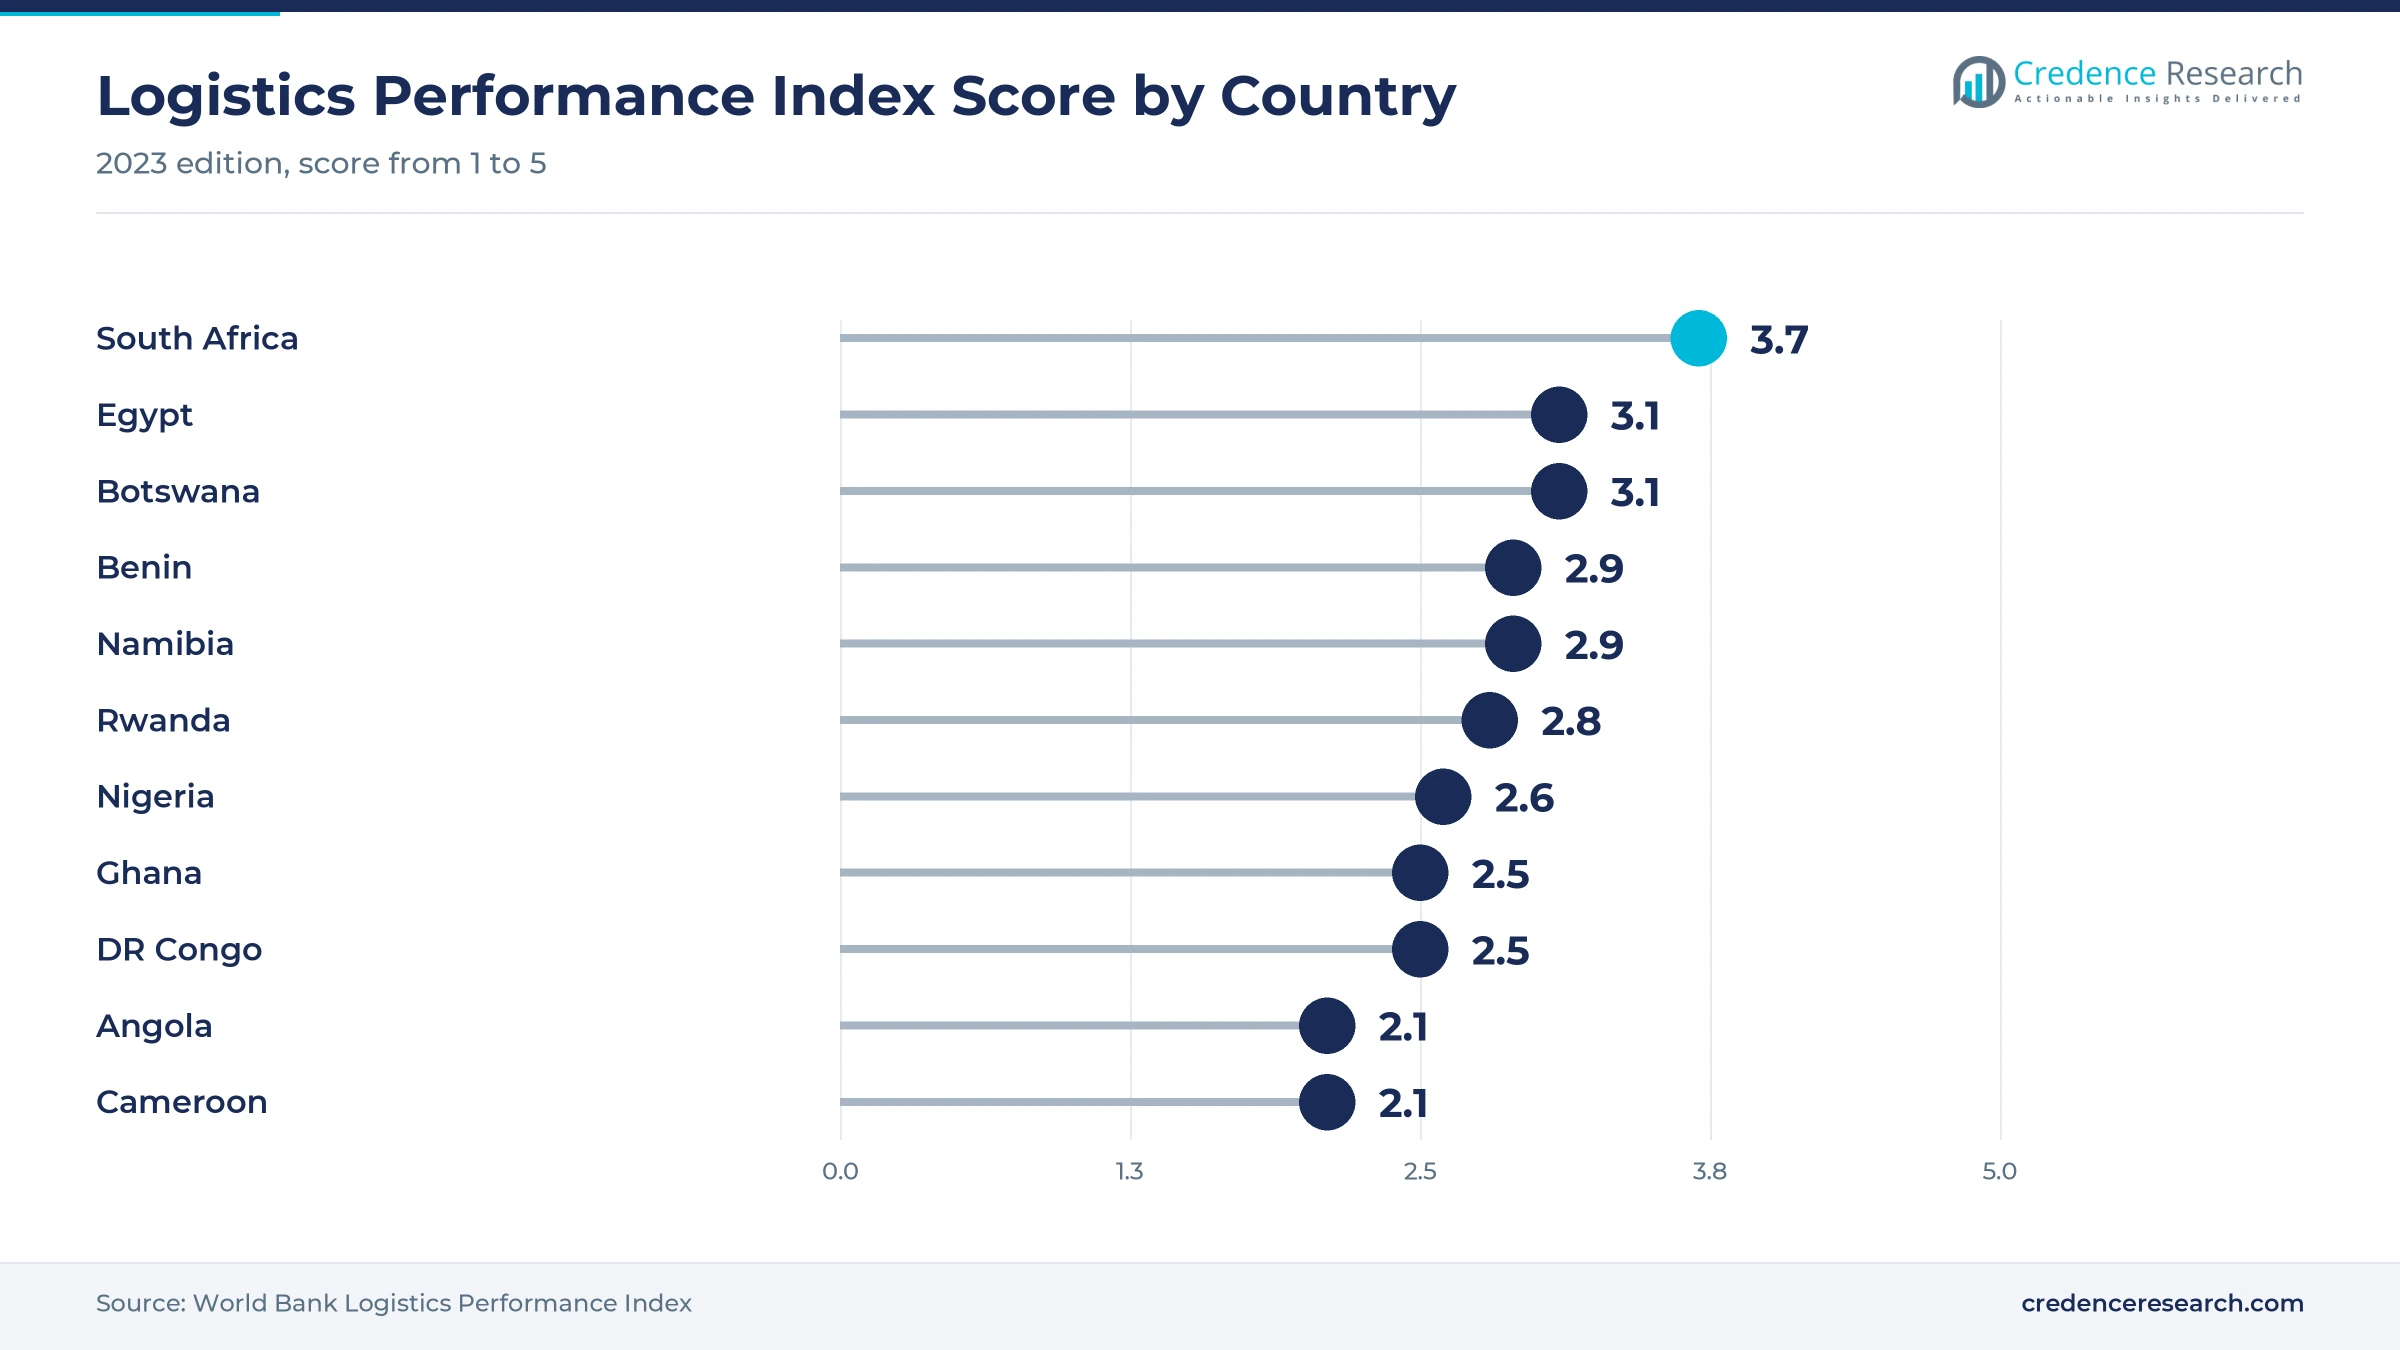
Digital planning projects create new briefs, because large buyers want planning engines, control towers and trade portals to replace spreadsheets and paper customs files. Logistics performance still varies widely, as South Africa scored 3.7 on the 2023 index while Nigeria scored 2.6 and Angola 2.1, according to the World Bank. Nigeria launched its national single window project in April 2024, with its first phase set to go live in the first quarter of 2026. Accenture also took over Imperial Logistics' supply chain and control tower contracts in 2022, while Deloitte staffs a Cairo hub that deploys Kinaxis planning tools. In turn, technology and governance advisory grows at 8.55% a year, the fastest service type.
What do EU forest rules mean for cocoa shippers?
Exporter traceability drives evidence work, because cocoa, coffee, timber and rubber shippers must now prove that each lot comes from land that was not cleared after 2020. The European Parliament approved a second delay on Dec. 17, 2025, and large operators must comply from Dec. 31, 2026, according to Mongabay. Ghana's cocoa board said in September 2024 that it had polygon-mapped all cocoa farms and piloted a farm-to-port tracking system, in a sector that employs about 17% of the working population. Côte d'Ivoire also adopted a national coffee and cocoa traceability system in September 2023 that labels each bag with its producer and origin. As a result, consumer goods and agrifood lead end uses with 34.0% of 2025 value.
How are private train operators changing route plans?
Freight rail and port reform adds design work, because miners and shippers in South Africa can now plan routes with private train operators and new terminal partners. The government named 11 private operators for 41 routes across six corridors on Aug. 22, 2025, according to the South African Government News Agency. Those operators are expected to carry an extra 20 million metric tons a year from 2026/27, toward a goal of 250 million metric tons by rail in 2029. Transnet also signed a 25-year deal with ICTSI in December 2025 to run Durban's Pier 2, lifting its capacity from 2 million to 2.8 million containers. In turn, Southern Africa remains the largest regional market, as miners and shippers redraw rail and port routes.
Mineral corridors and health aid shifts reshape briefs
How are copper and cobalt corridors changing advisory work?
The rise of critical mineral corridors is changing advisory work, because miners, rail operators and offtakers need joint plans for rail capacity, port slots and export documentation. The U.S. International Development Finance Corporation announced a loan of up to $553 million for the Lobito Atlantic Railway on Dec. 4, 2024. The rail line runs about 1,300 kilometers from Lobito port to Luau on the Angolan border, and the corridor links Angola with Zambia and the Democratic Republic of Congo. The same release listed grants for rare earth and copper projects near the corridor. As a result, mining and energy grows at 7.76% a year, the fastest end use during 2026–2035.
Why are health ministries taking over supply planning?
The shift of health supply duties from donors to governments is emerging as a major advisory theme, because ministries must take over forecasting, warehousing and port clearance. The U.S. Global Health Supply Chain Procurement and Supply Management program carried about $992.6 million in obligations in fiscal 2024 and supported 73 countries, according to the Center for Global Development. Nigeria received about $117.4 million and Tanzania about $96.2 million, while Nigeria set aside $200 million of domestic funds in response to the cuts. BusinessDay reported in April 2026 that U.S. staff were told to stop running the program in 17 African countries and Haiti by May 30. In turn, public-sector agencies commission new risk management and medicine distribution reviews.
Can Moroccan and Egyptian ports open new client segments?
North African export hubs can open a new client base, because carmakers, apparel makers and food exporters are building regional distribution around Moroccan and Egyptian ports. Tanger Med handled 11.1 million containers in 2025, up 8.4% from 2024, according to the Moroccan government portal. The same port complex moved 161 million metric tons of cargo, up 13.3%, which shows how quickly transshipment and export flows are growing. Egypt scored 3.1 on the 2023 logistics performance index, the second-highest score among large African economies. As a result, North Africa holds 24.0% of 2025 value and grows at 7.27% a year, as exporters seek logistics advisory on port and inland routes.
Can landlocked trade flows lift inland hub demand?
East African transit routes offer room for growth, because landlocked markets rely on Kenyan and Tanzanian ports and need better inventory and routing plans. Mombasa port handled 45.45 million metric tons in 2025, up 10.9%, according to the Kenya Ports Authority as cited by Hellenic Shipping News. Transit cargo rose 19.5% to 15.88 million metric tons, with Uganda up 25.2% and Rwanda up 22.8%, which shows rising inland demand. Kenya, Rwanda and Tanzania also took part in the guided trade initiative under the continental agreement. In turn, East Africa grows at 8.07% a year, as distributors add demand analytics and regional hubs.
Fee pressure, thin data and procurement scrutiny weigh
Why do smaller clients hesitate to hire advisers?
Fee pressure and currency swings limit spending, because many clients earn in local currency while large consultancies price senior time against dollar benchmarks. As a result, independent growth enterprises often delay network studies until a contract loss or a stockout forces action. Advisers respond with fixed-fee diagnostics, local delivery teams and performance-linked fees that tie part of the payment to savings. This pressure eases as clients see faster payback from inventory and freight savings.
What happens when stock records stay on paper?
Thin logistics data slows projects, because many distributors and public agencies still record stock, orders and shipments on paper or in disconnected spreadsheets. In turn, advisers must spend weeks cleaning data before they can model networks or set inventory targets. Firms respond with rapid data audits, simple planning tools and staff training, which build a usable baseline for later projects. This gap also creates steady demand for governance advice on data ownership and quality.
Why are state tenders taking longer to close?
Procurement scrutiny lengthens public contracts, because governments are tightening tender rules after corruption cases involving state contracts. South Africa's President assented to the Public Procurement Act in July 2024, which sets one framework for all organs of state and bars certain officials from bidding. As a result, advisers face longer tender cycles, stricter disclosure and closer audit of deliverables. Firms with strong compliance teams and local partners handle these rules best.
How do aid cuts disrupt program-based work?
Donor funding volatility creates gaps, because many health and agriculture supply programs depend on external grants that can stop with little notice. As a result, consultants working on these programs face paused contracts, shorter terms and sudden changes in scope. Governments respond by moving functions in-house and seeking technical assistance funded from their own budgets. This shift favors advisers that can transfer skills quickly to ministry staff.
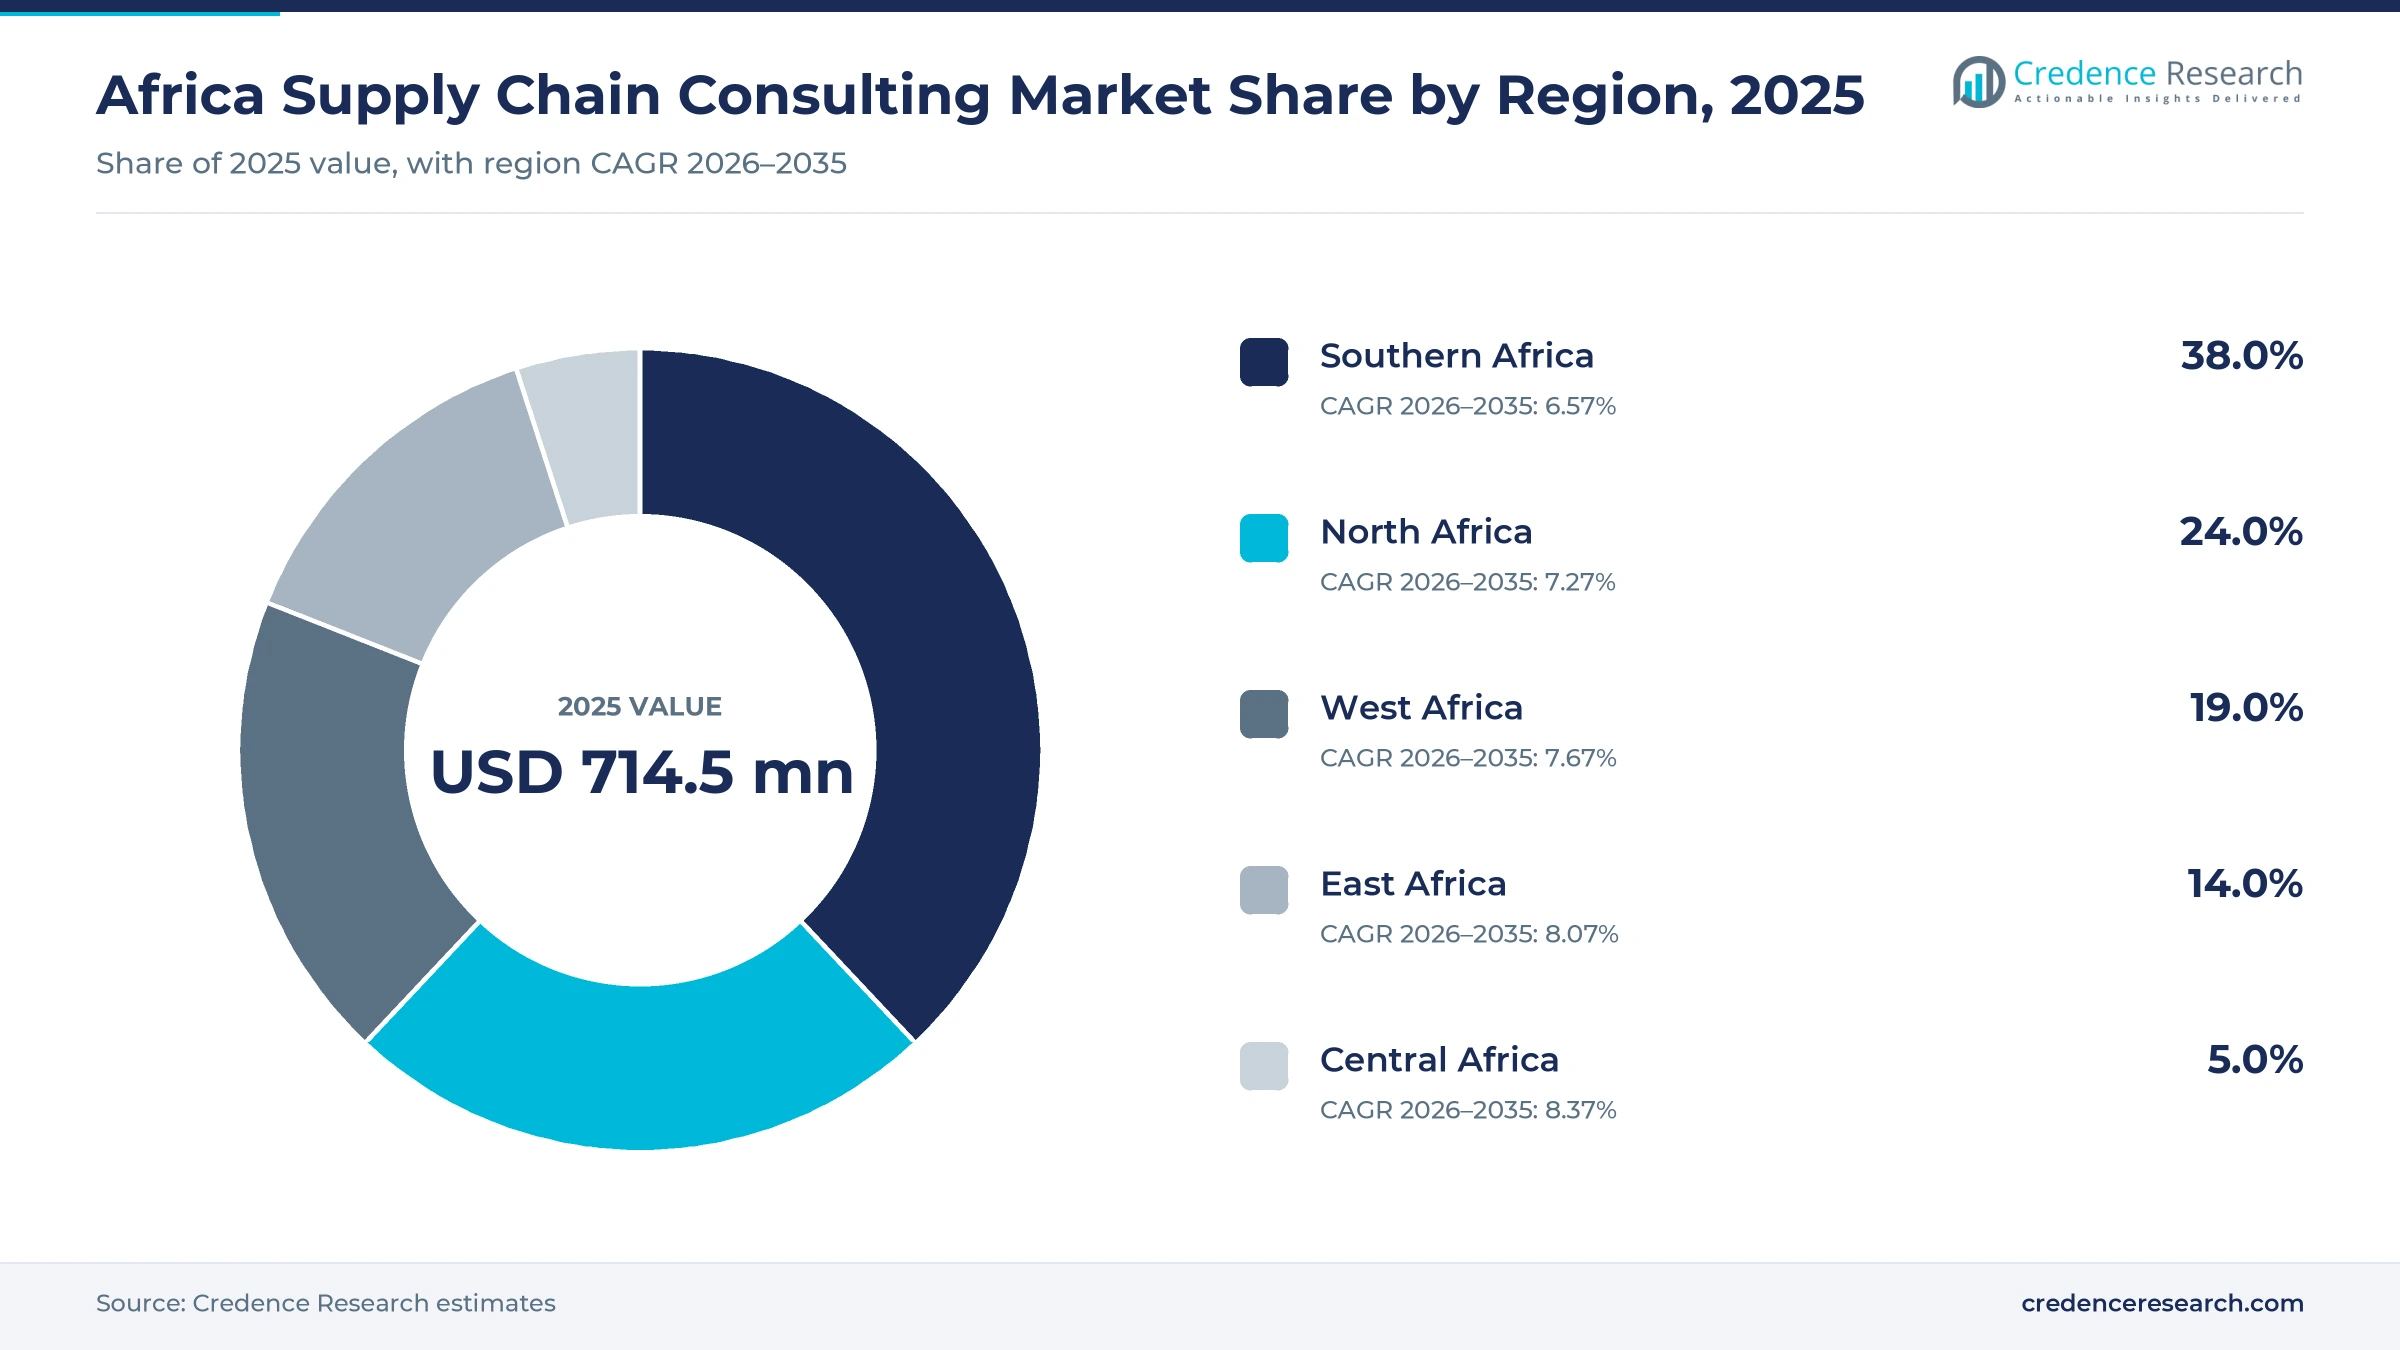
Southern Africa leads while Central Africa grows fastest
| Region | Value, 2025 (USD million) | Share, 2025 | CAGR, 2026–2035 |
|---|---|---|---|
| Southern Africa | 74.7 | 38.0% | 6.57% |
| North Africa | 47.2 | 24.0% | 7.27% |
| West Africa | 37.3 | 19.0% | 7.67% |
| East Africa | 27.5 | 14.0% | 8.07% |
| Central Africa | 9.8 | 5.0% | 8.37% |
Why does Johannesburg anchor regional advisory spending?
Southern Africa held a 38.0% share of 2025 value and grows at 6.57% a year, because Johannesburg hosts regional offices of most large consultancies and many listed buyers. South Africa ranked 19th on the 2023 logistics performance index, up from 33rd in 2018, with a score of 3.7. Private rail access and the Durban Pier 2 concession also add network design work for miners and shippers. As a result, the region combines large corporate programs with frequent public tenders.
How do tanger Med and Cairo planning hubs add work?
North Africa held a 24.0% share of 2025 value and grows at 7.27% a year, because Morocco and Egypt anchor export manufacturing and transshipment. Tanger Med handled 11.1 million containers in 2025, and Egypt scored 3.1 on the 2023 logistics performance index. Deloitte also staffs a Cairo hub that deploys supply planning software for clients across Europe and the Middle East. In turn, the region generates both local network projects and remote planning work.
What drives supply advice in West Africa?
West Africa held a 19.0% share of 2025 value and grows at 7.67% a year, because Nigeria, Ghana and Côte d'Ivoire run large consumer goods, cocoa and energy networks. Nigeria scored 2.6 on the 2023 logistics performance index, and its single window project targets a first phase in 2026. Ghana's cocoa board has mapped all cocoa farms for European buyers, which adds evidence and systems work. As a result, the region adds traceability, sourcing and port process projects.
Why are East African corridors gaining advisory work?
East Africa held a 14.0% share of 2025 value and grows at 8.07% a year, because transit trade through Mombasa and Dar es Salaam serves several landlocked markets. Mombasa transit cargo rose 19.5% in 2025 to 15.88 million metric tons, led by Uganda, Rwanda and Congo. McKinsey runs offices in Nairobi and Addis Ababa, while BCG has added senior staff to its East Africa practice. In turn, distributors commission hub, inventory and routing studies across the region.
Why do Congo copper routes lift regional growth?
Central Africa held a 5.0% share of 2025 value and grows fastest at 8.37% a year, because copper and cobalt from Congo need reliable routes to Atlantic and Indian Ocean ports. The Lobito corridor links Congo and Zambia with Angola's coast, and its railway won U.S. loan support in December 2024. Congo scored 2.5 and Cameroon 2.1 on the 2023 logistics performance index, which leaves wide room for improvement. As a result, mining corridor planning lifts demand from a small base.
Rail access, port concessions and EU rule milestones
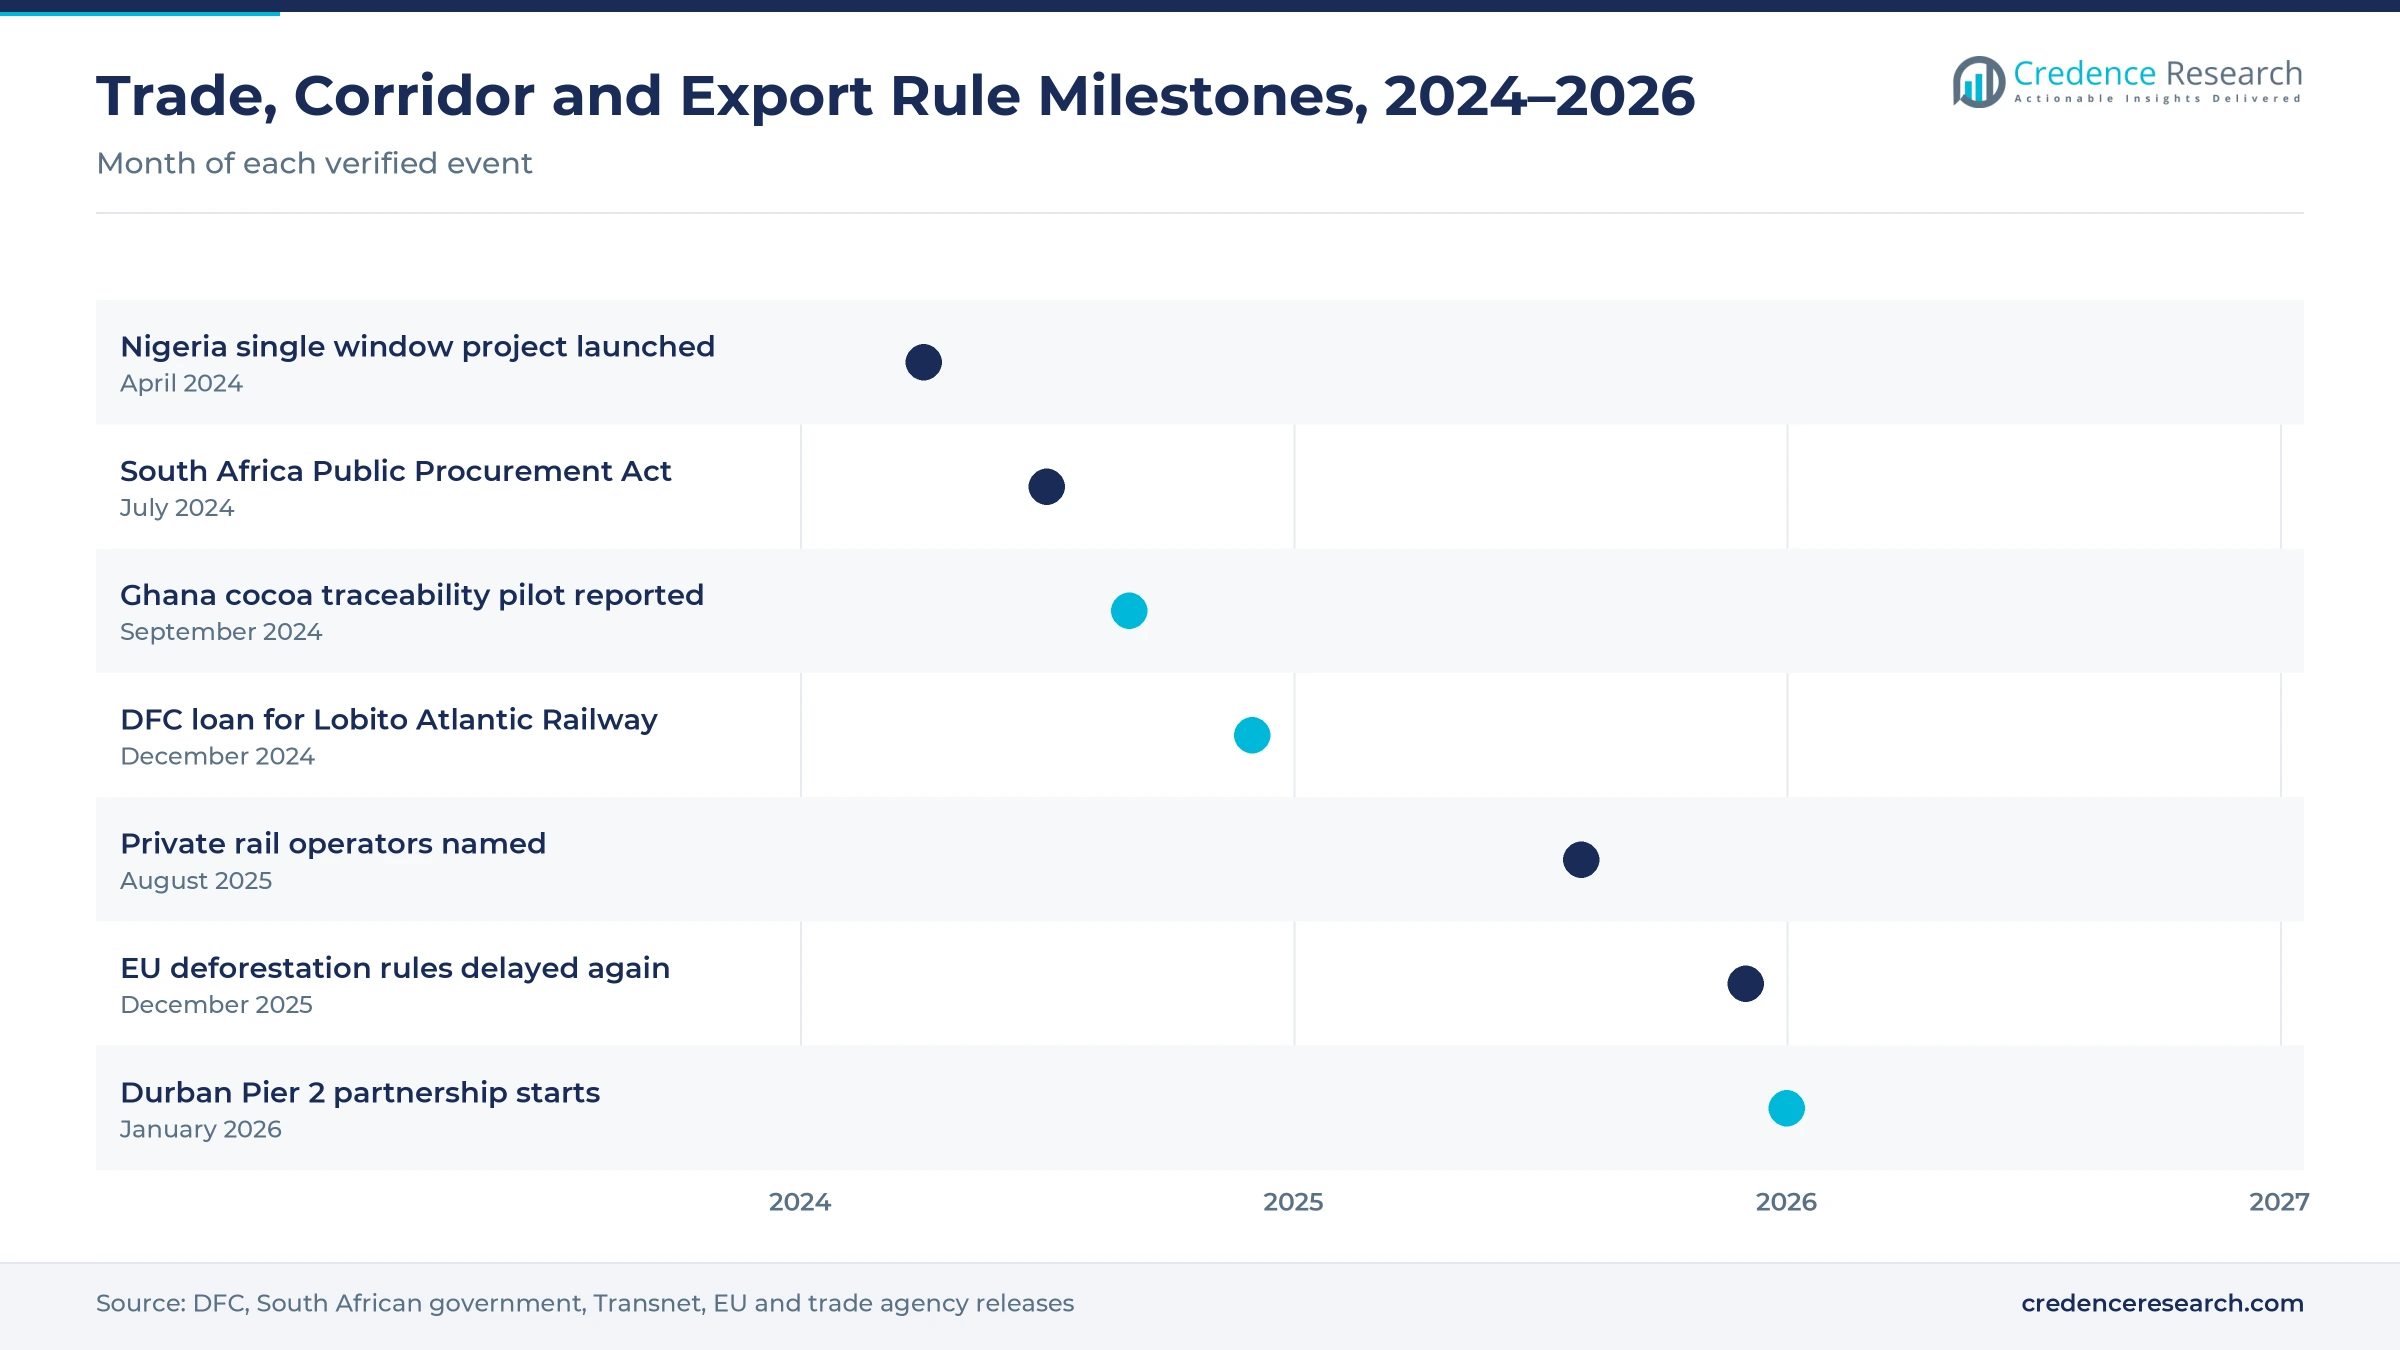
| Development | Status and market relevance |
|---|---|
| In December 2024, the U.S. International Development Finance Corporation announced a loan of up to $553 million for the Lobito Atlantic Railway. | Supports corridor planning for copper and cobalt exports |
| In August 2025, South Africa named 11 private train operators for 41 routes across six freight rail corridors. | Opens new rail network design work for miners and shippers |
| In December 2025, Transnet signed a 25-year deal with ICTSI to run Pier 2 at the Durban Container Terminal from January 2026. | Raises planned capacity from 2 million to 2.8 million containers |
| In December 2025, the European Union confirmed a second delay to its deforestation rules, moving large operators to December 2026. | Gives exporters more time to finish farm mapping and evidence systems |
| In April 2026, U.S. staff were told to stop running the global health supply program in 17 African countries by May 30. | Moves forecasting and distribution duties to health ministries |
Planning engines, control towers and farm mapping tools
- Advanced planning engines combine demand, supply and inventory data in one model, which lets clients test network and sourcing scenarios before they commit capital.
- Control towers collect shipment and stock status from carriers, warehouses and ports, which helps planners spot delays and reroute freight early.
- National single windows let traders file customs and agency permits through one portal, which cuts paperwork and gives clients cleaner trade data.
- Farm polygon mapping records the boundaries of each smallholder plot with satellite and GPS data, which lets exporters prove origin to European buyers.
Need a Custom Version of This Report?
Tailor the scope, geography, or segments to your exact requirements.
- Custom geography or segment scope
- Direct access to our analyst team
Global strategy houses and African specialists compete
Competition combines global strategy and professional services firms with African specialists that know local buyers and tender rules. McKinsey runs six African offices, including Johannesburg, Lagos, Nairobi, Addis Ababa, Casablanca and Luanda, while BCG has five African offices with about 600 staff. Accenture took over Imperial Logistics' supply chain and control tower contracts in 2022, and Deloitte staffs a Cairo hub that deploys Kinaxis planning tools. EY and PwC run supply chain and operations teams in Johannesburg, and Bain advises clients from its Johannesburg office. IQbusiness describes itself as South Africa's largest independent management and technology consultancy, while Phillips Consulting works from Lagos, Abuja and Johannesburg. Rivals compete on sector references, local delivery teams, software partnerships and the ability to link strategy with implementation.
Which advisers shape network and sourcing practice?
| Company | Type | Role in the market |
|---|---|---|
| McKinsey & Company Africa | Global strategy firm | Runs six African offices from Johannesburg to Luanda |
| Boston Consulting Group Africa | Global strategy firm | Five African offices with about 600 staff |
| Accenture Africa | Technology and operations firm | Took over Imperial Logistics control tower contracts |
| Deloitte Africa | Professional services firm | Cairo hub deploys Kinaxis planning tools |
| EY Africa | Professional services firm | Supply chain and operations team in Johannesburg |
| PwC Africa | Professional services firm | Operations consulting team in Johannesburg |
| Bain & Company Africa | Global strategy firm | Advises clients from its Johannesburg office |
| IQbusiness | Independent consultancy | South Africa's largest independent management consultancy |
| Phillips Consulting | Independent consultancy | Lagos-based firm with Abuja and Johannesburg offices |
Credence Research view on African network advice
Credence Research's view is that African network advice will grow steadily because trade integration, corridor investment and export evidence rules all force buyers to redraw how goods move. Strategy and planning advisory remains the largest fee pool, yet technology and governance advisory adds the fastest growth as planning engines and trade portals spread. Mining corridors and donor transitions add new public and private briefs. Advisers that pair global methods with local delivery teams should gain the most share by 2035.
How the African advisory fee estimate was built
The report uses 2025 as the base year on a calendar basis, and market values come from the Credence Research model. That model combines World Bank logistics performance data, trade agreement updates from government agencies, port and rail statistics, development finance releases, EU rule changes and company disclosures. Regional shares, segment splits and growth rates are Credence Research estimates. Sources used are government, agency, port authority, development finance and company publications, and no interviews or surveys were used.
Corridor projects keep advisory demand rising to 2035
The Africa supply chain consulting market is expected to reach USD 396.1 million by 2035, a 7.26% CAGR during 2026–2035, as trade integration, corridor investment and export traceability keep buyers hiring specialists. Growth should be strongest in technology and governance advisory, mining and energy, and Central Africa, because these areas gain most from new rail, ports and digital systems. Fee pressure and thin data could slow some projects, while the handover of donor health supply duties should add many public briefs.
Frequently Asked Questions
How big is the Africa supply chain consulting market?
Which service type leads advisory revenue?
Which region leads the market?
How many countries have ratified the continental free trade agreement?
When do the EU deforestation rules apply to African exporters?
How did South Africa open its freight rail network?
Who are the leading companies in the market?
What are the main challenges for advisers?
Table of Content
Chapter 1 Market Segmentation
- 1.1 Segmentation Framework
- 1.1.1 Product and Service Classification
- 1.1.2 Application and End-Use Classification
- 1.1.3 Technology and Solution Classification
- 1.1.4 Customer and Distribution Channel Classification
- 1.1.5 Geographic Segmentation
- 1.1.6 Market Segment Definitions and Boundaries
- 1.2 By Service Type
- 1.2.1 Strategy and planning advisory
- 1.2.2 Procurement and sourcing transformation
- 1.2.3 Logistics and distribution optimisation
- 1.2.4 Technology and governance advisory
- 1.3 By End-Use Industry
- 1.3.1 Consumer goods and agrifood
- 1.3.2 Mining and energy
- 1.3.3 Manufacturing and transport
- 1.3.4 Healthcare and public supply
- 1.4 By Customer Type
- 1.4.1 Corporate groups
- 1.4.2 Independent growth enterprises
- 1.4.3 Public-sector agencies
- 1.4.4 Development-funded programmes
- 1.5 By Delivery Model
- 1.5.1 On-site delivery
- 1.5.2 Hybrid delivery
- 1.5.3 Remote delivery
Chapter 2 Introduction
- 2.1 Report Objectives and Scope
- 2.2 Product Definition and Industry Terminology
- 2.3 Market Inclusions and Exclusions
- 2.4 Research Process
- 2.4.1 Primary Research and Expert Interviews
- 2.4.2 Secondary Research and Source Review
- 2.4.3 Top-Down and Bottom-Up Estimation
- 2.4.4 Data Triangulation and Verification
- 2.5 Market Size Measurement Basis
- 2.5.1 2025: USD 196.5 million → 2035: USD 396.1 million
- 2.6 Historical and Forecast Reference Periods
- 2.6.1 Historical Period: 2018-2025
- 2.6.2 Base Year: 2025
- 2.6.3 Forecast Period: 2025-2035
- 2.7 Research Assumptions and Limitations
Chapter 3 Executive Summary
- 3.1 Market Snapshot and Key Findings
- 3.2 Base-Year Market Size, 2025
- 3.3 Forecast Market Size, 2035
- 3.4 Revenue and Volume Growth Outlook
- 3.5 Key Demand and Supply Indicators
- 3.6 Leading Market Segments
- 3.7 Fastest-Growing Market Opportunities
- 3.8 Regional Performance Highlights
- 3.9 Technology and Industry Transformation
- 3.10 Competitive Landscape Summary
- 3.11 Analyst View and Strategic Implications
Chapter 4 Africa Supply Chain Consulting Market Trends and Developments
- 4.1 Historical Industry Development, 2018-2025
- 4.2 Recent Market Trends and Developments
- 4.3 Demand and Customer Behavior Trends
- 4.4 Technology and Product Innovation
- 4.5 Artificial Intelligence, Automation and Digitalization
- 4.6 Local Manufacturing and Supply Chain Realignment
- 4.7 Industry Partnerships, Mergers and Acquisitions
- 4.8 Sustainability and Circular Economy Developments
- 4.9 Government and Private Sector Investment Trends
- 4.10 Emerging Business Models and Commercialization
- 4.11 Industry Developments and Announcements
Chapter 5 Africa Supply Chain Consulting Market Supply and Demand Analysis
- 5.1 Demand Trend and Consumption Analysis, 2018-2025
- 5.2 Demand Forecast, 2025-2035
- 5.3 Supply Chain Structure and Procurement Trends
- 5.4 Supply-Demand Gap and Bottlenecks
- 5.5 Import Dependence and Sourcing Structure
- 5.6 Regional Supply and Demand Concentration
Chapter 6 Africa Supply Chain Consulting Market Pricing Analysis
- 6.1 Pricing Structure and Measurement
- 6.2 Historical Pricing Trends, 2018-2025
- 6.3 Pricing Outlook, 2025-2035
- 6.4 Pricing by Product and Market Segment
- 6.5 Geographic Pricing Differences
- 6.6 Key Input, Energy, Labor and Logistics Costs
- 6.7 Contract Pricing and Purchasing Models
- 6.8 Pricing Sensitivity and Competitive Positioning
- 6.9 Price, Margin and Profitability Implications
Chapter 7 Africa Supply Chain Consulting Market Dynamics
- 7.1 Market Growth Drivers
- 7.1.1 Demand-Side Drivers
- 7.1.2 Technology and Innovation Drivers
- 7.1.3 Infrastructure and Investment Drivers
- 7.1.4 Regulatory and Policy Drivers
- 7.2 Market Restraints
- 7.2.1 Cost and Affordability Constraints
- 7.2.2 Technology and Adoption Barriers
- 7.2.3 Supply Chain and Operational Constraints
- 7.3 Market Challenges
- 7.3.1 Competitive Pressure and Margin Erosion
- 7.3.2 Skills, Infrastructure and Implementation Gaps
- 7.4 Emerging Market Opportunities
- 7.5 Market Dynamics Impact and Time-Horizon Assessment
Chapter 8 Africa Supply Chain Consulting Value Chain Analysis
- 8.1 Industry Value Chain Overview
- 8.2 Upstream Suppliers and Critical Inputs
- 8.3 Technology and Component Providers
- 8.4 Manufacturing or Service Delivery
- 8.5 Distribution, Channel Partners and Integrators
- 8.6 Downstream Applications and End Users
- 8.7 Value Addition and Profit Pools
- 8.8 Vertical Integration and Outsourcing
- 8.9 Supplier Concentration and Risk
- 8.10 Supply Chain Localization and Resilience
Chapter 9 Africa Supply Chain Consulting Market Regulations and Policies
- 9.1 Relevant Laws, Standards and Compliance Frameworks
- 9.2 Product, Service, Safety and Quality Requirements
- 9.3 Government Policies, Incentives and Subsidies
- 9.4 Imports, Exports and Trade Barriers
- 9.5 Public Procurement and Local Content Requirements
- 9.6 Data Protection, AI and Cybersecurity Compliance
- 9.7 Upcoming Policy Changes and Market Implications
Chapter 10 Africa Supply Chain Consulting Market Hotspots and Opportunities
- 10.1 Market Opportunity Mapping and Growth Hotspots
- 10.2 High-Growth Applications and Customer Groups
- 10.3 Underserved Markets and White-Space Opportunities
- 10.4 Emerging Technology and Product Opportunities
- 10.5 New Capacity and Investment Hotspots
- 10.6 Market Entry and Expansion Opportunities
- 10.7 Distribution and Partnership Opportunities
- 10.8 Near-Term and Long-Term Commercial Potential
- 10.9 Opportunity Attractiveness and Execution Risks
Chapter 11 Africa Supply Chain Consulting Market Outlook, 2025-2035
- 11.1 Market Size and Analysis
- 11.1.1 Revenue (Market Measurement: 2025: USD 196.5 million → 2035: USD 396.1 million)
- 11.1.2 Historical Market Size, 2018-2025
- 11.1.3 Base-Year Market Size, 2025
- 11.2 Market Forecast, 2025-2035
- 11.2.1 Revenue Forecast to 2035
- 11.2.2 CAGR and Year-on-Year Growth
- 11.2.3 Incremental Revenue Opportunity
- 11.3 Forecast Assumptions and Scenario Analysis
- 11.3.1 Base-Case Forecast
- 11.3.2 Optimistic and Conservative Scenarios
- 11.3.3 Technology, Pricing and Policy Sensitivities
- 11.4 Market Attractiveness and Growth Outlook
Chapter 12 Africa Supply Chain Consulting Market Segmentation and Outlook
- 12.1 Segmentation Summary and Market Shares, 2025
- 12.2 Largest and Fastest-Growing Segments
- 12.3 By Service Type - Market Size and Forecast, 2025-2035
- 12.3.1 Segment Definition and Scope
- 12.3.2 Historical Market Size, 2018-2025
- 12.3.3 Revenue Forecast, 2025-2035
- 12.3.4 Base-Year Market Share, 2025
- 12.3.5 Segment CAGR and Growth Drivers
- 12.3.6 Subsegment Market Size and Forecast
- 12.3.6.1 Strategy and planning advisory
- 12.3.6.2 Procurement and sourcing transformation
- 12.3.6.3 Logistics and distribution optimisation
- 12.3.6.4 Technology and governance advisory
- 12.3.7 Subsegment Pricing and Adoption Trends
- 12.3.8 Leading Suppliers and Competition
- 12.3.9 Regional Demand and Opportunities
- 12.4 By End-Use Industry - Market Size and Forecast, 2025-2035
- 12.4.1 Segment Definition and Scope
- 12.4.2 Historical Market Size, 2018-2025
- 12.4.3 Revenue Forecast, 2025-2035
- 12.4.4 Base-Year Market Share, 2025
- 12.4.5 Segment CAGR and Growth Drivers
- 12.4.6 Subsegment Market Size and Forecast
- 12.4.6.1 Consumer goods and agrifood
- 12.4.6.2 Mining and energy
- 12.4.6.3 Manufacturing and transport
- 12.4.6.4 Healthcare and public supply
- 12.4.7 Subsegment Pricing and Adoption Trends
- 12.4.8 Leading Suppliers and Competition
- 12.4.9 Regional Demand and Opportunities
- 12.5 By Customer Type - Market Size and Forecast, 2025-2035
- 12.5.1 Segment Definition and Scope
- 12.5.2 Historical Market Size, 2018-2025
- 12.5.3 Revenue Forecast, 2025-2035
- 12.5.4 Base-Year Market Share, 2025
- 12.5.5 Segment CAGR and Growth Drivers
- 12.5.6 Subsegment Market Size and Forecast
- 12.5.6.1 Corporate groups
- 12.5.6.2 Independent growth enterprises
- 12.5.6.3 Public-sector agencies
- 12.5.6.4 Development-funded programmes
- 12.5.7 Subsegment Pricing and Adoption Trends
- 12.5.8 Leading Suppliers and Competition
- 12.5.9 Regional Demand and Opportunities
- 12.6 By Delivery Model - Market Size and Forecast, 2025-2035
- 12.6.1 Segment Definition and Scope
- 12.6.2 Historical Market Size, 2018-2025
- 12.6.3 Revenue Forecast, 2025-2035
- 12.6.4 Base-Year Market Share, 2025
- 12.6.5 Segment CAGR and Growth Drivers
- 12.6.6 Subsegment Market Size and Forecast
- 12.6.6.1 On-site delivery
- 12.6.6.2 Hybrid delivery
- 12.6.6.3 Remote delivery
- 12.6.7 Subsegment Pricing and Adoption Trends
- 12.6.8 Leading Suppliers and Competition
- 12.6.9 Regional Demand and Opportunities
- 12.7 Segment Growth Comparison
- 12.8 Segment Attractiveness and Priority Matrix
Chapter 13 Africa Supply Chain Consulting End-Use and Application Market Outlook
- 13.1 End-Use Industry and Customer Demand Structure
- 13.2 Leading Applications and Customer Groups
- 13.3 End-Use Market Size, Share and Forecast
- 13.4 Major End-Use Industry Deep Dives
- 13.4.1 Customer Requirements and Use Cases
- 13.4.2 Demand and Replacement Cycles
- 13.4.3 Technical and Regulatory Considerations
- 13.4.4 Purchasing and Procurement Models
- 13.4.5 Leading Vendors and Distribution Channels
- 13.4.6 Forecast and Commercial Opportunities
- 13.5 Emerging Applications and Cross-Segment Demand
- 13.6 End-Use Industry Investment Priorities
Chapter 14 Africa Supply Chain Consulting Geographic Market Outlook, 2025-2035
- 14.1 Regional Market Size and Country-Level Shares, 2025
- 14.2 Country Market Size Comparison, 2025
- 14.3 Country Market Forecasts, 2025-2035
- 14.4 Subregional Industrial and Demand Clusters
- 14.5 Intra-Regional Pricing and Cost Differences
- 14.6 Cross-Border Trade and Supply Networks
- 14.7 Regional Supply and Demand Balances
- 14.8 Country Opportunity Comparison and Prioritization
Note: Every listed country is covered on the structure shown under the first country.
Chapter 15 Africa Supply Chain Consulting Technology, Innovation and Sustainability Outlook
- 15.1 Technology Landscape and Maturity
- 15.2 Product, Process and Service Innovation
- 15.3 AI, Automation and Digital Tools in the Industry
- 15.4 Technology Adoption and Performance Benchmarking
- 15.5 Innovation Pipeline and R&D Investment
- 15.6 Energy Efficiency and Resource Management
- 15.7 Sustainability, Recycling and Circularity
- 15.8 Technology Roadmap, 2025-2035
- 15.9 Risks of Obsolescence and Technology Substitution
Chapter 16 Africa Supply Chain Consulting Market Key Strategic Imperatives
- 16.1 Growth and Market Entry Priorities
- 16.2 High-Return Products and Segments
- 16.3 Pricing, Profitability and Cost Optimization
- 16.4 Technology Investment and Product Differentiation
- 16.5 Supply Chain Localization and Resilience
- 16.6 Distribution and Customer Acquisition
- 16.7 Partnership, Acquisition and Capacity Strategy
- 16.8 Regional Expansion Priorities
- 16.9 Short-, Medium- and Long-Term Actions
Chapter 17 Competition Outlook
- 17.1 Industry Competition Characteristics
- 17.2 Market Structure and Concentration
- 17.3 Market Share and Competitive Positioning, 2025
- 17.4 Company-Wise Revenue and Product Benchmarking
- 17.5 Production and Service Capacity Benchmarking
- 17.6 Technology, Pricing and Differentiation
- 17.7 Regional Footprint and Distribution Strength
- 17.8 Mergers, Acquisitions and Strategic Alliances
- 17.9 New Entrants and Competitive Threats
- 17.10 Porter's Five Forces and Industry Attractiveness
- 17.11 Competitive Outlook, 2025-2035
Chapter 18 Company Profiles
- 18.1 Company Coverage and Selection Criteria
- 18.2 Accenture Africa
- 18.2.1 Business Description
- 18.2.2 Company Ownership and Geographic Presence
- 18.2.3 Product and Service Portfolio
- 18.2.4 Manufacturing and Operating Footprint
- 18.2.5 Financial Performance and Investment
- 18.2.6 Market Share and Competitive Position
- 18.2.7 Technology and Innovation Capabilities
- 18.2.8 Strategic Alliances or Partnerships
- 18.2.9 Recent Developments
- 18.2.10 Growth Strategy and Outlook
- 18.3 McKinsey & Company Africa
- 18.4 Deloitte Africa
- 18.5 EY Africa
- 18.6 PwC Africa
- 18.7 Boston Consulting Group Africa
- 18.8 IQbusiness
- 18.9 Bain & Company Africa
- 18.10 Alexander Proudfoot Africa
- 18.11 Phillips Consulting
- 18.12 Other Relevant Market Participants
Note: Every listed company is profiled on the structure shown under the first company. The company list is preliminary and may change based on research findings, market developments, data availability and client requirements.
Chapter 19 Disclaimer
- 19.1 Research and Forecast Disclaimer
- 19.2 Data Source and Estimation Limitations
Note: The depth of individual sections depends on data availability for this market. Volume, capacity, trade and other unit-based metrics are included where applicable.

