
App booking and dense cities shape regional ride demand
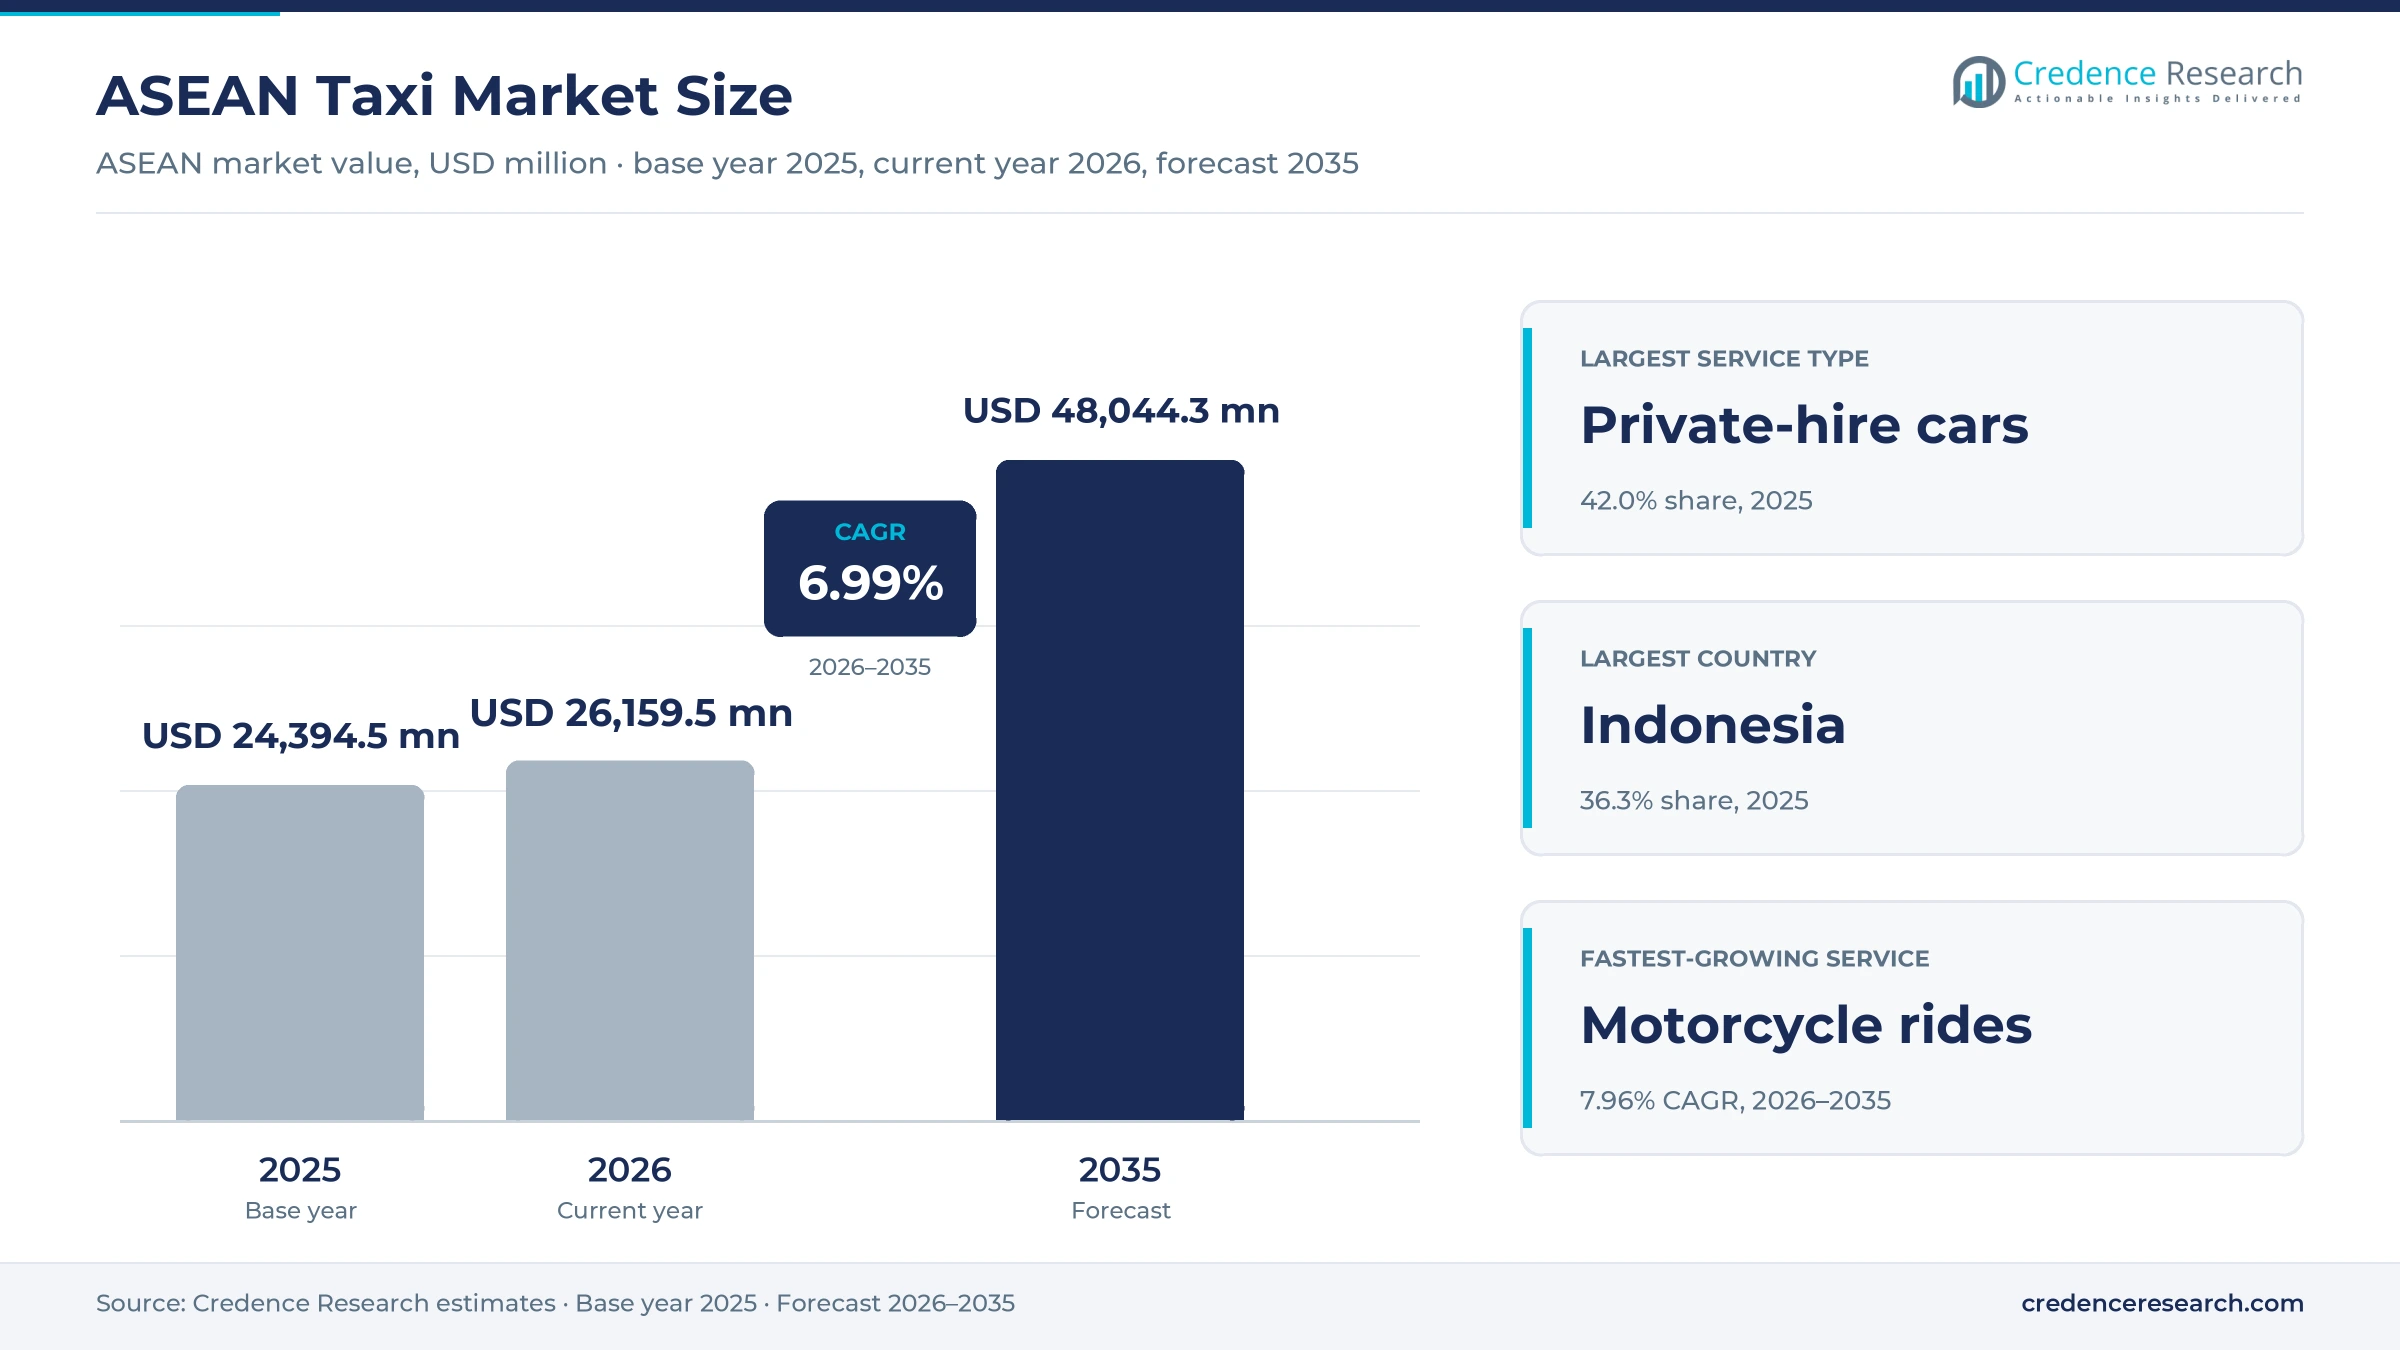
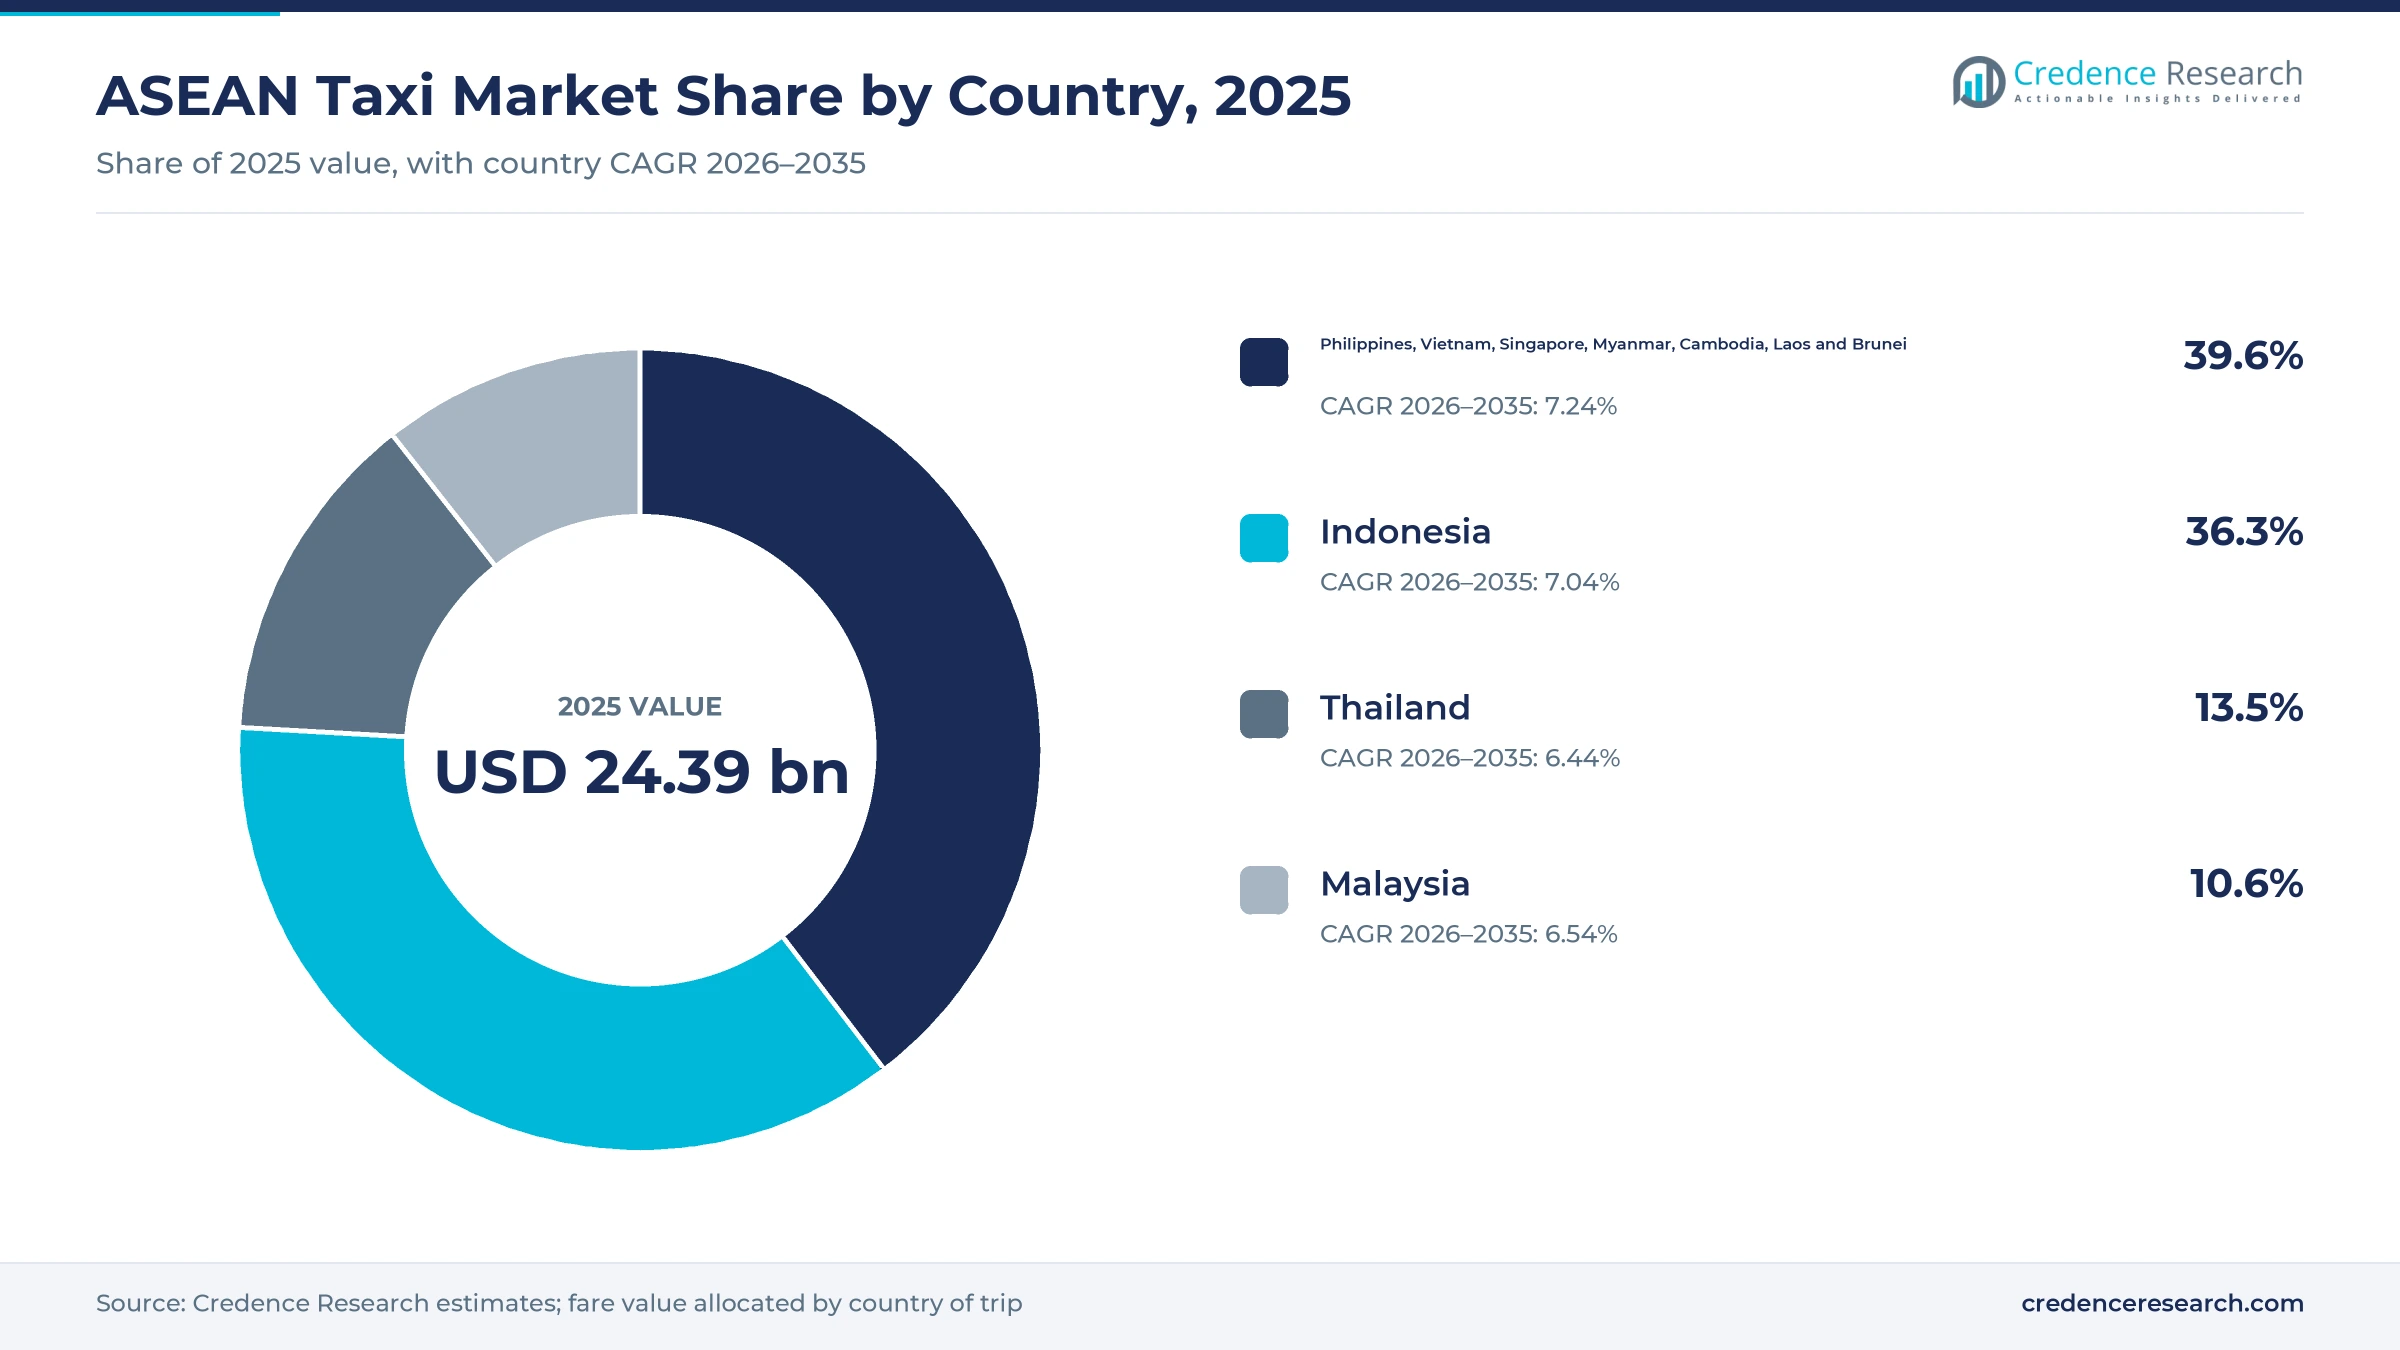
The ASEAN taxi market was valued at USD 24.39 billion in 2025 and is projected to increase from USD 26.16 billion in 2026 to USD 48.04 billion by 2035, registering a CAGR of 6.99% during 2026–2035. Demand comes from city residents who commute and run errands by car or motorcycle, from employers that pay for staff travel and from visitors who need airport and intercity transfers. Indonesia held the largest country share, 36.3% in 2025, because its large urban population relies on app-booked cars and motorcycle rides. The group of the Philippines, Vietnam, Singapore and the smaller members is the fastest-growing at 7.24% a year, as electric taxi fleets enter new cities. Rules also shifted in May 2026, when Indonesia announced a cut in the maximum commission that ride-hailing platforms may take from drivers.
Do app-booked cars and motorcycle rides count as taxis here?
The estimate measures passenger fare value from metered taxis, private-hire cars and motorcycle passenger services across the ten ASEAN member states. Values are stated at the fares that residents, employers and visitors pay, whether trips are booked online, hailed on the street or arranged by telephone or concierge desks.
The estimate excludes buses, rail, car rental without a driver, food and parcel delivery and freight services. The value chain runs from vehicle makers and leasing firms through fleet operators and app platforms to drivers who carry passengers and collect fares through cash, cards or digital wallets.
ASEAN Taxi Market Insights
- The ASEAN taxi market was valued at USD 24.39 billion in 2025 and is projected to reach USD 48.04 billion by 2035, registering a CAGR of 6.99% during 2026–2035.
- Indonesia held a 36.3% share of 2025 value, because more than 169 million urban residents rely on app-booked cars and motorcycle rides.
- Private-hire car services led with a 42.0% share of 2025 value, because app platforms let private vehicles serve most booked trips.
- Indonesia announced on May 1, 2026, that ride-hailing platforms may take no more than 8% of each fare, down from 20%.
- Ride-hail trips averaged 596,000 a day in Singapore in August 2026, compared with only 40,000 street-hail taxi trips, which shows how far booking has moved onto apps.
Private-hire cars lead while motorcycle rides grow fastest
Why do private-hire cars lead service demand?
Based on service type, the market is categorized into metered taxi services, private-hire car services and motorcycle passenger services. Private-Hire Car Services led with a 42.0% share of 2025 value, because app platforms let private vehicles serve most booked trips. Motorcycle Passenger Services grow fastest at 7.96% a year, as riders in congested cities choose quicker two-wheel trips.
How does online booking dominate trip requests?
Based on channel, the market is categorized into online booking, street and rank hailing, and telephone and concierge booking. Online Booking led with 62.0% of 2025 value, because apps show prices upfront and match riders with nearby drivers. Online Booking also grows fastest at 7.75% a year, as taxi fleets add app booking and street hailing declines in major cities.
Why do commuting trips account for the most fares?
Based on application, the market is categorized into commuting trips, airport and intercity transfers, and local non-commuting trips. Commuting Trips led with 45.0% of 2025 value, because daily work travel creates steady demand in dense cities. Airport and Intercity Transfers grow fastest at 7.47% a year, as air passenger numbers rise and longer trips carry higher fares.
How do self-paying residents dominate fare spending?
Based on customer type, the market is categorized into self-paying residents, employer-paid travelers and self-paying visitors. Self-Paying Residents led with 70.0% of 2025 value, because most trips are personal journeys paid from household budgets. Employer-Paid Travelers grow fastest at 7.58% a year, as companies move staff travel onto corporate ride accounts. Self-paying visitors also add demand in tourist cities and at major airports across the region.
| Segment Group | Leading Sub-segment | Share, 2025 | Fastest-growing Sub-segment | CAGR, 2026–2035 |
|---|---|---|---|---|
| By Service Type | Private-Hire Car Services | 42.0% | Motorcycle Passenger Services | 7.96% |
| By Channel | Online Booking | 62.0% | Online Booking | 7.75% |
| By Application | Commuting Trips | 45.0% | Airport and Intercity Transfers | 7.47% |
| By Customer Type | Self-Paying Residents | 70.0% | Employer-Paid Travelers | 7.58% |
Request a Free Sample
Fill in your details and we'll send you a free sample report.
- Sample data tables & charts
- Research methodology
City density, app booking and business travel lift trips
How does urban trip density sustain ride demand?
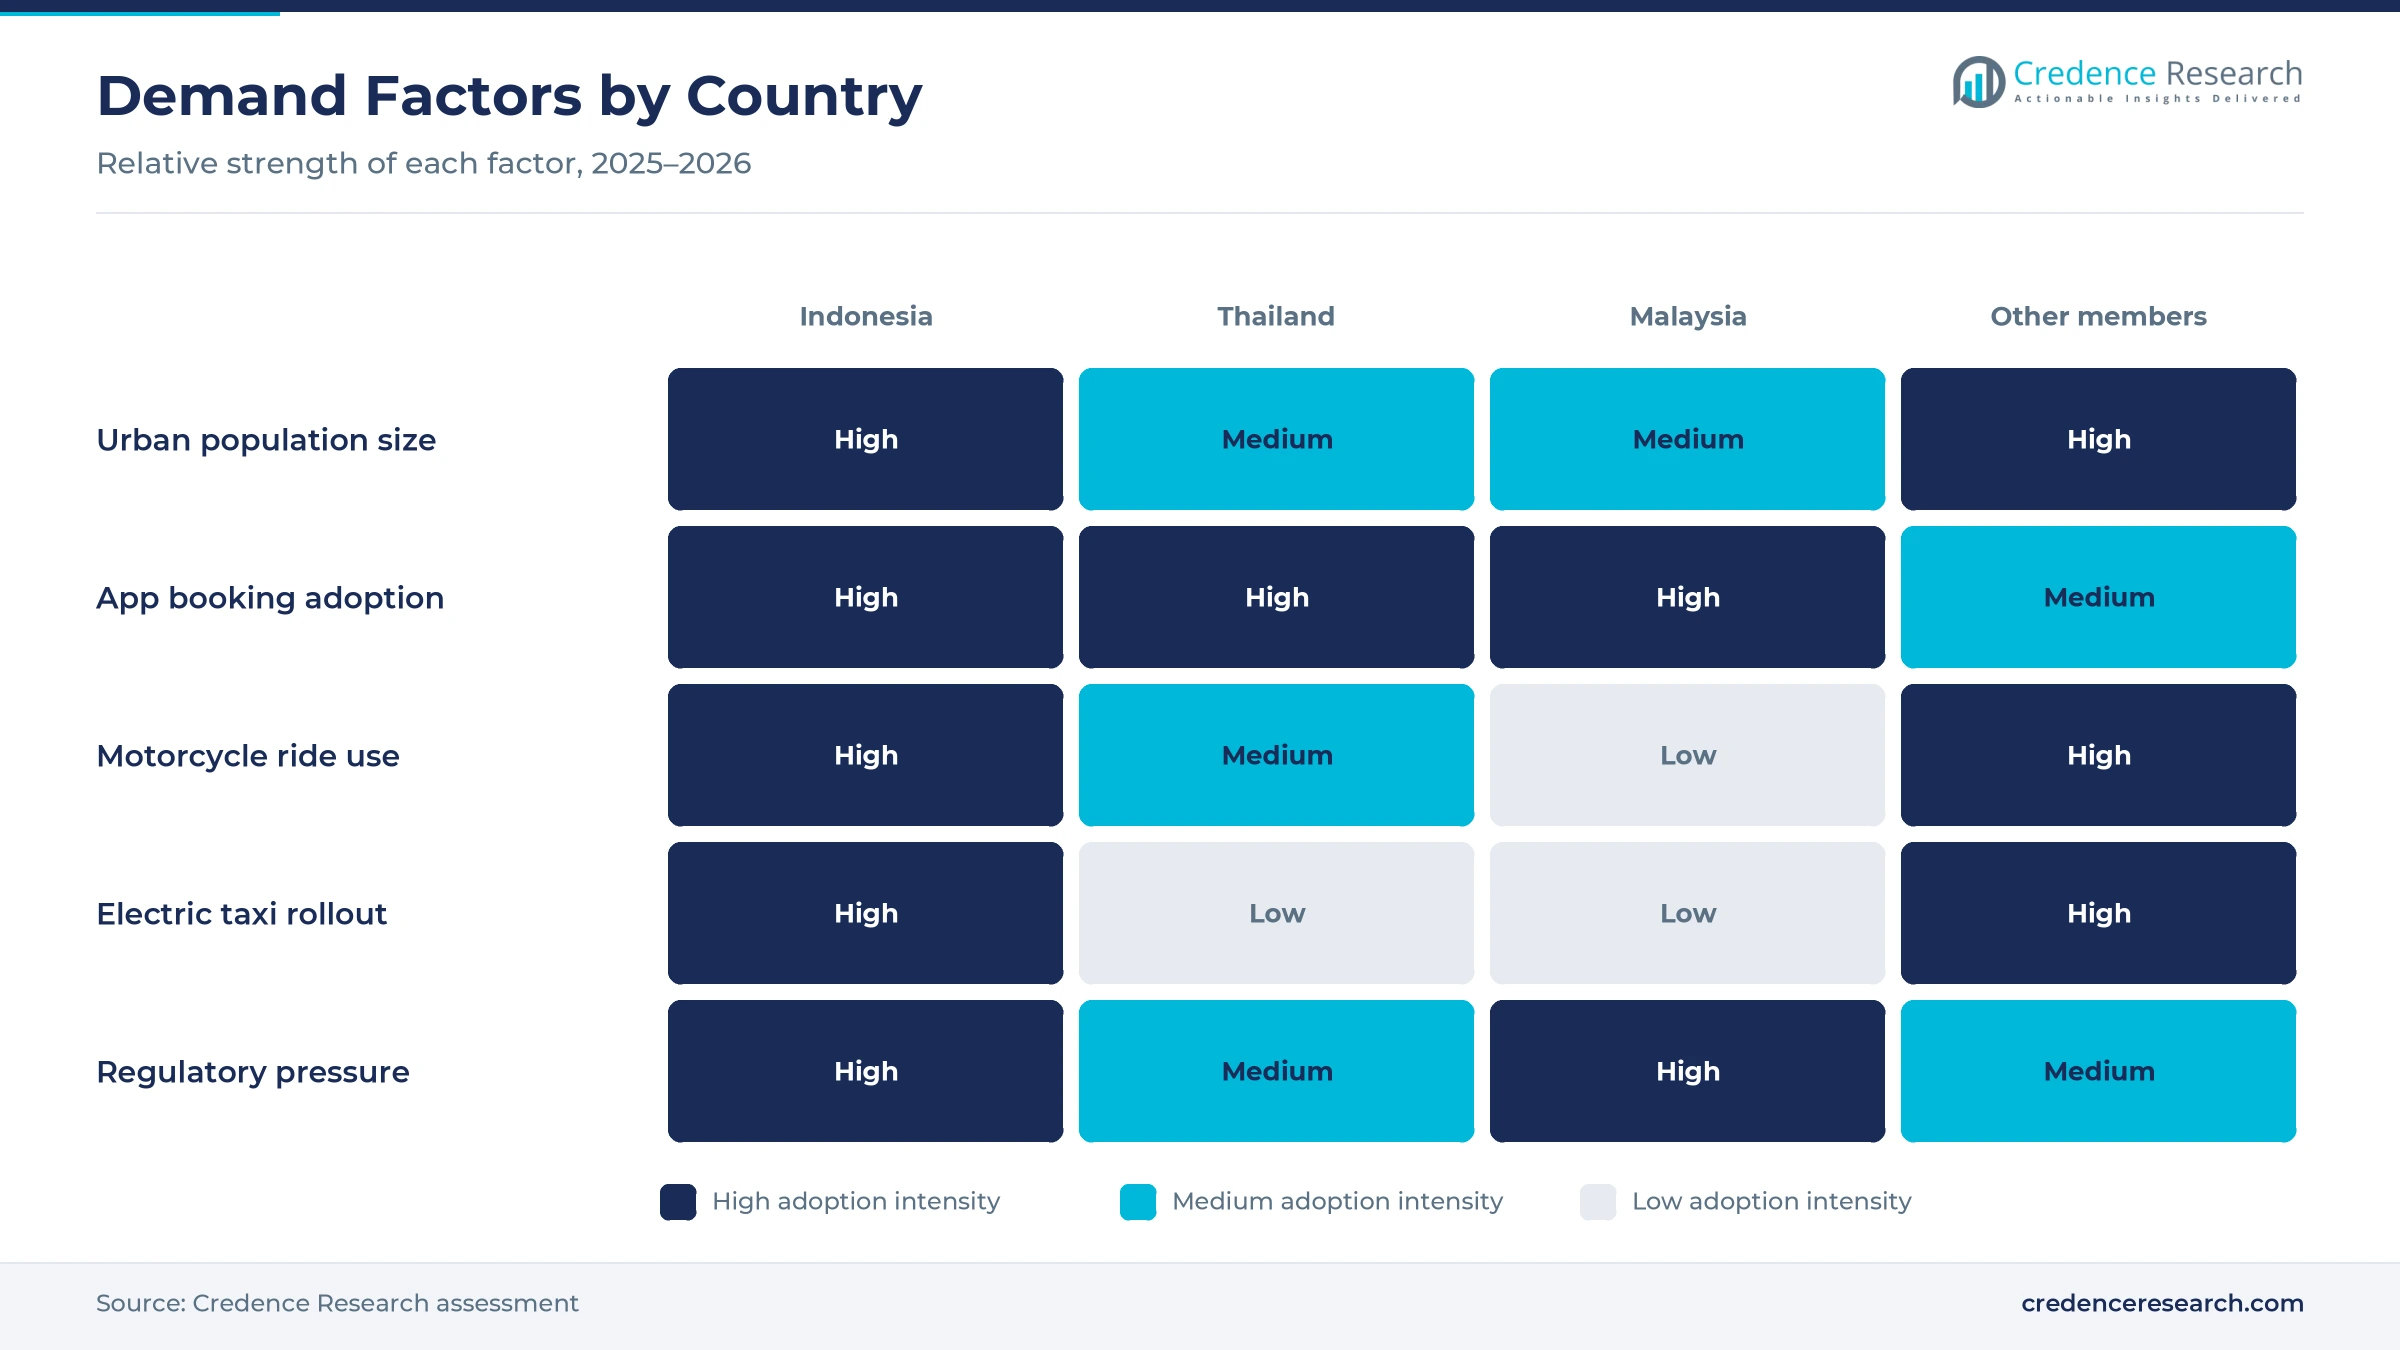
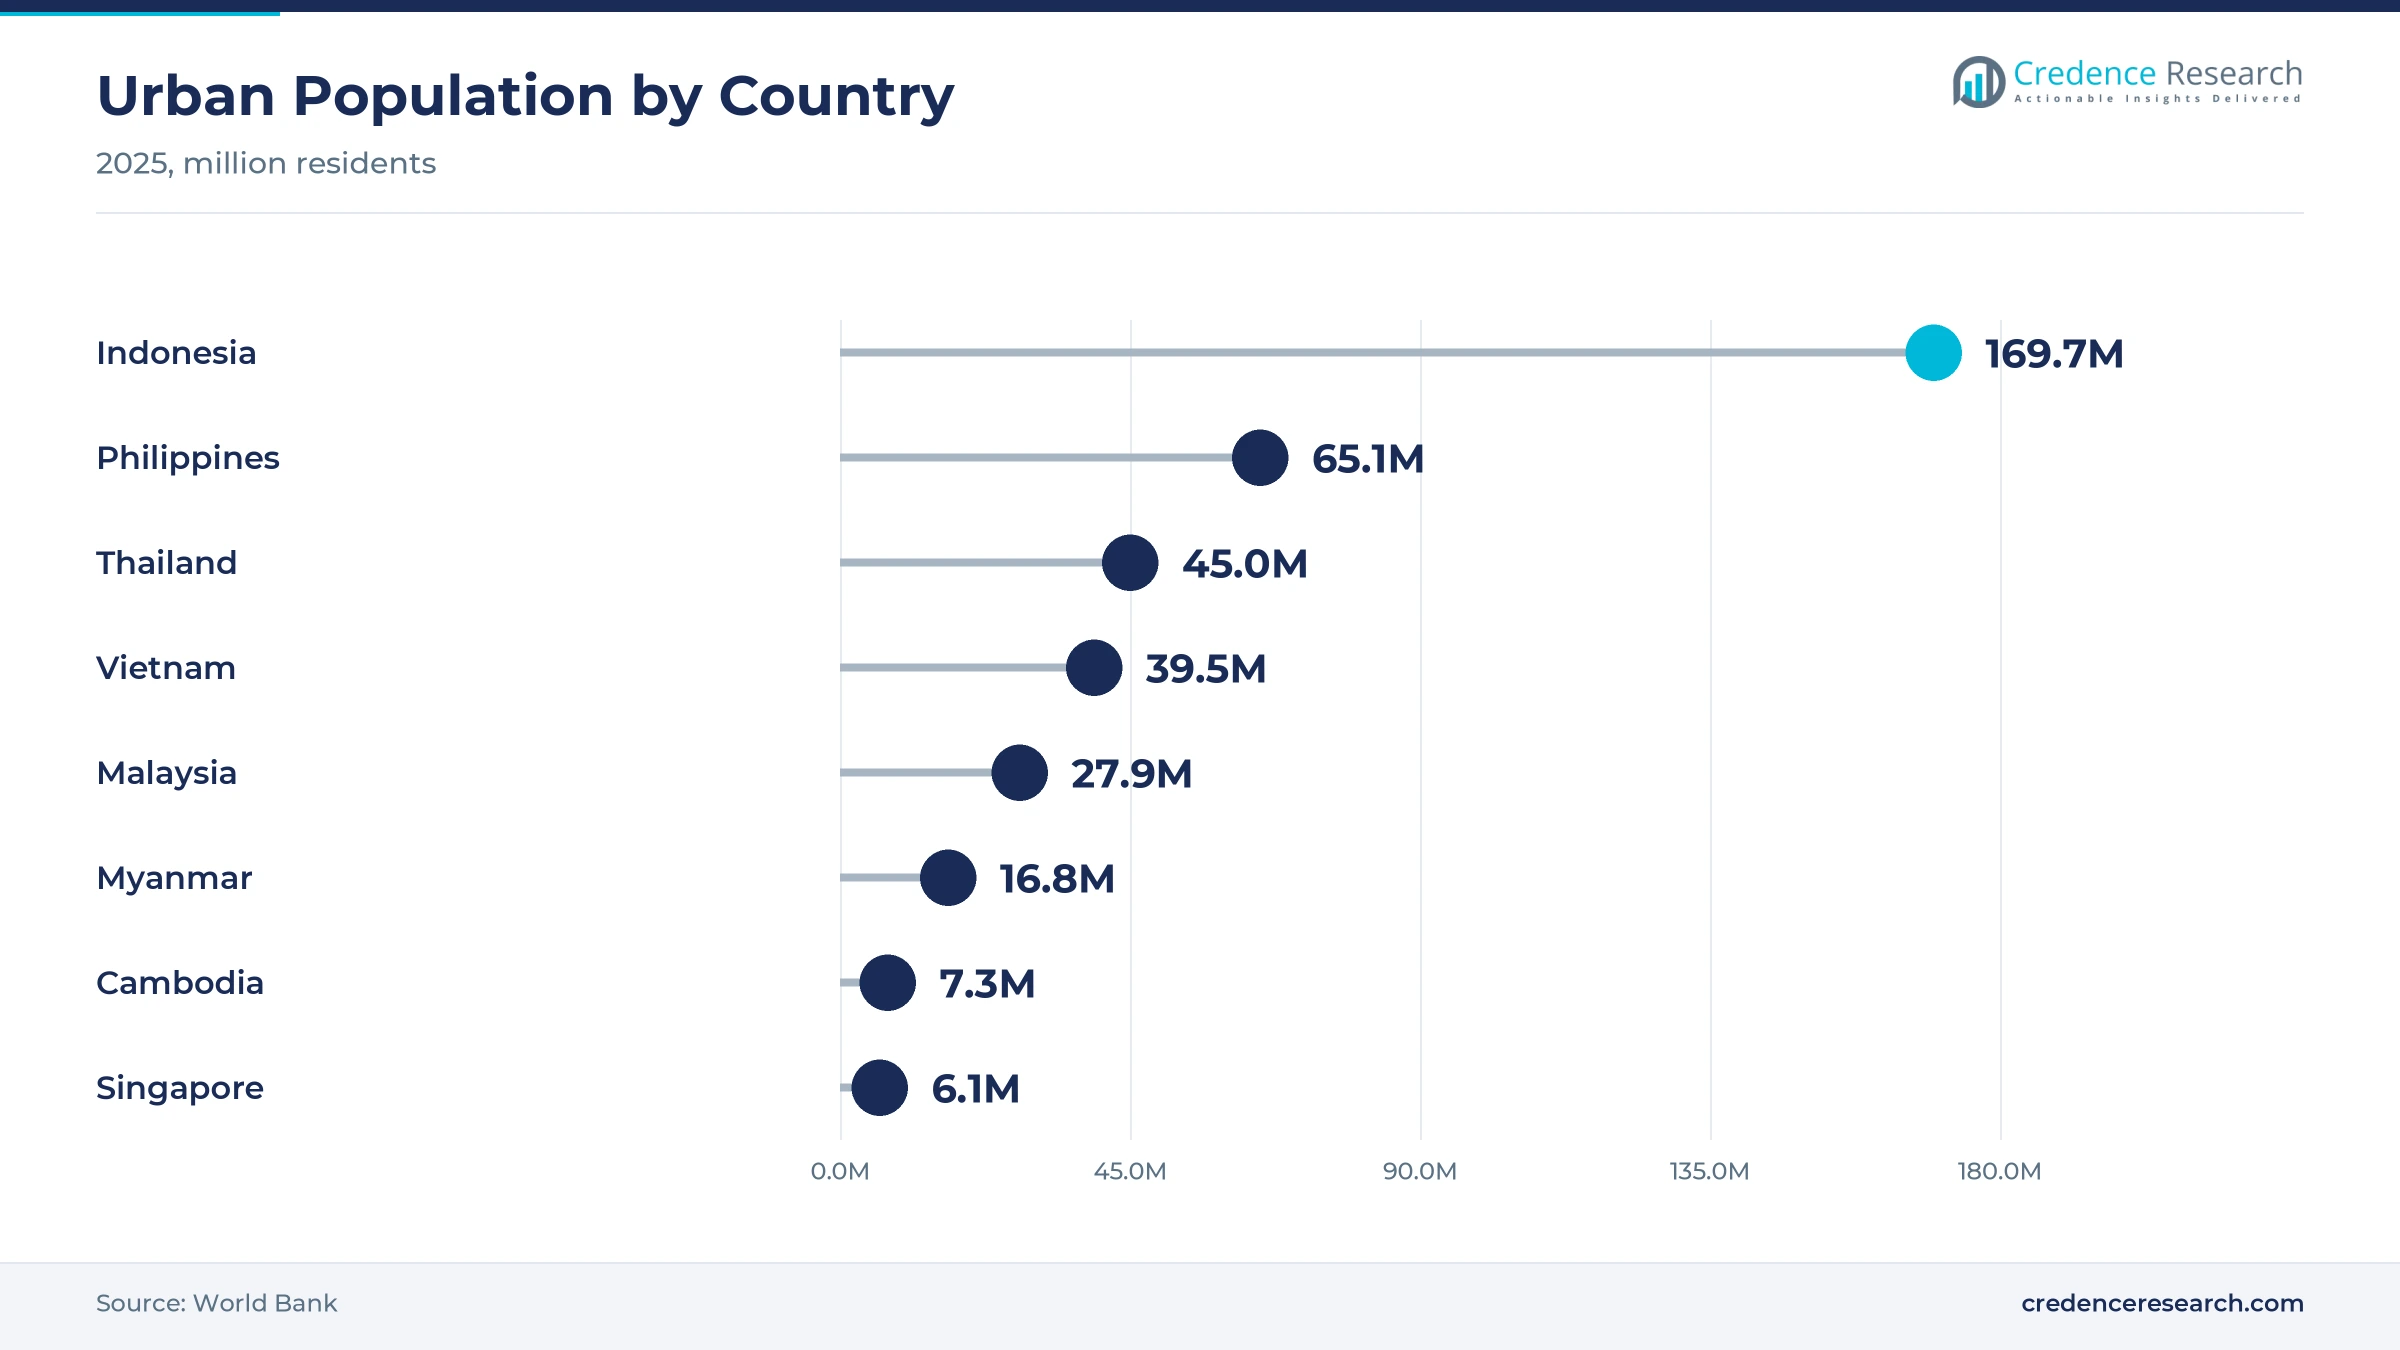
Urban trip density sustains ride demand, because crowded cities with limited parking push residents toward booked cars and motorcycle rides. Indonesia had about 169.7 million urban residents in 2025, the Philippines had 65.1 million and Thailand had 45.0 million, according to World Bank data. Malaysia was 76.9% urban in 2024, while Singapore is fully urban, which keeps short trips frequent. Grab reported that its mobility transactions rose 30% year over year in the third quarter of 2025, according to its filing. As a result, Indonesia leads country demand, as dense Jakarta, Surabaya and Bekasi routes generate steady trip volumes every day.
Why does digital booking migration lift trip volumes?
Digital booking migration lifts trip volumes, because apps show prices upfront, match nearby drivers and accept digital payment. In Singapore, ride-hail trips averaged 596,000 a day in August 2026, while street-hail taxi trips fell to 40,000, according to Land Transport Authority data. Street-hail trips had averaged 52,000 a day in January 2026, which shows how quickly riders are moving to apps. Grab also cut average mobility fares by 7% while average driver earnings rose 4% in the third quarter of 2025. In turn, online booking holds 62.0% of 2025 value, as lower fares, better matching and wider mobility-as-a-service bundles draw new riders onto apps.
How does enterprise mobility demand add higher-value trips?
Enterprise mobility demand adds higher-value trips, because companies pay for staff commutes, client visits and airport transfers. Grab for Business lets firms set travel policies and budgets, and it links trip receipts to expense tools such as SAP Concur and Expensify. Singapore Changi Airport handled 69.98 million passengers in 2025, up 3.4% from 2024, which lifts demand for transfers between the airport, offices and hotels across the city. ComfortDelGro's Zig network runs more than 7,600 taxis, the largest fleet in Singapore, and serves both street and booked trips. As a result, employer-paid travelers grow at 7.58% a year, the fastest customer rate.
Why does fleet electrification widen the supply of rides?
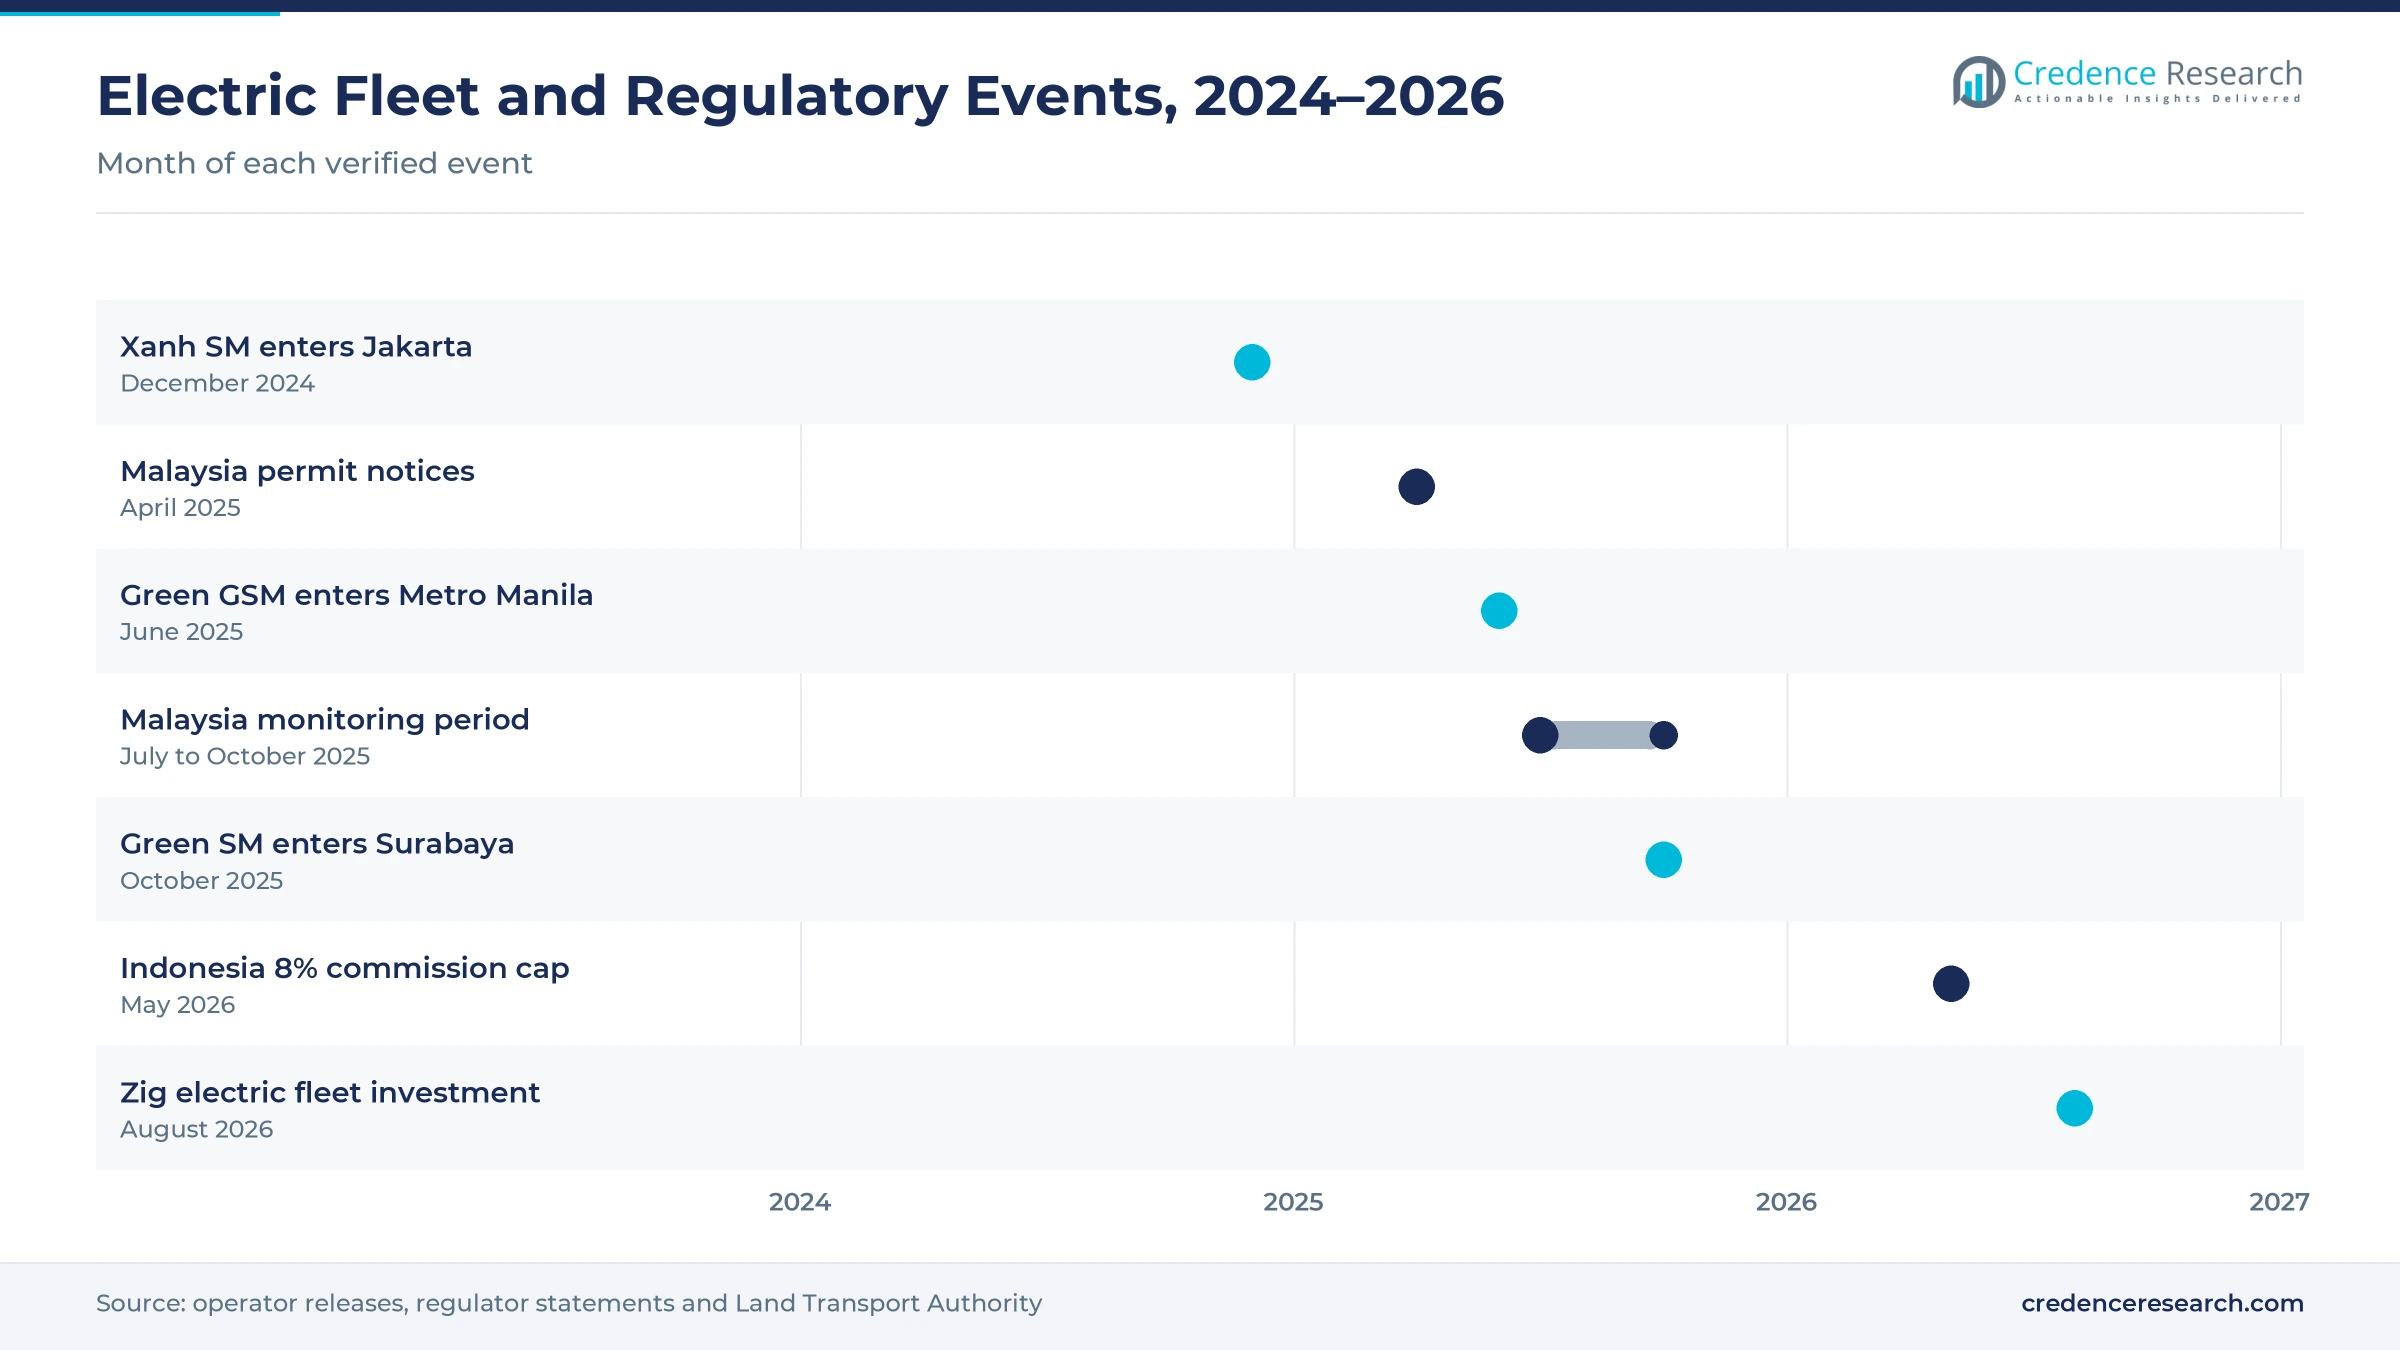
Fleet electrification widens the supply of rides, because lower energy and maintenance costs let operators add cars and keep fares competitive. Bluebird planned to add 1,000 electric vehicles in 2025 and had expanded its charging network to 27 locations. Xanh SM launched an all-electric taxi service in Jakarta in December 2024, its third Southeast Asian market after Vietnam and Laos, according to Vingroup. Zig also invested more than S$10 million in electric and hybrid private-hire cars in August 2026. In turn, private-hire car services hold 42.0% of 2025 value, as electric mobility lowers the cost per trip for drivers and fleet owners.
Commission caps and electric fleets reshape competition
How is the rise of motorcycle taxis changing urban travel?
The rise of motorcycle taxis is changing urban travel, because two-wheel rides cut journey times on congested roads and cost less than cars. A Philippine working group counted 68,036 registered motorcycle taxis, and 42% of them were affiliated with Angkas. Metro Manila has a 45,000-rider cap, and regulators approved 8,000 more slots in April 2024 for platforms including Maxim and GrabBike in Central and Southern Luzon. The House passed the Motorcycle-for-Hire Act on July 30, 2024, although the Senate version stayed pending before committee in 2025. As a result, motorcycle passenger services grow at 7.96% a year, the fastest service rate.
Why is the shift toward lower commissions reshaping platforms?
The shift toward lower commissions is reshaping platforms, because governments and challengers are pressing for larger driver shares of each fare. Indonesia announced on May 1, 2026, that platforms may take no more than 8% of each fare, down from 20%, according to The Star. inDrive charges a 10% commission in Thailand and lets riders and drivers agree on fares before each trip. Line Man Wongnai also offers a 10% commission on Line Man Ride, compared with 15% to 25% at rivals. In turn, drivers in Indonesia keep a minimum of 92% of each fare, which helps platforms hold driver supply on the road.
Can electric taxi fleets open new city markets?
Electric taxi fleets can open new city markets, because operators can enter with branded cars, trained drivers and app plus street booking. Green SM expanded from Jakarta to Makassar and Bekasi in early October 2025 and launched in Surabaya on Oct. 14, 2025. Green GSM began service in 10 of the 16 cities and districts of Metro Manila on June 10, 2025, using VinFast electric cars. Green Xentro then scaled a planned fleet to 2,500 battery electric taxis in March 2026 with salaried drivers. As a result, the group of the Philippines, Vietnam and smaller members posts the fastest country growth in the region, as new brands add cars in cities with few modern taxis.
Is there room to grow through airport and visitor transfers?
Airport and visitor transfers leave room to grow, because longer trips carry higher fares and visitors rarely drive themselves. Changi recorded about 374,000 landings and take-offs in 2025, up 2.2%, and its top markets included Indonesia and Malaysia. Zig grew its private-hire driver base by 28% in 2025 and now has more than 4,000 drivers on its app, which adds capacity for booked transfers. Fleet owners also lease cars to drivers, which links the market to car rental firms. In turn, airport and intercity transfers grow at 7.47% a year, the fastest application rate, as air travel keeps recovering across Southeast Asia.
Legal gaps, fare pressure and driver supply limit growth
How do legal gaps slow motorcycle ride growth?
Legal gaps slow motorcycle ride growth, because several countries still regulate two-wheel passenger services through pilots and caps. In the Philippines, the motorcycle taxi pilot was extended indefinitely while the Senate bill stayed pending. As a result, operators cannot add riders freely, and regulators can order fleet cuts. Move It, for example, was told to cut its fleet to 6,836 riders from 14,662. Platforms respond by lobbying lawmakers for clear national rules that set rider numbers.
Why do commission caps squeeze platform margins?
Commission caps squeeze platform margins, because lower fees reduce the revenue that funds driver incentives, marketing and safety tools. Indonesia's cut to an 8% maximum from 20% lifts the driver share to at least 92% in the region's largest market. In turn, platforms may raise rider fees or cut promotions, which could slow trip growth. Gojek and Grab must also adjust driver programs to fit the new limit. Over time, platforms will lean more on advertising, payments and lending income.
How do licensing rules limit driver supply?
Licensing rules limit driver supply, because drivers need vocational licenses and permits before they can carry passengers. Malaysia's land transport agency issued cancellation notices to Maxim and inDrive on April 24, 2025, over drivers without e-hailing vehicle permits. Both firms then added permit checks and stayed open under a three-month monitoring period from July 24, 2025. As a result, new drivers take longer to join the platforms. Operators respond with faster onboarding support and help with permit applications.
Why does the decline of street hailing hurt metered fleets?
The decline of street hailing hurts metered fleets, because fewer riders flag taxis on the road. Singapore's taxi population fell to 11,932 in August 2026 from 12,280 in April 2026, while taxi driver license holders fell to 89,195. In turn, traditional operators lose fare income on older cars and must add app booking. Fleets respond by joining platforms and shifting toward private-hire cars, as Zig has done, while retired taxis move into the used car trade.
Indonesia leads while smaller markets grow fastest
| Country | Value, 2025 (USD billion) | Share, 2025 | CAGR, 2026–2035 |
|---|---|---|---|
| Philippines, Vietnam, Singapore, Myanmar, Cambodia, Laos and Brunei | 9.66 | 39.6% | 7.24% |
| Indonesia | 8.86 | 36.3% | 7.04% |
| Thailand | 3.29 | 13.5% | 6.44% |
| Malaysia | 2.59 | 10.6% | 6.54% |
Why does Indonesia hold the largest share of fares?
Indonesia held 36.3% of 2025 value and grows at 7.04% a year, because about 169.7 million urban residents rely on app-booked cars and motorcycle rides. Bluebird runs metered taxis and added electric cars in 2025, while Gojek and Grab lead app-booked trips. Green SM now operates in Jakarta, Bekasi, Makassar and Surabaya. However, the commission cap announced in May 2026 will change how platforms fund promotions and driver incentives.
How does Thailand balance tourism and city commuting?
Thailand held 13.5% of 2025 value and grows at 6.44% a year, because Bangkok commuting and tourist travel in Phuket, Pattaya and Chiang Mai support steady demand. inDrive counts these cities as central to its growth, and Line Man Wongnai received a land transport license for Line Man Ride. The country had about 45.0 million urban residents in 2025. However, low-fee competition keeps fares under pressure for every operator.
Why does Malaysia grow under tighter permit rules?
Malaysia held 10.6% of 2025 value and grows at 6.54% a year, because a highly urban population of about 27.8 million city residents supports frequent short trips. Its regulator requires e-hailing vehicle permits for every driver, and it placed Maxim and inDrive under monitoring in July 2025. As a result, platforms now check permits before drivers accept fares, which raises compliance but slows driver onboarding.
How do the Philippines, Vietnam and smaller members add growth?
The Philippines, Vietnam, Singapore, Myanmar, Cambodia, Laos and Brunei held 39.6% of 2025 value and grow at 7.24% a year. Xanh SM began in Vietnam in April 2023 and later entered Laos, while Green GSM launched in Metro Manila in June 2025. Singapore adds high-value trips through Changi and corporate travel, although its taxi fleet is shrinking.
Electric fleet launches and fee rules marked 2025 and 2026
| Development | Status and market relevance |
|---|---|
| In December 2024, Xanh SM launched an all-electric taxi service in Jakarta, its third Southeast Asian market. | Brought VinFast electric taxis to Indonesia |
| In June 2025, Green GSM began electric taxi service in 10 cities and districts of Metro Manila. | Entered the Philippines with an exclusive electric fleet |
| In October 2025, Green SM launched in Surabaya after entering Makassar and Bekasi earlier that month. | Expanded electric taxi coverage to four Indonesian cities |
| In May 2026, Indonesia announced a cap of 8% on platform commissions, down from 20%. | Raises driver shares and pressures platform margins |
| In August 2026, Zig by ComfortDelGro invested more than S$10 million in electric and hybrid private-hire cars. | Supports its shift to a hybrid taxi and private-hire model |
Dispatch apps, digital payment and EVs shape operations
- Real-time dispatch software matches riders with nearby drivers and sets upfront fares, which cuts waiting time and empty driving.
- Digital wallets and card payment replace cash in many cities, which speeds each trip and gives platforms data on demand.
- Battery electric vehicles lower fuel and maintenance costs for fleets such as Bluebird, Xanh SM and Green GSM.
- Telematics and in-car safety tools add GPS tracking, dashcams and panic buttons, which build rider trust in booked trips.
Need a Custom Version of This Report?
Tailor the scope, geography, or segments to your exact requirements.
- Custom geography or segment scope
- Direct access to our analyst team
Super apps, fleet operators and low-fee apps compete
Competition centers on super apps, metered fleet operators, low-fee challengers and new electric taxi brands. Grab runs ride services across the region and reported 30% growth in mobility transactions in the third quarter of 2025. Gojek competes with Grab in Indonesia, where both face the new commission cap. inDrive and Maxim compete on lower fees and negotiated fares, while Line Man Wongnai entered car ride-hailing in Thailand. Bluebird and ComfortDelGro run large metered fleets and are adding electric and private-hire cars. GSM operates Xanh SM, Green SM and Green GSM electric taxi brands in four countries, and Angkas leads Philippine motorcycle taxis. Rivals compete on fares, wait times, safety tools, driver earnings and electric fleet access.
Companies profiled and their roles in this market
| Company | Type | Role in the market |
|---|---|---|
| Grab Holdings | Regional super app | Mobility transactions rose 30% in the third quarter of 2025 |
| Gojek | Indonesian super app (GoTo) | Competes with Grab under Indonesia's new commission cap |
| inDrive | Low-fee ride app | Charges 10% commission with negotiated fares in Thailand |
| ComfortDelGro | Taxi fleet operator | Runs more than 7,600 taxis in Singapore through Zig |
| Maxim | Low-fee ride app | Operates in Malaysia and the Philippines under permit rules |
| Bluebird Group | Taxi fleet operator | Planned 1,000 electric vehicles for 2025 in Indonesia |
| LINE MAN Wongnai | Thai delivery and ride app | Licensed Line Man Ride with a 10% commission |
| GSM (Xanh SM) | Electric taxi operator | Runs electric taxis in Vietnam, Laos, Indonesia and the Philippines |
| Angkas | Motorcycle taxi platform | Accounts for 42% of registered Philippine motorcycle taxis |
Credence Research view on Southeast Asian ride demand
Credence Research's view is that ASEAN taxi demand will grow strongly because dense cities, app booking and business travel keep trip volumes rising. Private-hire cars keep the largest share, while motorcycle rides gain ground fastest. Electric fleets from Bluebird, GSM and Zig lower costs and widen supply in new cities. However, commission caps, licensing rules and unclear motorcycle laws limit platform margins and driver supply. Operators that combine app booking, electric cars and fair driver pay should gain share through 2035.
Regulator, filing and city data anchor the model
The report uses 2025 as the base year on a calendar basis, and market values come from the Credence Research model. That model combines World Bank urban population data, land transport statistics, regulator decisions, airport traffic figures, company filings and operator announcements. Segment splits and country growth rates are Credence Research estimates, while country shares follow the client-defined split. Sources used are public reports, official statistics, regulator records, trade press and company information, and no interviews or surveys were used.
Urban growth and electric fleets carry demand to 2035
Taxi and ride fares are expected to reach USD 48.04 billion by 2035, a 6.99% CAGR during 2026–2035, as urban growth, app booking and electric fleets keep trip volumes rising. Growth should hold firm through 2027 as electric taxi brands enter new cities and platforms adjust to commission caps. After that, motorcycle laws and corporate travel will set the pace of change. Weaker regional economies would lower this outlook, while faster electric fleet rollouts would raise it. Motorcycle rides and airport transfers are expected to gain the most share over the period.
Frequently Asked Questions
How big is the ASEAN taxi market?
Which service type leads ASEAN taxi demand?
Which country leads the ASEAN taxi market?
How much of ASEAN taxi demand comes through apps?
How is Indonesia changing ride-hailing commissions?
Which customer type grows fastest?
Who are the leading taxi and ride companies in ASEAN?
What are the main challenges for taxi and ride operators?
Table of Content
Chapter 1 Market Segmentation
- 1.1 Segmentation Framework
- 1.1.1 Product and Service Classification
- 1.1.2 Application and End-Use Classification
- 1.1.3 Technology and Solution Classification
- 1.1.4 Customer and Distribution Channel Classification
- 1.1.5 Geographic Segmentation
- 1.1.6 Market Segment Definitions and Boundaries
- 1.2 By Service Type
- 1.2.1 Metered Taxi Services
- 1.2.2 Private-Hire Car Services
- 1.2.3 Motorcycle Passenger Services
- 1.3 By Channel
- 1.3.1 Online Booking
- 1.3.2 Street and Rank Hailing
- 1.3.3 Telephone and Concierge Booking
- 1.4 By Application
- 1.4.1 Commuting Trips
- 1.4.2 Airport and Intercity Transfers
- 1.4.3 Local Non-Commuting Trips
- 1.5 By Customer Type
- 1.5.1 Self-Paying Residents
- 1.5.2 Employer-Paid Travelers
- 1.5.3 Self-Paying Visitors
- 1.6 By Country
- 1.6.1 Indonesia
- 1.6.2 Thailand
- 1.6.3 Malaysia
- 1.6.4 Philippines, Vietnam, Singapore, Myanmar, Cambodia, Laos and Brunei
Chapter 2 Introduction
- 2.1 Report Objectives and Scope
- 2.2 Product Definition and Industry Terminology
- 2.3 Market Inclusions and Exclusions
- 2.4 Research Process
- 2.4.1 Primary Research and Expert Interviews
- 2.4.2 Secondary Research and Source Review
- 2.4.3 Top-Down and Bottom-Up Estimation
- 2.4.4 Data Triangulation and Verification
- 2.5 Market Size Measurement Basis
- 2.5.1 2025: USD 24.39 billion → 2035: USD 48.04 billion
- 2.6 Historical and Forecast Reference Periods
- 2.6.1 Historical Period: 2018-2025
- 2.6.2 Base Year: 2025
- 2.6.3 Forecast Period: 2025-2035
- 2.7 Research Assumptions and Limitations
Chapter 3 Executive Summary
- 3.1 Market Snapshot and Key Findings
- 3.2 Base-Year Market Size, 2025
- 3.3 Forecast Market Size, 2035
- 3.4 Revenue and Volume Growth Outlook
- 3.5 Key Demand and Supply Indicators
- 3.6 Leading Market Segments
- 3.7 Fastest-Growing Market Opportunities
- 3.8 Regional Performance Highlights
- 3.9 Technology and Industry Transformation
- 3.10 Competitive Landscape Summary
- 3.11 Analyst View and Strategic Implications
Chapter 4 ASEAN Taxi Market Trends and Developments
- 4.1 Historical Industry Development, 2018-2025
- 4.2 Recent Market Trends and Developments
- 4.3 Demand and Customer Behavior Trends
- 4.4 Technology and Product Innovation
- 4.5 Artificial Intelligence, Automation and Digitalization
- 4.6 Local Manufacturing and Supply Chain Realignment
- 4.7 Industry Partnerships, Mergers and Acquisitions
- 4.8 Sustainability and Circular Economy Developments
- 4.9 Government and Private Sector Investment Trends
- 4.10 Emerging Business Models and Commercialization
- 4.11 Industry Developments and Announcements
Chapter 5 ASEAN Taxi Market Production, Supply and Demand Analysis
- 5.1 Demand Trend and Consumption Analysis, 2018-2025
- 5.2 Demand Forecast, 2025-2035
- 5.3 Production and Output Trend, 2018-2025
- 5.4 Production and Output Forecast, 2025-2035
- 5.5 Installed Capacity and Capacity Utilization
- 5.6 Company-Wise Production Plants and Statistics
- 5.6.1 Installed Production Capacity
- 5.6.2 Actual Production
- 5.6.3 Planned Capacity and Expansion Targets
- 5.7 Supply Chain Structure and Procurement Trends
- 5.8 Supply-Demand Gap and Bottlenecks
- 5.9 Import Dependence and Sourcing Structure
- 5.10 Contract Manufacturing and Outsourcing
- 5.11 Regional Supply and Demand Concentration
Chapter 6 ASEAN Taxi Market Pricing Analysis
- 6.1 Pricing Structure and Measurement
- 6.2 Historical Pricing Trends, 2018-2025
- 6.3 Pricing Outlook, 2025-2035
- 6.4 Average Selling Price and Unit Economics
- 6.5 Pricing by Product and Market Segment
- 6.6 Geographic Pricing Differences
- 6.7 Key Input, Energy, Labor and Logistics Costs
- 6.8 Contract Pricing and Purchasing Models
- 6.9 Pricing Sensitivity and Competitive Positioning
- 6.10 Price, Margin and Profitability Implications
Chapter 7 ASEAN Taxi Market Dynamics
- 7.1 Market Growth Drivers
- 7.1.1 Demand-Side Drivers
- 7.1.2 Technology and Innovation Drivers
- 7.1.3 Infrastructure and Investment Drivers
- 7.1.4 Regulatory and Policy Drivers
- 7.2 Market Restraints
- 7.2.1 Cost and Affordability Constraints
- 7.2.2 Technology and Adoption Barriers
- 7.2.3 Supply Chain and Operational Constraints
- 7.3 Market Challenges
- 7.3.1 Competitive Pressure and Margin Erosion
- 7.3.2 Skills, Infrastructure and Implementation Gaps
- 7.4 Emerging Market Opportunities
- 7.5 Market Dynamics Impact and Time-Horizon Assessment
Chapter 8 ASEAN Taxi Value Chain Analysis
- 8.1 Industry Value Chain Overview
- 8.2 Upstream Suppliers and Critical Inputs
- 8.3 Technology and Component Providers
- 8.4 Manufacturing or Service Delivery
- 8.5 Distribution, Channel Partners and Integrators
- 8.6 Downstream Applications and End Users
- 8.7 Value Addition and Profit Pools
- 8.8 Vertical Integration and Outsourcing
- 8.9 Supplier Concentration and Risk
- 8.10 Supply Chain Localization and Resilience
Chapter 9 ASEAN Taxi Market Regulations and Policies
- 9.1 Relevant Laws, Standards and Compliance Frameworks
- 9.2 Product, Service, Safety and Quality Requirements
- 9.3 Government Policies, Incentives and Subsidies
- 9.4 Imports, Exports and Trade Barriers
- 9.5 Public Procurement and Local Content Requirements
- 9.6 Environmental and Sustainability Compliance
- 9.7 Upcoming Policy Changes and Market Implications
Chapter 10 ASEAN Taxi Market Hotspots and Opportunities
- 10.1 Market Opportunity Mapping and Growth Hotspots
- 10.2 High-Growth Applications and Customer Groups
- 10.3 Underserved Markets and White-Space Opportunities
- 10.4 Emerging Technology and Product Opportunities
- 10.5 New Capacity and Investment Hotspots
- 10.6 Market Entry and Expansion Opportunities
- 10.7 Distribution and Partnership Opportunities
- 10.8 Near-Term and Long-Term Commercial Potential
- 10.9 Opportunity Attractiveness and Execution Risks
Chapter 11 ASEAN Taxi Market Outlook, 2025-2035
- 11.1 Market Size and Analysis
- 11.1.1 Revenue (Market Measurement: 2025: USD 24.39 billion → 2035: USD 48.04 billion)
- 11.1.2 Market Volume and Quantity Sold
- 11.1.3 Historical Market Size, 2018-2025
- 11.1.4 Base-Year Market Size, 2025
- 11.2 Market Forecast, 2025-2035
- 11.2.1 Revenue Forecast to 2035
- 11.2.2 Volume Forecast to 2035
- 11.2.3 CAGR and Year-on-Year Growth
- 11.2.4 Incremental Revenue Opportunity
- 11.3 Forecast Assumptions and Scenario Analysis
- 11.3.1 Base-Case Forecast
- 11.3.2 Optimistic and Conservative Scenarios
- 11.3.3 Technology, Pricing and Policy Sensitivities
- 11.4 Market Attractiveness and Growth Outlook
Chapter 12 ASEAN Taxi Market Segmentation and Outlook
- 12.1 Segmentation Summary and Market Shares, 2025
- 12.2 Largest and Fastest-Growing Segments
- 12.3 By Service Type - Market Size and Forecast, 2025-2035
- 12.3.1 Segment Definition and Scope
- 12.3.2 Historical Market Size, 2018-2025
- 12.3.3 Revenue Forecast, 2025-2035
- 12.3.4 Volume Forecast, 2025-2035
- 12.3.5 Base-Year Market Share, 2025
- 12.3.6 Segment CAGR and Growth Drivers
- 12.3.7 Subsegment Market Size and Forecast
- 12.3.7.1 Metered Taxi Services
- 12.3.7.2 Private-Hire Car Services
- 12.3.7.3 Motorcycle Passenger Services
- 12.3.8 Subsegment Pricing and Adoption Trends
- 12.3.9 Leading Suppliers and Competition
- 12.3.10 Regional Demand and Opportunities
- 12.4 By Channel - Market Size and Forecast, 2025-2035
- 12.4.1 Segment Definition and Scope
- 12.4.2 Historical Market Size, 2018-2025
- 12.4.3 Revenue Forecast, 2025-2035
- 12.4.4 Volume Forecast, 2025-2035
- 12.4.5 Base-Year Market Share, 2025
- 12.4.6 Segment CAGR and Growth Drivers
- 12.4.7 Subsegment Market Size and Forecast
- 12.4.7.1 Online Booking
- 12.4.7.2 Street and Rank Hailing
- 12.4.7.3 Telephone and Concierge Booking
- 12.4.8 Subsegment Pricing and Adoption Trends
- 12.4.9 Leading Suppliers and Competition
- 12.4.10 Regional Demand and Opportunities
- 12.5 By Application - Market Size and Forecast, 2025-2035
- 12.5.1 Segment Definition and Scope
- 12.5.2 Historical Market Size, 2018-2025
- 12.5.3 Revenue Forecast, 2025-2035
- 12.5.4 Volume Forecast, 2025-2035
- 12.5.5 Base-Year Market Share, 2025
- 12.5.6 Segment CAGR and Growth Drivers
- 12.5.7 Subsegment Market Size and Forecast
- 12.5.7.1 Commuting Trips
- 12.5.7.2 Airport and Intercity Transfers
- 12.5.7.3 Local Non-Commuting Trips
- 12.5.8 Subsegment Pricing and Adoption Trends
- 12.5.9 Leading Suppliers and Competition
- 12.5.10 Regional Demand and Opportunities
- 12.6 By Customer Type - Market Size and Forecast, 2025-2035
- 12.6.1 Segment Definition and Scope
- 12.6.2 Historical Market Size, 2018-2025
- 12.6.3 Revenue Forecast, 2025-2035
- 12.6.4 Volume Forecast, 2025-2035
- 12.6.5 Base-Year Market Share, 2025
- 12.6.6 Segment CAGR and Growth Drivers
- 12.6.7 Subsegment Market Size and Forecast
- 12.6.7.1 Self-Paying Residents
- 12.6.7.2 Employer-Paid Travelers
- 12.6.7.3 Self-Paying Visitors
- 12.6.8 Subsegment Pricing and Adoption Trends
- 12.6.9 Leading Suppliers and Competition
- 12.6.10 Regional Demand and Opportunities
- 12.7 By Country - Market Size and Forecast, 2025-2035
- 12.7.1 Segment Definition and Scope
- 12.7.2 Historical Market Size, 2018-2025
- 12.7.3 Revenue Forecast, 2025-2035
- 12.7.4 Volume Forecast, 2025-2035
- 12.7.5 Base-Year Market Share, 2025
- 12.7.6 Segment CAGR and Growth Drivers
- 12.7.7 Subsegment Market Size and Forecast
- 12.7.7.1 Indonesia
- 12.7.7.2 Thailand
- 12.7.7.3 Malaysia
- 12.7.7.4 Philippines, Vietnam, Singapore, Myanmar, Cambodia, Laos and Brunei
- 12.7.8 Subsegment Pricing and Adoption Trends
- 12.7.9 Leading Suppliers and Competition
- 12.7.10 Regional Demand and Opportunities
- 12.8 Segment Growth Comparison
- 12.9 Segment Attractiveness and Priority Matrix
Chapter 13 ASEAN Taxi End-Use and Application Market Outlook
- 13.1 End-Use Industry and Customer Demand Structure
- 13.2 Leading Applications and Customer Groups
- 13.3 End-Use Market Size, Share and Forecast
- 13.4 Major End-Use Industry Deep Dives
- 13.4.1 Customer Requirements and Use Cases
- 13.4.2 Demand and Replacement Cycles
- 13.4.3 Technical and Regulatory Considerations
- 13.4.4 Purchasing and Procurement Models
- 13.4.5 Leading Vendors and Distribution Channels
- 13.4.6 Forecast and Commercial Opportunities
- 13.5 Emerging Applications and Cross-Segment Demand
- 13.6 End-Use Industry Investment Priorities
Chapter 14 ASEAN Taxi Geographic Market Outlook, 2025-2035
- 14.1 Regional Market Size and Country-Level Shares, 2025
- 14.2 Country Market Size Comparison, 2025
- 14.3 Country Market Forecasts, 2025-2035
- 14.4 Subregional Industrial and Demand Clusters
- 14.5 Intra-Regional Pricing and Cost Differences
- 14.6 Cross-Border Trade and Supply Networks
- 14.7 Regional Supply and Demand Balances
- 14.8 Country Opportunity Comparison and Prioritization
Note: Every listed country is covered on the structure shown under the first country.
Chapter 15 ASEAN Taxi Technology, Innovation and Sustainability Outlook
- 15.1 Technology Landscape and Maturity
- 15.2 Product, Process and Service Innovation
- 15.3 AI, Automation and Digital Tools in the Industry
- 15.4 Technology Adoption and Performance Benchmarking
- 15.5 Innovation Pipeline and R&D Investment
- 15.6 Patent and Intellectual Property Trends
- 15.7 Energy Efficiency and Resource Management
- 15.8 Sustainability, Recycling and Circularity
- 15.9 Technology Roadmap, 2025-2035
- 15.10 Risks of Obsolescence and Technology Substitution
Chapter 16 ASEAN Taxi Market Key Strategic Imperatives
- 16.1 Growth and Market Entry Priorities
- 16.2 High-Return Products and Segments
- 16.3 Pricing, Profitability and Cost Optimization
- 16.4 Technology Investment and Product Differentiation
- 16.5 Supply Chain Localization and Resilience
- 16.6 Distribution and Customer Acquisition
- 16.7 Partnership, Acquisition and Capacity Strategy
- 16.8 Regional Expansion Priorities
- 16.9 Short-, Medium- and Long-Term Actions
Chapter 17 Competition Outlook
- 17.1 Industry Competition Characteristics
- 17.2 Market Structure and Concentration
- 17.3 Market Share and Competitive Positioning, 2025
- 17.4 Company-Wise Revenue and Product Benchmarking
- 17.5 Production and Service Capacity Benchmarking
- 17.6 Technology, Pricing and Differentiation
- 17.7 Regional Footprint and Distribution Strength
- 17.8 Mergers, Acquisitions and Strategic Alliances
- 17.9 New Entrants and Competitive Threats
- 17.10 Porter's Five Forces and Industry Attractiveness
- 17.11 Competitive Outlook, 2025-2035
Chapter 18 Company Profiles
- 18.1 Company Coverage and Selection Criteria
- 18.2 Grab Holdings
- 18.2.1 Business Description
- 18.2.2 Company Ownership and Geographic Presence
- 18.2.3 Product and Service Portfolio
- 18.2.4 Manufacturing and Operating Footprint
- 18.2.5 Production Capacity and Expansion Plans
- 18.2.6 Financial Performance and Investment
- 18.2.7 Market Share and Competitive Position
- 18.2.8 Technology and Innovation Capabilities
- 18.2.9 Strategic Alliances or Partnerships
- 18.2.10 Recent Developments
- 18.2.11 Growth Strategy and Outlook
- 18.3 Gojek
- 18.4 inDrive
- 18.5 ComfortDelGro
- 18.6 Maxim
- 18.7 Bluebird Group
- 18.8 LINE MAN Wongnai
- 18.9 GSM (Xanh SM)
- 18.10 Mai Linh Group
- 18.11 Angkas
- 18.12 Other Relevant Market Participants
Note: Every listed company is profiled on the structure shown under the first company. The company list is preliminary and may change based on research findings, market developments, data availability and client requirements.
Chapter 19 Disclaimer
- 19.1 Research and Forecast Disclaimer
- 19.2 Data Source and Estimation Limitations
Note: The depth of individual sections depends on data availability for this market. Volume, capacity, trade and other unit-based metrics are included where applicable.

