
Origin rules and digital filing raise demand for brokers
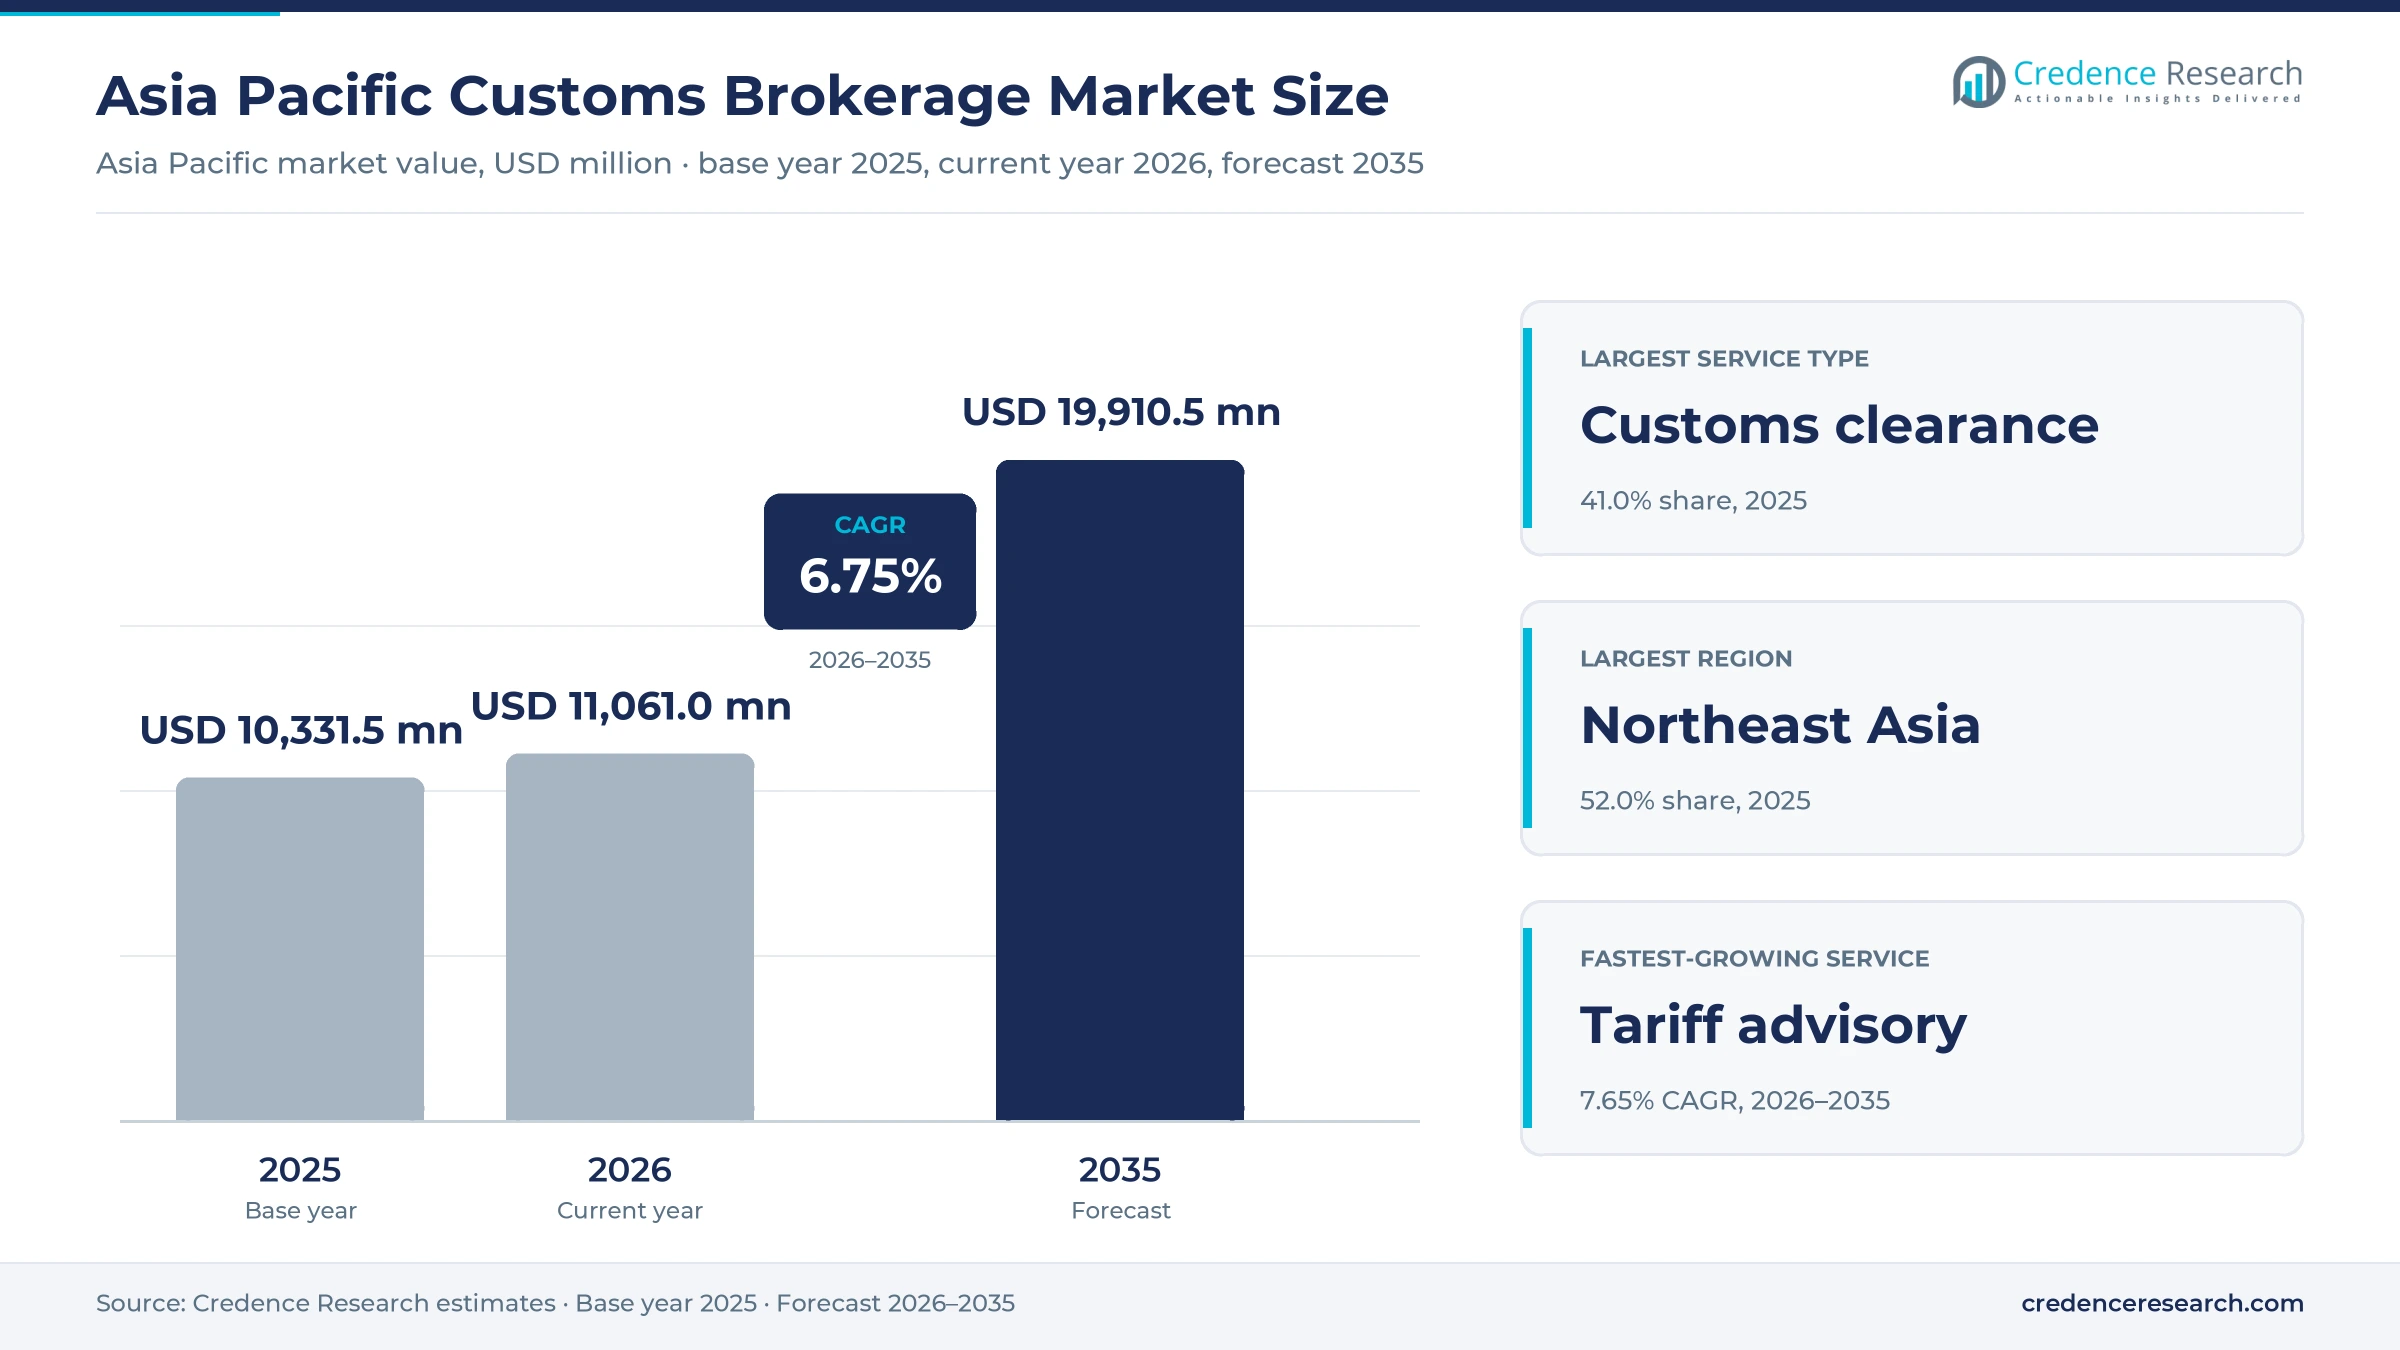
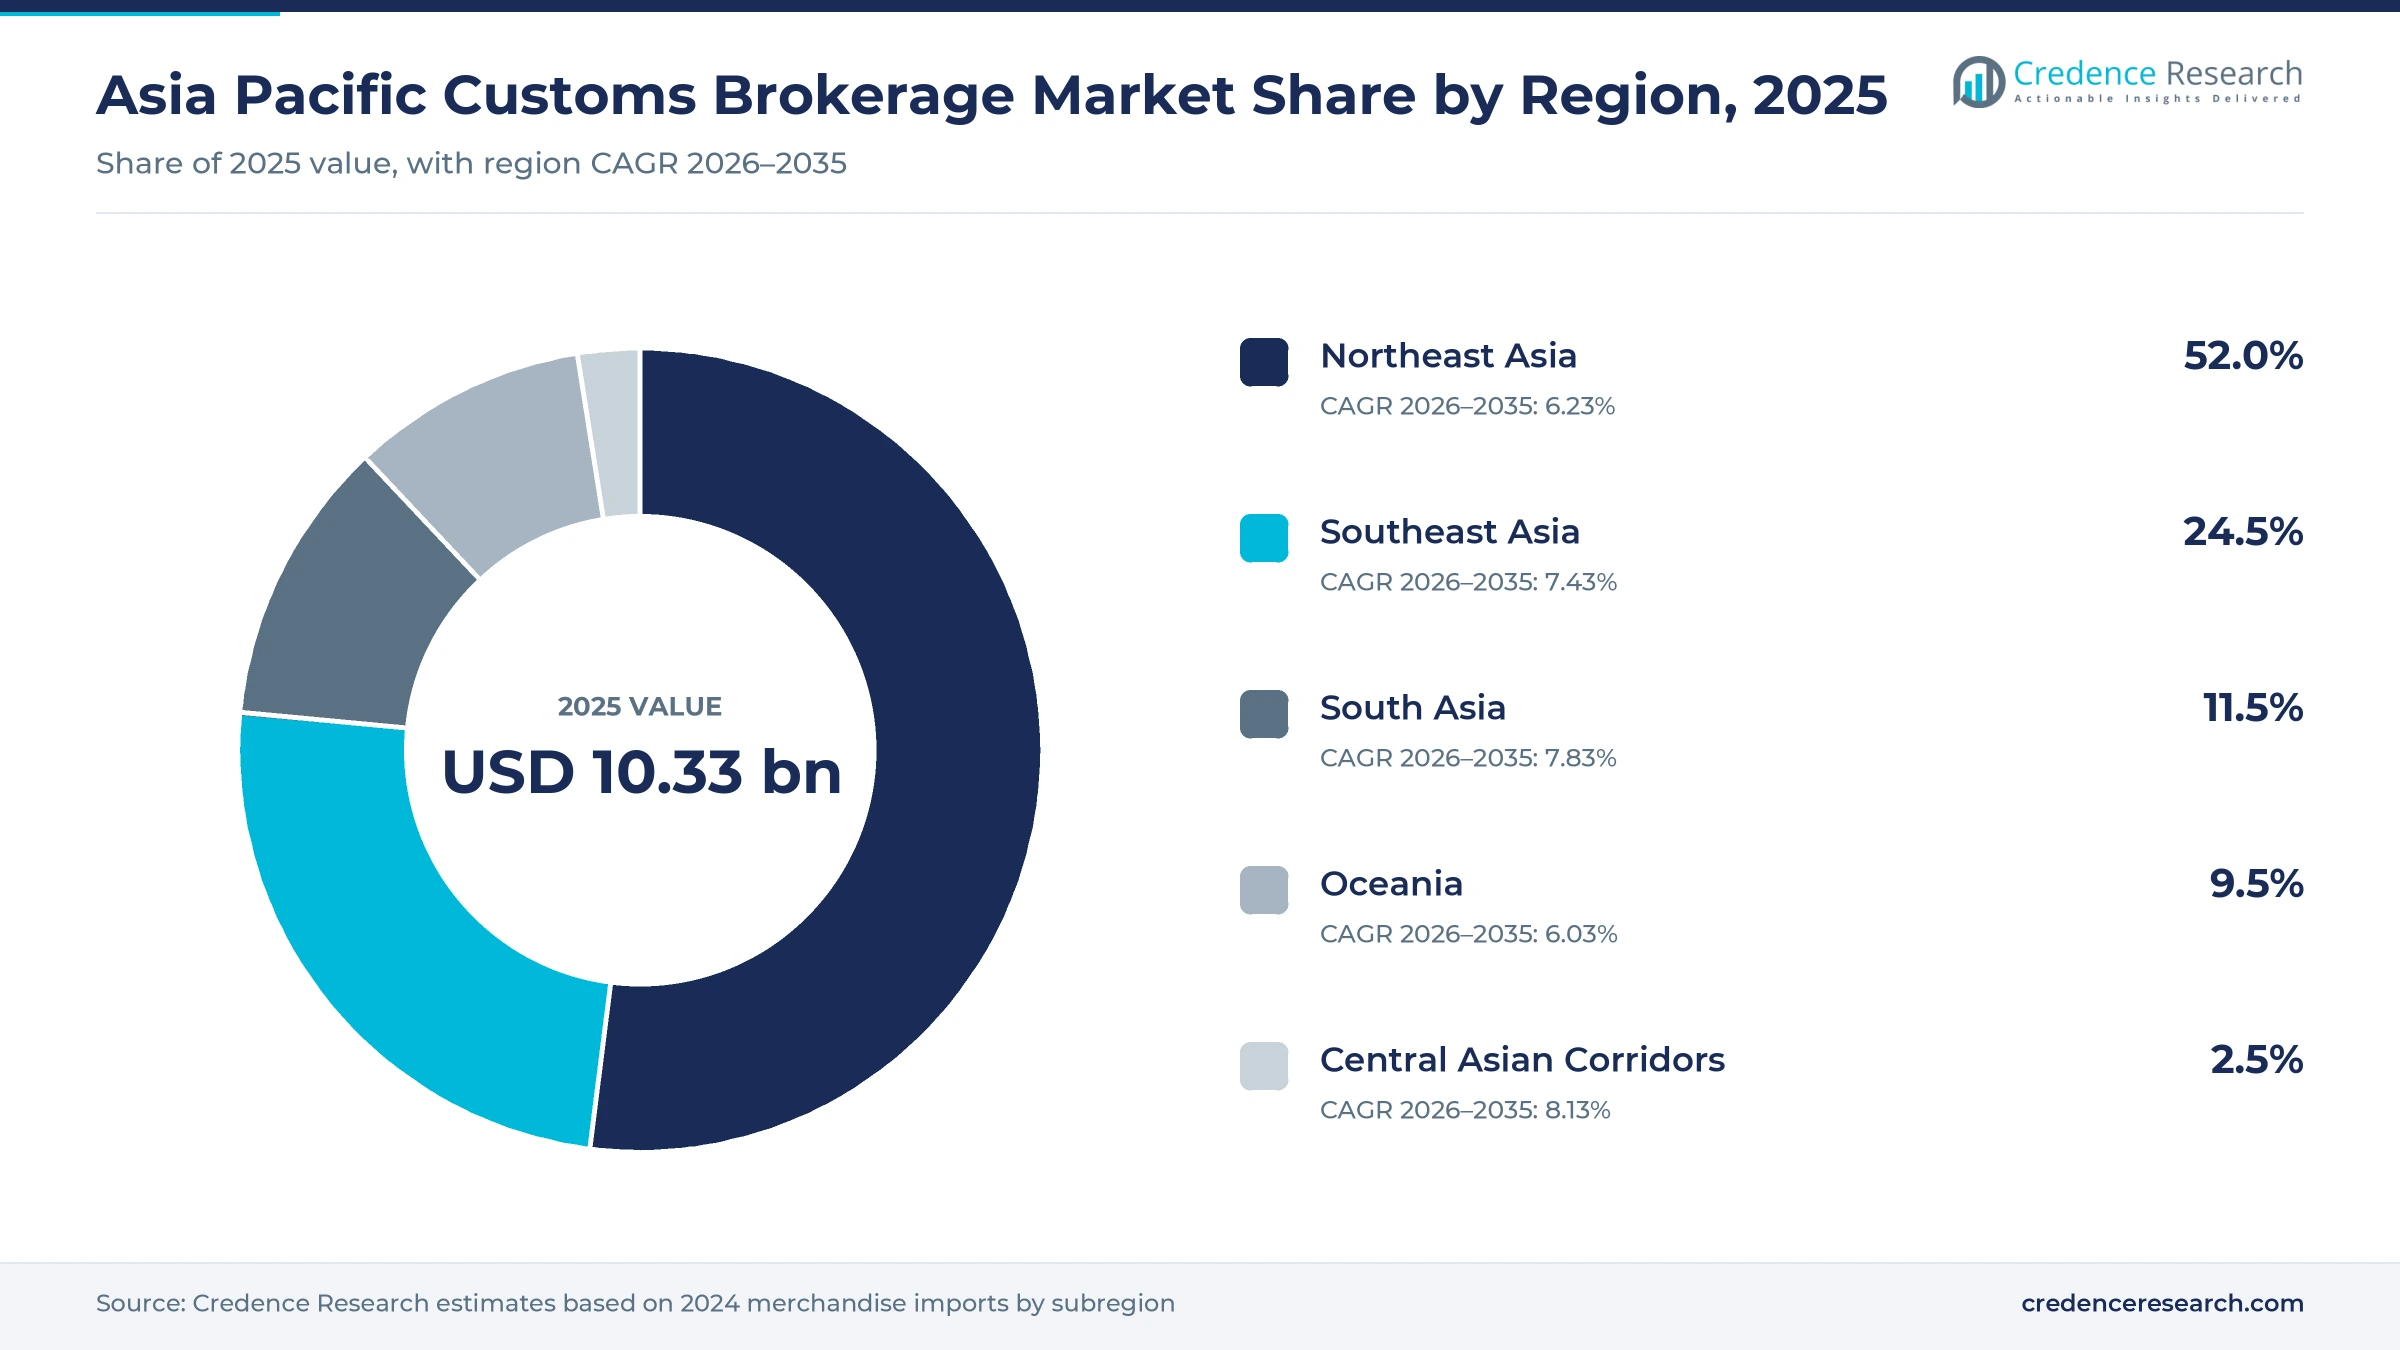
The Asia Pacific customs brokerage market was valued at USD 10.33 billion in 2025 and is projected to increase from USD 11.06 billion in 2026 to USD 19.91 billion by 2035, registering a CAGR of 6.75% during 2026–2035. Demand comes from importers and exporters that must file declarations, prove origin and obtain permits, from freight forwarders that outsource clearance, and from express operators and online marketplaces that move millions of small parcels. Northeast Asia held the largest regional share, 52.0% in 2025, because China, Japan and South Korea import the most goods in the region. Central Asian Corridors form the fastest-growing region at 8.13% a year, as rail and road routes to Europe expand. In turn, all ASEAN member states now exchange electronic origin certificates and customs declaration documents through the ASEAN Single Window.
Which clearance and compliance services does the estimate cover?
The estimate measures fees paid to licensed brokers and logistics groups for customs clearance, documentation and compliance, tariff advice, permit management and post-entry compliance across Asia Pacific. It covers import, export, transit and re-export declarations for ocean, air, road and rail shipments.
The estimate excludes duties and taxes collected by customs authorities, freight charges and warehouse rent. The value chain runs from importers, exporters, forwarders, express operators and online marketplaces through brokers and declaring agents to national customs systems and single windows in Northeast Asia, Southeast Asia, South Asia, Oceania and the Central Asian corridors.
Asia Pacific Customs Brokerage Market Insights
- The Asia Pacific customs brokerage market was valued at USD 10.33 billion in 2025 and is projected to reach USD 19.91 billion by 2035, registering a CAGR of 6.75% during 2026–2035.
- Northeast Asia held a 52.0% share of 2025 value, because China alone imported a record 18.48 trillion yuan of goods in 2025.
- Customs clearance led with a 41.0% share of 2025 value, because every commercial shipment needs a lodged and accepted declaration.
- All ASEAN member states were exchanging electronic origin certificates and customs declaration documents through the ASEAN Single Window by June 2025.
- Singapore Customs has investigated close to 690 origin non-compliance cases since 2020, which raises demand for origin advice.
Clearance work leads while tariff advice grows fastest
Why does clearance work lead service demand?
Based on service type, the market is categorized into customs clearance, documentation and compliance, tariff advisory, permit management and post-entry and extended compliance. Customs Clearance led with a 41.0% share of 2025 value, because every commercial shipment needs a lodged declaration. Tariff Advisory grows fastest at 7.65% a year, as traders seek help choosing among overlapping trade agreements.
How do ocean and air shipments split clearance demand?
Based on mode of transport, the market is categorized into ocean freight, air freight, road freight and rail freight. Ocean Freight led with a 51.0% share of 2025 value, because most regional trade by value moves in containers. Rail Freight grows fastest at 8.11% a year, as China to Europe rail routes through Central Asia add border crossings.
Why do direct traders lead customer demand?
Based on customer type, the market is categorized into direct importers and exporters, freight forwarders and consolidators, express and postal operators, and cross-border marketplace operators. Direct Importers and Exporters led with a 40.0% share of 2025 value, because large manufacturers hire brokers for complex entries. Cross-Border Marketplace Operators grow fastest at 8.41% a year, as online sales add parcel declarations.
How do electronics and healthcare goods shape demand?
Based on end-use industry, the market is categorized into electronics and electrical equipment, automotive and machinery, healthcare and chemicals, consumer goods and food, and energy and raw materials. Electronics and Electrical Equipment led with a 31.0% share of 2025 value, because component trade crosses many borders. Healthcare and Chemicals grows fastest at 7.27% a year, as permits and controls tighten.
| Segment Group | Leading Sub-segment | Share, 2025 | Fastest-growing Sub-segment | CAGR, 2026–2035 |
|---|---|---|---|---|
| By Service Type | Customs Clearance | 41.0% | Tariff Advisory | 7.65% |
| By Mode of Transport | Ocean Freight | 51.0% | Rail Freight | 8.11% |
| By Customer Type | Direct Importers and Exporters | 40.0% | Cross-Border Marketplace Operators | 8.41% |
| By End-Use Industry | Electronics and Electrical Equipment | 31.0% | Healthcare and Chemicals | 7.27% |
Request a Free Sample
Fill in your details and we'll send you a free sample report.
- Sample data tables & charts
- Research methodology
Overlapping trade pacts and single windows lift demand
How does multi-agreement origin complexity lift demand?
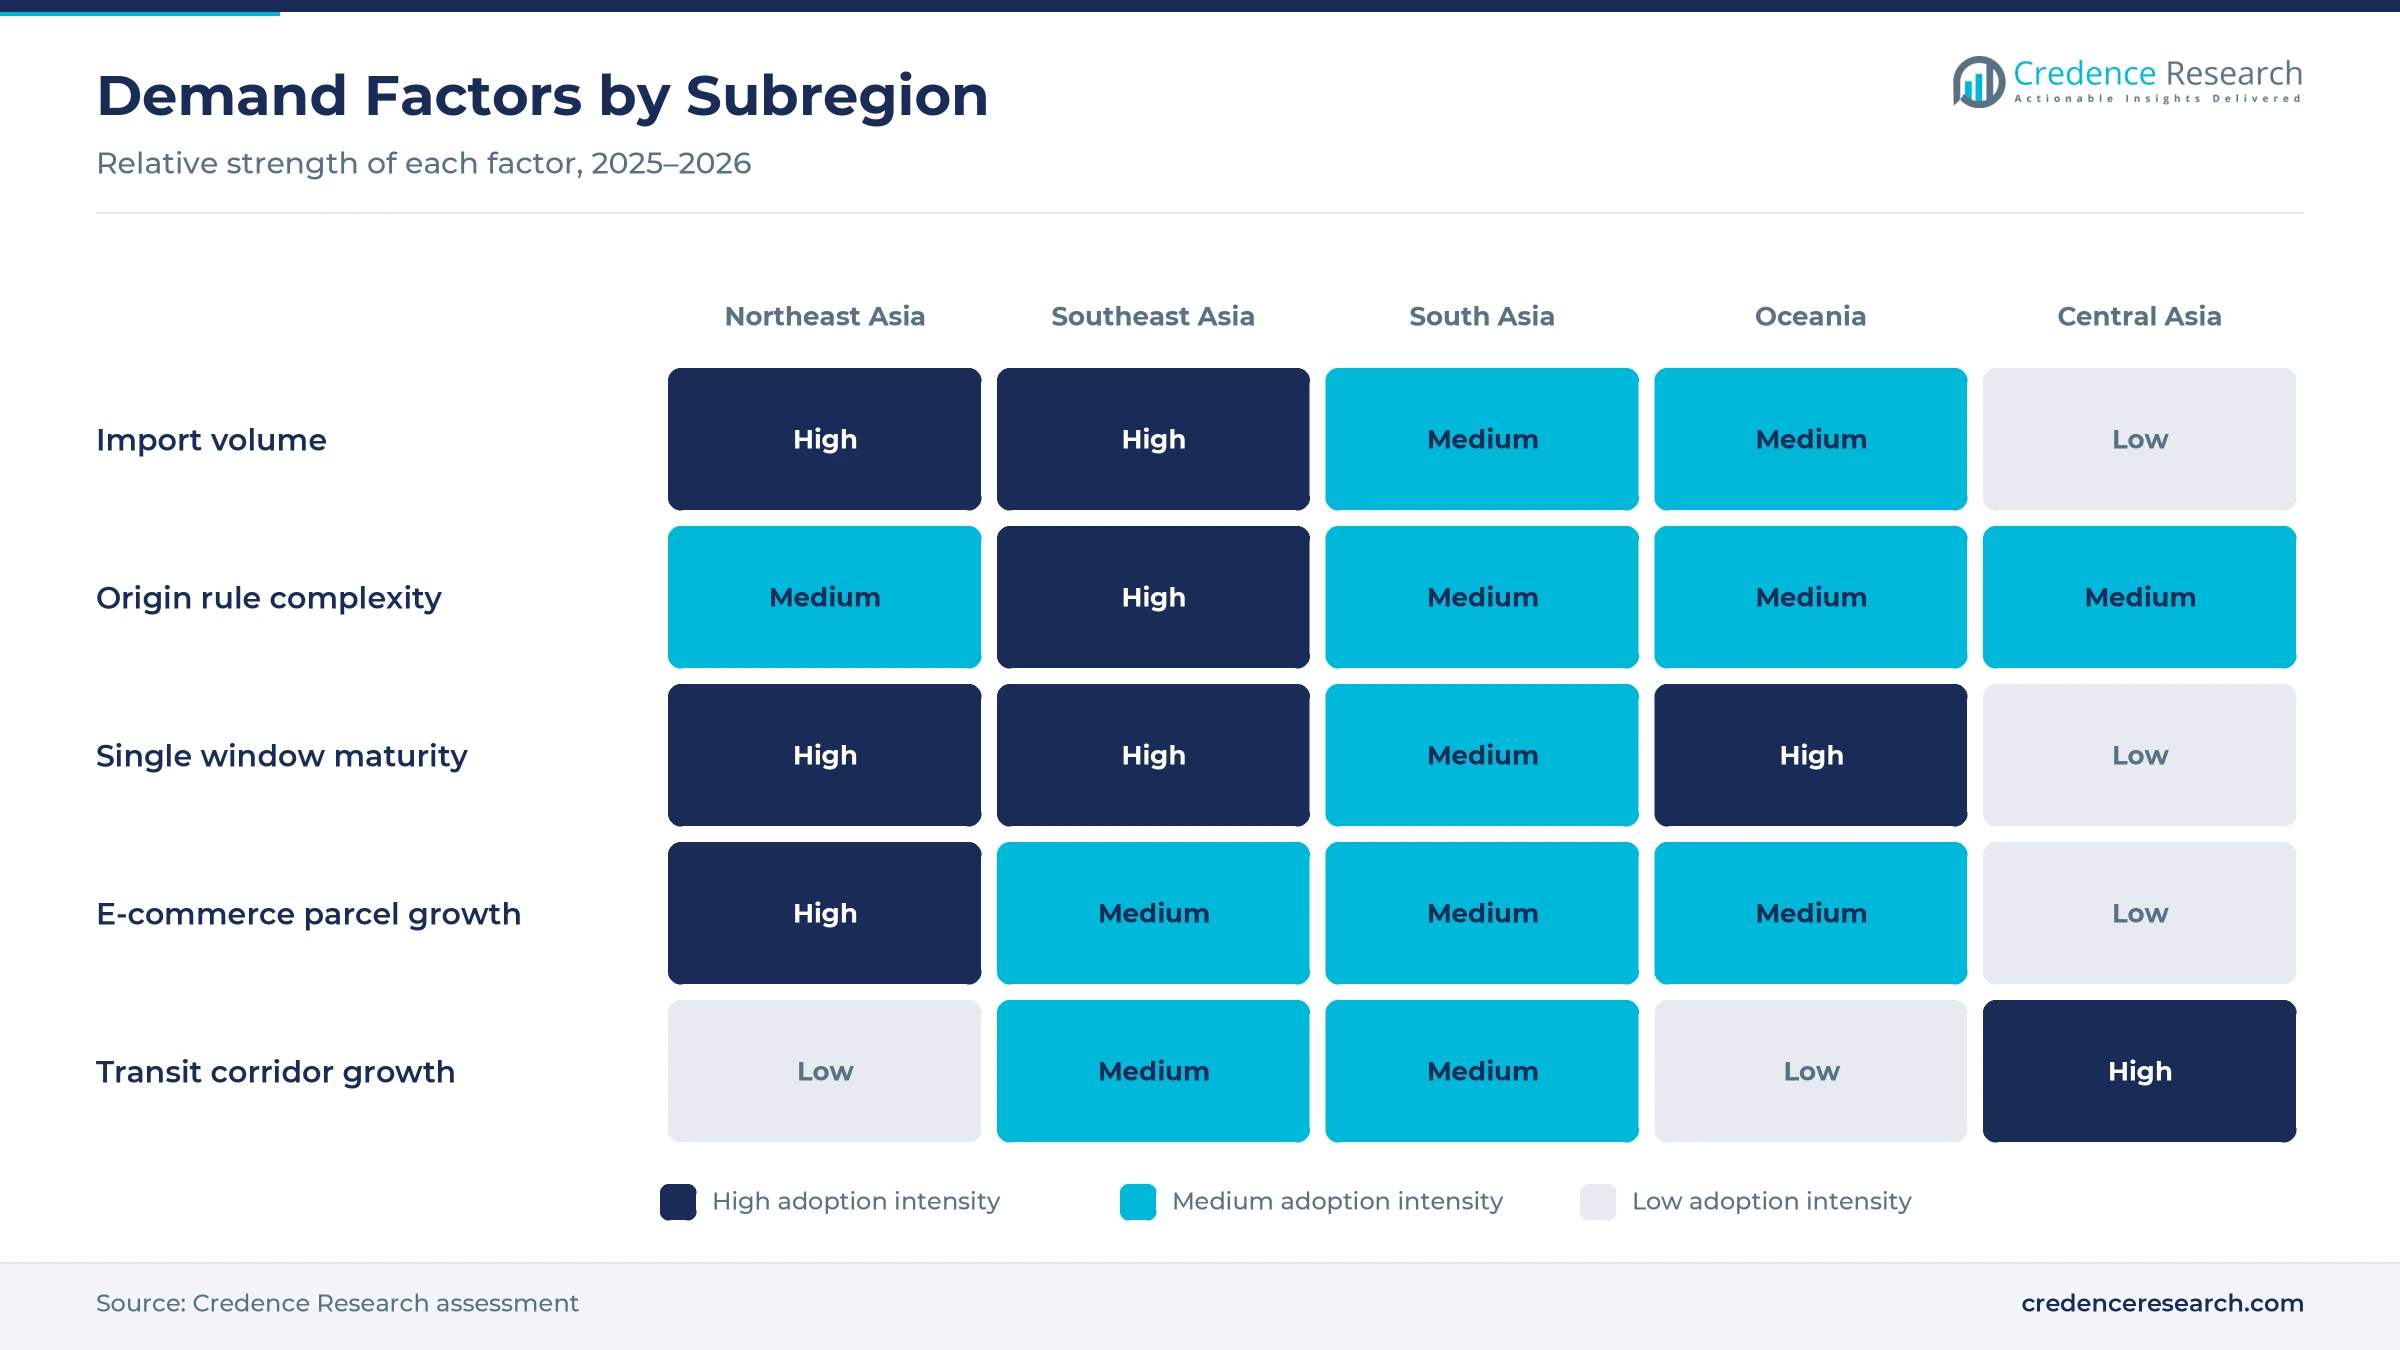
Multi-agreement origin complexity lifts demand, because traders must choose among overlapping trade pacts and prove that goods meet each set of origin rules. The Regional Comprehensive Economic Partnership entered into force on Jan. 1, 2022, covering about 30% of global GDP and about 30% of the world population. The agreement provides tariff elimination of about 92% on goods traded among its parties and allows regional cumulation of origin. Singapore Customs has also investigated close to 690 origin non-compliance cases since 2020, according to a joint government release. As a result, tariff advisory grows at 7.65% a year, the fastest service rate, as importers pay brokers to claim preferences correctly.
Why does digital declaration integration raise broker value?
Digital declaration integration raises broker value, because electronic filing rewards traders that submit complete and accurate data before cargo arrives. The WTO Trade Facilitation Agreement entered into force on Feb. 22, 2017, and full implementation could reduce trade costs by an average of 14.3%. India's National Time Release Study, released in July 2024, found that entries using advance filing, facilitation and trusted trader features cleared about 46% faster than the seaport average. All ten ASEAN member states were also exchanging electronic origin certificates through the regional single window by the end of 2019. In turn, brokers that link their systems to national platforms win more volume from freight forwarding groups.
How does TradeNet, Singapore's national single window, shape demand?
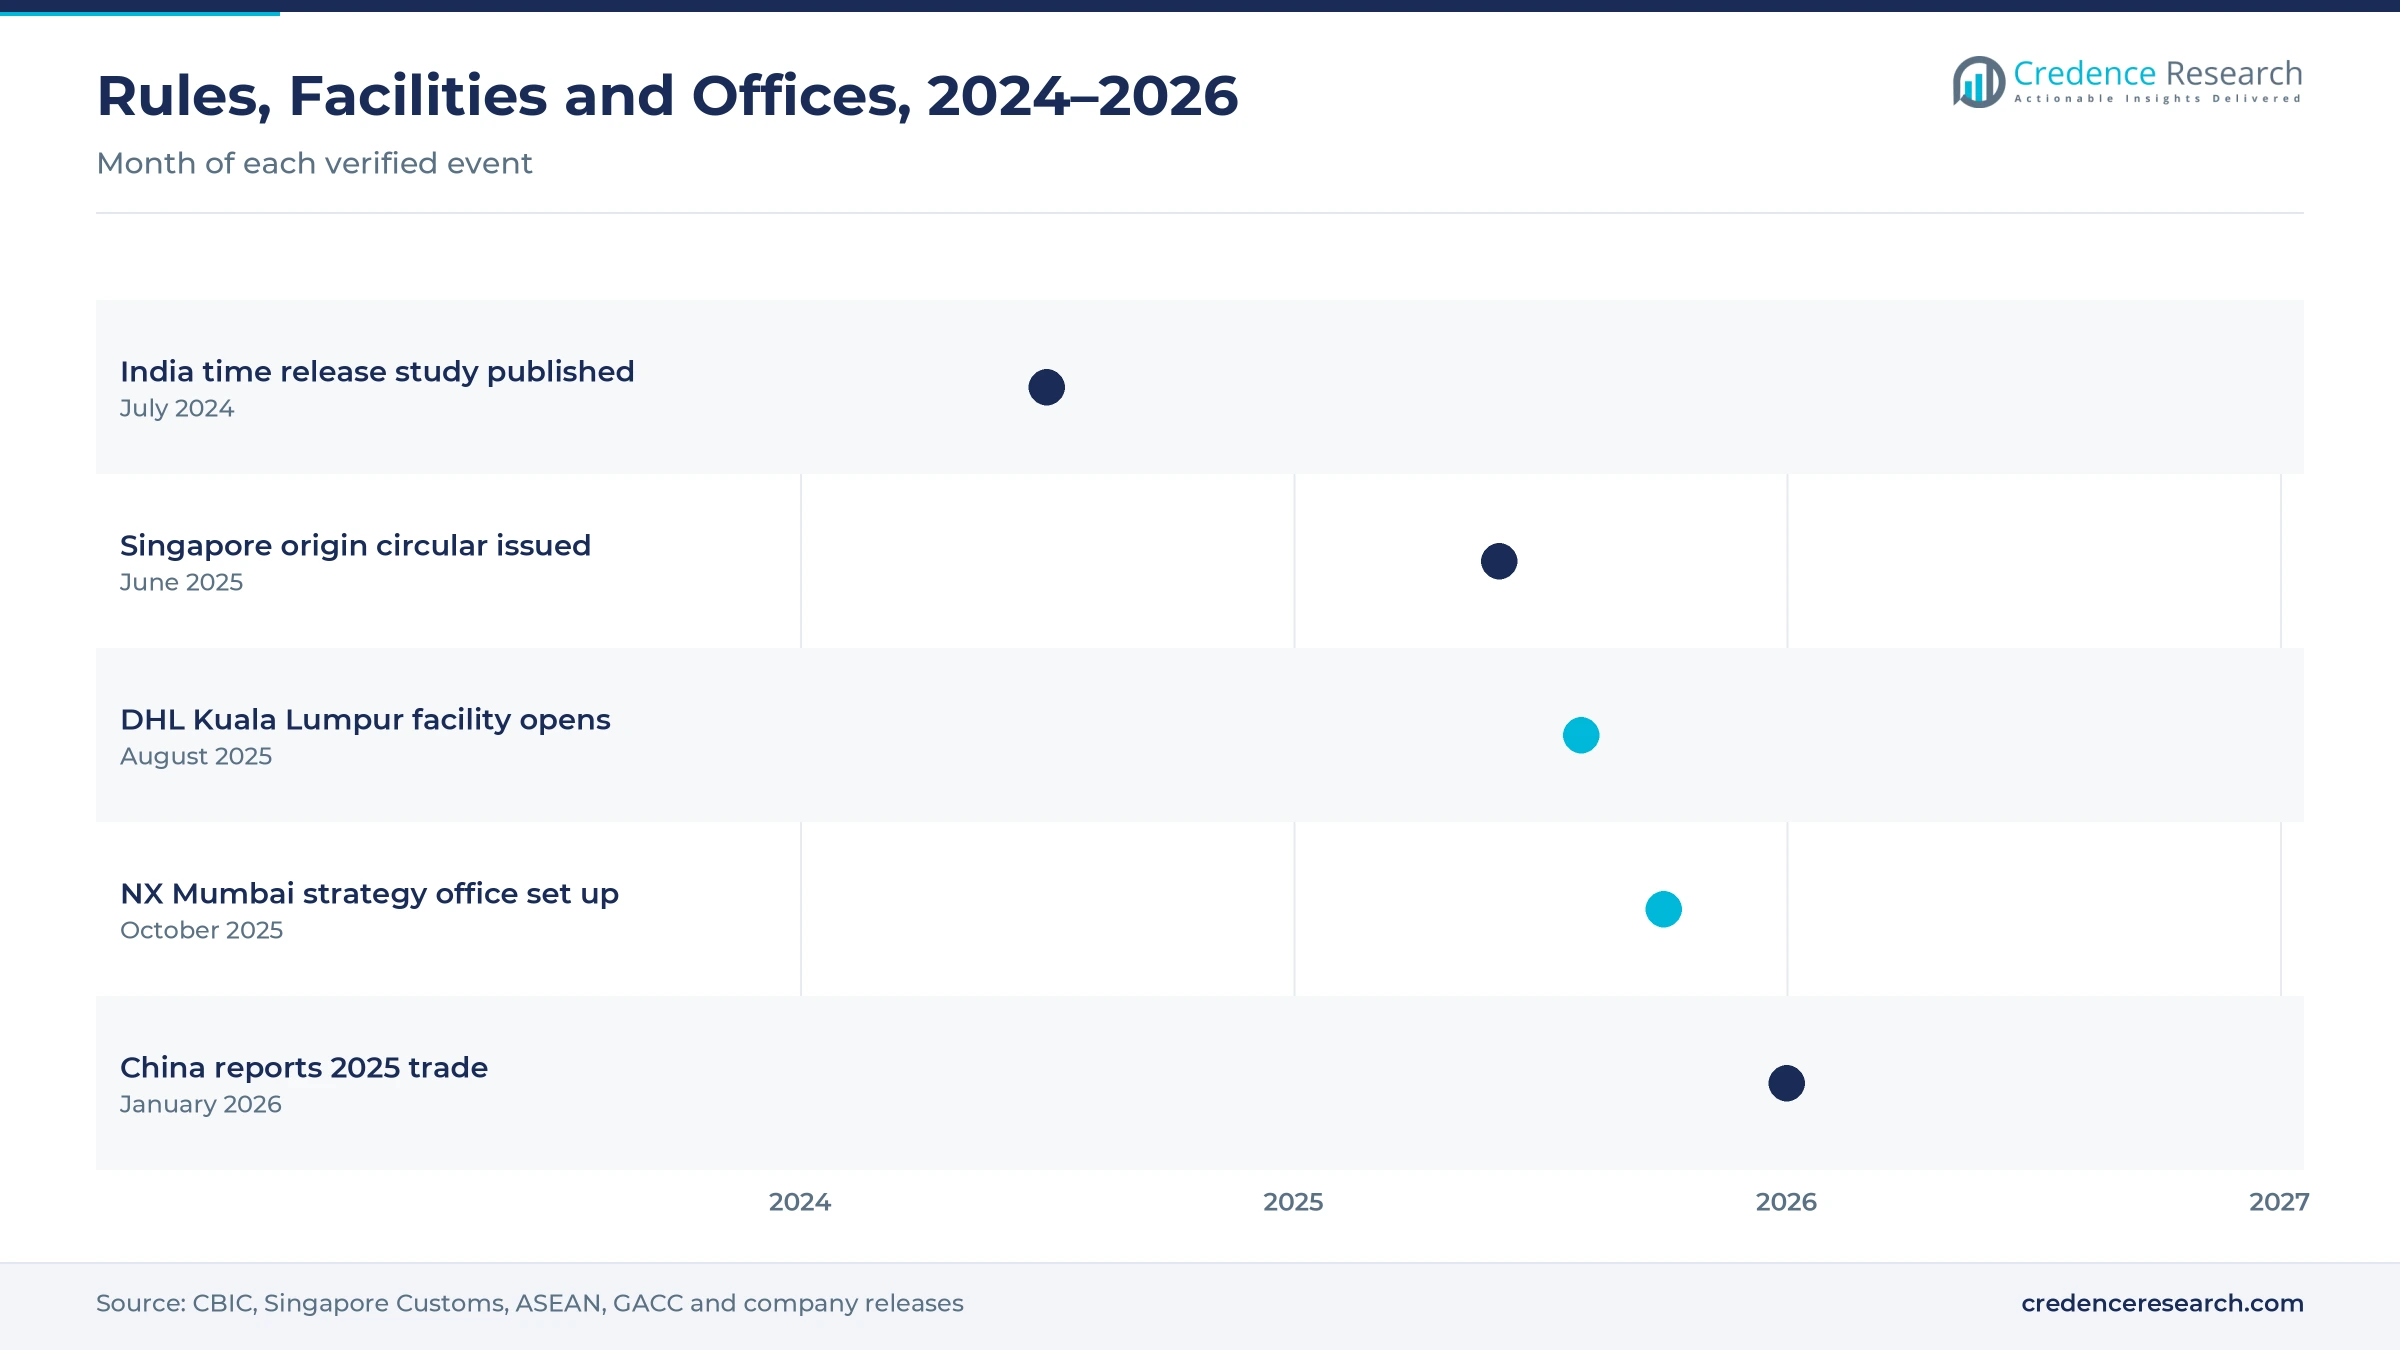
TradeNet, Singapore's national single window, shapes demand, because every permit must pass through one electronic system with strict data rules. Singapore Customs states that TradeNet was launched in 1989 and handles all import, export and transhipment permit applications. On June 9, 2025, Singapore Customs issued Circular No. 06/2025, reminding traders and declaring agents to complete the origin field accurately. The circular also bars "N/A" in that field and requires origin records to be kept for at least five years. As a result, Southeast Asia grows at 7.43% a year, as declaring agents in Singapore add origin checks and record-keeping services for transhipment trade.
Why do cross-border e-commerce volumes add declarations?
Cross-border e-commerce volumes add declarations, because every parcel sold by an overseas marketplace must be cleared, even when duties are low. China's cross-border e-commerce imports and exports reached 2.84 trillion yuan in 2025, up 4.8% from 2024, according to customs data. Some 140 million people in China also bought through cross-border platforms in the first half of 2026. China's total foreign trade reached 45.47 trillion yuan in 2025, up 3.8%. In turn, marketplace operators grow at 8.41% a year, the fastest customer rate, as platforms that sell direct to overseas consumers outsource bulk parcel filing to licensed brokers with high-volume clearance systems.
Regional data links and origin audits reshape clearance
How is the shift to regional document exchange changing clearance?
The shift to regional document exchange is changing clearance, because customs data now moves between countries before goods arrive. All ASEAN member states were exchanging both the electronic origin certificate and the ASEAN Customs Declaration Document by June 2025, according to the ASEAN Secretariat. The exchange began as a pilot among five member states in 2018 and covered all ten by the end of 2019. Indonesia, the Philippines and Thailand have also started exchanging electronic plant health certificates. Talks are underway to link the regional window with China, Japan, South Korea and the United States. As a result, brokers spend less time on paper checks and more time on data quality, which lifts demand for documentation and compliance services across Southeast Asia.
Why is the rise of origin audits and post-entry checks notable?
The rise of origin audits and post-entry checks is notable, because customs authorities now review claims after goods are released. Singapore Customs warned in June 2025 that incorrect origin declarations may be an offence under the Customs Act and the Regulation of Imports and Exports Act. Its non-preferential origin rules require substantial transformation, such as 25% minimum local content or a change in 6-digit tariff sub-heading. Simple packing or labeling also does not confer Singapore origin, while goods in HS Chapters 27 to 40 can qualify through a chemical reaction. In turn, post-entry and extended compliance gains share across the region, as traders hire brokers to review past entries and prepare for audits.
Can Central Asian corridors open a new clearance market?
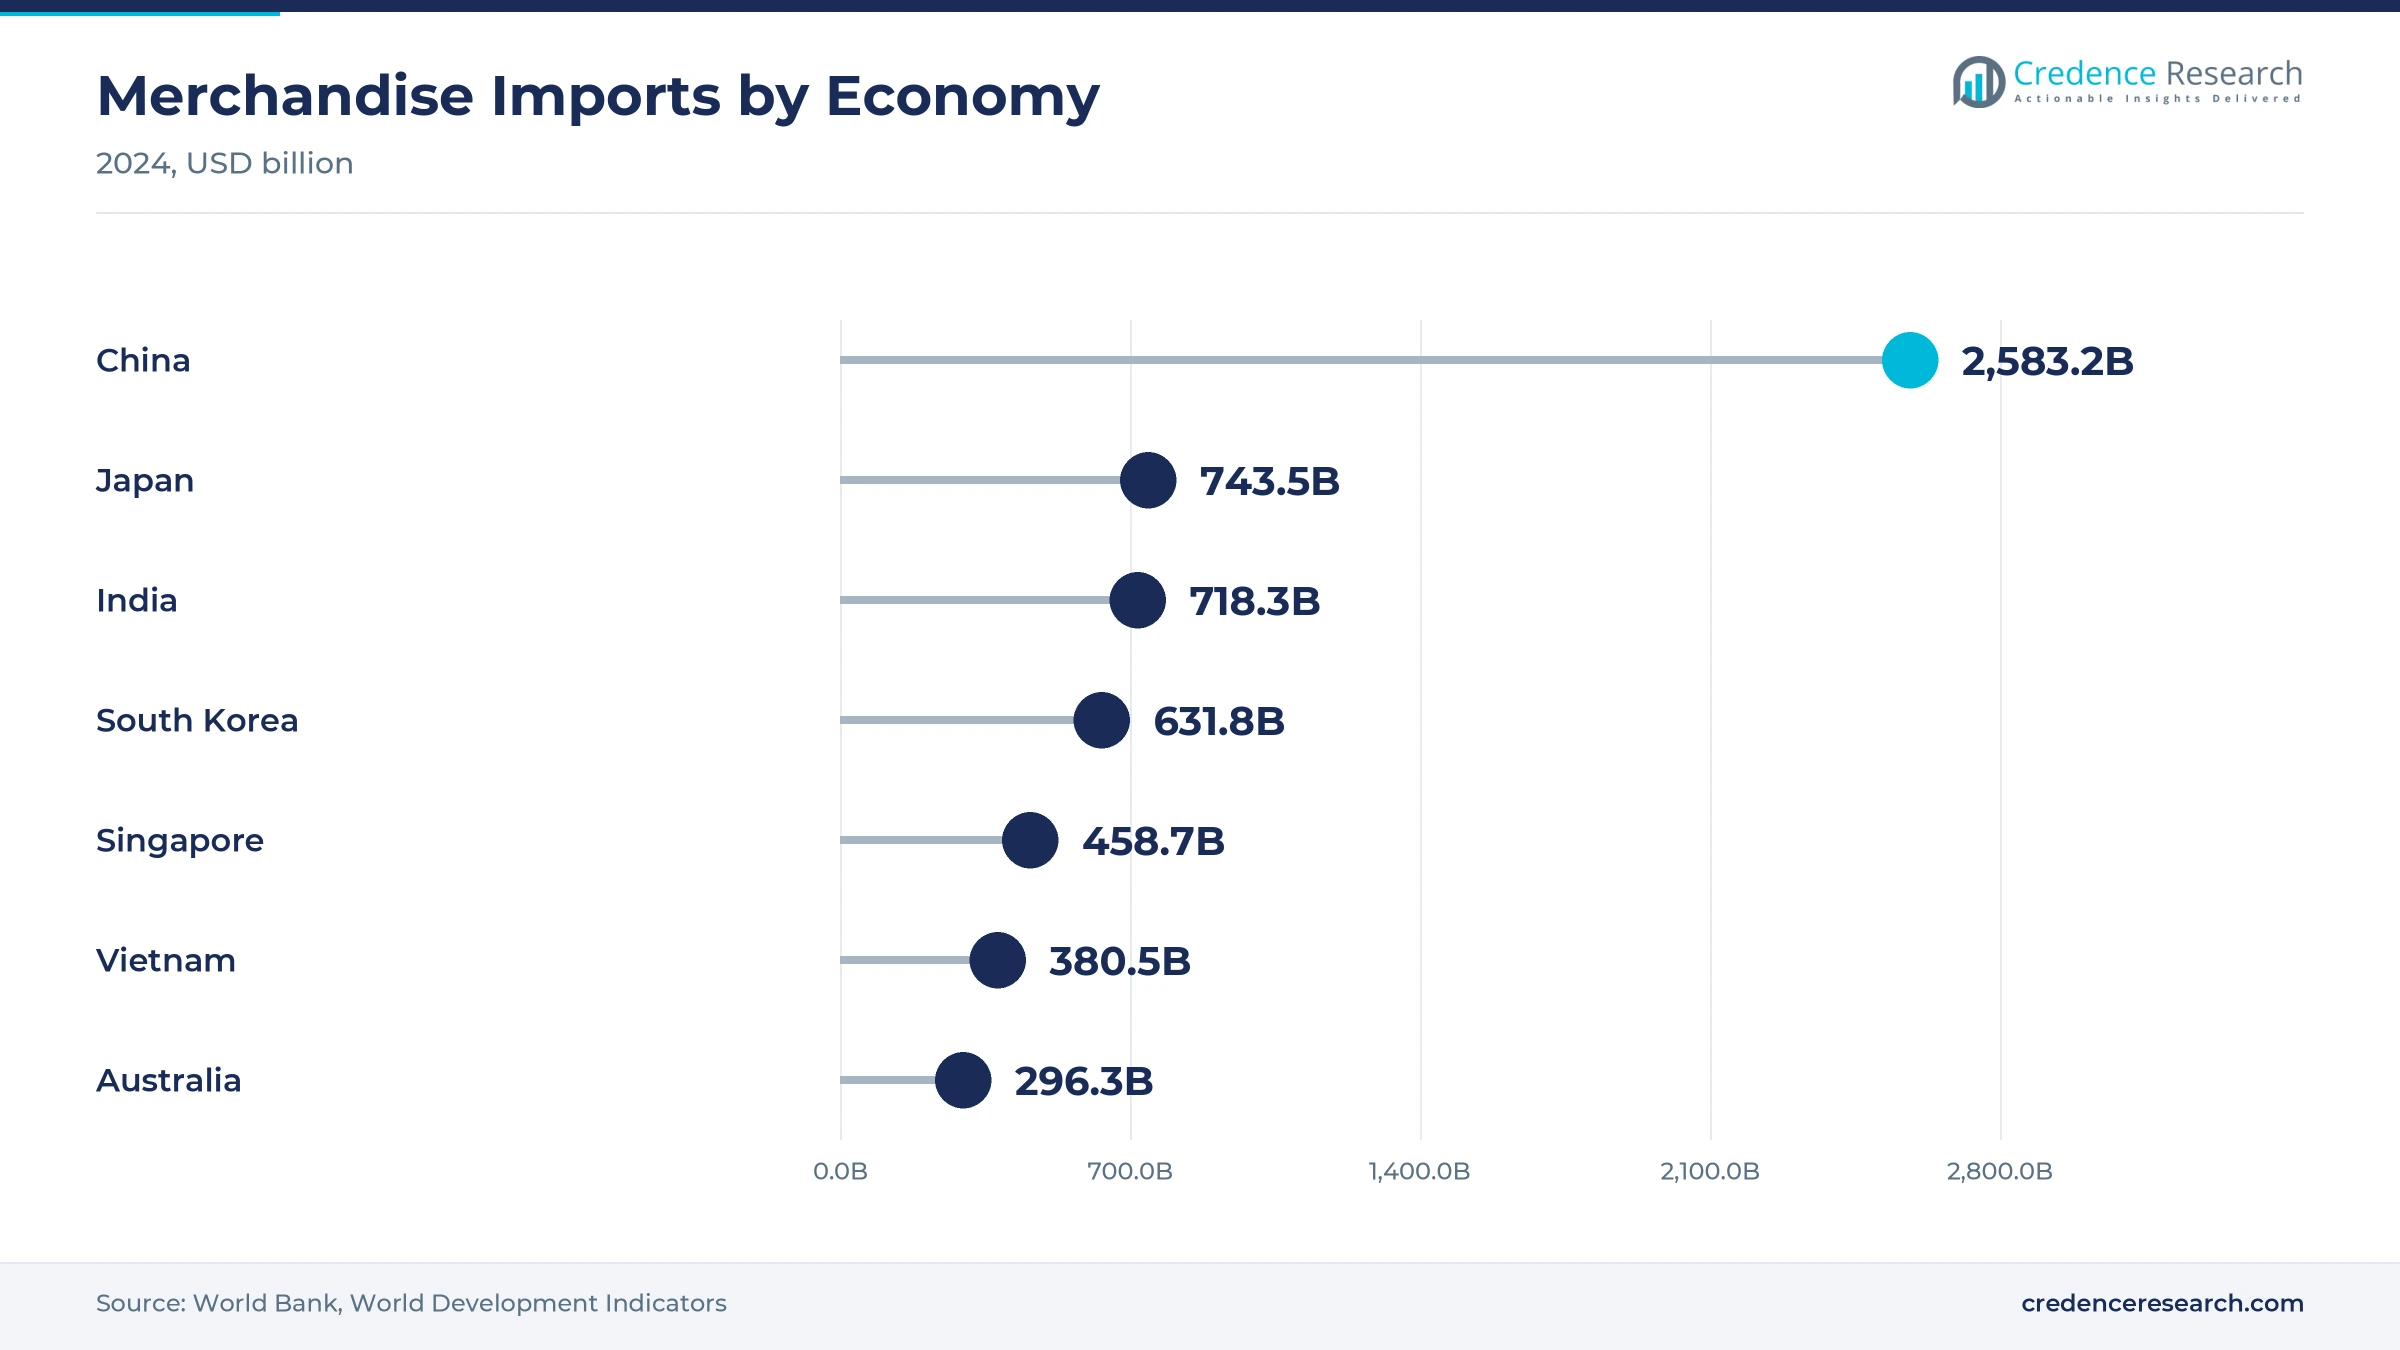
Central Asian corridors open a new clearance market, because rail and road routes between China and Europe need transit and border declarations in several countries. The World Bank found that the Middle Corridor could triple trade volumes and halve travel time by 2030 with the right investments and policies. Intra-regional trade among Azerbaijan, Georgia and Kazakhstan would also rise 37%, and trade with the European Union would rise 28%. Kazakhstan alone imported USD 59.1 billion of goods in 2024, according to World Bank data. As a result, rail freight gains share across the region, as brokers open offices at rail border points and dry ports.
Is there room for logistics groups to widen regional broker networks?
Logistics groups have room to widen regional broker networks, because shippers prefer one provider for freight and clearance across several countries. DHL opened a 38,000-square-foot healthcare facility at Kuala Lumpur International Airport on Aug. 27, 2025, listing customs broking among its services. Nippon Express set up an Indian Ocean Rim strategy office in Mumbai in October 2025 and began full operations in April 2026. Kuehne+Nagel also runs its Asia Pacific region from Singapore with about 10,000 employees. In turn, brokers that bundle clearance with airport cargo handling and warehousing can win larger regional contracts from manufacturers, retailers and online marketplaces across Asia Pacific.
Policy swings, skills gaps and fee pressure test brokers
How do sudden tariff changes strain broker operations?
Sudden tariff changes strain broker operations, because new duties, exclusions and origin rules can take effect with little notice. Brokers must update tariff tables, retrain staff and advise clients within days. As a result, errors and delays rise during policy shifts, and some clients face penalties. Many brokers respond with automated tariff libraries, regulatory alert services and dedicated advisory teams for major trade lanes, which help clients plan shipments around new rules.
Why does a shortage of licensed staff limit capacity?
A shortage of licensed staff limits capacity, because each country requires its own broker licenses, exams and experience rules. Skilled staff who understand classification, valuation and origin are hard to hire and retain. In turn, smaller brokers struggle to handle peak volumes and complex entries. Many respond with training programs, shared service centers and software that handles routine data entry, which frees licensed staff for complex classification and origin work.
How does fee pressure from digital self-filing affect margins?
Fee pressure from digital self-filing affects margins, because single windows make it easier for large traders to lodge simple declarations themselves. Routine import entries face strong price competition as a result. Brokers then earn less from basic filing and must shift toward advice, audits and permit work. Many respond with retainer and managed-service contracts that bundle compliance support with clearance, which gives clients predictable costs and gives brokers steadier revenue.
Why do system outages and data risks disrupt clearance?
System outages and data risks disrupt clearance, because declarations depend on national platforms and broker software that must stay online. A single window outage can hold cargo at ports and airports for hours. In turn, brokers and their clients face storage charges, missed connections and complaints. Many respond with backup filing procedures, stronger cybersecurity controls and closer contact with customs help desks, which shortens recovery time when national systems fail.
Northeast Asia leads as Central Asian routes grow fastest
| Region | Value, 2025 (USD billion) | Share, 2025 | CAGR, 2026–2035 |
|---|---|---|---|
| Northeast Asia | 5.37 | 52.0% | 6.23% |
| Southeast Asia | 2.53 | 24.5% | 7.43% |
| South Asia | 1.19 | 11.5% | 7.83% |
| Oceania | 0.98 | 9.5% | 6.03% |
| Central Asian Corridors | 0.26 | 2.5% | 8.13% |
Why does Northeast Asia keep the top share?
Northeast Asia held a 52.0% share of 2025 value and grows at 6.23% a year, because China, Japan and South Korea import the most goods in the region. China's imports reached a record 18.48 trillion yuan in 2025, and Japan and South Korea imported USD 743.5 billion and USD 631.8 billion of goods in 2024. However, growth is slower than in southern subregions, because many large traders already file declarations through in-house teams and mature national systems.
How does Southeast Asia support transhipment and origin work?
Southeast Asia held a 24.5% share of 2025 value and grows at 7.43% a year, because Singapore, Vietnam, Malaysia and Thailand sit at the center of regional supply chains. Vietnam's goods imports rose to USD 380.5 billion in 2024 from USD 325.8 billion in 2023, while Singapore imported USD 458.7 billion. As a result, origin advice, transhipment permits and regional document exchange create steady broker demand across the subregion, especially for electronics and machinery supply chains.
Why is South Asia adding clearance volume quickly?
South Asia held 11.5% of 2025 value and grows at 7.83% a year, because India's trade is expanding and its customs processes are going digital. India imported USD 718.3 billion of goods in 2024, up from USD 673.9 billion in 2023. Export cargo at Indian seaports cleared in an average of 22 hours and 49 minutes in the 2024 time release study, which shows how much time advance filing can still save.
How does Oceania keep demand for licensed brokers?
Oceania held a 9.5% share of 2025 value and grows at 6.03% a year, because Australia and New Zealand require licensed brokers for most commercial imports. Australia imported USD 296.3 billion of goods in 2024, which supports steady clearance and biosecurity permit work at major ports and airports.
What drives demand in the Central Asian corridors?
Central Asian Corridors held a 2.5% share of 2025 value and grow fastest at 8.13% a year, because rail and road routes between China and Europe add transit declarations at several borders along the way.
Rules, facilities and offices from 2024 to 2026
| Development | Status and market relevance |
|---|---|
| In July 2024, India released its National Time Release Study 2024 on cargo clearance times. | Showed faster clearance for entries using advance filing and trusted trader features |
| In June 2025, Singapore Customs issued Circular No. 06/2025 on origin declarations in TradeNet permits. | Bars "N/A" in the origin field and requires five years of records |
| In August 2025, DHL opened a healthcare facility at Kuala Lumpur International Airport that offers customs broking. | Adds clearance capacity for medical technology shipments in Malaysia |
| In January 2026, China reported foreign trade of 45.47 trillion yuan for 2025, with record imports. | Confirms rising declaration volumes in Northeast Asia |
| In April 2026, Nippon Express began full operations at its Indian Ocean Rim strategy office in Mumbai. | Supports trade lane growth across India, the Middle East and Africa |
Single windows and electronic origin data change filing
- National single windows let traders and brokers file one electronic submission for customs and other agencies, which cuts duplicate data entry and speeds release.
- Electronic origin exchange sends certificates of origin and declaration data directly between customs authorities, which reduces fraud and paper handling.
- Automated classification tools suggest tariff codes and flag origin risks from product data, which helps brokers handle more entries with the same staff and supports trade compliance platforms used by large shippers.
Need a Custom Version of This Report?
Tailor the scope, geography, or segments to your exact requirements.
- Custom geography or segment scope
- Direct access to our analyst team
Global logistics groups and local brokers compete
Competition in customs brokerage is split between global logistics groups that bundle clearance with freight and warehousing, and local brokers that know each national system. Sinotrans offers customs declaration and inspection services as part of its sea freight business in China. DHL lists customs broking among the services at its healthcare facility at Kuala Lumpur International Airport. Nippon Express is expanding its regional reach through a strategy office in Mumbai, while Kuehne+Nagel runs its Asia Pacific region from Singapore. Expeditors International also competes for regional clearance business across the region. Rivals compete on licensed staff, system links to single windows, origin and tariff expertise, speed of release and price. Because rules differ in every country, providers with local licenses and regional data platforms win the most multi-country contracts.
Which companies provide regional clearance services?
| Company | Type | Role in the market |
|---|---|---|
| Sinotrans | Integrated logistics group | Customs declaration and inspection within its China sea freight business |
| DHL Group | Global logistics group | Customs broking at its Kuala Lumpur airport healthcare facility |
| Nippon Express | Global logistics group | Indian Ocean Rim strategy office in Mumbai since October 2025 |
| Kuehne+Nagel | Global logistics group | Asia Pacific region run from Singapore with about 10,000 employees |
Credence Research view on regional clearance services
Credence Research's view is that Asia Pacific demand for customs brokerage services will grow steadily because trade agreements, origin rules and digital filing make clearance more technical. Customs clearance remains the largest service, while tariff advice and post-entry compliance add the fastest growth as authorities audit origin claims. Southeast Asia, South Asia and the Central Asian routes will add most new volume. Brokers that combine licensed staff, single window links and origin expertise should gain share fastest, while basic filing fees keep falling.
How the regional clearance services estimate was built
The report uses 2025 as the base year on a calendar basis, and market values come from the Credence Research model. That model combines merchandise import data, national customs statistics, trade agreement texts, customs circulars and company announcements on facilities and offices. Segment splits, subregion shares and growth rates are Credence Research estimates built from public trade data. Sources used are official statistics, government releases, intergovernmental reports, trade press and company releases, and no interviews or surveys were used.
Origin advice and digital filing carry growth to 2035
Customs brokerage value is expected to reach USD 19.91 billion by 2035, a 6.75% CAGR during 2026–2035, as overlapping trade agreements, digital filing and online trade lift demand for clearance and advice. Growth should stay steady through 2030 while single windows connect across borders. After that, origin audits, post-entry compliance and corridor transit work will carry more growth. Sudden tariff changes would add advisory work but strain capacity. Brokers with strong data links and licensed staff are expected to gain the most.
Frequently Asked Questions
How big is the Asia Pacific customs brokerage market?
Which service type leads regional clearance demand?
Which subregion leads the Asia Pacific market?
What is TradeNet?
How does RCEP affect demand for brokers?
Which customer type is growing fastest?
Who are the leading companies in Asia Pacific brokerage?
What are the main challenges for brokers?
Table of Content
Chapter 1 Market Segmentation
- 1.1 Segmentation Framework
- 1.1.1 Product and Service Classification
- 1.1.2 Application and End-Use Classification
- 1.1.3 Technology and Solution Classification
- 1.1.4 Customer and Distribution Channel Classification
- 1.1.5 Geographic Segmentation
- 1.1.6 Market Segment Definitions and Boundaries
- 1.2 By Service Type
- 1.2.1 Customs Clearance
- 1.2.2 Documentation and Compliance
- 1.2.3 Tariff Advisory
- 1.2.4 Permit Management
- 1.2.5 Post-Entry and Extended Compliance
- 1.3 By Mode of Transport
- 1.3.1 Ocean Freight
- 1.3.2 Air Freight
- 1.3.3 Road Freight
- 1.3.4 Rail Freight
- 1.4 By Customer Type
- 1.4.1 Direct Importers and Exporters
- 1.4.2 Freight Forwarders and Consolidators
- 1.4.3 Express and Postal Operators
- 1.4.4 Cross-Border Marketplace Operators
- 1.5 By End-Use Industry
- 1.5.1 Electronics and Electrical Equipment
- 1.5.2 Automotive and Machinery
- 1.5.3 Healthcare and Chemicals
- 1.5.4 Consumer Goods and Food
- 1.5.5 Energy and Raw Materials
Chapter 2 Introduction
- 2.1 Report Objectives and Scope
- 2.2 Product Definition and Industry Terminology
- 2.3 Market Inclusions and Exclusions
- 2.4 Research Process
- 2.4.1 Primary Research and Expert Interviews
- 2.4.2 Secondary Research and Source Review
- 2.4.3 Top-Down and Bottom-Up Estimation
- 2.4.4 Data Triangulation and Verification
- 2.5 Market Size Measurement Basis
- 2.5.1 2025: USD 10.33 billion → 2035: USD 19.91 billion
- 2.6 Historical and Forecast Reference Periods
- 2.6.1 Historical Period: 2018-2025
- 2.6.2 Base Year: 2025
- 2.6.3 Forecast Period: 2025-2035
- 2.7 Research Assumptions and Limitations
Chapter 3 Executive Summary
- 3.1 Market Snapshot and Key Findings
- 3.2 Base-Year Market Size, 2025
- 3.3 Forecast Market Size, 2035
- 3.4 Revenue and Volume Growth Outlook
- 3.5 Key Demand and Supply Indicators
- 3.6 Leading Market Segments
- 3.7 Fastest-Growing Market Opportunities
- 3.8 Regional Performance Highlights
- 3.9 Technology and Industry Transformation
- 3.10 Competitive Landscape Summary
- 3.11 Analyst View and Strategic Implications
Chapter 4 Asia Pacific Customs Brokerage Market Trends and Developments
- 4.1 Historical Industry Development, 2018-2025
- 4.2 Recent Market Trends and Developments
- 4.3 Demand and Customer Behavior Trends
- 4.4 Technology and Product Innovation
- 4.5 Artificial Intelligence, Automation and Digitalization
- 4.6 Local Manufacturing and Supply Chain Realignment
- 4.7 Industry Partnerships, Mergers and Acquisitions
- 4.8 Sustainability and Circular Economy Developments
- 4.9 Government and Private Sector Investment Trends
- 4.10 Emerging Business Models and Commercialization
- 4.11 Industry Developments and Announcements
Chapter 5 Asia Pacific Customs Brokerage Market Production, Supply and Demand Analysis
- 5.1 Demand Trend and Consumption Analysis, 2018-2025
- 5.2 Demand Forecast, 2025-2035
- 5.3 Production and Output Trend, 2018-2025
- 5.4 Production and Output Forecast, 2025-2035
- 5.5 Installed Capacity and Capacity Utilization
- 5.6 Company-Wise Production Plants and Statistics
- 5.6.1 Installed Production Capacity
- 5.6.2 Actual Production
- 5.6.3 Planned Capacity and Expansion Targets
- 5.7 Supply Chain Structure and Procurement Trends
- 5.8 Supply-Demand Gap and Bottlenecks
- 5.9 Import Dependence and Sourcing Structure
- 5.10 Contract Manufacturing and Outsourcing
- 5.11 Regional Supply and Demand Concentration
Chapter 6 Asia Pacific Customs Brokerage Market Pricing Analysis
- 6.1 Pricing Structure and Measurement
- 6.2 Historical Pricing Trends, 2018-2025
- 6.3 Pricing Outlook, 2025-2035
- 6.4 Average Selling Price and Unit Economics
- 6.5 Pricing by Product and Market Segment
- 6.6 Geographic Pricing Differences
- 6.7 Key Input, Energy, Labor and Logistics Costs
- 6.8 Contract Pricing and Purchasing Models
- 6.9 Pricing Sensitivity and Competitive Positioning
- 6.10 Price, Margin and Profitability Implications
Chapter 7 Asia Pacific Customs Brokerage Market Dynamics
- 7.1 Market Growth Drivers
- 7.1.1 Demand-Side Drivers
- 7.1.2 Technology and Innovation Drivers
- 7.1.3 Infrastructure and Investment Drivers
- 7.1.4 Regulatory and Policy Drivers
- 7.2 Market Restraints
- 7.2.1 Cost and Affordability Constraints
- 7.2.2 Technology and Adoption Barriers
- 7.2.3 Supply Chain and Operational Constraints
- 7.3 Market Challenges
- 7.3.1 Competitive Pressure and Margin Erosion
- 7.3.2 Skills, Infrastructure and Implementation Gaps
- 7.4 Emerging Market Opportunities
- 7.5 Market Dynamics Impact and Time-Horizon Assessment
Chapter 8 Asia Pacific Customs Brokerage Value Chain Analysis
- 8.1 Industry Value Chain Overview
- 8.2 Upstream Suppliers and Critical Inputs
- 8.3 Technology and Component Providers
- 8.4 Manufacturing or Service Delivery
- 8.5 Distribution, Channel Partners and Integrators
- 8.6 Downstream Applications and End Users
- 8.7 Value Addition and Profit Pools
- 8.8 Vertical Integration and Outsourcing
- 8.9 Supplier Concentration and Risk
- 8.10 Supply Chain Localization and Resilience
Chapter 9 Asia Pacific Customs Brokerage Market Regulations and Policies
- 9.1 Relevant Laws, Standards and Compliance Frameworks
- 9.2 Product, Service, Safety and Quality Requirements
- 9.3 Government Policies, Incentives and Subsidies
- 9.4 Imports, Exports and Trade Barriers
- 9.5 Public Procurement and Local Content Requirements
- 9.6 Environmental and Sustainability Compliance
- 9.7 Upcoming Policy Changes and Market Implications
Chapter 10 Asia Pacific Customs Brokerage Market Hotspots and Opportunities
- 10.1 Market Opportunity Mapping and Growth Hotspots
- 10.2 High-Growth Applications and Customer Groups
- 10.3 Underserved Markets and White-Space Opportunities
- 10.4 Emerging Technology and Product Opportunities
- 10.5 New Capacity and Investment Hotspots
- 10.6 Market Entry and Expansion Opportunities
- 10.7 Distribution and Partnership Opportunities
- 10.8 Near-Term and Long-Term Commercial Potential
- 10.9 Opportunity Attractiveness and Execution Risks
Chapter 11 Asia Pacific Customs Brokerage Market Outlook, 2025-2035
- 11.1 Market Size and Analysis
- 11.1.1 Revenue (Market Measurement: 2025: USD 10.33 billion → 2035: USD 19.91 billion)
- 11.1.2 Market Volume and Quantity Sold
- 11.1.3 Historical Market Size, 2018-2025
- 11.1.4 Base-Year Market Size, 2025
- 11.2 Market Forecast, 2025-2035
- 11.2.1 Revenue Forecast to 2035
- 11.2.2 Volume Forecast to 2035
- 11.2.3 CAGR and Year-on-Year Growth
- 11.2.4 Incremental Revenue Opportunity
- 11.3 Forecast Assumptions and Scenario Analysis
- 11.3.1 Base-Case Forecast
- 11.3.2 Optimistic and Conservative Scenarios
- 11.3.3 Technology, Pricing and Policy Sensitivities
- 11.4 Market Attractiveness and Growth Outlook
Chapter 12 Asia Pacific Customs Brokerage Market Segmentation and Outlook
- 12.1 Segmentation Summary and Market Shares, 2025
- 12.2 Largest and Fastest-Growing Segments
- 12.3 By Service Type - Market Size and Forecast, 2025-2035
- 12.3.1 Segment Definition and Scope
- 12.3.2 Historical Market Size, 2018-2025
- 12.3.3 Revenue Forecast, 2025-2035
- 12.3.4 Volume Forecast, 2025-2035
- 12.3.5 Base-Year Market Share, 2025
- 12.3.6 Segment CAGR and Growth Drivers
- 12.3.7 Subsegment Market Size and Forecast
- 12.3.7.1 Customs Clearance
- 12.3.7.2 Documentation and Compliance
- 12.3.7.3 Tariff Advisory
- 12.3.7.4 Permit Management
- 12.3.7.5 Post-Entry and Extended Compliance
- 12.3.8 Subsegment Pricing and Adoption Trends
- 12.3.9 Leading Suppliers and Competition
- 12.3.10 Regional Demand and Opportunities
- 12.4 By Mode of Transport - Market Size and Forecast, 2025-2035
- 12.4.1 Segment Definition and Scope
- 12.4.2 Historical Market Size, 2018-2025
- 12.4.3 Revenue Forecast, 2025-2035
- 12.4.4 Volume Forecast, 2025-2035
- 12.4.5 Base-Year Market Share, 2025
- 12.4.6 Segment CAGR and Growth Drivers
- 12.4.7 Subsegment Market Size and Forecast
- 12.4.7.1 Ocean Freight
- 12.4.7.2 Air Freight
- 12.4.7.3 Road Freight
- 12.4.7.4 Rail Freight
- 12.4.8 Subsegment Pricing and Adoption Trends
- 12.4.9 Leading Suppliers and Competition
- 12.4.10 Regional Demand and Opportunities
- 12.5 By Customer Type - Market Size and Forecast, 2025-2035
- 12.5.1 Segment Definition and Scope
- 12.5.2 Historical Market Size, 2018-2025
- 12.5.3 Revenue Forecast, 2025-2035
- 12.5.4 Volume Forecast, 2025-2035
- 12.5.5 Base-Year Market Share, 2025
- 12.5.6 Segment CAGR and Growth Drivers
- 12.5.7 Subsegment Market Size and Forecast
- 12.5.7.1 Direct Importers and Exporters
- 12.5.7.2 Freight Forwarders and Consolidators
- 12.5.7.3 Express and Postal Operators
- 12.5.7.4 Cross-Border Marketplace Operators
- 12.5.8 Subsegment Pricing and Adoption Trends
- 12.5.9 Leading Suppliers and Competition
- 12.5.10 Regional Demand and Opportunities
- 12.6 By End-Use Industry - Market Size and Forecast, 2025-2035
- 12.6.1 Segment Definition and Scope
- 12.6.2 Historical Market Size, 2018-2025
- 12.6.3 Revenue Forecast, 2025-2035
- 12.6.4 Volume Forecast, 2025-2035
- 12.6.5 Base-Year Market Share, 2025
- 12.6.6 Segment CAGR and Growth Drivers
- 12.6.7 Subsegment Market Size and Forecast
- 12.6.7.1 Electronics and Electrical Equipment
- 12.6.7.2 Automotive and Machinery
- 12.6.7.3 Healthcare and Chemicals
- 12.6.7.4 Consumer Goods and Food
- 12.6.7.5 Energy and Raw Materials
- 12.6.8 Subsegment Pricing and Adoption Trends
- 12.6.9 Leading Suppliers and Competition
- 12.6.10 Regional Demand and Opportunities
- 12.7 Segment Growth Comparison
- 12.8 Segment Attractiveness and Priority Matrix
Chapter 13 Asia Pacific Customs Brokerage End-Use and Application Market Outlook
- 13.1 End-Use Industry and Customer Demand Structure
- 13.2 Leading Applications and Customer Groups
- 13.3 End-Use Market Size, Share and Forecast
- 13.4 Major End-Use Industry Deep Dives
- 13.4.1 Customer Requirements and Use Cases
- 13.4.2 Demand and Replacement Cycles
- 13.4.3 Technical and Regulatory Considerations
- 13.4.4 Purchasing and Procurement Models
- 13.4.5 Leading Vendors and Distribution Channels
- 13.4.6 Forecast and Commercial Opportunities
- 13.5 Emerging Applications and Cross-Segment Demand
- 13.6 End-Use Industry Investment Priorities
Chapter 14 Asia Pacific Customs Brokerage Geographic Market Outlook, 2025-2035
- 14.1 Regional Market Size and Country-Level Shares, 2025
- 14.2 Country Market Size Comparison, 2025
- 14.3 Country Market Forecasts, 2025-2035
- 14.4 Subregional Industrial and Demand Clusters
- 14.5 Intra-Regional Pricing and Cost Differences
- 14.6 Cross-Border Trade and Supply Networks
- 14.7 Regional Supply and Demand Balances
- 14.8 Country Opportunity Comparison and Prioritization
Note: Every listed country is covered on the structure shown under the first country.
Chapter 15 Asia Pacific Customs Brokerage Technology, Innovation and Sustainability Outlook
- 15.1 Technology Landscape and Maturity
- 15.2 Product, Process and Service Innovation
- 15.3 AI, Automation and Digital Tools in the Industry
- 15.4 Technology Adoption and Performance Benchmarking
- 15.5 Innovation Pipeline and R&D Investment
- 15.6 Patent and Intellectual Property Trends
- 15.7 Energy Efficiency and Resource Management
- 15.8 Sustainability, Recycling and Circularity
- 15.9 Technology Roadmap, 2025-2035
- 15.10 Risks of Obsolescence and Technology Substitution
Chapter 16 Asia Pacific Customs Brokerage Market Key Strategic Imperatives
- 16.1 Growth and Market Entry Priorities
- 16.2 High-Return Products and Segments
- 16.3 Pricing, Profitability and Cost Optimization
- 16.4 Technology Investment and Product Differentiation
- 16.5 Supply Chain Localization and Resilience
- 16.6 Distribution and Customer Acquisition
- 16.7 Partnership, Acquisition and Capacity Strategy
- 16.8 Regional Expansion Priorities
- 16.9 Short-, Medium- and Long-Term Actions
Chapter 17 Competition Outlook
- 17.1 Industry Competition Characteristics
- 17.2 Market Structure and Concentration
- 17.3 Market Share and Competitive Positioning, 2025
- 17.4 Company-Wise Revenue and Product Benchmarking
- 17.5 Production and Service Capacity Benchmarking
- 17.6 Technology, Pricing and Differentiation
- 17.7 Regional Footprint and Distribution Strength
- 17.8 Mergers, Acquisitions and Strategic Alliances
- 17.9 New Entrants and Competitive Threats
- 17.10 Porter's Five Forces and Industry Attractiveness
- 17.11 Competitive Outlook, 2025-2035
Chapter 18 Company Profiles
- 18.1 Company Coverage and Selection Criteria
- 18.2 Sinotrans
- 18.2.1 Business Description
- 18.2.2 Company Ownership and Geographic Presence
- 18.2.3 Product and Service Portfolio
- 18.2.4 Manufacturing and Operating Footprint
- 18.2.5 Production Capacity and Expansion Plans
- 18.2.6 Financial Performance and Investment
- 18.2.7 Market Share and Competitive Position
- 18.2.8 Technology and Innovation Capabilities
- 18.2.9 Strategic Alliances or Partnerships
- 18.2.10 Recent Developments
- 18.2.11 Growth Strategy and Outlook
- 18.3 DHL Group
- 18.4 Nippon Express
- 18.5 Expeditors International
- 18.6 Kuehne+Nagel
- 18.7 Other Relevant Market Participants
Note: Every listed company is profiled on the structure shown under the first company. The company list is preliminary and may change based on research findings, market developments, data availability and client requirements.
Chapter 19 Disclaimer
- 19.1 Research and Forecast Disclaimer
- 19.2 Data Source and Estimation Limitations
Note: The depth of individual sections depends on data availability for this market. Volume, capacity, trade and other unit-based metrics are included where applicable.

