Market Overview
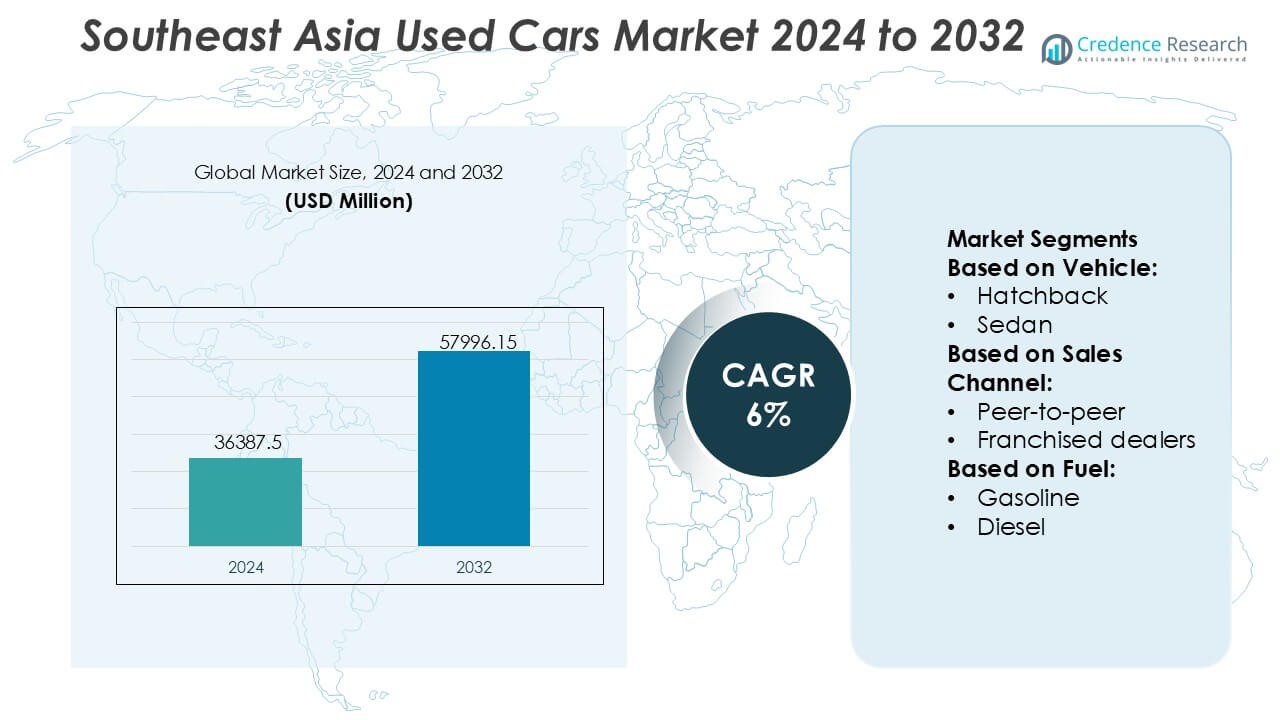
Southeast Asia Used Cars Market size was valued USD 36387.5 million in 2024 and is anticipated to reach USD 57996.15 million by 2032, at a CAGR of 6% during the forecast period.
| REPORT ATTRIBUTE |
DETAILS |
| Historical Period |
2020-2023 |
| Base Year |
2024 |
| Forecast Period |
2025-2032 |
| Southeast Asia Used Cars Market Size 2024 |
USD 36387.5 Million |
| Southeast Asia Used Cars Market, CAGR |
6% |
| Southeast Asia Used Cars Market Size 2032 |
USD 57996.15 Million |
The Southeast Asia Used Cars Market is shaped by a mix of organized dealerships, digital marketplaces, and certified pre-owned programs that strengthen transparency and elevate buyer confidence across major urban centers. Leading platform operators and large multi-brand dealer networks compete by offering AI-enabled valuation tools, verified service histories, financing support, and standardized refurbishment processes that appeal to value-driven consumers. Consolidation among professional sellers continues as digital penetration accelerates. Indonesia stands as the dominant regional market with an exact 38% share, supported by its large vehicle parc, rising middle-income population, and strong adoption of online used-car trading ecosystems.
Access crucial information at unmatched prices!
Request your sample report today & start making informed decisions powered by Credence Research Inc.!
Download Sample
Market Insights
- The market was valued at USD 36,387.5 million in 2024 and is projected to reach USD 57,996.15 million by 2032, advancing at a 6% CAGR, reflecting strong demand for affordable mobility solutions across Southeast Asia.
- Market drivers include rapid digital adoption, expansion of certified pre-owned programs, and rising availability of financing options that strengthen trust and enable broader consumer participation.
- Key trends highlight accelerated consolidation among organized dealers, deeper integration of AI-driven valuation tools, and growing interest in electric and hybrid used vehicles as ownership patterns evolve.
- Competitive dynamics intensify as multi-brand networks and online platforms differentiate through inspection quality, warranty-backed offerings, and transparent documentation, reducing the influence of informal sellers.
- Regional analysis shows Indonesia leading with a 38% share, supported by high vehicle parc and strong online trading activity, while sedans and SUVs remain the most traded segments across the region.
Market Segmentation Analysis:
By Vehicle
The vehicle mix in the Southeast Asia Used Cars Market is led by SUVs, holding a dominant 46% market share, driven by rising preference for higher ground clearance, flexible seating layouts, and improved safety profiles that suit varied road conditions across Indonesia, Thailand, and the Philippines. Sedans maintain steady demand among city commuters seeking affordability and fuel efficiency, while hatchbacks attract first-time buyers due to lower acquisition costs and compact dimensions ideal for dense urban environments. Growing availability of certified pre-owned SUV inventories and competitive financing further accelerates segment leadership.
- For instance, Hyundai Motor India’s Creta equipped with 6 airbags and an advanced chassis tuned through over 1,000 km of multi-terrain testing demonstrates how robust engineering enhances SUV desirability in the secondary market.
By Sales Channel
Independent dealers represent the leading sales channel with an exact 52% share, supported by their extensive on-ground networks, flexible pricing, and wider inventory covering multiple budget categories. Peer-to-peer transactions remain active but face challenges around inspection transparency and post-sale accountability, prompting more consumers to shift toward structured retail environments. Franchised dealers gain momentum through certified pre-owned programs that offer warranties, standardized refurbishment, and digital vehicle history reporting. Expanding multi-brand dealer groups and improved digital listings reinforce the dominance of independent dealers across metropolitan and semi-urban markets.
- For instance, Mercedes-Benz’s “Certified Pre-Owned” program uses its 165-point inspection protocol and official diagnostic systems (such as the STAR Diagnosis or XENTRY Systems), which perform extensive electronic checks to validate engine, transmission, and safety components, reinforcing trust and quality assurance.
By Fuel
The fuel mix is dominated by gasoline-powered used cars, holding 58% market share, driven by their lower maintenance requirements, abundant service centers, and wide availability across all pricing tiers. Diesel vehicles retain relevance among commercial users and high-mileage drivers but face declining momentum as emission norms tighten. Electric and BEV models record accelerating interest, supported by government incentives and rising imports of retired fleet EVs from neighboring markets; however, limited charging infrastructure and higher battery replacement costs constrain large-scale adoption. Gasoline vehicles thus remain the most accessible and trusted option for value-driven buyers.
Key Growth Drivers
Expanding Digital Marketplaces and Transparent Online Transactions
Digital retailing accelerates market expansion as buyers increasingly rely on online platforms that offer verified listings, transparent pricing, and vehicle history checks. E-commerce ecosystems strengthen trust through inspection reports, financing tools, and doorstep deliveries, reducing friction traditionally linked to used-car purchasing. Growing smartphone penetration and payment digitization widen customer access, especially in urban centers. Platforms integrating AI-based price benchmarking and fraud-detection systems further streamline decision-making. These developments collectively enhance transaction efficiency and expand the reach of professional sellers across Southeast Asia’s fragmented automotive landscape.
- For instance, Kia Connect, powers over 70 smart-car features such as remote engine start/stop, tyre-pressure monitoring, remote AC control, remote door lock/unlock, fuel-level monitoring, and remote vehicle status alerts enhancing post-sale transparency for used-car buyers.
Rising Affordability and Strong Value Proposition of Pre-Owned Vehicles
Consumers prioritize cost-effective mobility solutions amid inflationary pressures, rising interest rates, and higher new-vehicle ownership costs. Used cars provide an attractive alternative, offering lower depreciation, reduced upfront payments, and broader model choices across budget brackets. Improved quality of pre-owned vehicles supported by certified refurbishment programs boosts buyer confidence and increases repeat purchases. Expanding financing penetration for older vehicles enables first-time buyers, young professionals, and families to access dependable mobility. This value-oriented purchasing behavior continues to strengthen the preference for pre-owned vehicles across Southeast Asia’s price-sensitive markets.
- For instance, BMW AG’s Premium Selection program applies a standardized 360-degree technical inspection covering more than 100 mechanical and electronic checkpoints and includes service history verification backed by BMW’s digital diagnostics system, ISTA, which runs over 1,000 fault-memory evaluation routines to ensure vehicle integrity.
Growing Supply from Leasing Returns and Ride-Hailing Fleets
Fleet rotation cycles among leasing companies, corporate mobility providers, and ride-hailing operators inject a steady supply of vehicles into the used-car ecosystem. These units typically undergo rigorous maintenance schedules, improving their resale appeal and enabling organized players to build large, standardized inventories. Shorter replacement cycles often three to four years ensure consistent availability of relatively new models equipped with modern features. As mobility service operators expand in major SEA cities, the secondary flow of well-maintained fleet vehicles provides a reliable pipeline that stabilizes supply and supports competitive pricing.
Key Trends & Opportunities
Rapid Growth of Certified Pre-Owned (CPO) Programs
CPO programs gain widespread traction as buyers prefer professionally reconditioned vehicles backed by warranty extensions, inspection points, and guaranteed service records. Automakers and large dealer groups expand their certified portfolios to differentiate from informal sellers and build long-term brand trust. Enhanced refurbishment standards, digital service logs, and bundled insurance offerings strengthen appeal among middle-income customers seeking reliability at lower cost. The rise of CPO formats presents opportunities to standardize quality, elevate customer experience, and boost margins for organized market participants across the region.
- For instance, Honda Cars India Limited’s “Honda Certified” program mandates a Honda-standard 182-point inspection, covering key areas like engine condition, ECU diagnostics, suspension components, and emissions verification.
Increasing Adoption of Electric and Hybrid Used Vehicles
Demand for electrified used vehicles rises as governments support EV adoption through tax incentives, charging infrastructure expansion, and lower ownership costs. As first-generation EV owners in urban hubs upgrade, more pre-owned battery electric and hybrid models enter the secondary market. Buyers attracted to reduced fuel expenses and lower maintenance requirements increasingly evaluate EVs as viable alternatives to conventional vehicles. This shift presents opportunities for dealers specializing in battery assessments, refurbishments, and bundled charging solutions, enabling new revenue streams within the evolving used-car landscape.
- For instance, Suzuki’s global EV development program, validated through its production model the e-Vitara, integrates a high-capacity lithium-ion battery pack (such as the 61 kWh option composed of 120 cells) engineered to deliver a peak motor output of up to 128 kW (172 bhp) in the FWD variant.
Integration of AI, Data Analytics, and Predictive Valuation Tools
AI-driven valuation tools transform pricing transparency by using real-time market data, historical depreciation patterns, and condition metrics to estimate fair-market values with higher accuracy. Dealers utilize predictive analytics to optimize inventory turnover, anticipate demand fluctuations, and identify high-value trade-in segments. Automated inspection solutions using computer vision enhance grading consistency and reduce subjective assessments. These technological improvements streamline operations, accelerate decision-making, and stimulate trust among digital consumers, creating significant opportunities for platform providers and organized players to scale efficiently.
Key Challenges
Market Fragmentation and Dominance of Informal Selling Channels
The coexistence of informal dealers, peer-to-peer networks, and small used-car lots limits standardization and transparency across the SEA market. Many unorganized sellers lack consistent quality checks, documented service histories, or regulated pricing, which complicates trust-building efforts for organized players. This fragmentation restricts scalability of certified programs and creates pricing disparities across regions. As consumers continue to rely heavily on informal channels due to familiarity and lower perceived markups, organized platforms face challenges in maintaining uniform service levels and expanding market penetration.
Limited Availability of High-Quality, Low-Mileage Used Vehicles
Supply constraints affect growth as the regional market struggles to secure sufficient volumes of well-maintained, low-mileage vehicles that meet rising buyer expectations. Extended ownership cycles, economic uncertainty, and slower new-car sales reduce the number of recent-model vehicles entering the secondary market. Poor maintenance documentation and inconsistent servicing further affect resale quality. These limitations force buyers to compromise on model year, features, or condition, weakening conversion rates for organized dealers and elevating competition for premium trade-ins.
Regional Analysis
North America
North America holds an estimated 8% share of Southeast Asia’s used-car inflow and trade-linked activity, influenced by exports of pre-owned vehicles and digital platform partnerships supporting cross-border remarketing. Strong inventory rotation cycles in the U.S. and Canada create steady supply channels for select models favored in Southeast Asia, particularly SUVs and mid-size sedans. Collaboration between remarketing firms and Southeast Asian distributors enhances quality standards and inspection protocols. Although the region does not directly participate as a consumer market, its contribution to supply, technology transfer, and digital valuation tools indirectly supports SEA market modernization.
Europe
Europe represents around 10% of the extended ecosystem impact, driven by the export of diesel vehicles, premium brands, and certified fleet units into Southeast Asian markets. EU-origin cars benefit from established maintenance records and high refurbishment quality, making them attractive in urban consumer clusters. European inspection methodologies and warranty-driven resale practices influence SEA’s shift toward certified pre-owned formats. Sustainability-focused policies in the EU accelerate fleet renewal cycles, increasing secondary availability. These dynamics contribute to a stream of high-quality used vehicles and best-practice standards that positively shape Southeast Asia’s evolving used-car framework.
Asia-Pacific
Asia-Pacific outside Southeast Asia holds the largest influence at roughly 60%, driven by strong trade corridors, high vehicle circulation, and rapid digital adoption across major markets such as Japan, South Korea, and China. Japan remains a key origin for refurbished, low-mileage used cars exported into Southeast Asia, supported by strict Shaken regulations. South Korea contributes through rapidly expanding certified programs and technologically advanced listings. China’s digital platforms and EV ecosystem influence SEA’s online penetration and electrified used-car adoption. These interconnected flows position the broader Asia-Pacific region as the most influential external contributor.
Latin America
Latin America accounts for nearly 5% of the ecosystem’s indirect influence, primarily through parallel market learnings in certified refurbishment, dealer consolidation models, and digital retail adoption. Markets such as Brazil and Mexico demonstrate strong success in peer-to-peer digital listings and algorithmic price-benchmarking systems, offering replicable frameworks for Southeast Asia. While trade volumes between regions remain limited, the operational strategies of Latin American used-car aggregators provide insights into managing fragmented dealer networks and improving consumer trust. These parallels support SEA stakeholders in refining certification standards and expanding organized retail penetration.
Middle East & Africa
The Middle East & Africa region represents about 7% of the extended market influence, supported by well-established re-export hubs such as the UAE, which serve as redistribution centers for pre-owned vehicles moving toward emerging Asian markets. High turnover of SUVs and luxury vehicles improves supply quality for SEA importers seeking differentiated inventory. Digital auction platforms in the UAE and South Africa also provide scalable models for transparent bidding, inspection scoring, and logistics integration. As SEA markets formalize, these practices offer valuable operational templates for enhancing inventory management and dealer efficiency.
Market Segmentations:
By Vehicle:
By Sales Channel:
- Peer-to-peer
- Franchised dealers
By Fuel:
By Geography
- North America
- Europe
- Asia Pacific
- Latin America
- Middle East
- Africa
Competitive Landscape
The competitive landscape of the Southeast Asia Used Cars Market players such as Hyundai Motor India, Mercedes-Benz, Ford Motor Company, Kia India Pvt. Limited, BMW AG, Honda Cars India Limited, Suzuki, General Motors, Nissan Motor Co., Ltd., and AUDI AG. the Southeast Asia Used Cars Market is defined by the expanding presence of organized dealerships, digital marketplaces, and certified pre-owned programs that elevate transparency and trust across the region. Platforms enhance competitiveness through standardized inspections, verified service histories, and AI-driven valuation tools that address long-standing concerns around pricing accuracy and vehicle condition. Financing partnerships with banks and fintech firms broaden access for first-time buyers, while warranty-backed offerings help organized players differentiate from informal sellers. Rapid adoption of online listing ecosystems, cross-border inventory sourcing, and fleet-driven supply channels further intensify competition, supporting a more structured and scalable market environment.
Shape Your Report to Specific Countries or Regions & Enjoy 30% Off!
Key Player Analysis
- Hyundai Motor India
- Mercedes-Benz
- Ford Motor Company
- Kia India Pvt. Limited.
- BMW AG
- Honda Cars India Limited
- Suzuki
- General Motors
- Nissan Motor Co., Ltd.
- AUDI AG
Recent Developments
- In September 2025, Hyundai Capital launched its Indonesian auto financing arm, Hyundai Finance, in partnership with Indonesian conglomerate Sinar Mas and Bank Shinhan Indonesia, aiming to boost Hyundai sales in Indonesia by offering tailored, digital financing for new and used vehicles, strengthening their market presence beyond initial acquisition efforts.
- In June 2025, Scheme to Promote Manufacturing of Electric Passenger Cars in India (SPMEPCI) by the Ministry of Heavy Industries (MHI). To increase the proposals from various renowned companies and enhance the electric vehicle (EV) manufacturing ecosystem of India by increasing the investments will be the aim of this scheme.
- In June 2025, Francisco Motors (FMC) signed a landmark agreement to export electric passenger vehicles, including e-jeepneys and hydrogen fuel cell-powered tricycles, to Nigeria. This venture is considered a significant milestone for the Philippines’ green technology export ambitions.
- In April 2025, CARSOME Group consolidated its cloud infrastructure with Google Cloud and Searce, enhancing data analytics and AI-driven innovation capabilities to optimize car transaction experiences across Malaysia, Indonesia, Thailand, and Singapore.
Report Coverage
The research report offers an in-depth analysis based on Vehicle,Sales Channel, Fuel and Geography. It details leading market players, providing an overview of their business, product offerings, investments, revenue streams, and key applications. Additionally, the report includes insights into the competitive environment, SWOT analysis, current market trends, as well as the primary drivers and constraints. Furthermore, it discusses various factors that have driven market expansion in recent years. The report also explores market dynamics, regulatory scenarios, and technological advancements that are shaping the industry. It assesses the impact of external factors and global economic changes on market growth. Lastly, it provides strategic recommendations for new entrants and established companies to navigate the complexities of the market.
Future Outlook
- The market will strengthen its shift toward digital-first used-car transactions supported by AI-driven pricing and automated inspections.
- Certified pre-owned programs will expand across major cities as buyers increasingly demand warranty-backed and quality-assured vehicles.
- Electrified used vehicles will gain traction as more hybrid and EV models enter the secondary market from fleet and first-owner upgrades.
- Financing penetration will rise as banks and fintech companies introduce tailored credit products for older vehicles.
- Organized dealers will consolidate market share by improving refurbishment capabilities and expanding multi-brand networks.
- Cross-border sourcing of low-mileage vehicles will increase to address supply shortages in high-demand segments.
- Predictive analytics will shape inventory planning and streamline dealer operations for faster turnover.
- Ride-hailing and leasing companies will contribute a steady pipeline of well-maintained used vehicles.
- Consumer trust will improve through transparent service logs, digital documentation, and standardized rating systems.
- Sustainability considerations will encourage longer vehicle life cycles and promote interest in fuel-efficient and low-emission models.


