
Asia Pacific barium fluoride demand rests on China supply
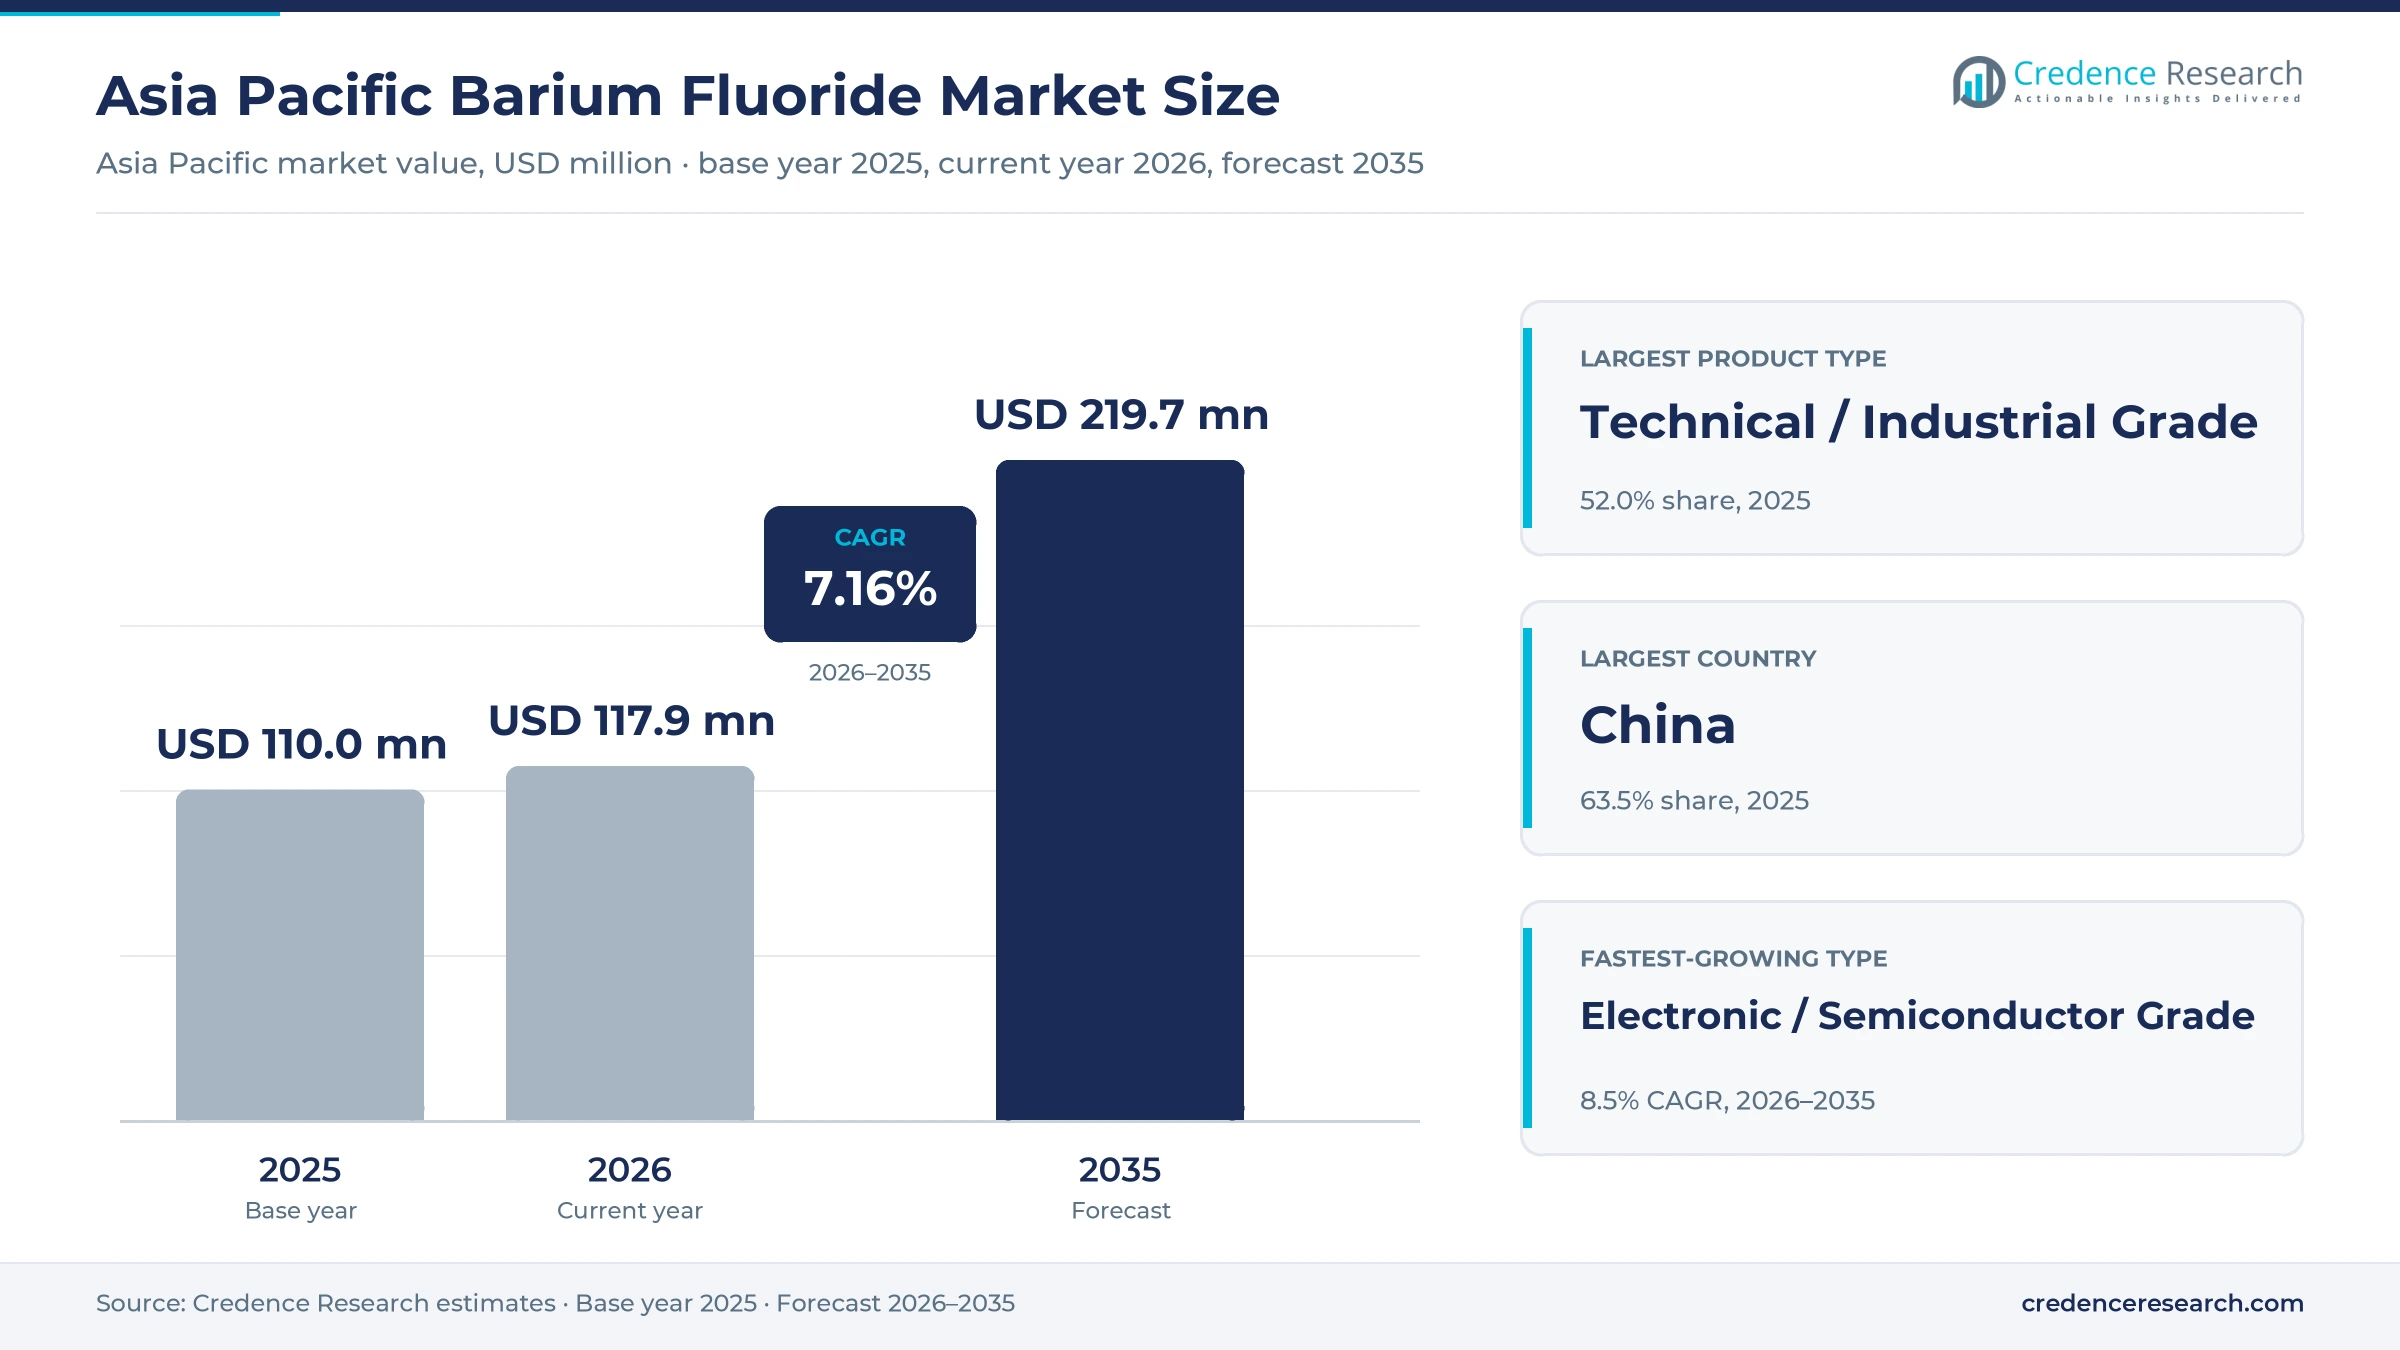
The Asia Pacific barium fluoride market was valued at USD 110.0 million in 2025 and is projected to increase from USD 117.9 million in 2026 to USD 219.7 million by 2035, registering a CAGR of 7.16% during 2026–2035. Demand comes from metal processors that add the compound to aluminum refining fluxes and welding coatings, from glass and ceramic makers, and from optics and detector makers that need crystals clear from the ultraviolet to the long-wave infrared. China held the largest country share, 63.5% in 2025, because it mines most of the region's fluorspar and hosts the largest metal and crystal industries. South Korea and Taiwan is the fastest-growing area at 7.9% a year, as chip and display investment lifts demand for high-purity grades. Supply conditions are also changing, since Chinese mine checks and rising fluorspar imports have raised the cost of the main fluorine input for every producer in the region.
Which grades and forms of the compound are counted here?
The market counts barium fluoride sold in Asia Pacific as technical powder, optical and high-purity powder, electronic grade material, single crystals, cut blanks, windows and evaporation granules. Buyers are metal and glass processors, optical and electronic manufacturers, and research and public procurement buyers, which purchase through producer contracts, specialty distributors and catalogs.
The estimate excludes finished infrared cameras, detector modules and coated lenses, where the compound is only a small part of the bill of materials. Upstream fluorspar, hydrofluoric acid and barium carbonate are also excluded, so value is counted at the first sale of the fluoride itself.
Asia Pacific Barium Fluoride Market Insights
- The market grows from USD 110.0 million in 2025 to USD 219.7 million by 2035, a 7.16% pace driven by high-purity, electronic and crystal grades rather than by tonnage.
- China held 63.5% of 2025 value, while South Korea and Taiwan grows fastest at 7.9% a year on chip-plant investment.
- Technical / Industrial Grade held 52.0% of 2025 value, while Electronic / Semiconductor Grade grows fastest at 8.5% a year.
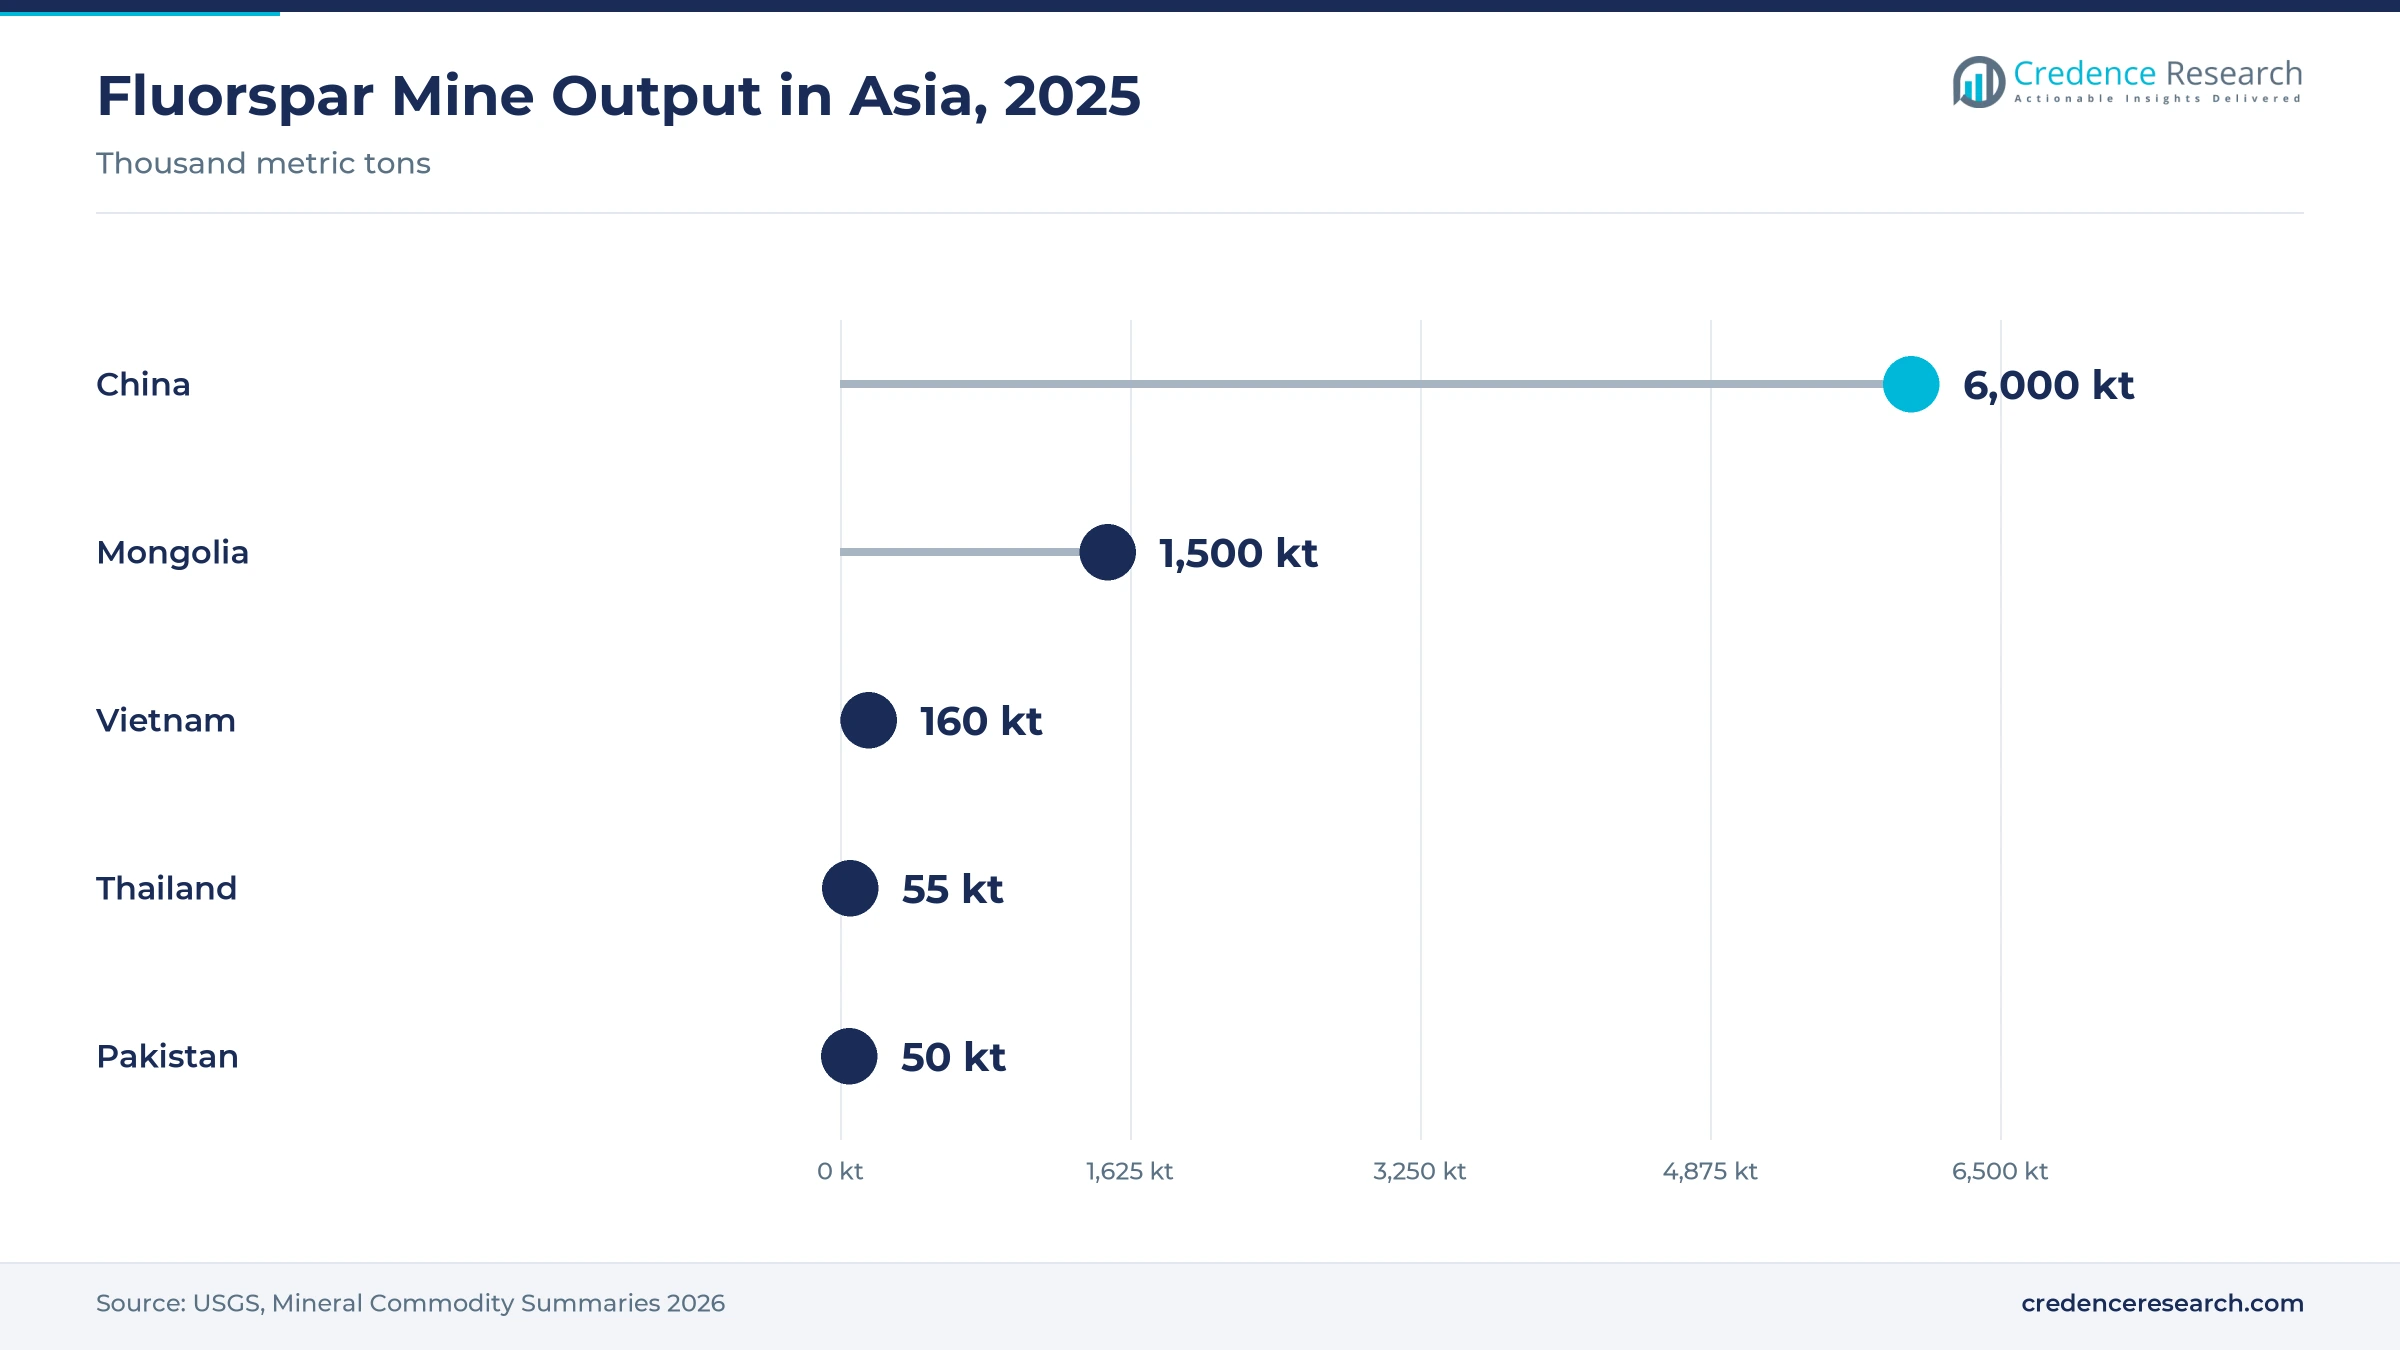
- China mined about 6.0 million tons of fluorspar in 2025, roughly 60% of world output, yet still raised imports 48% in the first half.
- Stella Chemifa, Morita Chemical Industries and Canon Optron lead Japanese supply, while Vital Materials and UM Optics anchor Chinese supply.
Industrial grade leads as electronic grades grow fastest
Why does industrial grade lead while electronic grade grows fastest?
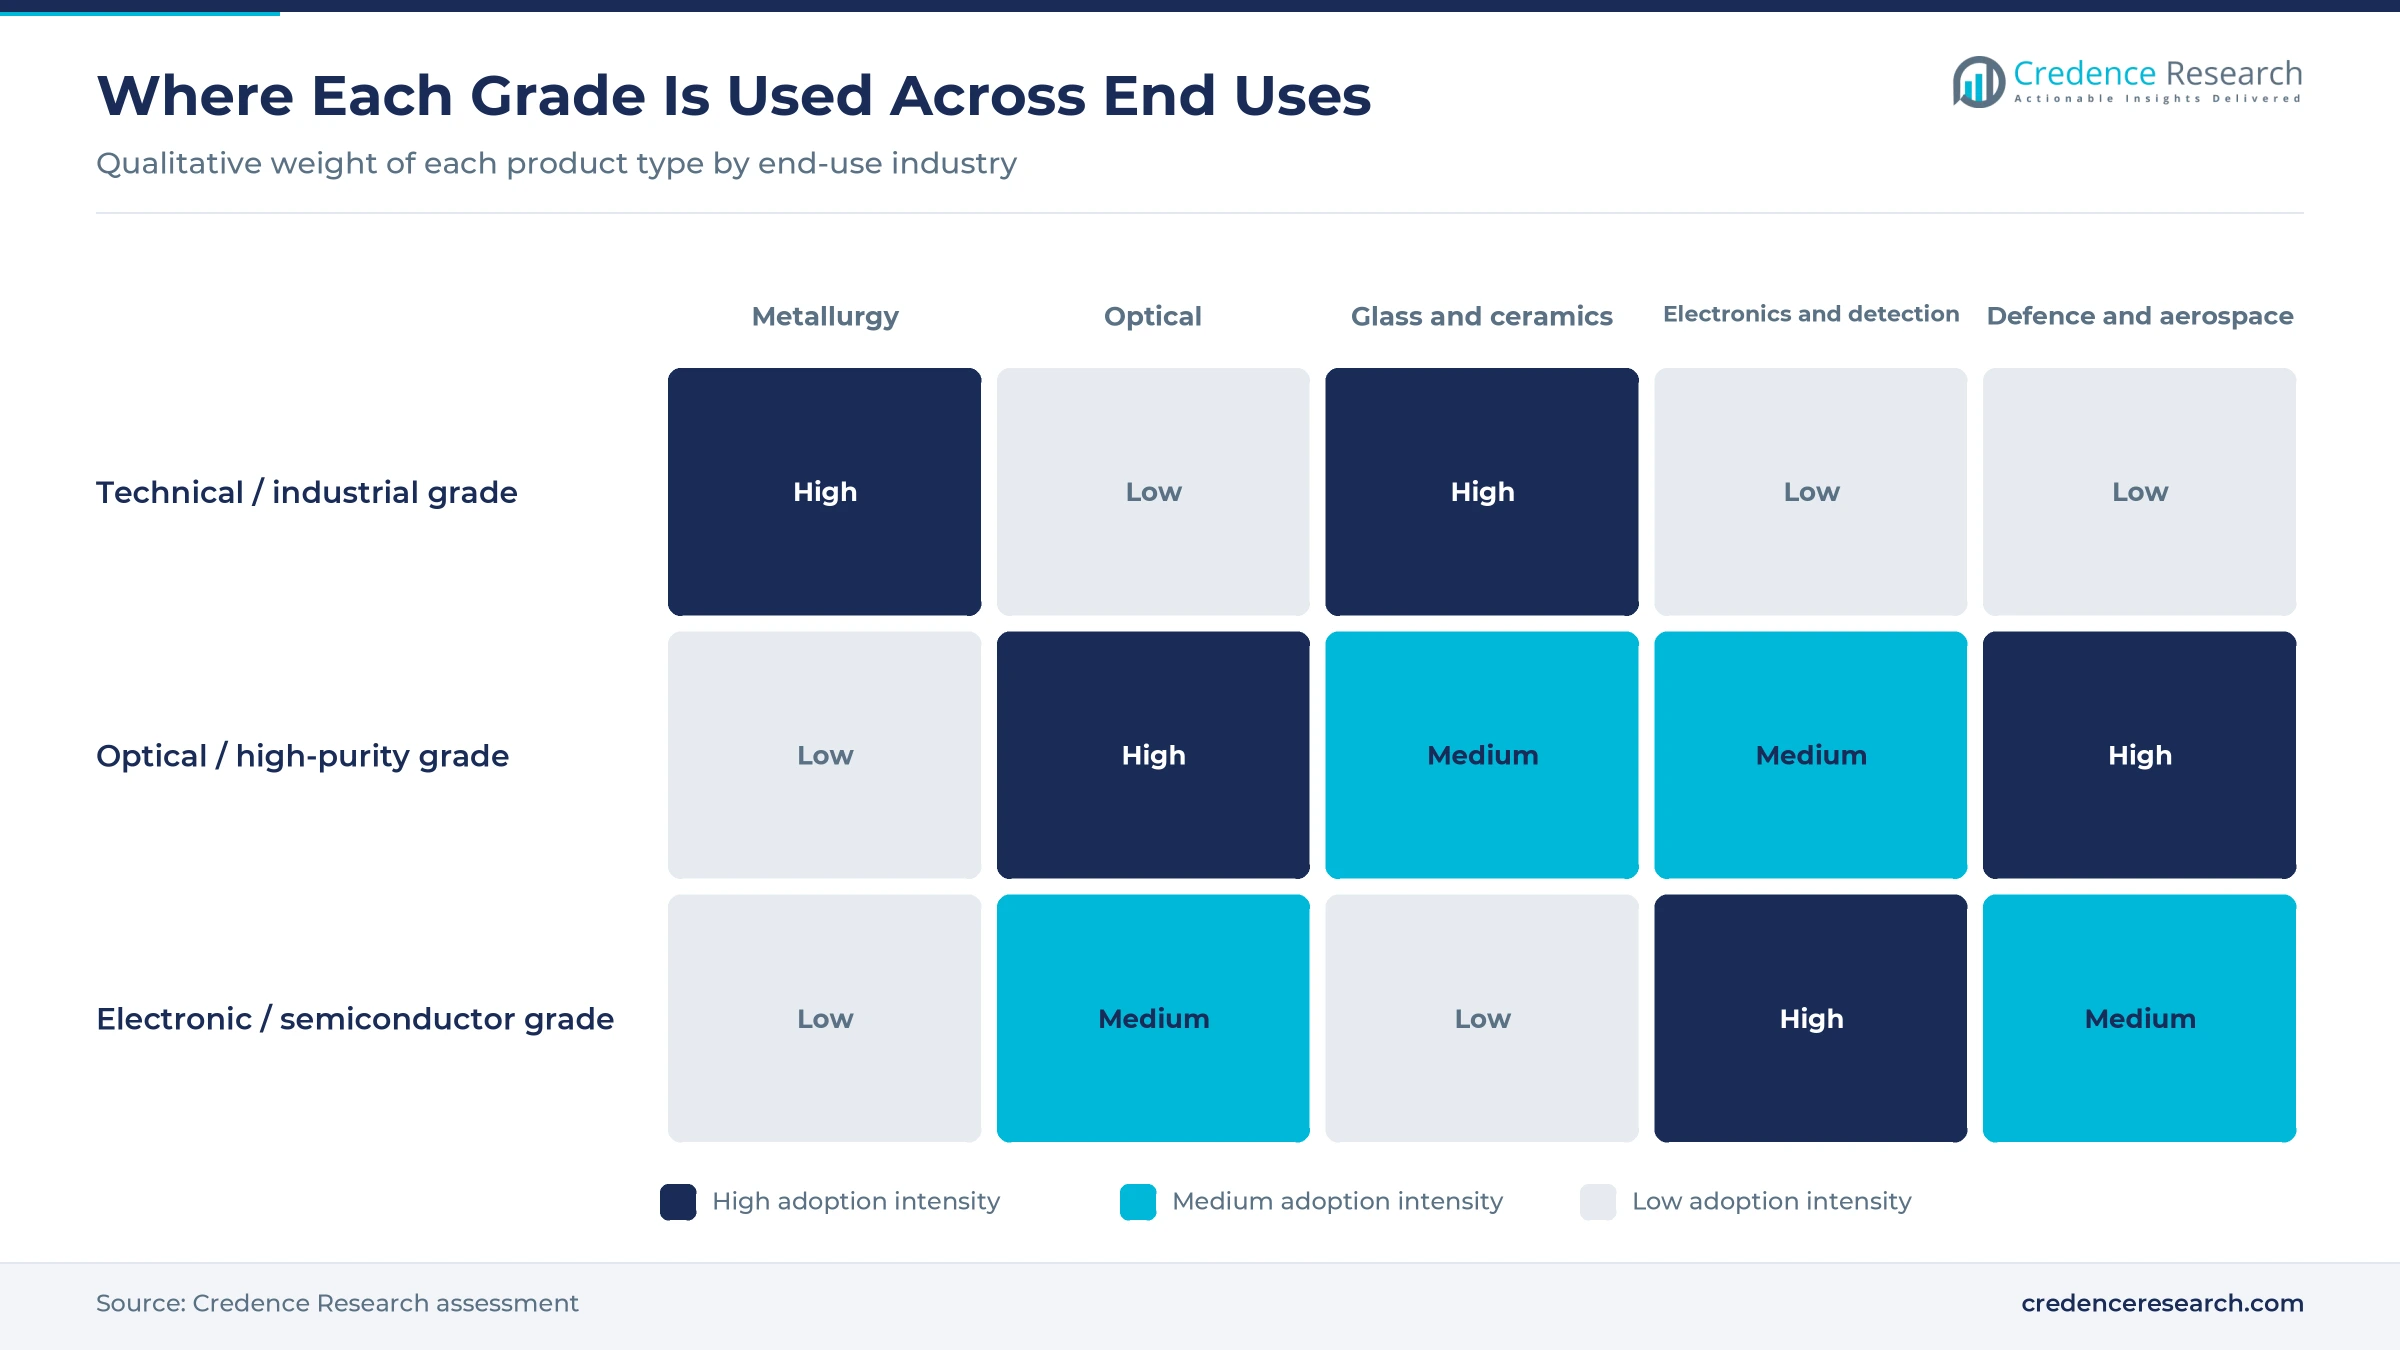
Based on product type, the market is categorized into technical / industrial grade, optical / high-purity grade and electronic / semiconductor grade. Technical / Industrial Grade led with 52.0% of 2025 value because the bulk tonnage goes into metallurgy and enamel, and Solvay lists aluminum refining, welding rod coatings and enamel frits as its main uses. Electronic / Semiconductor Grade grows fastest at 8.5% a year as fab investment rises, and SEMI reports that equipment spending in Taiwan rose 90% to a record USD 31.5 billion in 2025. Electronic buyers pay for trace-metal limits, so this small grade carries far more value per kilogram.
Why does metallurgy lead while detection systems grow fastest?
Based on end-use industry, the market is categorized into metallurgy, optical and optoelectronic manufacturing, glass and ceramics, electronics and detection systems, and defense and aerospace. Metallurgy led with 34.0% of 2025 value because China's primary aluminum output rose 2.4% in 2025 and passed the 45 million ton capacity cap, according to the National Bureau of Statistics. Electronics and Detection Systems grow fastest at 8.3% a year because fast-timing physics calorimeters, such as the Mu2e-II design described in the trends section, specify the crystal for the sub-nanosecond light needed in scintillation detectors.
Why does conventional processing lead while crystal growth grows fastest?
Based on technology, the market is categorized into conventional chemical processing, high-purity chemical processing and crystal growth and finishing. Conventional Chemical Processing led with 55.0% of 2025 value because precipitation from fluorine and barium salts serves the tonnage grades, and Hefei TNJ Chemical lists material at 99.0% assay in 25 kg cartons. Crystal Growth and Finishing grows fastest at 8.4% a year because detector and infrared optics buyers pay for grown, polished blanks and Canon Optron says the crystal transmits to 13 micrometers, the longest range of any fluoride crystal. Each grown and polished boule adds far more value than powder.
| Segment Group | Leading Sub-segment | Share, 2025 | Fastest-growing Sub-segment | CAGR, 2026–2035 |
|---|---|---|---|---|
| By Product Type | Technical / Industrial Grade | 52.0% | Electronic / Semiconductor Grade | 8.5% |
| By End-Use Industry | Metallurgy | 34.0% | Electronics and Detection Systems | 8.3% |
| By Technology | Conventional Chemical Processing | 55.0% | Crystal Growth and Finishing | 8.4% |
Purity and form multiply the price per kilogram
Pricing works per kilogram for bulk powder and per piece or per gram for crystals, catalog chemicals and coating granules. The spread is very wide, because a 25 g bottle of 99.95% material lists at roughly 1,000 times the per-kilogram cost of bulk technical grade. Fluorspar is the main input that moves bulk prices, and USGS data show the acid-grade unit value rising every year since 2021. Crystal prices follow growth yield and polishing labor rather than raw material. Suppliers that can move customers from technical powder into qualified optical or electronic grades capture most of the margin.
| Grade or form | Typical price or fee | Basis |
|---|---|---|
| Technical grade powder, 98-99% assay, 25 kg bags | About USD 2-4 per kg | Credence Research estimate from Chinese producer listings and fluorspar input costs |
| Reagent grade 99.9%, 25 g | USD 149.65 online offer, list USD 176 | Thermo Scientific Chemicals Japan catalog, November 2026 |
| High-purity 99.95%, 25 g and 100 g | ¥13,400 and ¥44,900 | Sigma-Aldrich Japan catalog, November 2026 |
| Polished window, 25 mm by 3 mm | NT$10,255 each for 1-10 units | Edmund Optics Taiwan catalog, November 2026 |
| Acid-grade fluorspar input | USD 470 per ton, 2025 estimate | USGS, U.S. import unit value, January 2026 |
Request a Free Sample
Fill in your details and we'll send you a free sample report.
- Sample data tables & charts
- Research methodology
Optical qualification and coating supply lift value
Optical material qualification ties buyers to proven growers
Optics makers qualify a crystal source once and then stay with it, which rewards growers that hold steady transmission and purity. Crystran gives the material a transmission range of 0.15 to 12 micrometers and notes its use as a viewport window for thermography in the 8 to 14 micrometer band. Canon Optron supplies it in Japan for infrared analysis instruments and high-power infrared lasers. Once a window or lens blank is qualified for infrared detectors and gas analyzers, buyers rarely switch source, which gives established growers repeat orders with each new instrument generation. That stickiness also lets qualified growers price blanks far above bulk powder, as the pricing section shows.
Specialist coating-material supply widens the buyer base
Thin-film coaters across the region buy the compound as an evaporation material, which adds a steady, high-value outlet beside bulk powder. Vital Materials lists barium fluoride in its fluoride evaporation range for infrared optical coatings. Umicore sells 99.8% granules of 0.7 to 3.5 millimeters in 500 g lots as a coating material, which shows the small-lot, high-margin format of this business. Canon Optron makes both optical crystals and vacuum evaporation materials, so one Japanese supplier serves lens and coating buyers. Coating demand follows the number of infrared and laser optics coated in China, Japan and Taiwan, so suppliers that hold coating qualifications in all three markets capture repeat orders.
Fluoride producers keep evaporation and lens grades in range
Established fluoride makers keep barium fluoride in their current portfolios, which gives optics and glass buyers several qualified sources inside Japan. Morita Chemical Industries lists it among its optical fluoride materials for lenses and glass, beside strontium, magnesium and calcium fluorides. Stella Chemifa lists it as a glass and lens material in its optical products range, next to calcium, aluminum, lithium and strontium fluorides. Merck offers a 99.95% grade through Sigma-Aldrich Japan, and Thermo Scientific Chemicals offers a 99.9% grade in its Japan catalog. Wide availability lowers qualification risk for small optics firms and supports Technical / Industrial Grade at 52.0% of value while purer grades add growth.
Metal and steel output sustains technical-grade tonnage
Technical grade demand follows metal output, because the compound goes into aluminum refining fluxes and welding coatings. The region's steel base keeps expanding outside China, since India raised crude steel output 10.4% to 164.9 million tons in 2025, according to worldsteel. China still produced 960.8 million tons, more than half of the world total of 1,849.4 million tons. China's aluminum output rose above its capacity cap in 2025, as noted in the segment analysis, and December output alone reached 3.87 million tons. These volumes explain why Metallurgy keeps 34.0% of value even though its growth trails the optical and electronic uses.
Doped crystals and tighter fluorspar reshape supply
Shift to yttrium-doped crystals for fast timing
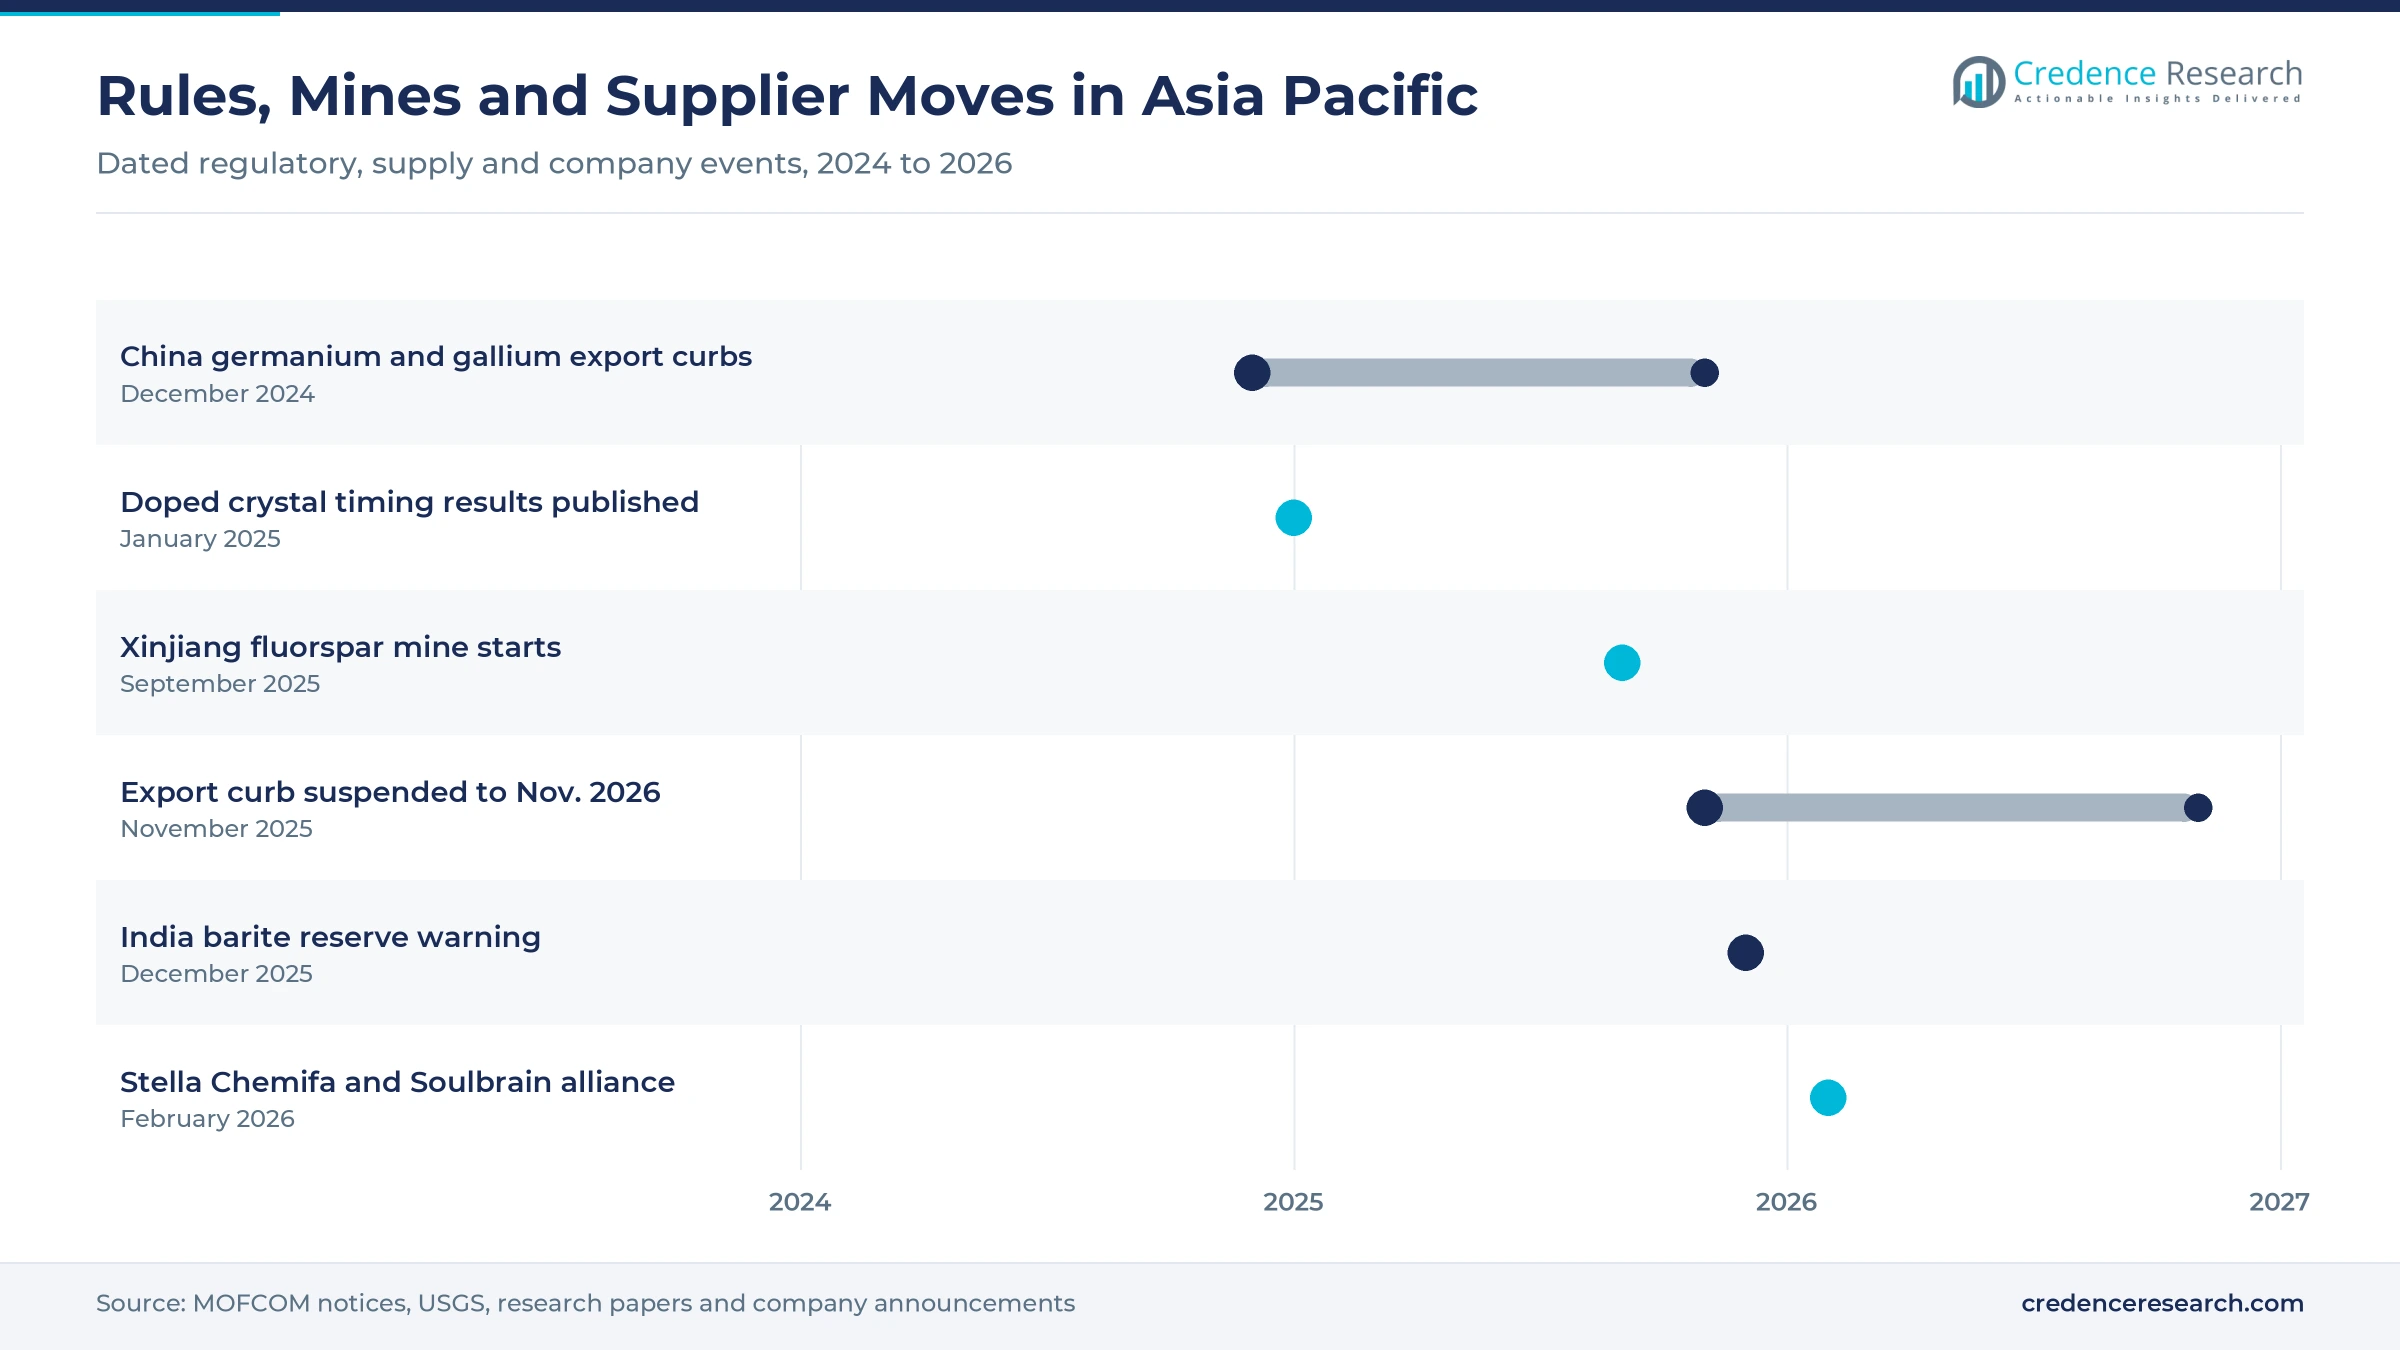
Detector physicists are moving from pure crystals to yttrium-doped ones, because doping suppresses the slow light component that limits counting rates. In tests reported by Fudan University and the Shanghai Institute of Ceramics in January 2025, a 3 at% yttrium-doped crystal reached a time resolution of 82.2 picoseconds with cosmic rays and 140.1 picoseconds in a 1.35 GeV electron beam at the Shanghai Synchrotron Radiation Facility. The slow component fell to about 20% of that of pure material while the fast component barely changed. The team grew a 250 mm boule and machined a 200 mm crystal from it, and the paper names the material as the bottom-line scintillator for the Mu2e-II calorimeter. This keeps crystal demand rising in Electronics and Detection Systems.
Rise in fluorspar imports as Chinese mines tighten
Chinese producers are buying more fluorspar abroad, which shifts the cost base of every fluoride made in the region. USGS reports that China mined about 6.0 million tons of fluorspar in 2025, about 60% of world output, but supply was constrained by mine rectification and safety checks. Chinese imports rose 48% in the first half of 2025 to 856,000 tons, with 86% from Mongolia, which has become the main swing supplier for Chinese fluoride plants. A new Xinjiang mine with 300,000 tons a year of acid-grade capacity began operating in September 2025. Producers with secure fluorine supply from captive or long-term contracts gain a clear cost edge.
Opening in infrared optics as germanium access tightens
Curbs on germanium give fluoride crystals a chance to win designs in infrared optics where buyers want a second material. China's Ministry of Commerce Announcement 46, issued on Dec. 3, 2024, barred in principle exports of gallium, germanium and antimony to the U.S. China suspended that article on Nov. 9, 2025, until Nov. 27, 2026, so the risk has paused but not ended. UM Optics already sells barium, calcium and magnesium fluoride alongside germanium and zinc selenide optics. Designers hedging their exposure to single-crystal germanium could lift demand for Crystal Growth and Finishing, and Chinese growers with both materials are best placed to win those second-source orders.
Opening in Indian barium chemicals from local barite
India holds the region's largest barite output, which opens room to make barium chemicals at home rather than export raw ore. USGS puts India's 2025 barite mine production at 3.0 million tons against 2.2 million tons for China. A Dec. 17, 2025, report by the Centre for Domestic Economy Policy Research (C-DEP) said the decline in Indian reserves is driven mainly by exports of the ore, which is used as a weighting agent in oil and gas drilling. Converting even a small part of that ore into carbonate and fluoride would serve India's growing steel and glass users. Local feedstock would support India and Remaining Asia Pacific, which grows at 7.7% a year, and first movers could supply South Asian buyers that now import from China.
Feedstock costs, toxicity rules and steel cuts weigh
Will fluorspar costs keep squeezing technical-grade margins?
Fluorspar costs have risen steadily, which squeezes producers of low-priced technical grade. USGS data show the unit value of acid-grade fluorspar imports rising from USD 322 per ton in 2021 to an estimated USD 470 in 2025. Technical-grade buyers in metallurgy resist price increases, because they can switch to other fluoride fluxes. Small Chinese producers without mines are most exposed, and some may exit or merge.
Are Indian barite reserves running down too fast?
Barite supply in India rests on one mine, which limits how far local barium chemicals can grow. The Centre for Domestic Economy Policy Research report said about 95% of Indian barite sits in the Mangampet mine in Andhra Pradesh, where proven reserves fell from 49 million tons in 2015 to under 23 million tons in 2024. It warned of less than a decade of accessible reserves at current export rates. Fluoride makers planning Indian capacity must secure long-term ore contracts first.
Will weaker steel output slow technical demand?
Steel output fell in the region's largest producers in 2025, which caps tonnage demand for welding uses. Worldsteel data show crude steel output down 4.4% in China, 4.0% in Japan and 2.8% in South Korea. Lower steel output means fewer coated electrodes and flux powders, and this softens demand for welding consumables that use the compound. Producers must shift volume toward optical and electronic grades to keep plants full.
Do toxicity rules raise handling costs for buyers?
Barium fluoride is toxic, which adds handling, storage and paperwork costs for every buyer. Japan's Ministry of Health, Labour and Welfare safety data sheet classifies it as acute oral toxicity Category 3, based on a rat LD50 of 250 mg/kg, and lists it as a deleterious substance under the Poisonous and Deleterious Substances Control Act. Sellers and buyers must therefore keep registered storage and sales records. Small optics shops may prefer finished blanks over powder for this reason.
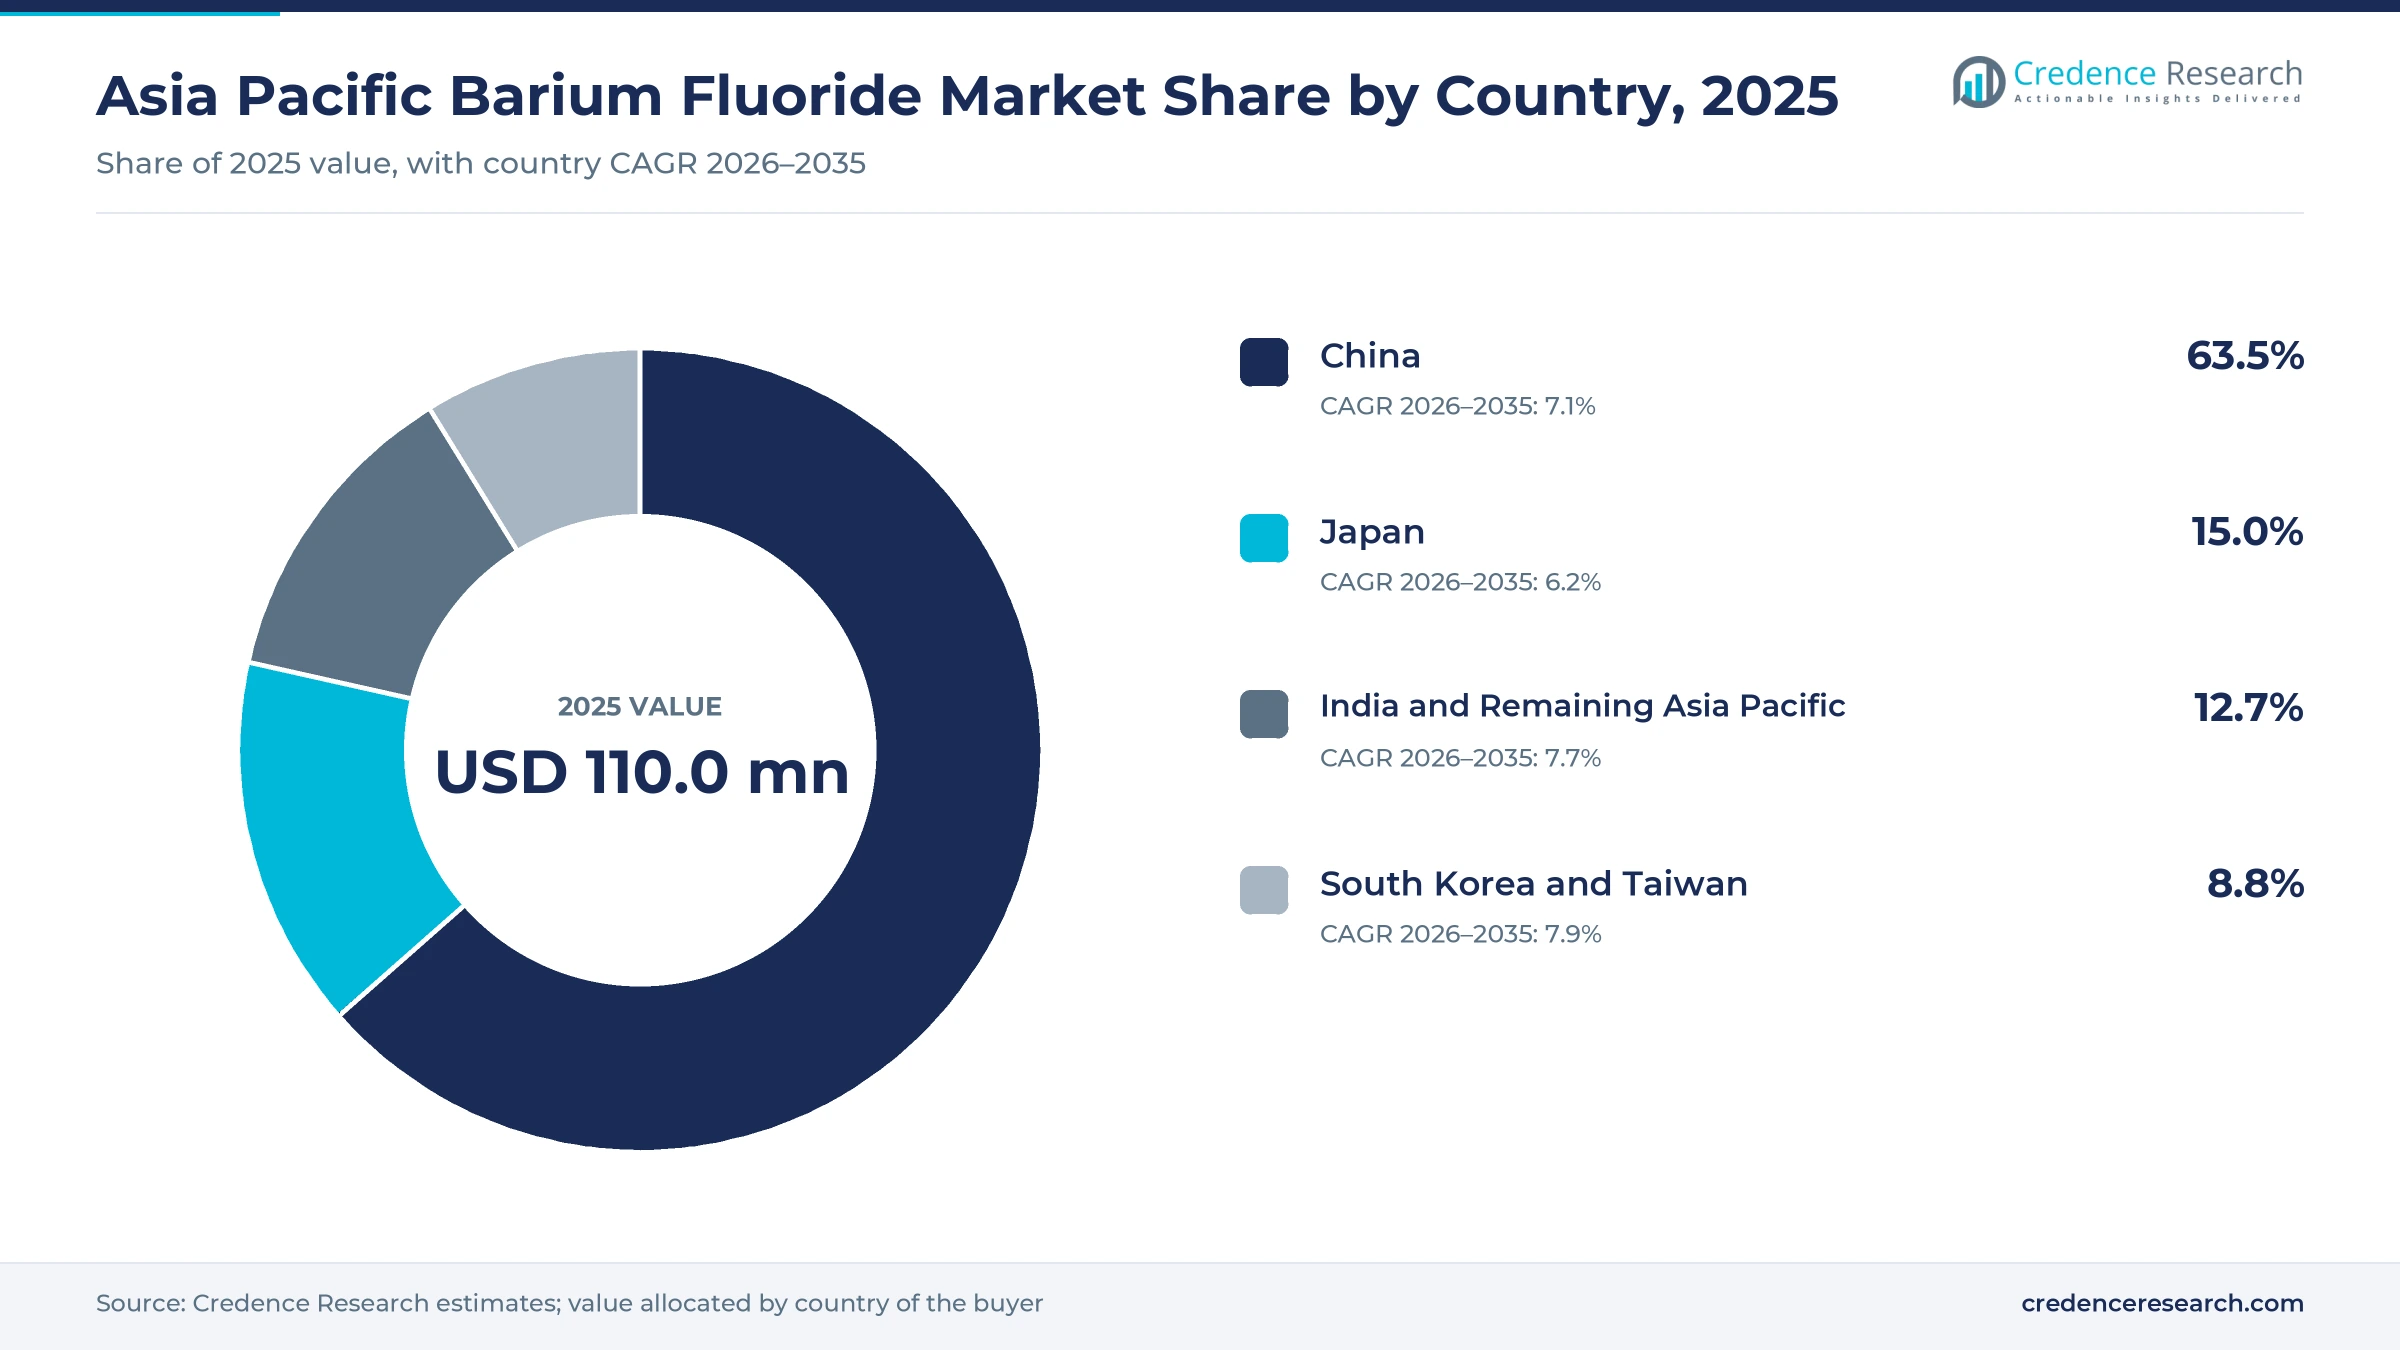
China holds most volume as Korea and Taiwan grow fastest
| Country | Value, 2025 (USD million) | Share, 2025 | CAGR, 2026–2035 |
|---|---|---|---|
| China | 69.8 | 63.5% | 7.1% |
| Japan | 16.5 | 15.0% | 6.2% |
| India and Remaining Asia Pacific | 14.0 | 12.7% | 7.7% |
| South Korea and Taiwan | 9.7 | 8.8% | 7.9% |
China leads through fluorspar, metal and crystal capacity
China held 63.5% of 2025 value and grows at 7.1% a year. It controls the region's main fluorine input, holding about 110 million tons of fluorspar reserves, a third of the world total, according to USGS. Chinese suppliers cover every grade, from bulk producers in Hebei and Anhui to Vital Materials in coating materials and UM Optics, which calls itself the country's biggest fluoride crystal supplier. Its large aluminum and steel output keeps technical grade volume high, even as the Shanghai crystal work adds value.
Japan specializes in high-purity lens and glass grades
Japan held 15.0% of 2025 value and grows at 6.2% a year. Stella Chemifa, Morita Chemical Industries and Canon Optron supply lens, glass and crystal grades, as noted in the drivers section. SEMI reports that Japanese equipment spending rose 22% in 2025 to USD 9.5 billion, which supports electronic-grade demand. Japan grows more slowly than the region because its steel output fell and its optics makers are mature, yet the catalog prices noted in the pricing section show how much Japanese buyers pay for purity.
South Korea and Taiwan grow fastest on chip investment
South Korea and Taiwan held 8.8% of 2025 value and grow fastest at 7.9% a year. Taiwan's record equipment spending is noted in the segment analysis, and SEMI reports that Korean spending rose 26% to USD 25.8 billion in 2025. Stella Chemifa and Korea's Soulbrain announced a capital and business alliance on Feb. 24, 2026, with each taking about ¥2.1 billion of the other's shares. Ties of this kind bring Japanese high-purity fluorides closer to Korean fabs.
India and the rest of the region add steel and barite demand
India and Remaining Asia Pacific held 12.7% of 2025 value and grow at 7.7% a year. India's fast steel growth, noted in the drivers section, lifts technical grade demand for welding and fluxes. Mongolia mined about 1.5 million tons of fluorspar in 2025, Vietnam 160,000 tons and Thailand 55,000 tons, according to USGS. Mongolia ships most of its output to China, as the trends section shows, which ties the rest of the region closely to the Chinese fluoride supply chain.
Export rules, new mines and alliances in 2024-2026
| Development | Status and market relevance |
|---|---|
| In December 2024, China's Ministry of Commerce issued Announcement 46, barring in principle exports of gallium, germanium and antimony to the U.S. | Suspended on Nov. 9, 2025, until Nov. 27, 2026 |
| In January 2025, Fudan University and Shanghai Institute of Ceramics researchers reported 82.2 ps timing from a yttrium-doped crystal. | Research; targets Mu2e-II and fast-timing detectors |
| In September 2025, a new fluorspar mine in Xinjiang began operating with 300,000 tons a year of acid-grade capacity. | Operating; eases Chinese fluorine supply |
| In December 2025, a Centre for Domestic Economy Policy Research report warned that India has less than a decade of accessible barite reserves. | Policy debate on barite exports |
| In February 2026, Stella Chemifa and Soulbrain announced a capital and business alliance worth about ¥2.1 billion each way. | Share payments due March 12, 2026; semiconductor focus |
Crystal growth and purity control set the price tier
- Bridgman crystal growth produces the large boules that optics and detector makers cut into windows, lenses and scintillator bars.
- Yttrium doping suppresses the slow light component of the crystal, which raises usable counting rates in fast-timing detectors.
- Trace-metal purification separates electronic and optical grades from technical powder, and it sets most of the price gap between them.
- Evaporation granule sizing controls how evenly the material deposits in vacuum coaters, which matters for infrared and laser coatings.
Need a Custom Version of This Report?
Tailor the scope, geography, or segments to your exact requirements.
- Custom geography or segment scope
- Direct access to our analyst team
Japanese fluoride makers and Chinese growers compete
Competition in the Asia Pacific barium fluoride market splits between price-led bulk producers and qualification-led specialists. In Japan, Stella Chemifa and Morita Chemical Industries sell lens and glass grades from long-established fluorine chemistry, while Canon Optron, a Canon group company, grows optical crystals and makes evaporation materials. In China, Vital Materials sells the compound as an infrared coating material and UM Optics supplies crystal blanks and finished optics. Catalog grades reach laboratories across the region through Merck's Sigma-Aldrich brand and Thermo Fisher Scientific's Thermo Scientific Chemicals brand. Suppliers compete on purity data, crystal size, lot consistency and delivery of small qualified lots rather than on headline price. New entrants find it hard to break in, because optics and electronics buyers requalify a source only when a product line changes.
How is supply organized, and where do margins sit?
Supply runs in two tiers that rarely overlap in this regional market. Many Chinese chemical plants make technical powder from fluorspar-derived acid and barium salts, sell it in 25 kg bags and compete mainly on price. A short list of qualified firms, led by Stella Chemifa, Morita Chemical Industries, Canon Optron, Vital Materials and UM Optics, makes high-purity powder, crystals and coating granules. Barriers in the upper tier are purity control, crystal growth know-how and customer qualification, and that is where most margin sits. Catalog sellers such as Merck and Thermo Fisher serve research buyers at premium prices.
Purity data and qualified lots decide supplier choice
| Company | Type | Role in the market |
|---|---|---|
| Stella Chemifa Corporation | Specialist | High-purity fluorides, including barium fluoride as a glass and lens material |
| Morita Chemical Industries | Specialist | Optical fluoride materials for lenses and glass, including barium fluoride |
| Canon Optron (Canon Inc.) | Crystal grower | Barium fluoride optical crystals and vacuum evaporation materials in Japan |
| Vital Materials | Specialist | Barium fluoride evaporation material for infrared optical coatings |
| UM Optics (Henan UM Optics) | Crystal grower | Fluoride crystal blanks, windows and lenses, including barium fluoride, from China |
| Thermo Fisher Scientific (Thermo Scientific Chemicals) | Catalog supplier | 99.9% barium fluoride for laboratories through its Japan catalog |
| Merck KGaA (Sigma-Aldrich) | Catalog supplier | 99.95% precipitated barium fluoride sold through Sigma-Aldrich Japan |
High-purity grades will decide where margin goes
Credence Research's view is that Asia Pacific barium fluoride value will move from tonnage to purity over the forecast. Technical grade still carries the largest share, but its buyers in steel and aluminum are flat or shrinking in the largest economies. The value gains come from electronic, optical and crystal grades, where few suppliers are qualified and prices per kilogram are many times higher. The decisive questions are fluorine cost and whether detector and infrared designers adopt doped crystals at scale. Suppliers that combine secure fluorspar with crystal growth should gain the most.
Grade volumes and catalog prices anchor the estimate
The report uses 2025 as the base year and forecasts values to 2035. Market values come from the Credence Research model, and segment and country splits are Credence Research estimates. The size was cross-checked with a grade-by-grade build of volume and price, using metal output from national statistics and worldsteel, fluorspar and barite data from USGS, and catalog prices for reagent grades, windows and coating granules. Evidence also comes from company product pages, government notices, safety data sheets and research papers. No interviews or surveys were conducted for the preparation of this report.
Electronic and detector grades gain share by 2035
Asia Pacific barium fluoride value should reach USD 219.7 million by 2035, up from USD 117.9 million in 2026, as purer grades take a larger share of each kilogram sold. Electronic grade should keep the fastest product growth, tied to fab investment in Korea and Taiwan. Crystal growth should gain from detector and infrared optics work, while technical grade grows slowly with metal output. China should keep most of the volume through its fluorspar base. The main risks are rising fluorine costs and renewed export curbs on related materials.
What separates the downside, base and upside paths to 2035?
The range of outcomes depends on chip and detector demand for pure grades and on the cost of fluorine. A downside path follows if fab spending in Korea and Taiwan stalls, steel output keeps falling and fluorspar prices keep climbing. The base case assumes steady metal demand and gradual growth in optical and electronic grades. An upside path needs new detector projects and infrared designs to adopt fluoride crystals faster, with stable fluorine supply from new mines.
| Scenario | CAGR, 2026–2035 | Value, 2035 | What has to hold |
|---|---|---|---|
| Downside | 5.7% | USD 193.5 million | Fab spending stalls, steel output falls further and fluorspar costs keep rising |
| Base | 7.16% | USD 219.7 million | Metal demand holds steady while optical and electronic grades gain share gradually |
| Upside | 8.4% | USD 242.8 million | Detector projects and infrared designs adopt fluoride crystals faster on stable fluorine supply |
Frequently Asked Questions
How big is the Asia Pacific barium fluoride market?
Which country leads the market?
Which area grows fastest?
Which product type holds the largest share?
Why is the crystal used in detectors?
How does fluorspar supply affect prices?
What is the biggest challenge for the market?
Which companies are active in the market?
Table of Content
Chapter 1 Market Segmentation
- 1.1 Segmentation Framework
- 1.1.1 Product and Service Classification
- 1.1.2 Application and End-Use Classification
- 1.1.3 Technology and Solution Classification
- 1.1.4 Customer and Distribution Channel Classification
- 1.1.5 Geographic Segmentation
- 1.1.6 Market Segment Definitions and Boundaries
- 1.2 By Product Type
- 1.2.1 Technical / Industrial Grade
- 1.2.2 Optical / High-Purity Grade
- 1.2.3 Electronic / Semiconductor Grade
- 1.3 By End-Use Industry
- 1.3.1 Metallurgy
- 1.3.2 Optical and Optoelectronic Manufacturing
- 1.3.3 Glass and Ceramics
- 1.3.4 Electronics and Detection Systems
- 1.3.5 Defence and Aerospace
- 1.4 By Technology
- 1.4.1 Conventional Chemical Processing
- 1.4.2 High-Purity Chemical Processing
- 1.4.3 Crystal Growth and Finishing
- 1.5 By Country
- 1.5.1 China
- 1.5.2 Japan
- 1.5.3 South Korea and Taiwan
- 1.5.4 India and Remaining Asia Pacific
Chapter 2 Introduction
- 2.1 Report Objectives and Scope
- 2.2 Product Definition and Industry Terminology
- 2.3 Market Inclusions and Exclusions
- 2.4 Research Process
- 2.4.1 Primary Research and Expert Interviews
- 2.4.2 Secondary Research and Source Review
- 2.4.3 Top-Down and Bottom-Up Estimation
- 2.4.4 Data Triangulation and Verification
- 2.5 Market Size Measurement Basis
- 2.5.1 2025: USD 110.0 million → 2035: USD 219.7 million
- 2.6 Historical and Forecast Reference Periods
- 2.6.1 Historical Period: 2018-2025
- 2.6.2 Base Year: 2025
- 2.6.3 Forecast Period: 2025-2035
- 2.7 Research Assumptions and Limitations
Chapter 3 Executive Summary
- 3.1 Market Snapshot and Key Findings
- 3.2 Base-Year Market Size, 2025
- 3.3 Forecast Market Size, 2035
- 3.4 Revenue and Volume Growth Outlook
- 3.5 Key Demand and Supply Indicators
- 3.6 Leading Market Segments
- 3.7 Fastest-Growing Market Opportunities
- 3.8 Regional Performance Highlights
- 3.9 Technology and Industry Transformation
- 3.10 Competitive Landscape Summary
- 3.11 Analyst View and Strategic Implications
Chapter 4 Asia Pacific Barium Fluoride Market Trends and Developments
- 4.1 Historical Industry Development, 2018-2025
- 4.2 Recent Market Trends and Developments
- 4.3 Demand and Customer Behavior Trends
- 4.4 Technology and Product Innovation
- 4.5 Artificial Intelligence, Automation and Digitalization
- 4.6 Local Manufacturing and Supply Chain Realignment
- 4.7 Industry Partnerships, Mergers and Acquisitions
- 4.8 Sustainability and Circular Economy Developments
- 4.9 Government and Private Sector Investment Trends
- 4.10 Emerging Business Models and Commercialization
- 4.11 Industry Developments and Announcements
Chapter 5 Asia Pacific Barium Fluoride Market Production, Supply and Demand Analysis
- 5.1 Demand Trend and Consumption Analysis, 2018-2025
- 5.2 Demand Forecast, 2025-2035
- 5.3 Production and Output Trend, 2018-2025
- 5.4 Production and Output Forecast, 2025-2035
- 5.5 Installed Capacity and Capacity Utilization
- 5.6 Company-Wise Production Plants and Statistics
- 5.6.1 Installed Production Capacity
- 5.6.2 Actual Production
- 5.6.3 Planned Capacity and Expansion Targets
- 5.7 Supply Chain Structure and Procurement Trends
- 5.8 Supply-Demand Gap and Bottlenecks
- 5.9 Import Dependence and Sourcing Structure
- 5.10 Contract Manufacturing and Outsourcing
- 5.11 Regional Supply and Demand Concentration
Chapter 6 Asia Pacific Barium Fluoride Market Pricing Analysis
- 6.1 Pricing Structure and Measurement
- 6.2 Historical Pricing Trends, 2018-2025
- 6.3 Pricing Outlook, 2025-2035
- 6.4 Average Selling Price and Unit Economics
- 6.5 Pricing by Product and Market Segment
- 6.6 Geographic Pricing Differences
- 6.7 Key Input, Energy, Labor and Logistics Costs
- 6.8 Contract Pricing and Purchasing Models
- 6.9 Pricing Sensitivity and Competitive Positioning
- 6.10 Price, Margin and Profitability Implications
Chapter 7 Asia Pacific Barium Fluoride Market Dynamics
- 7.1 Market Growth Drivers
- 7.1.1 Demand-Side Drivers
- 7.1.2 Technology and Innovation Drivers
- 7.1.3 Infrastructure and Investment Drivers
- 7.1.4 Regulatory and Policy Drivers
- 7.2 Market Restraints
- 7.2.1 Cost and Affordability Constraints
- 7.2.2 Technology and Adoption Barriers
- 7.2.3 Supply Chain and Operational Constraints
- 7.3 Market Challenges
- 7.3.1 Competitive Pressure and Margin Erosion
- 7.3.2 Skills, Infrastructure and Implementation Gaps
- 7.4 Emerging Market Opportunities
- 7.5 Market Dynamics Impact and Time-Horizon Assessment
Chapter 8 Asia Pacific Barium Fluoride Value Chain Analysis
- 8.1 Industry Value Chain Overview
- 8.2 Upstream Suppliers and Critical Inputs
- 8.3 Technology and Component Providers
- 8.4 Manufacturing or Service Delivery
- 8.5 Distribution, Channel Partners and Integrators
- 8.6 Downstream Applications and End Users
- 8.7 Value Addition and Profit Pools
- 8.8 Vertical Integration and Outsourcing
- 8.9 Supplier Concentration and Risk
- 8.10 Supply Chain Localization and Resilience
Chapter 9 Asia Pacific Barium Fluoride Market Regulations and Policies
- 9.1 Relevant Laws, Standards and Compliance Frameworks
- 9.2 Product, Service, Safety and Quality Requirements
- 9.3 Government Policies, Incentives and Subsidies
- 9.4 Imports, Exports and Trade Barriers
- 9.5 Public Procurement and Local Content Requirements
- 9.6 Environmental and Sustainability Compliance
- 9.7 Upcoming Policy Changes and Market Implications
Chapter 10 Asia Pacific Barium Fluoride Market Hotspots and Opportunities
- 10.1 Market Opportunity Mapping and Growth Hotspots
- 10.2 High-Growth Applications and Customer Groups
- 10.3 Underserved Markets and White-Space Opportunities
- 10.4 Emerging Technology and Product Opportunities
- 10.5 New Capacity and Investment Hotspots
- 10.6 Market Entry and Expansion Opportunities
- 10.7 Distribution and Partnership Opportunities
- 10.8 Near-Term and Long-Term Commercial Potential
- 10.9 Opportunity Attractiveness and Execution Risks
Chapter 11 Asia Pacific Barium Fluoride Market Outlook, 2025-2035
- 11.1 Market Size and Analysis
- 11.1.1 Revenue (Market Measurement: 2025: USD 110.0 million → 2035: USD 219.7 million)
- 11.1.2 Market Volume and Quantity Sold
- 11.1.3 Historical Market Size, 2018-2025
- 11.1.4 Base-Year Market Size, 2025
- 11.2 Market Forecast, 2025-2035
- 11.2.1 Revenue Forecast to 2035
- 11.2.2 Volume Forecast to 2035
- 11.2.3 CAGR and Year-on-Year Growth
- 11.2.4 Incremental Revenue Opportunity
- 11.3 Forecast Assumptions and Scenario Analysis
- 11.3.1 Base-Case Forecast
- 11.3.2 Optimistic and Conservative Scenarios
- 11.3.3 Technology, Pricing and Policy Sensitivities
- 11.4 Market Attractiveness and Growth Outlook
Chapter 12 Asia Pacific Barium Fluoride Market Segmentation and Outlook
- 12.1 Segmentation Summary and Market Shares, 2025
- 12.2 Largest and Fastest-Growing Segments
- 12.3 By Product Type - Market Size and Forecast, 2025-2035
- 12.3.1 Segment Definition and Scope
- 12.3.2 Historical Market Size, 2018-2025
- 12.3.3 Revenue Forecast, 2025-2035
- 12.3.4 Volume Forecast, 2025-2035
- 12.3.5 Base-Year Market Share, 2025
- 12.3.6 Segment CAGR and Growth Drivers
- 12.3.7 Subsegment Market Size and Forecast
- 12.3.7.1 Technical / Industrial Grade
- 12.3.7.2 Optical / High-Purity Grade
- 12.3.7.3 Electronic / Semiconductor Grade
- 12.3.8 Subsegment Pricing and Adoption Trends
- 12.3.9 Leading Suppliers and Competition
- 12.3.10 Regional Demand and Opportunities
- 12.4 By End-Use Industry - Market Size and Forecast, 2025-2035
- 12.4.1 Segment Definition and Scope
- 12.4.2 Historical Market Size, 2018-2025
- 12.4.3 Revenue Forecast, 2025-2035
- 12.4.4 Volume Forecast, 2025-2035
- 12.4.5 Base-Year Market Share, 2025
- 12.4.6 Segment CAGR and Growth Drivers
- 12.4.7 Subsegment Market Size and Forecast
- 12.4.7.1 Metallurgy
- 12.4.7.2 Optical and Optoelectronic Manufacturing
- 12.4.7.3 Glass and Ceramics
- 12.4.7.4 Electronics and Detection Systems
- 12.4.7.5 Defence and Aerospace
- 12.4.8 Subsegment Pricing and Adoption Trends
- 12.4.9 Leading Suppliers and Competition
- 12.4.10 Regional Demand and Opportunities
- 12.5 By Technology - Market Size and Forecast, 2025-2035
- 12.5.1 Segment Definition and Scope
- 12.5.2 Historical Market Size, 2018-2025
- 12.5.3 Revenue Forecast, 2025-2035
- 12.5.4 Volume Forecast, 2025-2035
- 12.5.5 Base-Year Market Share, 2025
- 12.5.6 Segment CAGR and Growth Drivers
- 12.5.7 Subsegment Market Size and Forecast
- 12.5.7.1 Conventional Chemical Processing
- 12.5.7.2 High-Purity Chemical Processing
- 12.5.7.3 Crystal Growth and Finishing
- 12.5.8 Subsegment Pricing and Adoption Trends
- 12.5.9 Leading Suppliers and Competition
- 12.5.10 Regional Demand and Opportunities
- 12.6 By Country - Market Size and Forecast, 2025-2035
- 12.6.1 Segment Definition and Scope
- 12.6.2 Historical Market Size, 2018-2025
- 12.6.3 Revenue Forecast, 2025-2035
- 12.6.4 Volume Forecast, 2025-2035
- 12.6.5 Base-Year Market Share, 2025
- 12.6.6 Segment CAGR and Growth Drivers
- 12.6.7 Subsegment Market Size and Forecast
- 12.6.7.1 China
- 12.6.7.2 Japan
- 12.6.7.3 South Korea and Taiwan
- 12.6.7.4 India and Remaining Asia Pacific
- 12.6.8 Subsegment Pricing and Adoption Trends
- 12.6.9 Leading Suppliers and Competition
- 12.6.10 Regional Demand and Opportunities
- 12.7 Segment Growth Comparison
- 12.8 Segment Attractiveness and Priority Matrix
Chapter 13 Asia Pacific Barium Fluoride End-Use and Application Market Outlook
- 13.1 End-Use Industry and Customer Demand Structure
- 13.2 Leading Applications and Customer Groups
- 13.3 End-Use Market Size, Share and Forecast
- 13.4 Major End-Use Industry Deep Dives
- 13.4.1 Customer Requirements and Use Cases
- 13.4.2 Demand and Replacement Cycles
- 13.4.3 Technical and Regulatory Considerations
- 13.4.4 Purchasing and Procurement Models
- 13.4.5 Leading Vendors and Distribution Channels
- 13.4.6 Forecast and Commercial Opportunities
- 13.5 Emerging Applications and Cross-Segment Demand
- 13.6 End-Use Industry Investment Priorities
Chapter 14 Asia Pacific Barium Fluoride Geographic Market Outlook, 2025-2035
- 14.1 Regional Market Size and Country-Level Shares, 2025
- 14.2 Country Market Size Comparison, 2025
- 14.3 Country Market Forecasts, 2025-2035
- 14.4 Subregional Industrial and Demand Clusters
- 14.5 Intra-Regional Pricing and Cost Differences
- 14.6 Cross-Border Trade and Supply Networks
- 14.7 Regional Supply and Demand Balances
- 14.8 Country Opportunity Comparison and Prioritization
Note: Every listed country is covered on the structure shown under the first country.
Chapter 15 Asia Pacific Barium Fluoride Technology, Innovation and Sustainability Outlook
- 15.1 Technology Landscape and Maturity
- 15.2 Product, Process and Service Innovation
- 15.3 AI, Automation and Digital Tools in the Industry
- 15.4 Technology Adoption and Performance Benchmarking
- 15.5 Innovation Pipeline and R&D Investment
- 15.6 Patent and Intellectual Property Trends
- 15.7 Energy Efficiency and Resource Management
- 15.8 Sustainability, Recycling and Circularity
- 15.9 Technology Roadmap, 2025-2035
- 15.10 Risks of Obsolescence and Technology Substitution
Chapter 16 Asia Pacific Barium Fluoride Market Key Strategic Imperatives
- 16.1 Growth and Market Entry Priorities
- 16.2 High-Return Products and Segments
- 16.3 Pricing, Profitability and Cost Optimization
- 16.4 Technology Investment and Product Differentiation
- 16.5 Supply Chain Localization and Resilience
- 16.6 Distribution and Customer Acquisition
- 16.7 Partnership, Acquisition and Capacity Strategy
- 16.8 Regional Expansion Priorities
- 16.9 Short-, Medium- and Long-Term Actions
Chapter 17 Competition Outlook
- 17.1 Industry Competition Characteristics
- 17.2 Market Structure and Concentration
- 17.3 Market Share and Competitive Positioning, 2025
- 17.4 Company-Wise Revenue and Product Benchmarking
- 17.5 Production and Service Capacity Benchmarking
- 17.6 Technology, Pricing and Differentiation
- 17.7 Regional Footprint and Distribution Strength
- 17.8 Mergers, Acquisitions and Strategic Alliances
- 17.9 New Entrants and Competitive Threats
- 17.10 Porter's Five Forces and Industry Attractiveness
- 17.11 Competitive Outlook, 2025-2035
Chapter 18 Company Profiles
- 18.1 Company Coverage and Selection Criteria
- 18.2 Stella Chemifa Corporation
- 18.2.1 Business Description
- 18.2.2 Company Ownership and Geographic Presence
- 18.2.3 Product and Service Portfolio
- 18.2.4 Manufacturing and Operating Footprint
- 18.2.5 Production Capacity and Expansion Plans
- 18.2.6 Financial Performance and Investment
- 18.2.7 Market Share and Competitive Position
- 18.2.8 Technology and Innovation Capabilities
- 18.2.9 Strategic Alliances or Partnerships
- 18.2.10 Recent Developments
- 18.2.11 Growth Strategy and Outlook
- 18.3 Morita Chemical Industries
- 18.4 Canon Optron (Canon Inc.)
- 18.5 Vital Materials
- 18.6 UM Optics (Henan UM Optics)
- 18.7 Thermo Fisher Scientific (Thermo Scientific Chemicals)
- 18.8 Merck KGaA (Sigma-Aldrich)
- 18.9 Other Relevant Market Participants
Note: Every listed company is profiled on the structure shown under the first company. The company list is preliminary and may change based on research findings, market developments, data availability and client requirements.
Chapter 19 Disclaimer
- 19.1 Research and Forecast Disclaimer
- 19.2 Data Source and Estimation Limitations
Note: The depth of individual sections depends on data availability for this market. Volume, capacity, trade and other unit-based metrics are included where applicable.

