
Polyester lines in China set the pace for glycol demand
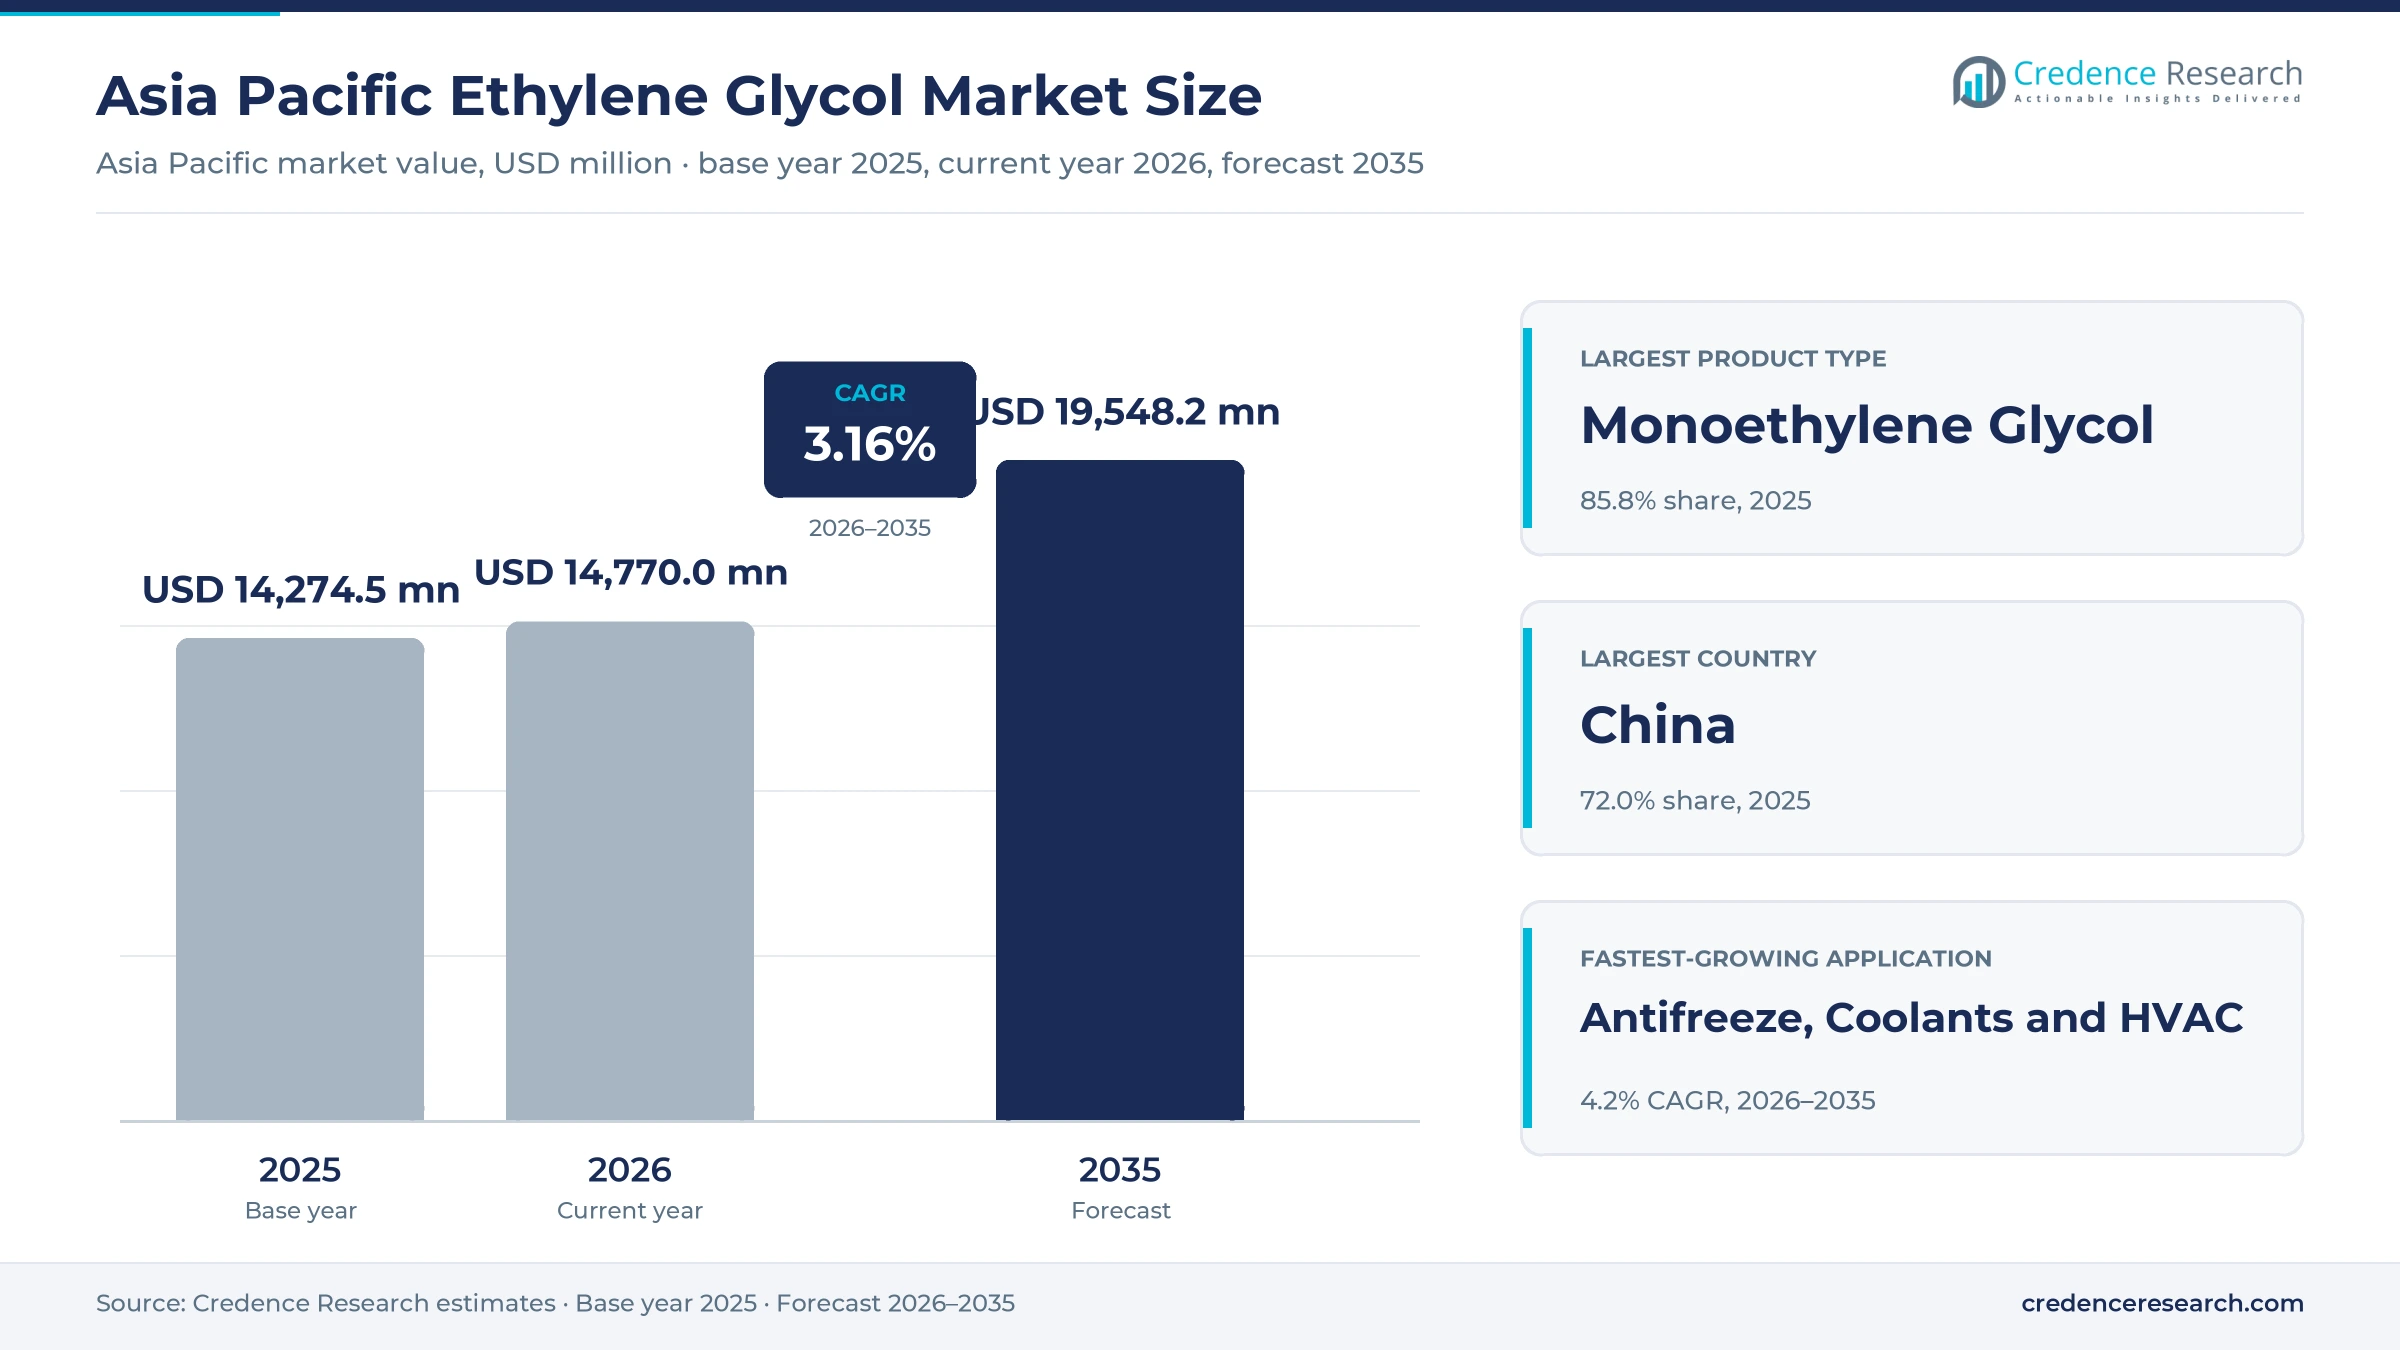
The Asia Pacific ethylene glycol market was valued at USD 14.27 billion in 2025 and is projected to increase from USD 14.77 billion in 2026 to USD 19.55 billion by 2035, registering a CAGR of 3.16% during 2026–2035. Polyester fiber and filament mills, bottle-grade PET producers, coolant formulators and gas processors account for most purchases, because glycol is the diol that links terephthalic acid into polyester chains and the base fluid of most engine coolants. China held the largest share, 72.0% in 2025, on the strength of the largest integrated polyester chain in the world. India is the fastest-growing country at 4.5% a year, because domestic output covers only part of its fiber and resin demand. Coal-based syngas plants now supply a large part of Chinese capacity, which keeps the domestic cost floor low. Supply security has become the main buying criterion since Middle East exports were disrupted in 2026.
Fiber-grade glycol for polyester defines most of the value
The estimate measures the value of monoethylene, diethylene and triethylene glycol consumed in Asia Pacific, counted at the first sale or internal transfer price. It covers fiber-grade and industrial-grade product, bought by polyester and PET producers, coolant and brake fluid formulators, resin and solvent makers and gas processing operators.
The estimate excludes propylene glycol, polyethylene glycols, glycol ethers and ethylene oxide sold as such, and it counts each ton once even when it crosses a border before use. The value chain runs from ethylene crackers, coal gasifiers and ethanol plants through oxide and glycol units to polyester, resin and fluid plants that serve textile, packaging, vehicle and energy customers.
Asia Pacific Ethylene Glycol Market Insights
- The Asia Pacific ethylene glycol market grows from USD 14.27 billion in 2025 to USD 19.55 billion by 2035 at a 3.16% CAGR, led by polyester fiber, bottle resin and coolant demand.
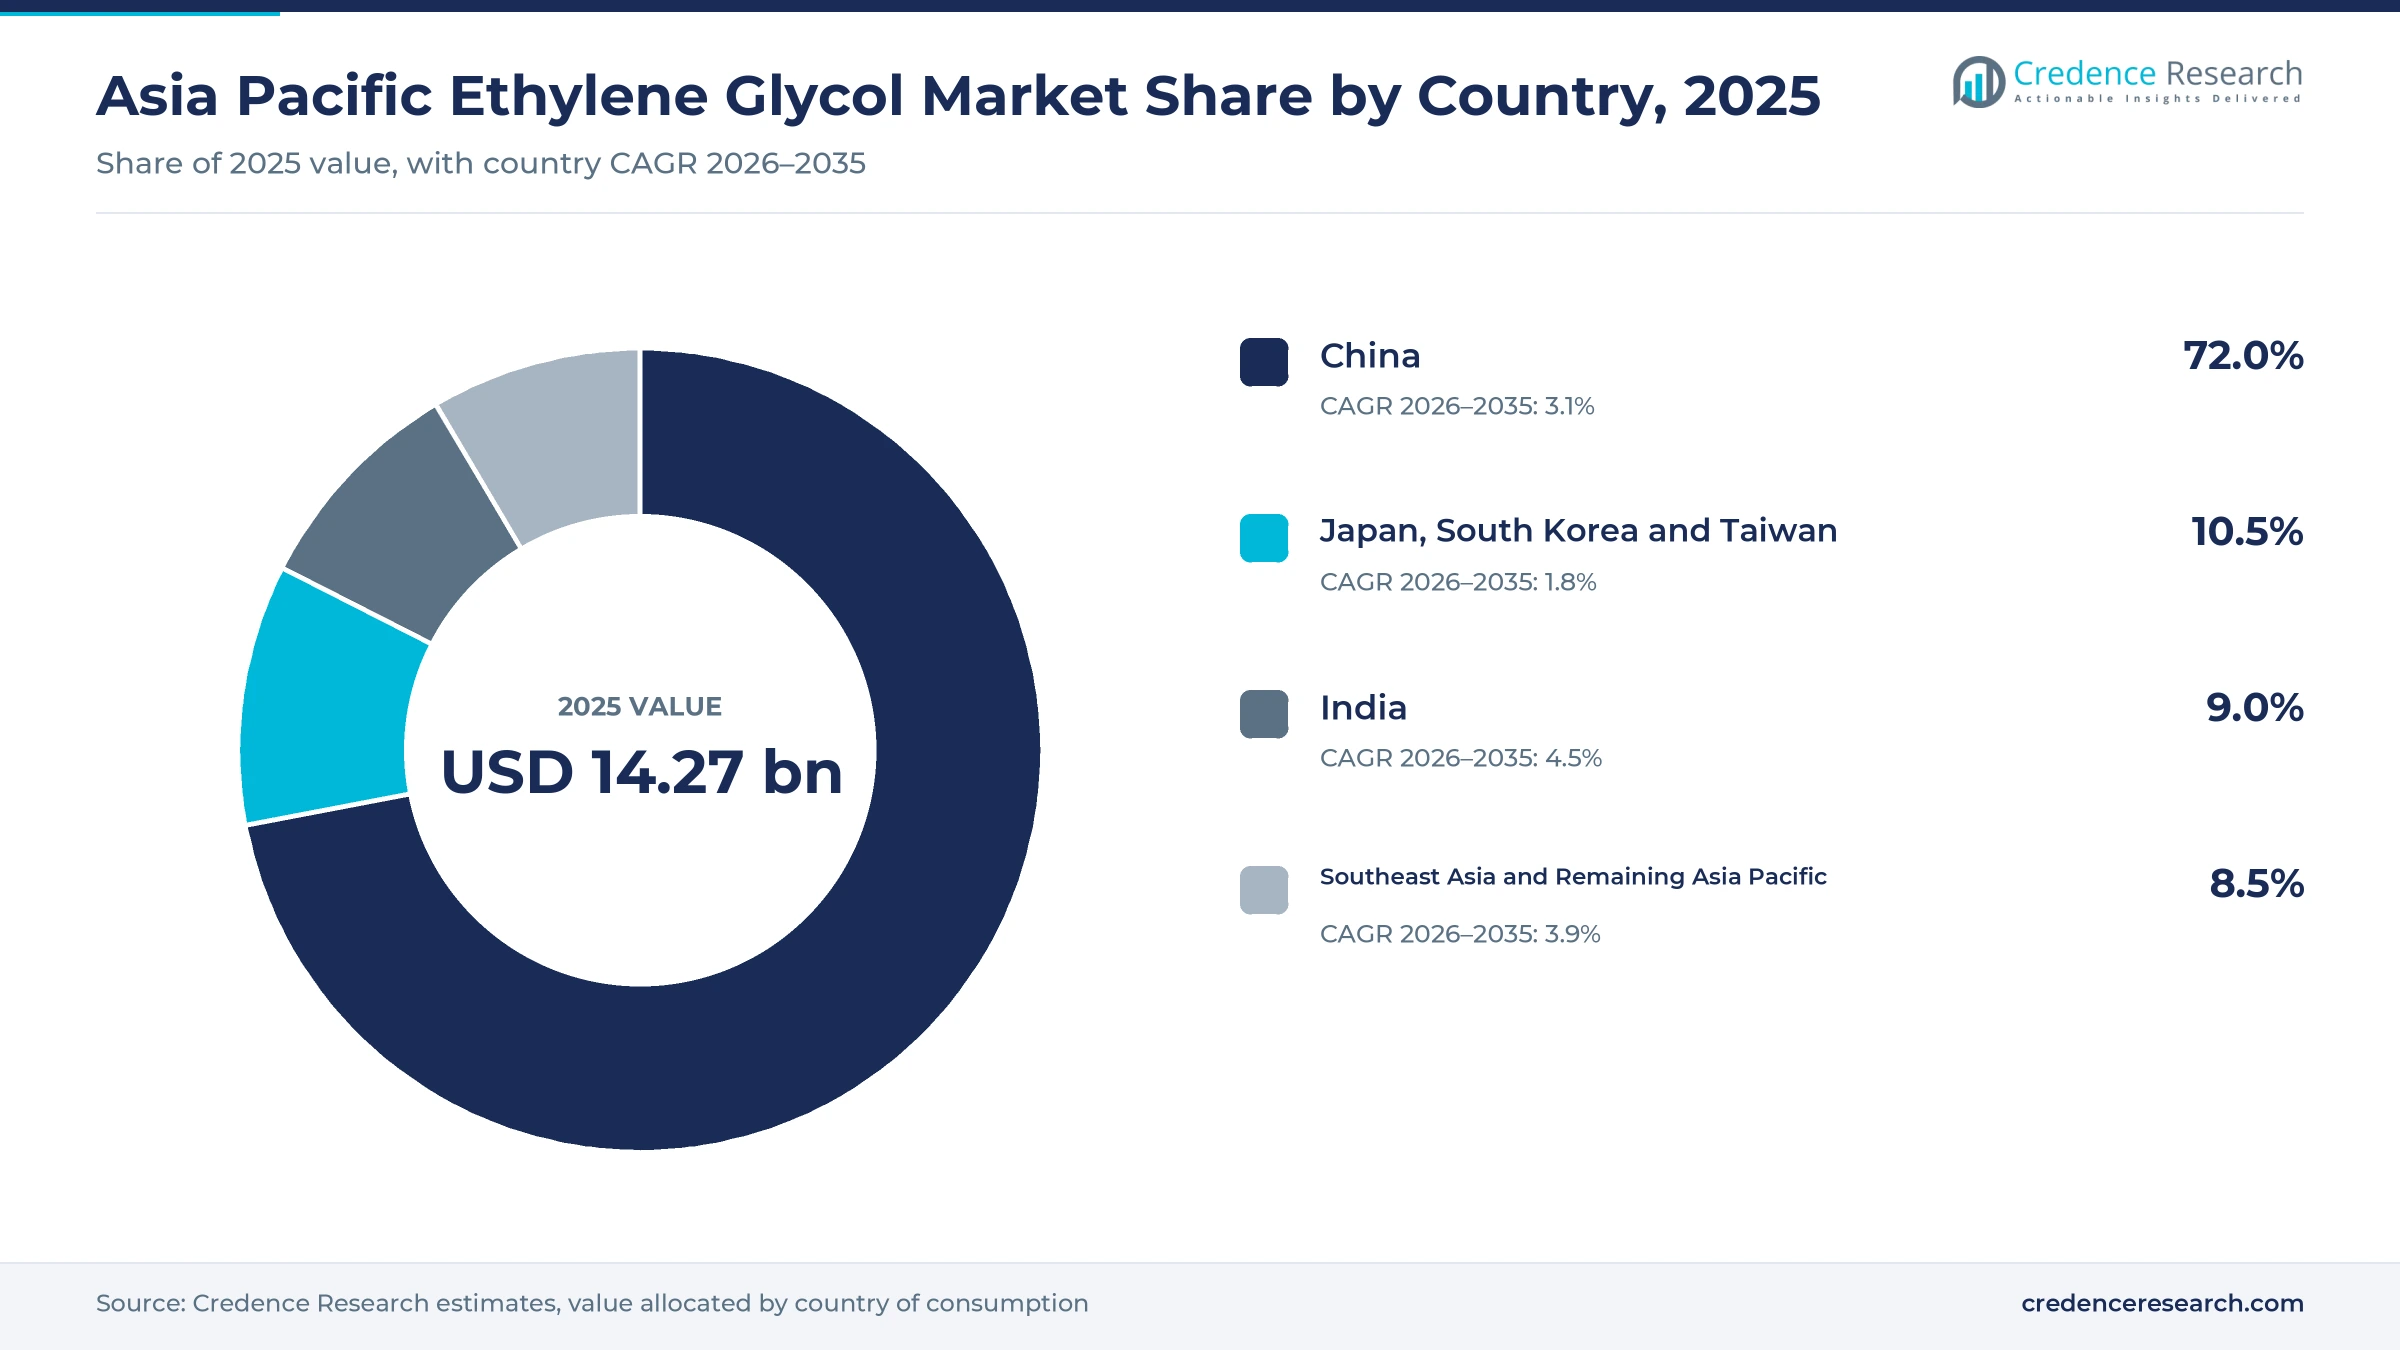
- China held 72.0% of regional value in 2025, while India is the fastest-growing country at 4.5% a year as its polyester demand outruns domestic glycol output.
- Monoethylene glycol led product types with 85.8% of 2025 value, because polyester fiber and PET resin consume it in far larger tonnages than other glycols.
- Coal-based syngas units made up 39.85% of Chinese ethylene glycol capacity in 2025, which keeps the domestic cost floor below naphtha-based supply.
- East China glycol spot prices neared CNY 7,500 per ton on Sept. 17, 2026, the highest since October 2021, after Middle East supply was disrupted.
Monoethylene glycol leads while coolant uses grow fastest
Monoethylene glycol leads as triethylene glycol grows fastest
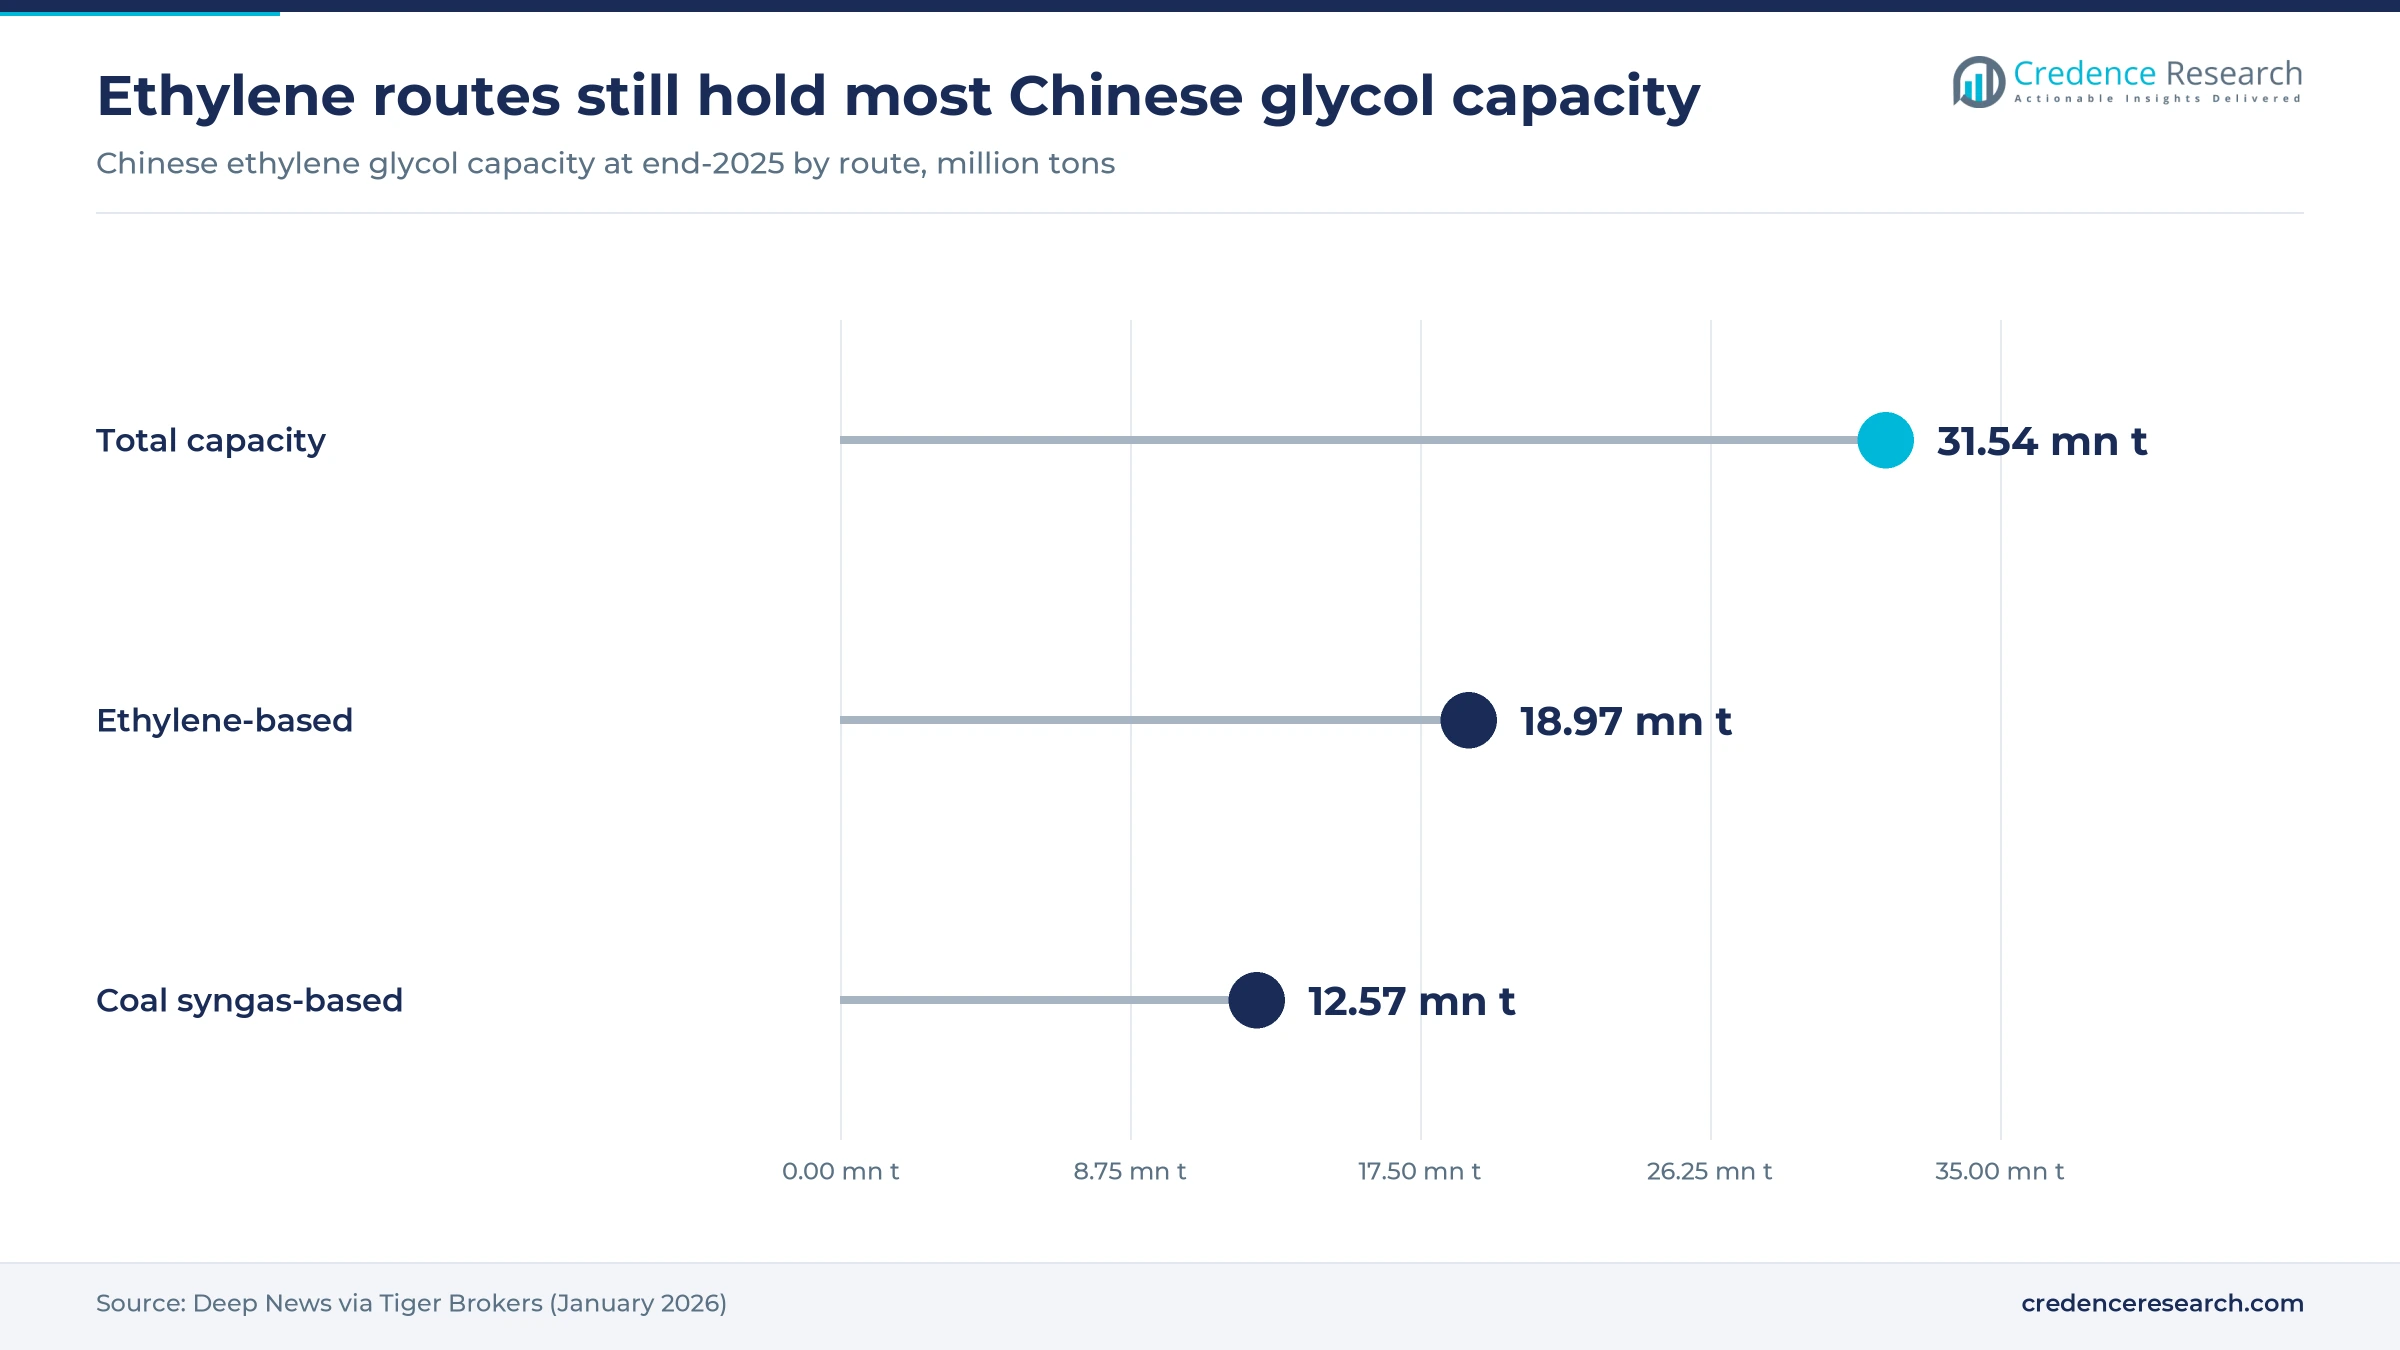
Based on product type, the market is categorized into monoethylene glycol, diethylene glycol and triethylene glycol. Monoethylene Glycol led with 85.8% of 2025 value because every polyester and PET plant needs it as the diol in the chain, while the co-products make up only a small part of reactor output. Chinese plants alone reached 31.54 million tons of ethylene glycol capacity at the end of 2025, Deep News reported in January 2026. Triethylene Glycol grows fastest at 4.2% a year, as gas processors use it to dry gas before pipelines and liquefaction, and Chinese natural gas output rose 6.3% to 262.06 billion cubic meters in 2025, according to the National Bureau of Statistics.
Textile mills buy the most while packaging grows fastest
Based on end-use industry, the market is categorized into textile manufacturing, packaging manufacturing, automotive manufacturing and aftermarket and process industries. Textile Manufacturing led with 50.0% of 2025 value because polyester staple fiber and filament are the largest synthetic fibers in the region, and China produced 87.01 million tons of chemical fiber in 2025. Packaging Manufacturing grows fastest at 3.7% a year, because bottle-grade PET plants keep running at high rates to serve export customers. Bottle-grade PET chip exports from China reached 545,000 tons in June 2025 alone, Wankai New Materials reported, citing China Chemical Fiber Network data.
Polyester fiber dominates as coolant uses gain fastest
Based on application, the market is categorized into PET resins, bottles and films, polyester fiber, antifreeze, coolants and HVAC, gas dehydration and resins and solvents. Polyester Fiber led with 54.0% of 2025 value because filament and staple lines run near full rates, with filament operating rates averaging 92% in the third quarter of 2025, China Textile Leader reported. Antifreeze, Coolants and HVAC grows fastest at 4.2% a year, as battery packs, power electronics and cabin heat pumps in electric models add glycol-water coolant loops. Chinese new energy vehicle output rose 29% to 16.626 million units in 2025, according to the China Association of Automobile Manufacturers.
Ethylene oxide hydrolysis leads while coal syngas gains fastest
Based on technology, the market is categorized into conventional EO hydrolysis, catalytic EO conversion, coal-derived syngas conversion and bio-based glycol conversion. Conventional EO Hydrolysis led with 69.0% of 2025 value because refinery-integrated crackers in East China feed single trains of 800,000 to 1 million tons a year, Deep News reported. Coal-Derived Syngas Conversion grows fastest at 4.1% a year, as new syngas units have grown from 200,000 to 600,000 tons a year per train and resource-backed groups plan larger plants. Bio-based glycol remains a niche, and India Glycols said in November 2023 that bio-MEG volumes had been flat or under pressure.
| Segment Group | Leading Sub-segment | Share, 2025 | Fastest-growing Sub-segment | CAGR, 2026–2035 |
|---|---|---|---|---|
| By Product Type | Monoethylene Glycol | 85.8% | Triethylene Glycol | 4.2% |
| By End-Use Industry | Textile Manufacturing | 50.0% | Packaging Manufacturing | 3.7% |
| By Application | Polyester Fiber | 54.0% | Antifreeze, Coolants and HVAC | 4.2% |
| By Technology | Conventional EO Hydrolysis | 69.0% | Coal-Derived Syngas Conversion | 4.1% |
Feedstock route and freight set the glycol price spread
Glycol trades per metric ton against Chinese port prices, and most term contracts reference those spot quotes plus a premium for grade and delivery. Coal-based cash cost sets the floor in normal years, because syngas plants keep running when prices fall toward their cost. Freight and supply shocks set the ceiling, as in September 2026, when East China spot neared CNY 7,500 per ton after a rally of more than 30%, according to Mysteel. A spot premium above CNY 1,000 per ton meant that buyers with term volume paid well below spot buyers in that period. Producers without coal or ethane cost positions earn margins mainly during disruptions.
| Benchmark or cost basis | Typical price or fee | Basis |
|---|---|---|
| East China spot glycol | Near CNY 7,500 per metric ton on Sept. 17, 2026 | Mysteel, citing OilChem data, September 2026 |
| Coal-based syngas cash cost, China | About CNY 3,675 per metric ton | Deep News via Tiger Brokers, January 2026 |
| Ethylene-route cash cost, China | About CNY 4,230 per metric ton | Deep News via Tiger Brokers, January 2026 |
Request a Free Sample
Fill in your details and we'll send you a free sample report.
- Sample data tables & charts
- Research methodology
Polyester, bottle resin and vehicle output pull volume
Polyester manufacturing scale sets the base load
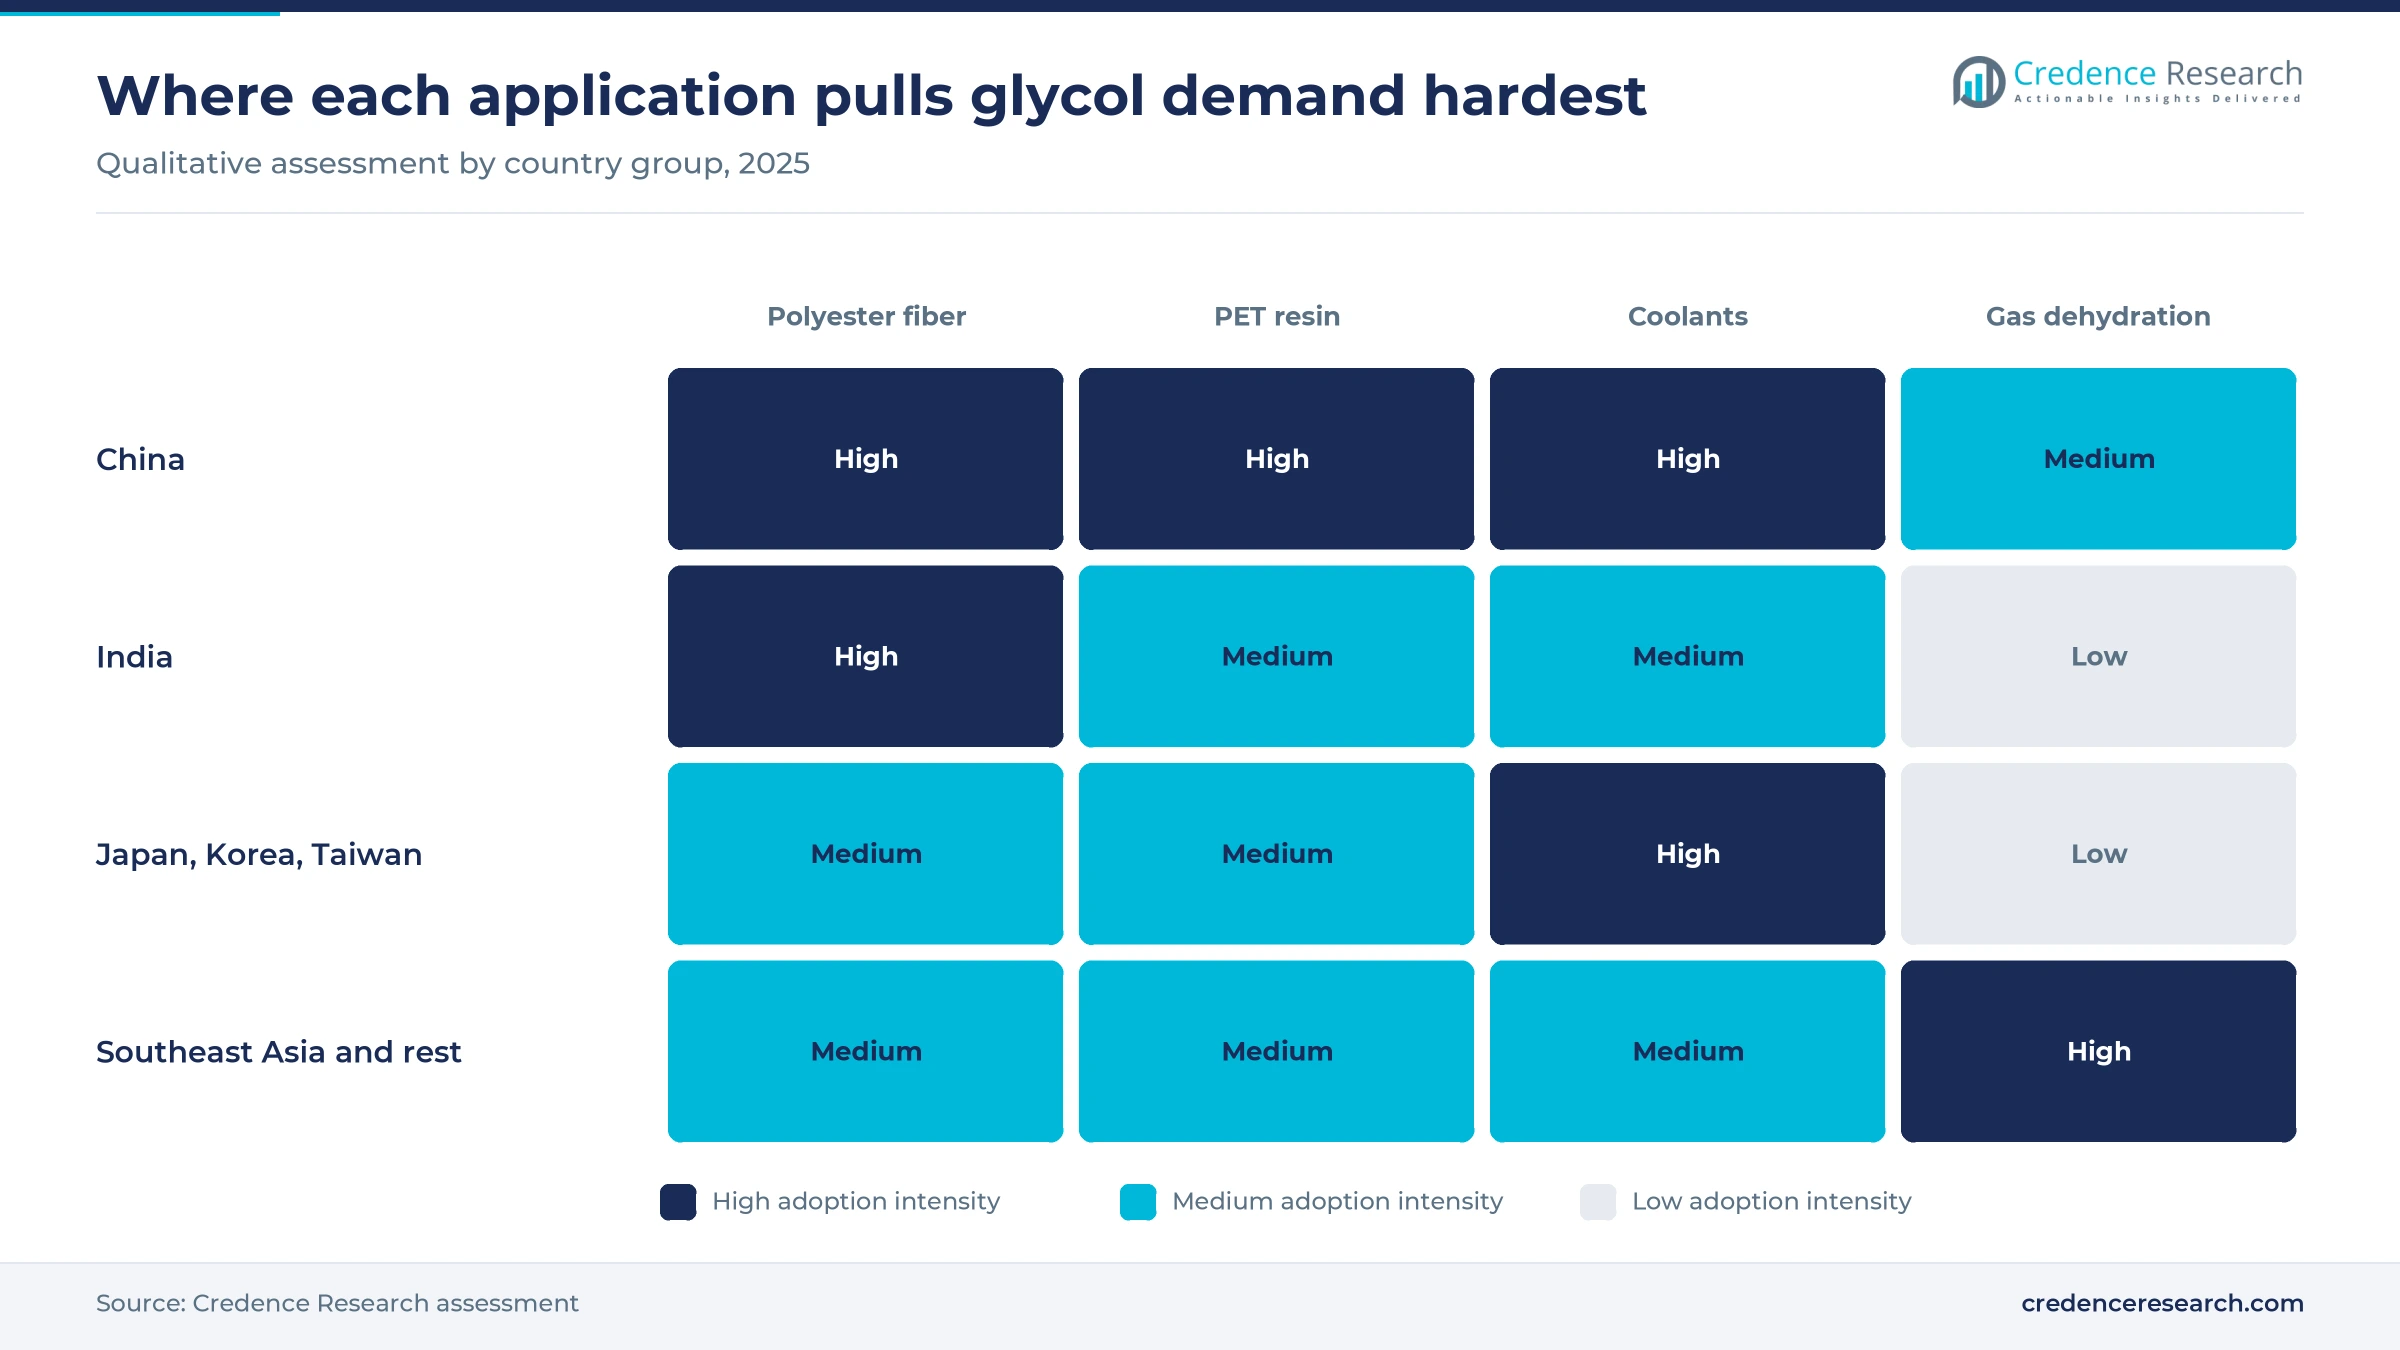
Polyester capacity in China absorbs most regional glycol, because each ton of fiber, filament or resin consumes roughly a third of a ton of monoethylene glycol. China produced 87.01 million tons of chemical fiber in 2025, up 4.9%, according to the National Bureau of Statistics. Polyester exports grew 15.2% in 2025 to date, mainly to Southeast Asia, Deep News reported in December 2025. Chinese producers also added about 4.7 million tons of polyester capacity between January and September 2025, China Textile Leader reported. Integrated groups that run their own glycol and polyester fiber lines capture this volume first, while merchant sellers compete for spot demand at thinner margins.
Qualified packaging demand favors fiber-grade supply
Packaging demand reaches glycol producers through bottle-grade resin, which needs fiber-grade purity and stable color to pass food contact and brand-owner approvals. The reaction chemistry fixes demand at about 0.33 tons of monoethylene glycol per ton of PET, so every new bottle line creates a predictable glycol contract. Lotte Chemical paused PET plants in Yeosu and Ulsan with a combined 520,000 tons a year in 2024, BloomingGlobal reported, a sign that bottle resin output is consolidating toward lower-cost Chinese lines. Packaging manufacturing already grows at 3.7% a year in the Credence Research model. Glycol sellers with term contracts at large PET resin plants gain steadier offtake, while sellers of off-spec or industrial grades stay outside this demand.
Vehicle thermal management adds coolant volume
Vehicle output lifts glycol demand through factory-fill coolant, and electric models add loops for batteries, motors and power electronics that conventional cars do not need. Coolant demand follows vehicle output, and China made 34.78 million motor vehicles in 2025, up 9.8%, the National Bureau of Statistics reported. Vehicle exports reached 7.098 million units, up 21.1%, and new energy vehicle exports roughly doubled to 2.615 million, according to the China Association of Automobile Manufacturers. Each exported vehicle leaves the plant filled with coolant, and the aftermarket replaces that fluid through service cycles. Formulators of antifreeze with low-conductivity grades for electric drivetrains gain share, while basic engine coolant blenders compete mainly on price.
India's supply gap pulls glycol from across Asia
India's polyester industry consumes more glycol than its three domestic producers make, which turns the country into a steady importer. Indian demand was expected to reach 3.1 million tons in fiscal 2025-26 against output of 1.94 million tons, the Polyester Textile Apparel Industry Association said in September 2025. About 1.2 million tons a year arrive from Singapore, Qatar and Saudi Arabia, India Sea Trade News reported. The Ministry of Chemicals and Fertilizers rescinded the quality control order on ethylene glycol on Nov. 12, 2025, according to Fibre2Fashion, which reopened the market to suppliers without Indian certification. Exporters in Southeast Asia, China and the Gulf gain the most from this opening.
Coal routes and cracker closures redraw the supply map
Chinese producers shift toward coal and resource-backed syngas
Chinese producers are shifting new glycol capacity toward coal-based syngas plants tied to their own mines, because coal feedstock undercuts ethylene in most price conditions. Syngas units made up 39.85% of Chinese capacity in 2025, and coal-based cost was about CNY 3,675 per ton against about CNY 4,230 for the ethylene route, Deep News reported in January 2026. Hengyi Petrochemical announced in May 2026 a plant in Turpan, Xinjiang, with 2.4 million tons a year of coal-based capacity from the first half of 2028, according to Yicai Global. Tongkun Group's Xinjiang Zhongkun also plans to convert its first gas-based unit to coal and to build its own coal mines. Polyester buyers gain cheaper domestic supply in normal years, while naphtha-based merchant producers lose pricing power.
Cracker consolidation shifts supply away from North Asia
Producers in South Korea, Japan and Taiwan are shifting from volume to restructuring, as Chinese surplus erodes the margin on ethylene and its derivatives. South Korea approved Yeosu Project No. 1 on July 22, 2026, which merges cracker operations, shuts two Yeochun NCC plants and removes 1.39 million tons of naphtha cracking capacity, Korea JoongAng Daily reported. Lotte Chemical's 1.1-million-ton Daesan cracker will halt for three years under a deal approved on Feb. 25, 2026, Hydrocarbon Processing reported. Formosa Petrochemical said in January 2026 that its 700,000-ton No. 1 cracker at Mailiao would stay shut indefinitely. Less ethylene in North Asia leaves glycol units there with tighter feedstock, and importers in the region turn more toward Chinese and Gulf supply.
Opportunity in glycol for chemical recycling of polyester
Chemical recycling of polyester creates a new use for glycol, because glycolysis breaks used PET and fiber back into intermediates that can be repolymerized. Hengyi Petrochemical announced in May 2026 a CNY 1 billion plant in Jingzhou, Hubei, with 300,000 tons a year of recycled polyester intermediates and about 18 months of construction, Yicai Global reported. Costs remain the hurdle, since SK Geo Centric ended a planned PET chemical recycling plant in France after recycled output cost nearly double the market price, BloomingGlobal reported in December 2024. Glycol suppliers sited next to recycled PET projects can sell both make-up glycol and recovery services, and the segment rewards long-term supply agreements over spot sales.
Opportunity in traceable pharmaceutical-grade glycols in India
New Indian drug safety rules open a premium niche for suppliers that can document every batch of glycol and related solvents. The Central Drugs Standard Control Organisation issued two directives on Oct. 27, 2026, covering 10 high-risk solvents including diethylene glycol, propylene glycol and glycerine, Medbound Times reported. Suppliers must register on the ONDLS portal, upload certificates of analysis and wait for a no-objection certificate before distribution. The rules followed the Coldrif syrup case, in which the product reportedly contained 48.6% diethylene glycol. Producers and distributors with certified pharmaceutical grades and digital batch records can charge above industrial prices, while unregistered traders lose access to drug makers.
Hormuz shocks, surplus capacity and trade cases hit margins
Hormuz disruption cuts Gulf supply to Asian buyers
The near closure of the Strait of Hormuz after the conflict escalated in March 2026 cut off much of the Gulf glycol that Asian polyester mills rely on, from a region that shipped about 6.5 million tons of monoethylene glycol in 2025, according to the World Economic Forum. Middle East plants ran at about 37% in early April 2026, Wankai New Materials reported, citing China Chemical Fiber Network data. China's net glycol imports fell to a record low of 113,000 tons in May 2026, Mysteel reported. Non-integrated polyester mills in East China and Indian importers are the most exposed buyers.
Surplus Chinese capacity keeps merchant margins thin
Capacity growth in China has outpaced demand, so many plants run well below nameplate and cut prices to clear output. Chinese capacity reached 31.54 million tons by the end of 2025, yet syngas plants averaged a 58.3% operating rate and ethylene-based plants 63.64% that year, Deep News reported. Another 2.7 million tons of capacity is due in 2026, mostly in the second half, which deepens the surplus, Deep News reported. Merchant naphtha-based producers without polyester outlets carry the weakest margins under these conditions.
Trade remedy uncertainty raises Indian buyer costs
Pending trade remedies in India add cost risk for polyester spinners that rely on imported glycol. The Directorate General of Trade Remedies issued final findings on Sept. 23, 2025, recommending duties of USD 102 to USD 173 per ton on glycol from Gulf countries and Singapore, Fibre2Fashion reported. Textile groups warned that the duty could make glycol about 20% more expensive. Public sources reviewed for this report did not confirm whether the Ministry of Finance imposed the duty.
U.S.-China trade friction scrambles export flows
Trade friction between the U.S. and China has shrunk one source of glycol for Chinese buyers and pushed U.S. sellers toward smaller markets. U.S. glycol accounted for just 3% of Chinese supply by April 2025, one month into reciprocal tariffs, Mysteel reported. Global surplus let other cargoes replace U.S. product quickly, so the tariffs moved trade flows more than prices. U.S. plants owned by Asian groups lose an important export outlet, and Chinese buyers lose a price-setting alternative to Gulf supply.
China consumes nearly three-quarters as India grows fastest
| Country | Value, 2025 (USD billion) | Share, 2025 | CAGR, 2026–2035 |
|---|---|---|---|
| China | 10.28 | 72.0% | 3.1% |
| Japan, South Korea and Taiwan | 1.50 | 10.5% | 1.8% |
| India | 1.28 | 9.0% | 4.5% |
| Southeast Asia and Remaining Asia Pacific | 1.21 | 8.5% | 3.9% |
China leads on integrated polyester and import scale
China held a 72.0% share of 2025 value and grows at 3.1% a year. East China held 46.79% of national glycol capacity in 2025, close to the largest polyester clusters in Zhejiang and Jiangsu, Deep News reported. Imports still rose 16% to 6.3 million tons in the first ten months of 2025, with Saudi Arabia, Canada and Taiwan the main sources, according to General Administration of Customs data. Buyers in China therefore set regional prices, and the coal cost floor noted above limits how far import prices can rise in normal years.
Japan, South Korea and Taiwan lose share to closures
Japan, South Korea and Taiwan held a 10.5% share of 2025 value and grow at 1.8% a year, the slowest pace in the region. Lotte Chemical took its 400,000-ton Yeosu glycol unit offline on Dec. 3, 2024, BloomingGlobal reported. Asahi Kasei, Mitsui Chemicals and Mitsubishi Chemical plan to cut their combined Kurashiki and Takaishi ethylene capacity from 951,000 to 455,000 tons around fiscal 2030, the Yomiuri reported. Polyester and coolant demand remains mature, so value in these countries rests on high-purity grades and exports.
India grows fastest as polyester outruns local output
India held a 9.0% share of 2025 value and is the fastest-growing country at 4.5% a year. Reliance Industries, the largest of three domestic producers, uses nearly 60% of its own glycol output in its polyester chain, Alchempro, a chemical trade portal, reported in September 2025. No new domestic capacity is expected for three to four years, India Sea Trade News reported, so the supply gap described above should persist. Imports therefore set the marginal price, and the trade remedy decision determines how much of that gap Gulf suppliers can fill.
Southeast Asia draws on Malaysian glycol and Chinese yarn
Southeast Asia and the remaining Asia Pacific countries held an 8.5% share of 2025 value and grow at 3.9% a year. PETRONAS Chemicals Glycols produces monoethylene and diethylene glycol in Kertih, Terengganu, which gives Malaysian and regional buyers a local source. The Chinese polyester exports noted above feed weaving and garment plants across the subregion. No official series tracks glycol consumption by Southeast Asian country, so this share rests on Credence Research estimates.
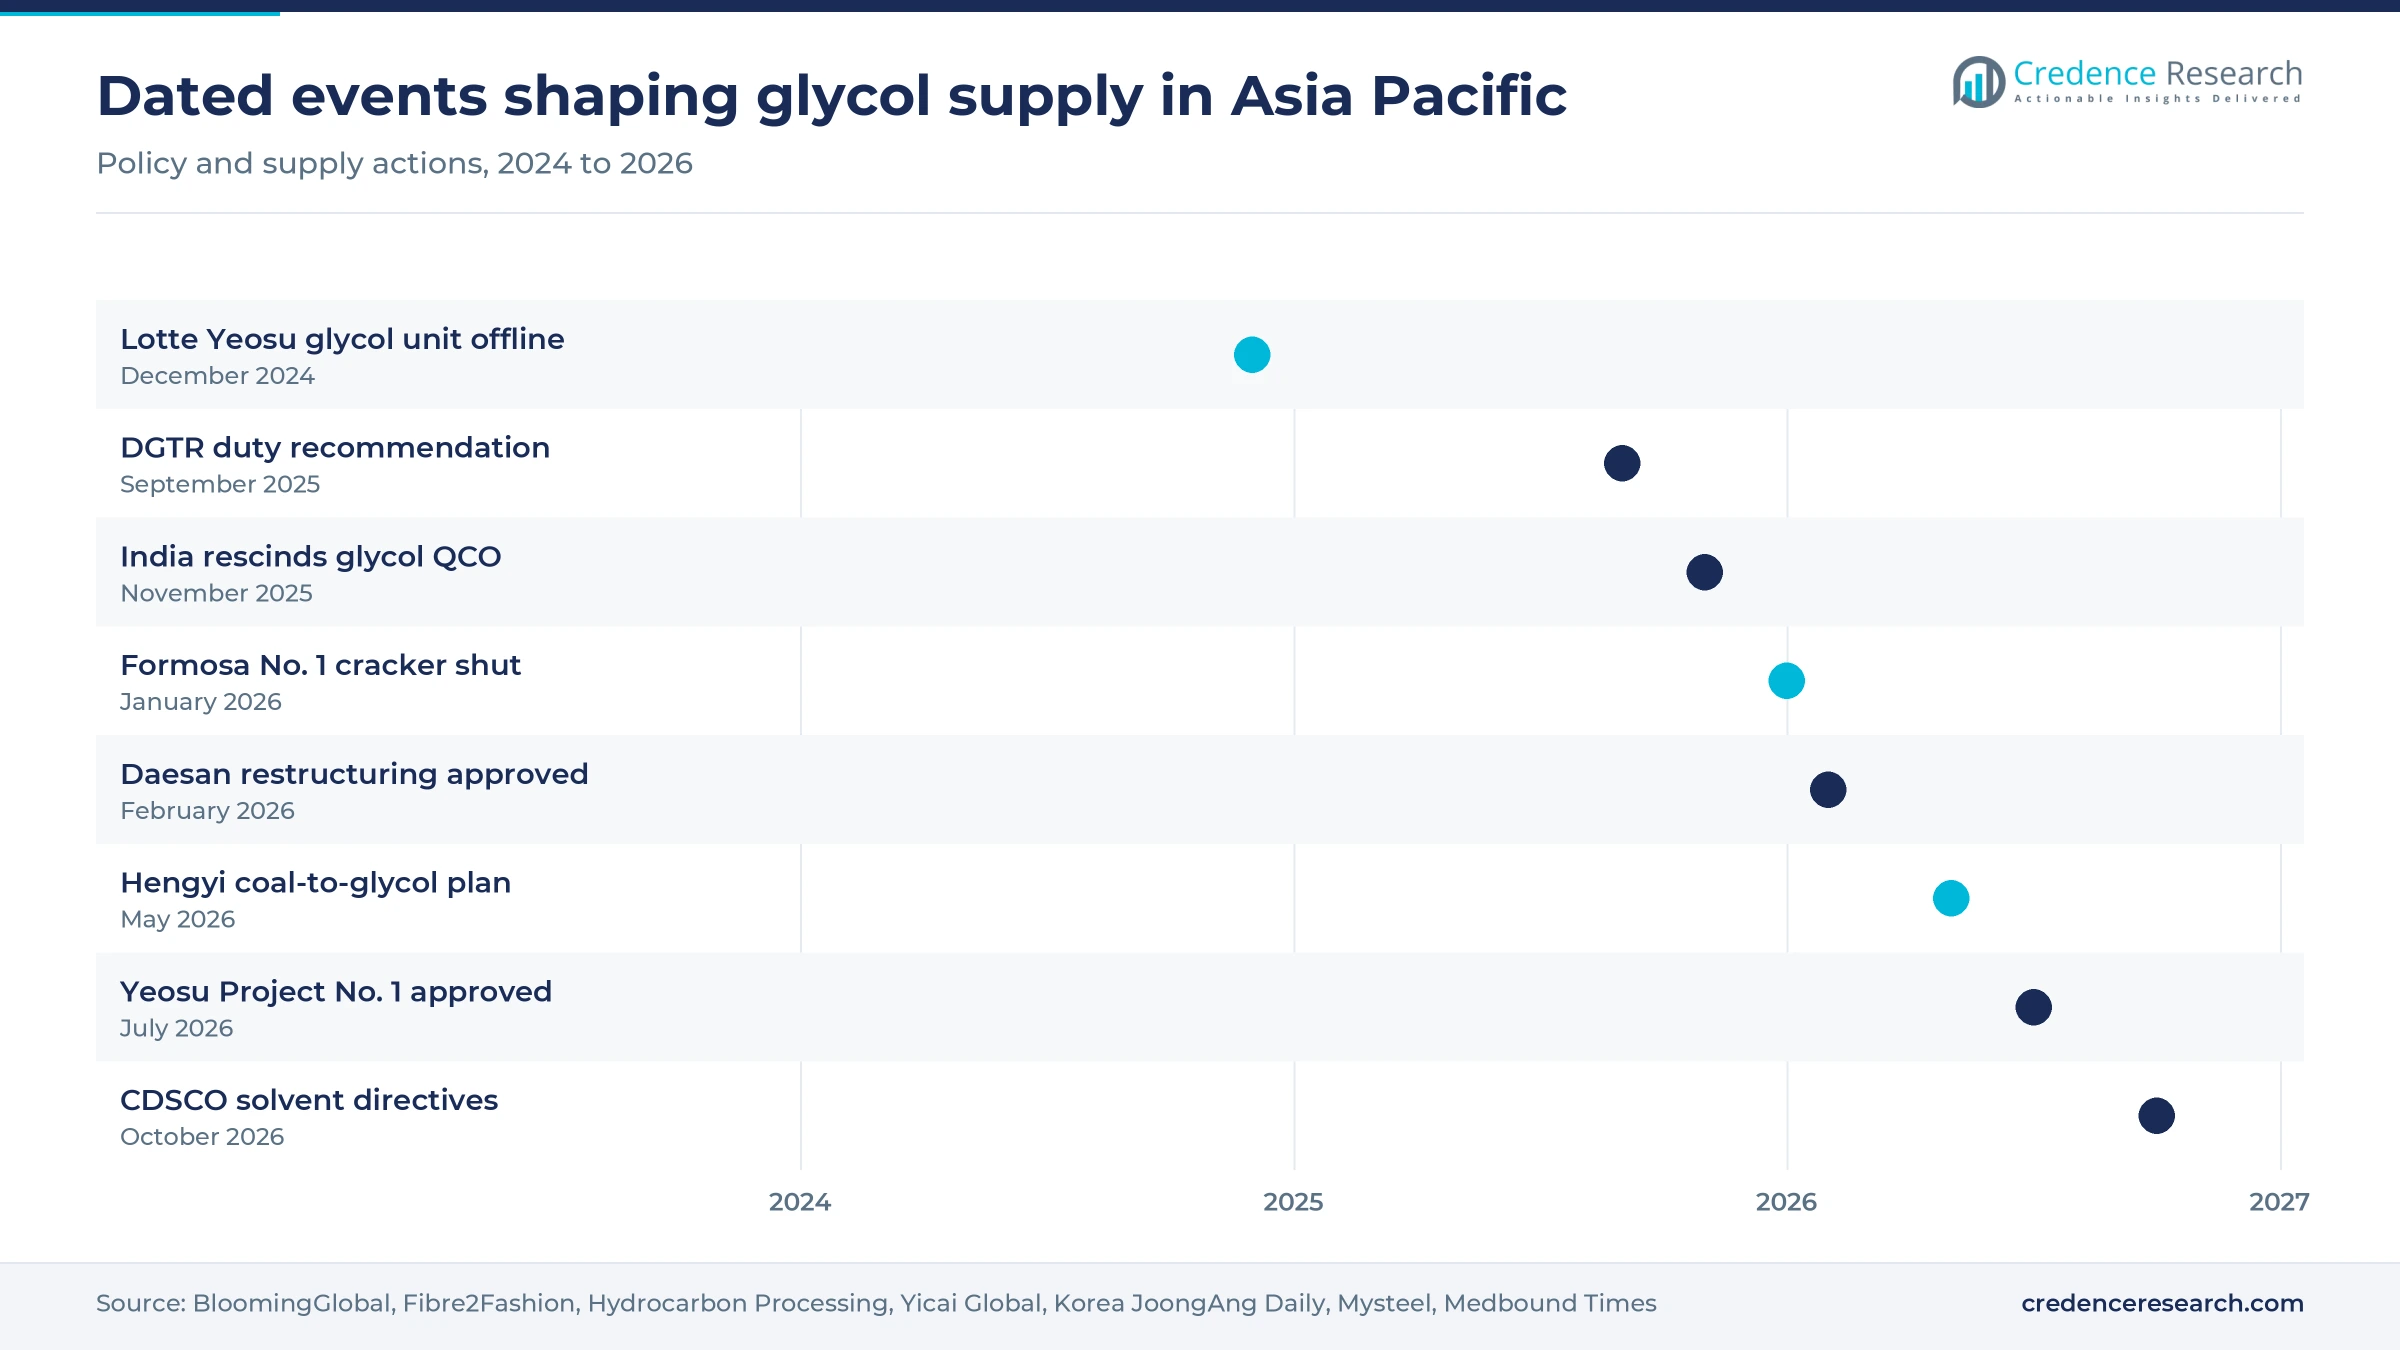
Plant closures, trade rulings and coal projects, 2024-2026
| Development | Status and market relevance |
|---|---|
| In December 2024, Lotte Chemical took its 400,000-ton ethylene glycol unit at Yeosu, South Korea, offline | Indefinite suspension, with no restart plan disclosed |
| In September 2025, India's Directorate General of Trade Remedies recommended duties on glycol imports from Gulf countries and Singapore | Recommendation, with the Ministry of Finance decision not confirmed in public sources |
| In November 2025, India's Ministry of Chemicals and Fertilizers rescinded the quality control order on ethylene glycol | Completed policy change, effective immediately on notification |
| In May 2026, Hengyi Petrochemical announced a 2.4-million-ton coal-to-ethylene glycol plant in Turpan, Xinjiang | Announced plan, with operations expected in the first half of 2028 |
| In July 2026, South Korea approved Yeosu Project No. 1 to merge cracker operations and shut two Yeochun NCC plants | Government approval, with closures and the new joint venture to follow |
Syngas catalysts and selective EO routes change cost curves
- Coal-to-glycol syngas routes convert coal-derived carbon monoxide and hydrogen to glycol through oxalate intermediates, and larger trains now spread fixed costs over more output.
- Catalytic EO conversion routes glycol through ethylene carbonate to raise selectivity to monoethylene glycol, which reduces heavier co-products and lowers water and steam use per ton.
- Refinery-integrated oxide units pair large crackers with oxide and glycol trains next to polyester plants, which cuts logistics costs and secures captive offtake.
- Bio-based ethanol routes dehydrate sugar or grain ethanol to ethylene before oxidation, which gives bottle brand owners a renewable glycol at a higher cost than fossil grades.
Need a Custom Version of This Report?
Tailor the scope, geography, or segments to your exact requirements.
- Custom geography or segment scope
- Direct access to our analyst team
Integration with polyester decides who earns the margin
Competition among regional glycol suppliers sorts them by feedstock position, integration with polyester and access to buyers in China and India. Sinopec and Zhejiang Petroleum & Chemical compete on refinery-integrated ethylene trains in East China and sell to the largest polyester clusters. SABIC competes from the Gulf as one of the largest exporters to China, and it took a final investment decision in January 2024 on a Fujian complex with an ethylene glycol unit scheduled to start in the second half of 2026, according to SABIC. Reliance Industries holds the largest Indian position and uses most of its output in its own polyester chain. Nan Ya Plastics and LOTTE Chemical defend positions in Taiwan and South Korea while restructuring older assets. PETRONAS Chemicals Group serves Southeast Asian buyers from Kertih, and India Glycols adds ethanol-based glycol and specialty derivatives. Buyers weigh supply security and grade consistency more heavily than list price after the 2026 disruption.
Integrated refiners and coal groups dominate supply
Supply is concentrated among refinery-integrated groups and coal chemical producers, and demand is concentrated among polyester makers that often own glycol units themselves. Sinopec's Zhenhai Refining & Chemical, Shenghong Refining & Chemical and Zhejiang Petroleum & Chemical run the largest ethylene-route trains in East China. In India, Reliance Industries, Indian Oil and India Glycols are the only producers. Internal transfers to captive polyester lines take a large share of volume, so the merchant market is thinner than capacity suggests. Entry barriers are highest in feedstock access and scale, and margins sit with producers that own both low-cost feedstock and polyester outlets.
Leading ethylene glycol producers serving the region
| Company | Type | Role in the market |
|---|---|---|
| China Petroleum & Chemical Corporation (Sinopec) | Integrated refiner | Runs ethylene-route glycol trains including Zhenhai Refining & Chemical |
| PetroChina Company Limited | Integrated refiner | Produces ethylene glycol at state-owned refining and petrochemical complexes in China |
| Reliance Industries Limited | Integrated polyester producer | Largest Indian glycol producer, using most output in its own polyester chain |
| Zhejiang Petroleum & Chemical Co., Ltd. (Rongsheng Petrochemical) | Integrated refiner | Runs large ethylene-route glycol trains in East China |
| Saudi Basic Industries Corporation (SABIC) | Exporter and producer | Exports Gulf glycol to China and is building a Fujian glycol unit |
| Nan Ya Plastics Corporation | Integrated producer | Makes glycol at Mailiao in Taiwan for polyester and export buyers |
| LOTTE Chemical Corporation | Petrochemical producer | Korean glycol producer restructuring Yeosu and Daesan assets |
| PETRONAS Chemicals Group Berhad | Petrochemical producer | Makes monoethylene and diethylene glycol in Kertih, Malaysia |
| Jiangsu Eastern Shenghong Co., Ltd. | Integrated refiner and polyester producer | Makes glycol and PTA at its Lianyungang refining and chemical complex |
| India Glycols Limited | Specialty glycol producer | Makes ethanol-based glycols and derivatives in India |
Credence Research view on regional glycol economics
Credence Research's view is that the Asia Pacific ethylene glycol market is moving from capacity-led growth toward cost-led competition. Coal-based plants in China and Gulf exporters now set the price range, while polyester demand sets the volume. Integrated producers that own feedstock and polyester outlets will keep most of the margin, and merchant naphtha-based units will earn returns mainly during supply shocks. India offers the clearest volume opportunity for exporters, provided trade remedies stay moderate. North Asian producers will keep shrinking commodity output and focus on high-purity grades.
Capacity, trade flows and prices anchor the estimate
The report uses 2025 as the base year and forecasts value to 2035. Market values come from the Credence Research model, which links glycol tonnage to polyester, PET resin, vehicle and gas output, then applies prices by grade and region. Country, product, end-use, application and technology splits are Credence Research estimates, because official statistics do not separate glycol consumption by country. Sources include national statistics offices, customs data, industry associations, company releases, government notices and trade press. No interviews or surveys were used to prepare this edition of the report.
Polyester growth and coal supply shape demand to 2035
Through 2035, regional demand for glycol will rest on polyester fiber, bottle resin and vehicle coolant, with gas dehydration and recycling adding smaller volumes. China will remain the center of consumption and supply, although Indian demand should grow faster as polyester output expands ahead of local glycol capacity. Coal-based supply will gain share in China, while North Asian producers shrink commodity output. Price swings will stay larger than volume swings, because Gulf supply security and Chinese capacity discipline remain the main risks to the base case.
Gulf supply and Chinese capacity discipline set the range
The range of outcomes depends mainly on how long Gulf supply stays disrupted and whether China enforces discipline on new glycol capacity. A quick return of Gulf cargoes combined with continued Chinese additions would push prices toward the coal cost floor and lower value growth. Slower capacity additions, steady polyester exports and Indian import growth would lift value. Volume grows in every case, so the spread between scenarios comes mostly from price.
| Scenario | CAGR, 2026–2035 | Value, 2035 | What has to hold |
|---|---|---|---|
| Downside | 2.0% | USD 17.59 billion | Chinese additions continue and prices settle near the coal cost floor through 2030 |
| Base | 3.16% | USD 19.55 billion | Polyester, bottle resin and coolant demand follow recent rates across the region |
| Upside | 4.2% | USD 21.32 billion | Capacity discipline in China and Indian import growth hold prices above cost |
Frequently Asked Questions
How big is the Asia Pacific ethylene glycol market?
Which country leads regional glycol demand?
Which country grows fastest?
Which glycol type leads the market?
How much of Chinese capacity uses coal?
How did the 2026 Middle East disruption affect prices?
What holds the market back?
Who are the main companies in this market?
Table of Content
Chapter 1 Market Segmentation
- 1.1 Segmentation Framework
- 1.1.1 Product and Service Classification
- 1.1.2 Application and End-Use Classification
- 1.1.3 Technology and Solution Classification
- 1.1.4 Customer and Distribution Channel Classification
- 1.1.5 Geographic Segmentation
- 1.1.6 Market Segment Definitions and Boundaries
- 1.2 By Product Type
- 1.2.1 Monoethylene Glycol
- 1.2.2 Diethylene Glycol
- 1.2.3 Triethylene Glycol
- 1.3 By End-Use Industry
- 1.3.1 Textile Manufacturing
- 1.3.2 Packaging Manufacturing
- 1.3.3 Automotive Manufacturing and Aftermarket
- 1.3.4 Process Industries
- 1.4 By Application
- 1.4.1 PET Resins, Bottles and Films
- 1.4.2 Polyester Fiber
- 1.4.3 Antifreeze, Coolants and HVAC
- 1.4.4 Gas Dehydration
- 1.4.5 Resins and Solvents
- 1.5 By Technology
- 1.5.1 Conventional EO Hydrolysis
- 1.5.2 Catalytic EO Conversion
- 1.5.3 Coal-Derived Syngas Conversion
- 1.5.4 Bio-Based Glycol Conversion
- 1.6 By Country
- 1.6.1 China
- 1.6.2 India
- 1.6.3 Japan, South Korea and Taiwan
- 1.6.4 Southeast Asia and Remaining Asia Pacific
Chapter 2 Introduction
- 2.1 Report Objectives and Scope
- 2.2 Product Definition and Industry Terminology
- 2.3 Market Inclusions and Exclusions
- 2.4 Research Process
- 2.4.1 Primary Research and Expert Interviews
- 2.4.2 Secondary Research and Source Review
- 2.4.3 Top-Down and Bottom-Up Estimation
- 2.4.4 Data Triangulation and Verification
- 2.5 Market Size Measurement Basis
- 2.5.1 2025: USD 14.27 billion → 2035: USD 19.55 billion
- 2.6 Historical and Forecast Reference Periods
- 2.6.1 Historical Period: 2018-2025
- 2.6.2 Base Year: 2025
- 2.6.3 Forecast Period: 2025-2035
- 2.7 Research Assumptions and Limitations
Chapter 3 Executive Summary
- 3.1 Market Snapshot and Key Findings
- 3.2 Base-Year Market Size, 2025
- 3.3 Forecast Market Size, 2035
- 3.4 Revenue and Volume Growth Outlook
- 3.5 Key Demand and Supply Indicators
- 3.6 Leading Market Segments
- 3.7 Fastest-Growing Market Opportunities
- 3.8 Regional Performance Highlights
- 3.9 Technology and Industry Transformation
- 3.10 Competitive Landscape Summary
- 3.11 Analyst View and Strategic Implications
Chapter 4 Asia Pacific Ethylene Glycol Market Trends and Developments
- 4.1 Historical Industry Development, 2018-2025
- 4.2 Recent Market Trends and Developments
- 4.3 Demand and Customer Behavior Trends
- 4.4 Technology and Product Innovation
- 4.5 Artificial Intelligence, Automation and Digitalization
- 4.6 Local Manufacturing and Supply Chain Realignment
- 4.7 Industry Partnerships, Mergers and Acquisitions
- 4.8 Sustainability and Circular Economy Developments
- 4.9 Government and Private Sector Investment Trends
- 4.10 Emerging Business Models and Commercialization
- 4.11 Industry Developments and Announcements
Chapter 5 Asia Pacific Ethylene Glycol Market Production, Supply and Demand Analysis
- 5.1 Demand Trend and Consumption Analysis, 2018-2025
- 5.2 Demand Forecast, 2025-2035
- 5.3 Production and Output Trend, 2018-2025
- 5.4 Production and Output Forecast, 2025-2035
- 5.5 Installed Capacity and Capacity Utilization
- 5.6 Company-Wise Production Plants and Statistics
- 5.6.1 Installed Production Capacity
- 5.6.2 Actual Production
- 5.6.3 Planned Capacity and Expansion Targets
- 5.7 Supply Chain Structure and Procurement Trends
- 5.8 Supply-Demand Gap and Bottlenecks
- 5.9 Import Dependence and Sourcing Structure
- 5.10 Contract Manufacturing and Outsourcing
- 5.11 Regional Supply and Demand Concentration
Chapter 6 Asia Pacific Ethylene Glycol Market Pricing Analysis
- 6.1 Pricing Structure and Measurement
- 6.2 Historical Pricing Trends, 2018-2025
- 6.3 Pricing Outlook, 2025-2035
- 6.4 Average Selling Price and Unit Economics
- 6.5 Pricing by Product and Market Segment
- 6.6 Geographic Pricing Differences
- 6.7 Key Input, Energy, Labor and Logistics Costs
- 6.8 Contract Pricing and Purchasing Models
- 6.9 Pricing Sensitivity and Competitive Positioning
- 6.10 Price, Margin and Profitability Implications
Chapter 7 Asia Pacific Ethylene Glycol Market Dynamics
- 7.1 Market Growth Drivers
- 7.1.1 Demand-Side Drivers
- 7.1.2 Technology and Innovation Drivers
- 7.1.3 Infrastructure and Investment Drivers
- 7.1.4 Regulatory and Policy Drivers
- 7.2 Market Restraints
- 7.2.1 Cost and Affordability Constraints
- 7.2.2 Technology and Adoption Barriers
- 7.2.3 Supply Chain and Operational Constraints
- 7.3 Market Challenges
- 7.3.1 Competitive Pressure and Margin Erosion
- 7.3.2 Skills, Infrastructure and Implementation Gaps
- 7.4 Emerging Market Opportunities
- 7.5 Market Dynamics Impact and Time-Horizon Assessment
Chapter 8 Asia Pacific Ethylene Glycol Value Chain Analysis
- 8.1 Industry Value Chain Overview
- 8.2 Upstream Suppliers and Critical Inputs
- 8.3 Technology and Component Providers
- 8.4 Manufacturing or Service Delivery
- 8.5 Distribution, Channel Partners and Integrators
- 8.6 Downstream Applications and End Users
- 8.7 Value Addition and Profit Pools
- 8.8 Vertical Integration and Outsourcing
- 8.9 Supplier Concentration and Risk
- 8.10 Supply Chain Localization and Resilience
Chapter 9 Asia Pacific Ethylene Glycol Market Regulations and Policies
- 9.1 Relevant Laws, Standards and Compliance Frameworks
- 9.2 Product, Service, Safety and Quality Requirements
- 9.3 Government Policies, Incentives and Subsidies
- 9.4 Imports, Exports and Trade Barriers
- 9.5 Public Procurement and Local Content Requirements
- 9.6 Environmental and Sustainability Compliance
- 9.7 Upcoming Policy Changes and Market Implications
Chapter 10 Asia Pacific Ethylene Glycol Market Hotspots and Opportunities
- 10.1 Market Opportunity Mapping and Growth Hotspots
- 10.2 High-Growth Applications and Customer Groups
- 10.3 Underserved Markets and White-Space Opportunities
- 10.4 Emerging Technology and Product Opportunities
- 10.5 New Capacity and Investment Hotspots
- 10.6 Market Entry and Expansion Opportunities
- 10.7 Distribution and Partnership Opportunities
- 10.8 Near-Term and Long-Term Commercial Potential
- 10.9 Opportunity Attractiveness and Execution Risks
Chapter 11 Asia Pacific Ethylene Glycol Market Outlook, 2025-2035
- 11.1 Market Size and Analysis
- 11.1.1 Revenue (Market Measurement: 2025: USD 14.27 billion → 2035: USD 19.55 billion)
- 11.1.2 Market Volume and Quantity Sold
- 11.1.3 Historical Market Size, 2018-2025
- 11.1.4 Base-Year Market Size, 2025
- 11.2 Market Forecast, 2025-2035
- 11.2.1 Revenue Forecast to 2035
- 11.2.2 Volume Forecast to 2035
- 11.2.3 CAGR and Year-on-Year Growth
- 11.2.4 Incremental Revenue Opportunity
- 11.3 Forecast Assumptions and Scenario Analysis
- 11.3.1 Base-Case Forecast
- 11.3.2 Optimistic and Conservative Scenarios
- 11.3.3 Technology, Pricing and Policy Sensitivities
- 11.4 Market Attractiveness and Growth Outlook
Chapter 12 Asia Pacific Ethylene Glycol Market Segmentation and Outlook
- 12.1 Segmentation Summary and Market Shares, 2025
- 12.2 Largest and Fastest-Growing Segments
- 12.3 By Product Type - Market Size and Forecast, 2025-2035
- 12.3.1 Segment Definition and Scope
- 12.3.2 Historical Market Size, 2018-2025
- 12.3.3 Revenue Forecast, 2025-2035
- 12.3.4 Volume Forecast, 2025-2035
- 12.3.5 Base-Year Market Share, 2025
- 12.3.6 Segment CAGR and Growth Drivers
- 12.3.7 Subsegment Market Size and Forecast
- 12.3.7.1 Monoethylene Glycol
- 12.3.7.2 Diethylene Glycol
- 12.3.7.3 Triethylene Glycol
- 12.3.8 Subsegment Pricing and Adoption Trends
- 12.3.9 Leading Suppliers and Competition
- 12.3.10 Regional Demand and Opportunities
- 12.4 By End-Use Industry - Market Size and Forecast, 2025-2035
- 12.4.1 Segment Definition and Scope
- 12.4.2 Historical Market Size, 2018-2025
- 12.4.3 Revenue Forecast, 2025-2035
- 12.4.4 Volume Forecast, 2025-2035
- 12.4.5 Base-Year Market Share, 2025
- 12.4.6 Segment CAGR and Growth Drivers
- 12.4.7 Subsegment Market Size and Forecast
- 12.4.7.1 Textile Manufacturing
- 12.4.7.2 Packaging Manufacturing
- 12.4.7.3 Automotive Manufacturing and Aftermarket
- 12.4.7.4 Process Industries
- 12.4.8 Subsegment Pricing and Adoption Trends
- 12.4.9 Leading Suppliers and Competition
- 12.4.10 Regional Demand and Opportunities
- 12.5 By Application - Market Size and Forecast, 2025-2035
- 12.5.1 Segment Definition and Scope
- 12.5.2 Historical Market Size, 2018-2025
- 12.5.3 Revenue Forecast, 2025-2035
- 12.5.4 Volume Forecast, 2025-2035
- 12.5.5 Base-Year Market Share, 2025
- 12.5.6 Segment CAGR and Growth Drivers
- 12.5.7 Subsegment Market Size and Forecast
- 12.5.7.1 PET Resins, Bottles and Films
- 12.5.7.2 Polyester Fiber
- 12.5.7.3 Antifreeze, Coolants and HVAC
- 12.5.7.4 Gas Dehydration
- 12.5.7.5 Resins and Solvents
- 12.5.8 Subsegment Pricing and Adoption Trends
- 12.5.9 Leading Suppliers and Competition
- 12.5.10 Regional Demand and Opportunities
- 12.6 By Technology - Market Size and Forecast, 2025-2035
- 12.6.1 Segment Definition and Scope
- 12.6.2 Historical Market Size, 2018-2025
- 12.6.3 Revenue Forecast, 2025-2035
- 12.6.4 Volume Forecast, 2025-2035
- 12.6.5 Base-Year Market Share, 2025
- 12.6.6 Segment CAGR and Growth Drivers
- 12.6.7 Subsegment Market Size and Forecast
- 12.6.7.1 Conventional EO Hydrolysis
- 12.6.7.2 Catalytic EO Conversion
- 12.6.7.3 Coal-Derived Syngas Conversion
- 12.6.7.4 Bio-Based Glycol Conversion
- 12.6.8 Subsegment Pricing and Adoption Trends
- 12.6.9 Leading Suppliers and Competition
- 12.6.10 Regional Demand and Opportunities
- 12.7 By Country - Market Size and Forecast, 2025-2035
- 12.7.1 Segment Definition and Scope
- 12.7.2 Historical Market Size, 2018-2025
- 12.7.3 Revenue Forecast, 2025-2035
- 12.7.4 Volume Forecast, 2025-2035
- 12.7.5 Base-Year Market Share, 2025
- 12.7.6 Segment CAGR and Growth Drivers
- 12.7.7 Subsegment Market Size and Forecast
- 12.7.7.1 China
- 12.7.7.2 India
- 12.7.7.3 Japan, South Korea and Taiwan
- 12.7.7.4 Southeast Asia and Remaining Asia Pacific
- 12.7.8 Subsegment Pricing and Adoption Trends
- 12.7.9 Leading Suppliers and Competition
- 12.7.10 Regional Demand and Opportunities
- 12.8 Segment Growth Comparison
- 12.9 Segment Attractiveness and Priority Matrix
Chapter 13 Asia Pacific Ethylene Glycol End-Use and Application Market Outlook
- 13.1 End-Use Industry and Customer Demand Structure
- 13.2 Leading Applications and Customer Groups
- 13.3 End-Use Market Size, Share and Forecast
- 13.4 Major End-Use Industry Deep Dives
- 13.4.1 Customer Requirements and Use Cases
- 13.4.2 Demand and Replacement Cycles
- 13.4.3 Technical and Regulatory Considerations
- 13.4.4 Purchasing and Procurement Models
- 13.4.5 Leading Vendors and Distribution Channels
- 13.4.6 Forecast and Commercial Opportunities
- 13.5 Emerging Applications and Cross-Segment Demand
- 13.6 End-Use Industry Investment Priorities
Chapter 14 Asia Pacific Ethylene Glycol Geographic Market Outlook, 2025-2035
- 14.1 Regional Market Size and Country-Level Shares, 2025
- 14.2 Country Market Size Comparison, 2025
- 14.3 Country Market Forecasts, 2025-2035
- 14.4 Subregional Industrial and Demand Clusters
- 14.5 Intra-Regional Pricing and Cost Differences
- 14.6 Cross-Border Trade and Supply Networks
- 14.7 Regional Supply and Demand Balances
- 14.8 Country Opportunity Comparison and Prioritization
Note: Every listed country is covered on the structure shown under the first country.
Chapter 15 Asia Pacific Ethylene Glycol Technology, Innovation and Sustainability Outlook
- 15.1 Technology Landscape and Maturity
- 15.2 Product, Process and Service Innovation
- 15.3 AI, Automation and Digital Tools in the Industry
- 15.4 Technology Adoption and Performance Benchmarking
- 15.5 Innovation Pipeline and R&D Investment
- 15.6 Patent and Intellectual Property Trends
- 15.7 Energy Efficiency and Resource Management
- 15.8 Sustainability, Recycling and Circularity
- 15.9 Technology Roadmap, 2025-2035
- 15.10 Risks of Obsolescence and Technology Substitution
Chapter 16 Asia Pacific Ethylene Glycol Market Key Strategic Imperatives
- 16.1 Growth and Market Entry Priorities
- 16.2 High-Return Products and Segments
- 16.3 Pricing, Profitability and Cost Optimization
- 16.4 Technology Investment and Product Differentiation
- 16.5 Supply Chain Localization and Resilience
- 16.6 Distribution and Customer Acquisition
- 16.7 Partnership, Acquisition and Capacity Strategy
- 16.8 Regional Expansion Priorities
- 16.9 Short-, Medium- and Long-Term Actions
Chapter 17 Competition Outlook
- 17.1 Industry Competition Characteristics
- 17.2 Market Structure and Concentration
- 17.3 Market Share and Competitive Positioning, 2025
- 17.4 Company-Wise Revenue and Product Benchmarking
- 17.5 Production and Service Capacity Benchmarking
- 17.6 Technology, Pricing and Differentiation
- 17.7 Regional Footprint and Distribution Strength
- 17.8 Mergers, Acquisitions and Strategic Alliances
- 17.9 New Entrants and Competitive Threats
- 17.10 Porter's Five Forces and Industry Attractiveness
- 17.11 Competitive Outlook, 2025-2035
Chapter 18 Company Profiles
- 18.1 Company Coverage and Selection Criteria
- 18.2 China Petroleum & Chemical Corporation (Sinopec)
- 18.2.1 Business Description
- 18.2.2 Company Ownership and Geographic Presence
- 18.2.3 Product and Service Portfolio
- 18.2.4 Manufacturing and Operating Footprint
- 18.2.5 Production Capacity and Expansion Plans
- 18.2.6 Financial Performance and Investment
- 18.2.7 Market Share and Competitive Position
- 18.2.8 Technology and Innovation Capabilities
- 18.2.9 Strategic Alliances or Partnerships
- 18.2.10 Recent Developments
- 18.2.11 Growth Strategy and Outlook
- 18.3 PetroChina Company Limited
- 18.4 Reliance Industries Limited
- 18.5 Zhejiang Petroleum & Chemical Co., Ltd. (Rongsheng Petrochemical)
- 18.6 Saudi Basic Industries Corporation (SABIC)
- 18.7 Nan Ya Plastics Corporation
- 18.8 LOTTE Chemical Corporation
- 18.9 PETRONAS Chemicals Group Berhad
- 18.10 Jiangsu Eastern Shenghong Co., Ltd.
- 18.11 India Glycols Limited
- 18.12 Other Relevant Market Participants
Note: Every listed company is profiled on the structure shown under the first company. The company list is preliminary and may change based on research findings, market developments, data availability and client requirements.
Chapter 19 Disclaimer
- 19.1 Research and Forecast Disclaimer
- 19.2 Data Source and Estimation Limitations
Note: The depth of individual sections depends on data availability for this market. Volume, capacity, trade and other unit-based metrics are included where applicable.

