
Asia-Pacific argon demand tilts from steel toward chip fabs
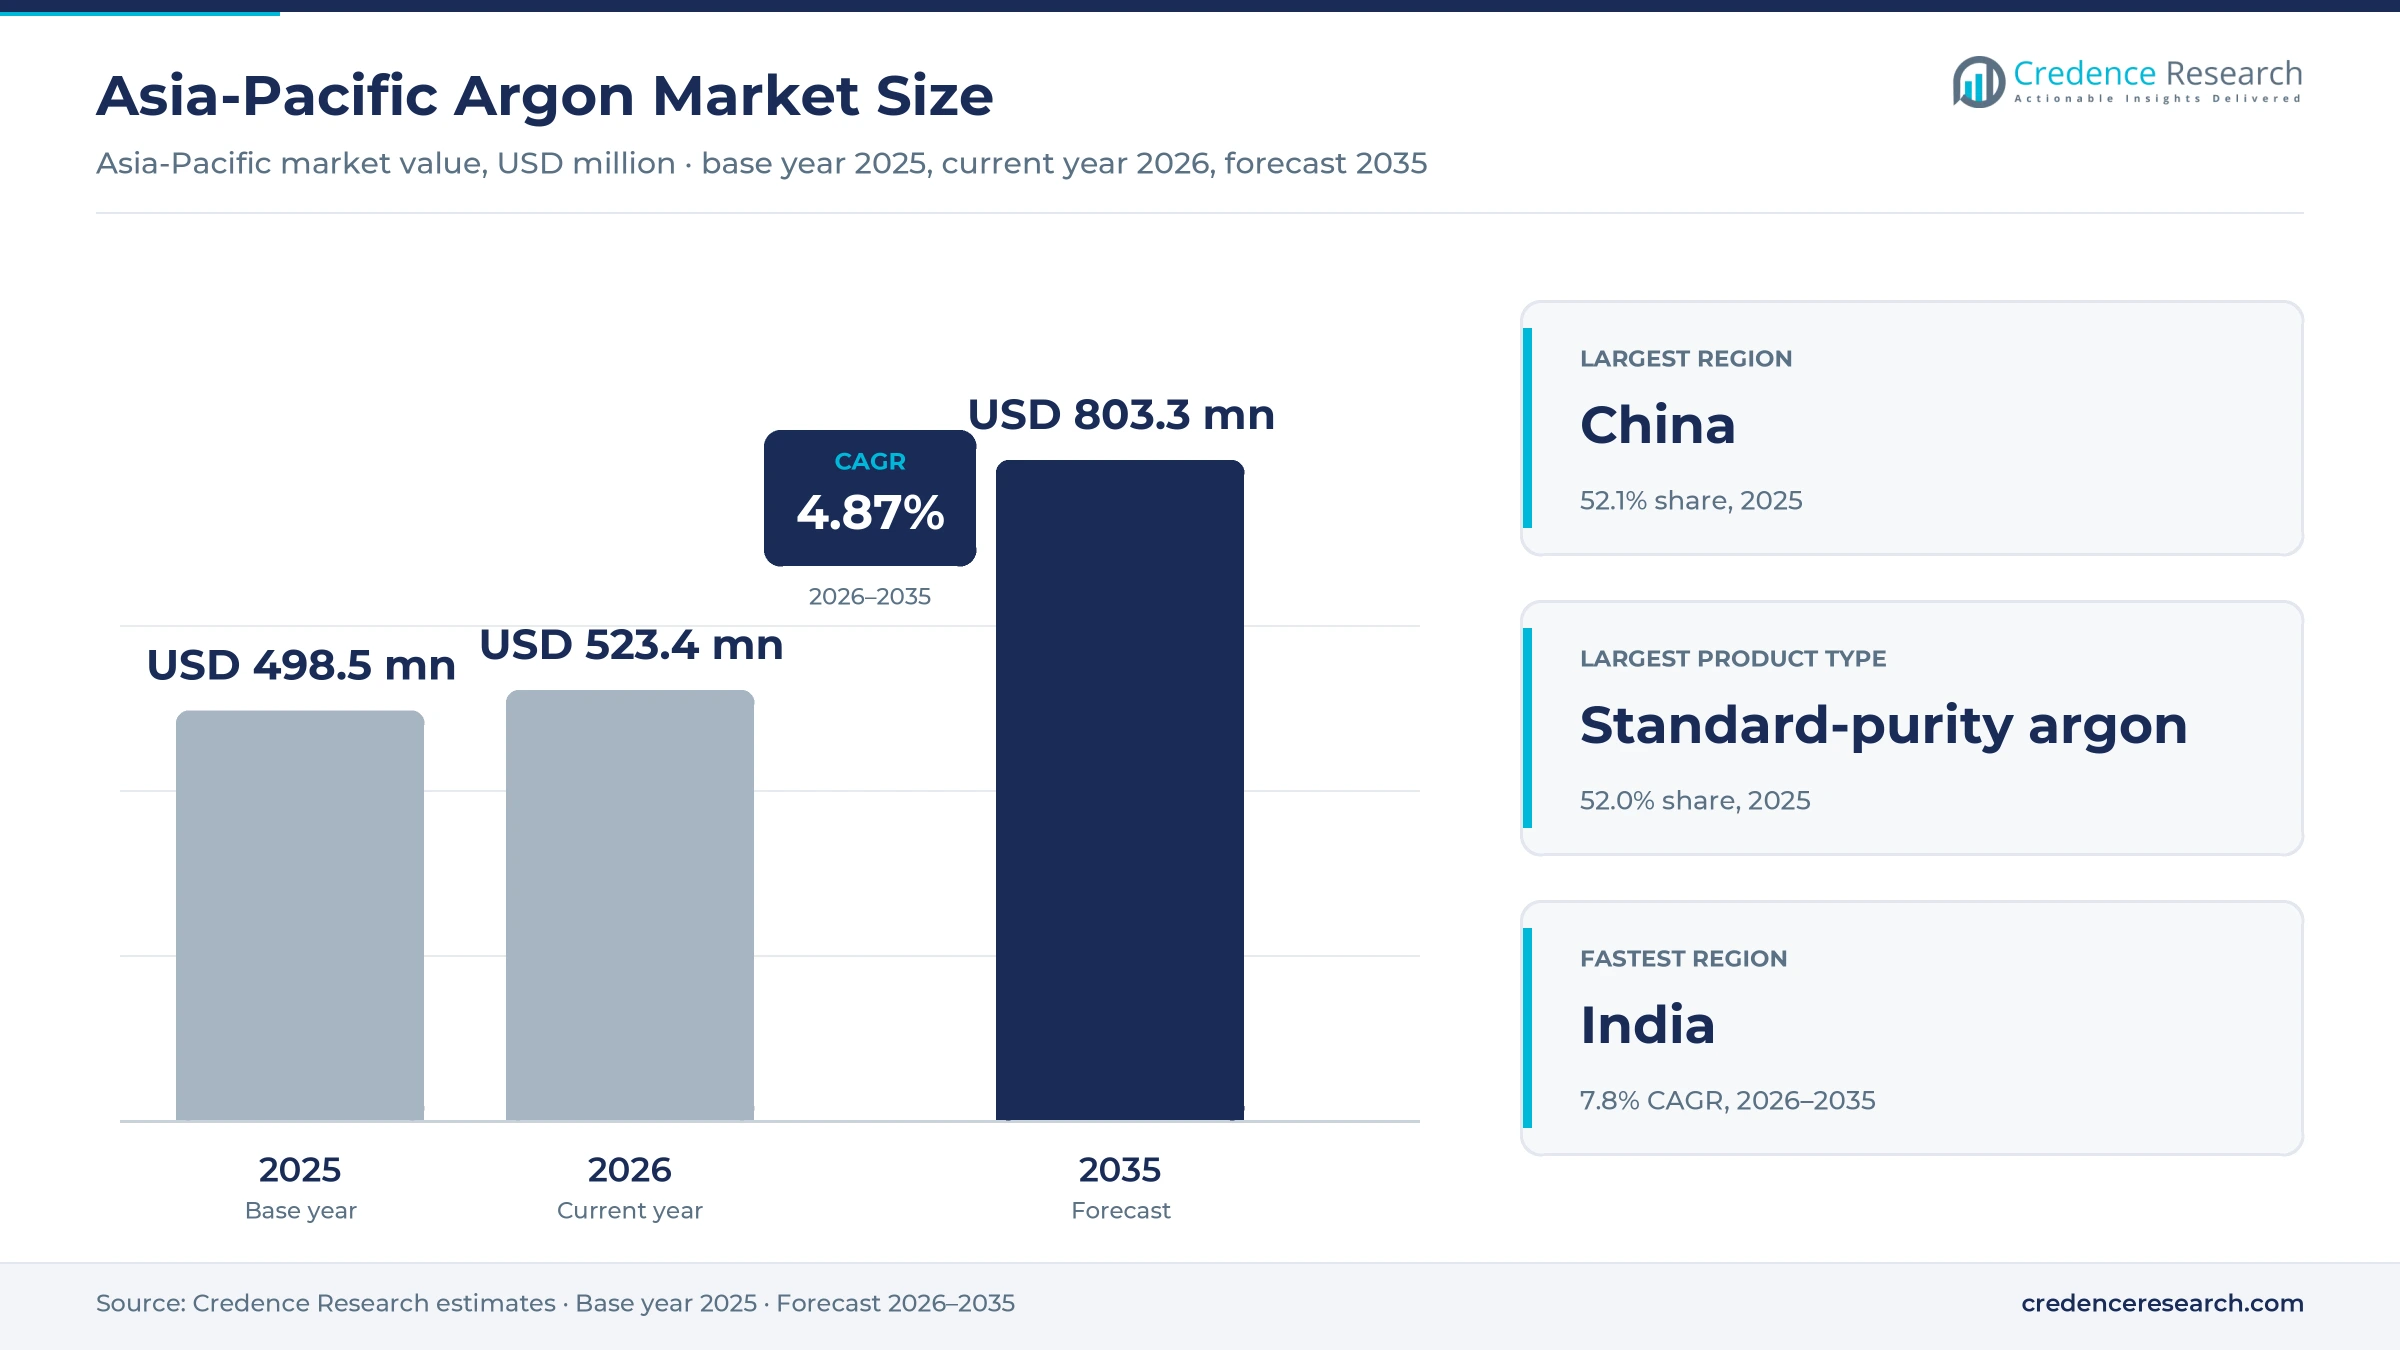
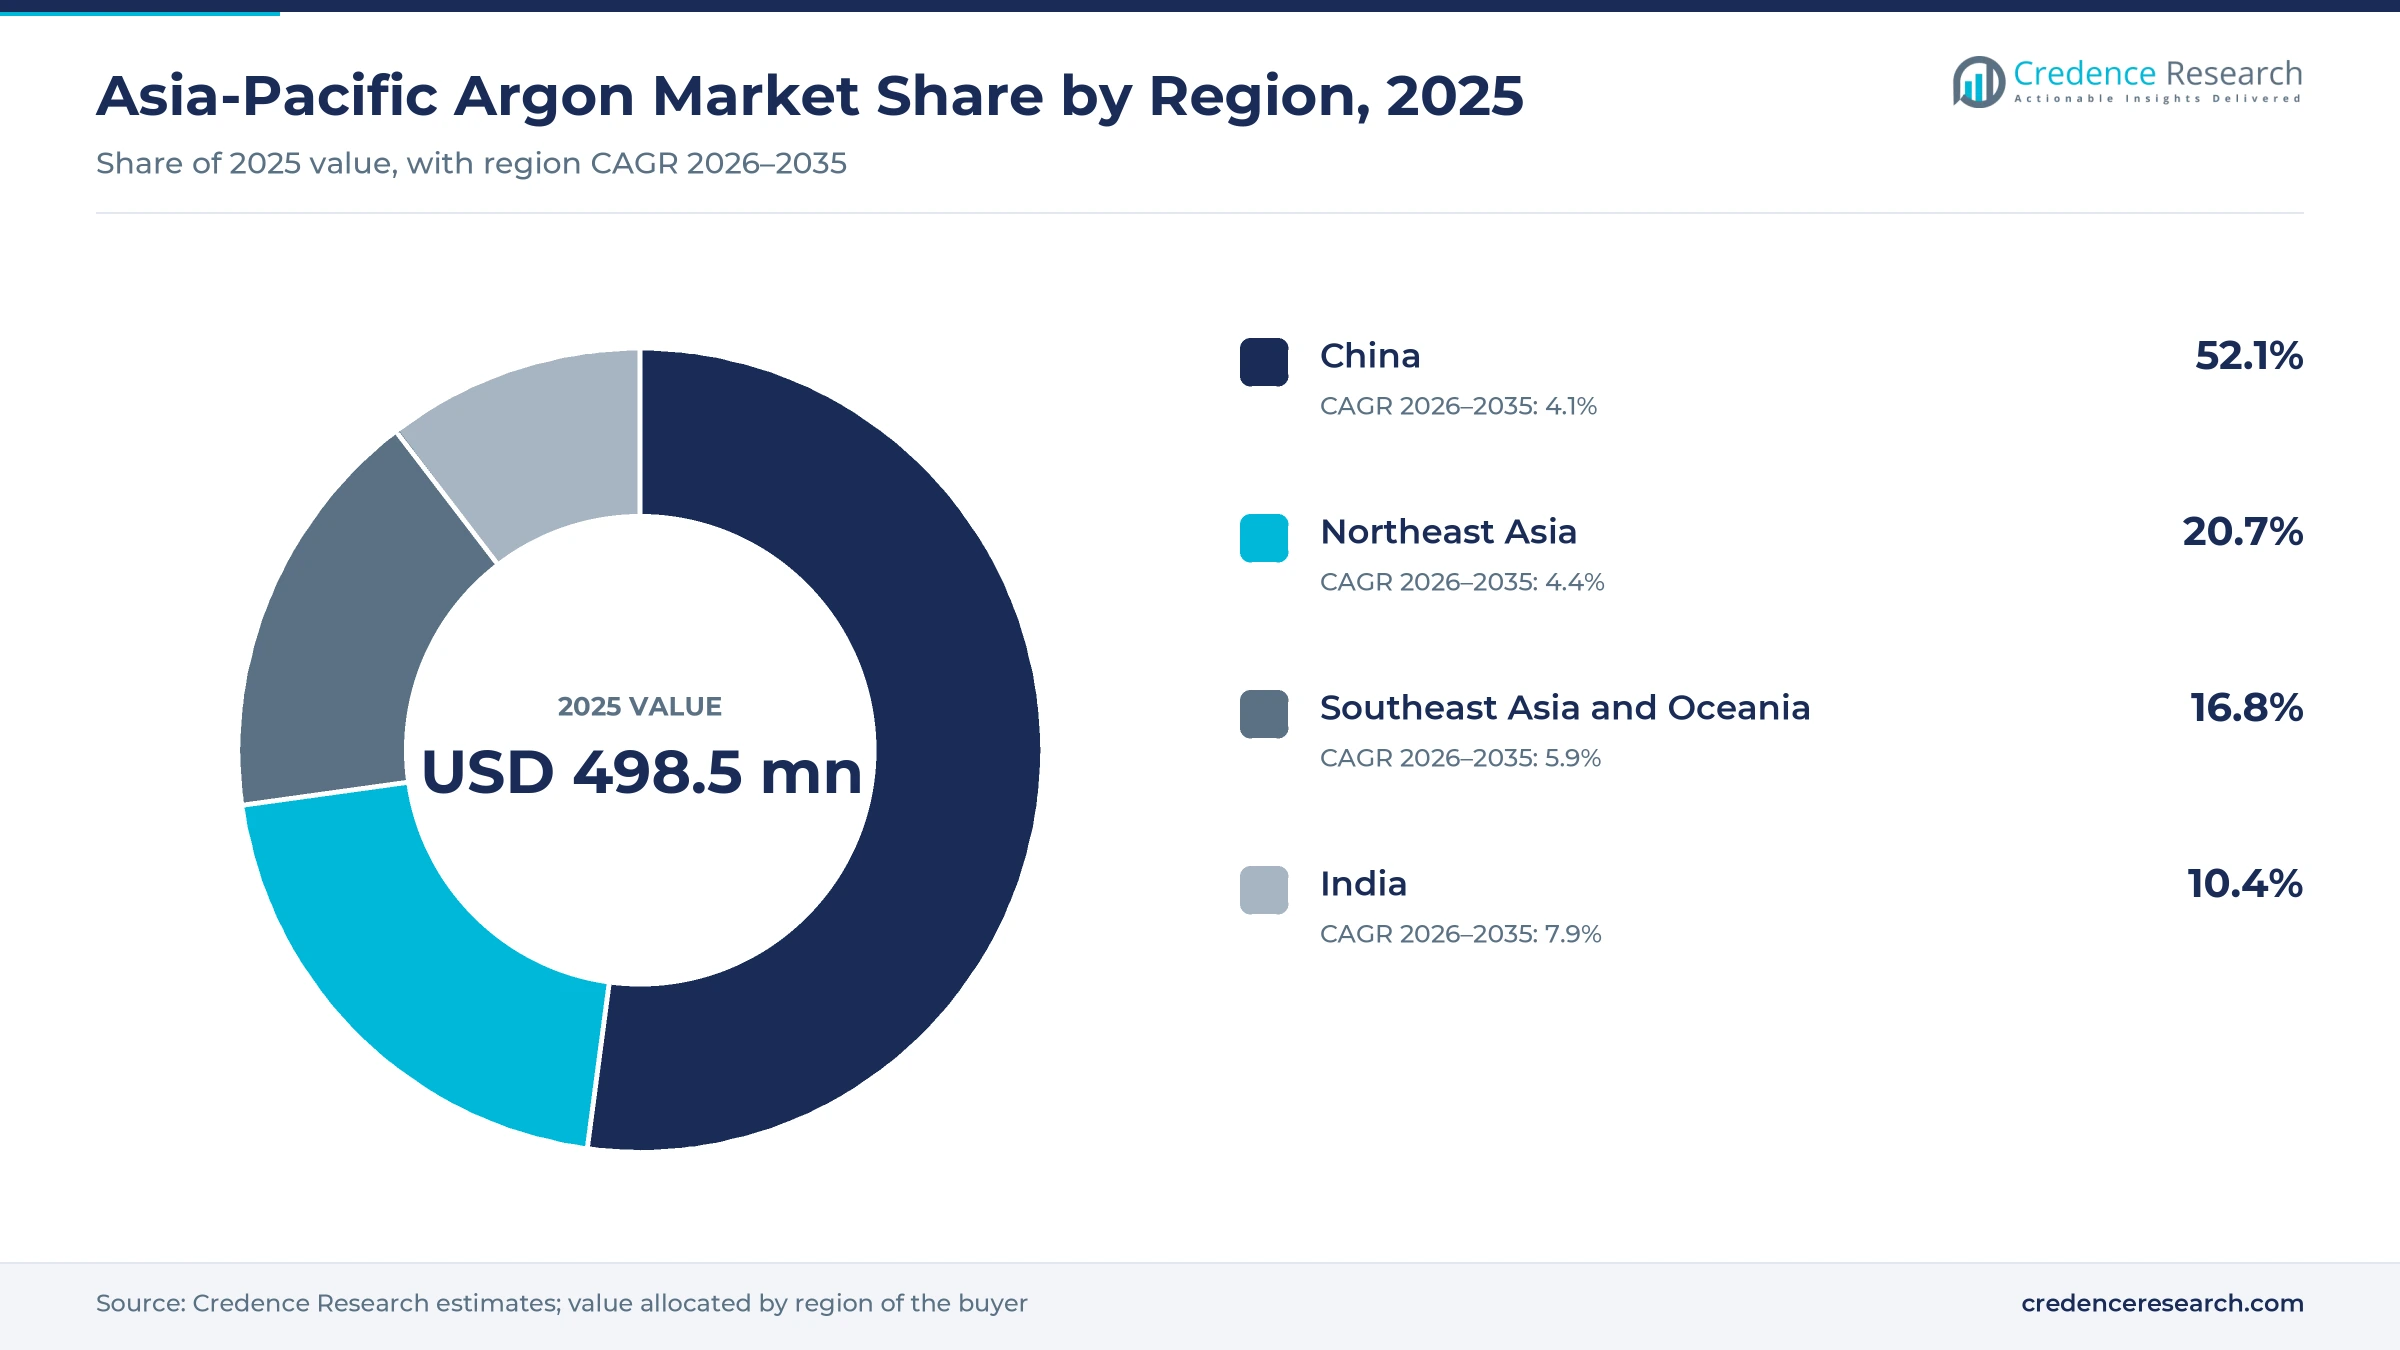
The Asia-Pacific argon market was valued at USD 498.5 million in 2025 and is projected to increase from USD 523.4 million in 2026 to USD 803.3 million by 2035, registering a CAGR of 4.87% during 2026–2035. Demand comes from steel refining and welding, from semiconductor fabs that need argon for sputtering and deposition, and from photovoltaic crystal growth. China held the largest regional share, 52.1% in 2025, because its steel, solar and electronics output dwarfs the rest of the region, while India is the fastest-growing region at 7.8% a year as steel capacity and new chip projects come on line. The supply side is changing as well, since producers now build air separation units under long-term fab contracts in Korea, Japan and India rather than relying on surplus liquid from steelworks. Value growth therefore depends more on purity grades and contract supply than on the volume of standard welding argon.
Cylinder, bulk liquid and on-site argon sales form the scope
The market counts the value of argon sold by producers and distributors across Asia-Pacific in standard, high and ultra-high purity grades. Buyers take it in cylinders and bundles, as bulk liquid delivered by tanker, or through on-site plants and pipelines that a gas company builds and operates at the customer site.
Argon consumed inside a producer's own plants, air separation equipment, cylinders and rare gases such as neon and krypton are excluded from the count. The value chain runs from air separation units at steelworks, smelters and fab sites through liquefiers, tanker fleets and filling stations to steel mills, fabricators, chipmakers and laboratories.
Asia-Pacific Argon Market Insights
- Asia-Pacific argon value rises from USD 498.5 million in 2025 to USD 803.3 million by 2035, a 4.87% CAGR across 2026–2035, as chip-grade contracts and Indian steel add demand.
- China held 52.1% of regional value in 2025, while India grows fastest at 7.8% a year as crude steel output rose 10.4% in 2025, according to worldsteel.
- Standard-purity argon led with 52.0% of 2025 value, since steel refining and welding still consume most of the argon sold in the region.
- Linde agreed in April 2025 to build an eighth on-site air separation unit at Samsung's Pyeongtaek complex, with argon supply due from mid-2026.
- Supply is led by Linde, Air Liquide, Nippon Sanso and Air Products, while INOX Air Products, Messer and Yingde Gases add liquid capacity in India and Southeast Asia.
Welding-grade volume leads as ultra-pure grades gain value
Why does standard-purity argon still lead value?
Based on product type, the market is categorized into standard-purity argon, high-purity argon and ultra-high-purity argon. Standard-purity argon led with 52.0% of 2025 value because steel-linked plants supply most of the region's argon, as INOX Air Products' 2,150-ton-a-day unit at SAIL's Bokaro plant shows with 100 tons a day of argon beside 2,000 tons of gaseous oxygen. Ultra-high-purity argon grows fastest at 6.9% a year as Air Liquide committed 200 million euros in April 2026 to two Hiroshima units supplying ultra-pure argon, nitrogen and oxygen to a chipmaker by the end of 2028.
How do steel and electronics buyers divide argon spending?
Based on end-use industry, the market is categorized into metal manufacturing and fabrication, electronics manufacturing, process manufacturing and specialty end users. Metal manufacturing and fabrication led with 54.0% of 2025 value because the region's steel base remains vast, with China producing 960.8 million tons and India 164.9 million tons of crude steel in 2025, according to worldsteel. Electronics manufacturing grows fastest at 6.6% a year as Air Products described its April 2026 Pyeongtaek agreement, covering argon, nitrogen, oxygen and hydrogen plants for a new Samsung fab, as its largest semiconductor investment to date.
Which supply modes capture the most argon value?
Based on operating model, the market is categorized into merchant packaged supply, merchant bulk liquid supply, and on-site and pipeline supply. Merchant bulk liquid supply led with 41.0% of 2025 value because tanker-delivered liquid serves most mid-sized mills and fabricators, and new plants keep adding it, including the Pengerang unit Air Products agreed in October 2026 to produce more than 600 tons a day of liquid oxygen, nitrogen and argon. On-site and pipeline supply grows fastest at 5.9% a year as Linde builds an air separation unit at Dholera for Tata Electronics' fab, due in the second half of 2027.
How do buyers purchase argon across the region?
Based on sales channel, the market is categorized into direct enterprise supply, producer branch sales and independent distributor sales. Direct enterprise supply led with 47.0% of 2025 value because large mills sign multi-year contracts, as Tata Steel did in October 2024 when Linde agreed to take over two air separation units at Kalinganagar under a long-term supply agreement. Producer branch sales grows fastest at 5.3% a year as producers widen their own liquid and cylinder networks, and Air Liquide says its Huizhou unit announced in April 2026 will serve a base of over 2,800 Greater Bay Area customers.
| Segment Group | Leading Sub-segment | Share, 2025 | Fastest-growing Sub-segment | CAGR, 2026–2035 |
|---|---|---|---|---|
| By Product Type | Standard-purity argon | 52.0% | Ultra-high-purity argon | 6.9% |
| By End-Use Industry | Metal manufacturing and fabrication | 54.0% | Electronics manufacturing | 6.6% |
| By Operating Model | Merchant bulk liquid supply | 41.0% | On-site and pipeline supply | 5.9% |
| By Sales Channel | Direct enterprise supply | 47.0% | Producer branch sales | 5.3% |
Delivered argon prices span a tenfold range by grade
Argon prices depend on purity, lot size and delivery distance more than on production cost, because argon is a co-product of oxygen and nitrogen. Bulk liquid from Chinese surplus sets the regional floor, as the trade values in the table show, while small import lots and cylinder gas carry several times that price. Power costs move the whole curve, as the Japanese price rounds described under challenges show. Ultra-high-purity argon for fabs is priced inside multi-year contracts that bundle several gases and purity guarantees. Buyers of standard grades can therefore negotiate hard, whereas chipmakers pay for reliability rather than tonnage.
| Offer or segment | Typical price or fee | Basis |
|---|---|---|
| Bulk argon exported from China, 2024 average | About USD 500 per 1,000 cubic meters (about USD 280 per ton) | World Bank WITS trade data, 2024 |
| Argon imported into Indonesia, 2024 average | About USD 1,064 per 1,000 cubic meters (about USD 600 per ton) | World Bank WITS trade data, 2024 |
| Small import lots into Malaysia, 2024 average | About USD 5,150 per 1,000 cubic meters (about USD 2,900 per ton) | World Bank WITS trade data, 2024 |
Request a Free Sample
Fill in your details and we'll send you a free sample report.
- Sample data tables & charts
- Research methodology
Fab contracts, Indian steel and new plants drive demand
Qualified gas supply for new semiconductor fabs
Chipmakers now sign argon supply as part of qualified multi-gas contracts, and that shift favors the purest and best-paid grades. Linde agreed in April 2025 to build an eighth on-site air separation unit at Samsung's Pyeongtaek complex, supplying nitrogen, oxygen and argon from mid-2026, and calls the complex its largest electronics site worldwide. SEMI expects global 300 mm fab capacity to reach a record 11.1 million wafers a month by 2028, growing about 7% a year from late 2024. Air Liquide also committed 130 million euros in September 2025 to two Singapore plants for a leading chipmaker, due in 2027. Because each new fab line also needs chipmaking equipment qualified to its gas purity, supplier switching is rare once a contract starts.
Indian steel expansion and commercial gas supply
India is the one large steel producer in the region still adding output quickly, and its new mills buy argon for refining, casting and fabrication. The Ministry of Steel reports provisional crude steel output of 168.42 million tons in fiscal 2025-26, up about 10.7% on the prior year. The National Steel Policy targets 300 million tons of capacity by 2030, so mill-side gas plants will keep multiplying. INOX Air Products commissioned its largest unit at SAIL's Bokaro plant in January 2025, with 100 tons a day of argon among its products. Surplus argon from such units feeds the merchant market around each steel cluster.
Merchant recovery through manufacturing diversification
Merchant producers are moving argon toward electronics and advanced manufacturing as steel and solar demand soften in the largest markets. According to worldsteel, 2025 crude steel output fell 4.4% in China, 4.0% in Japan and 2.8% in South Korea. The China Photovoltaic Industry Association reported wafer output of about 567 GW for January to October 2025, down 6.7%, which cut argon use in crystal growth. Air Liquide responded in April 2026 with an 800-ton-a-day unit at Huizhou producing liquid argon for semiconductor, advanced manufacturing, petrochemical and medical customers from 2027. Suppliers that rebalance their customer mix this way can hold plant loading while steel orders shrink.
New liquid capacity in Southeast Asian electronics hubs
Southeast Asia is adding local liquid capacity as electronics plants move into the region, which shortens delivery routes and widens the customer base. Messer announced in August 2026 a USD 40 million plan in Thai Nguyen province, Vietnam, for an air separation unit producing argon and a 300-ton-a-day liquefier, together adding 900 tons a day of liquid capacity. The liquefier is due in mid-2027 and the air separation unit by the end of 2027, taking Messer's Northern Vietnam liquid capacity to 2,000 tons a day. Yingde Gases, through its NovaAir brand, started a 300-ton-a-day unit producing liquid argon in Selangor, Malaysia. Local liquid output should lower delivered costs for fabricators that now rely on imported tankers and cylinders.
Merchant hubs and rare-gas recovery reshape supply
Shift from captive steel plants to merchant-linked hubs
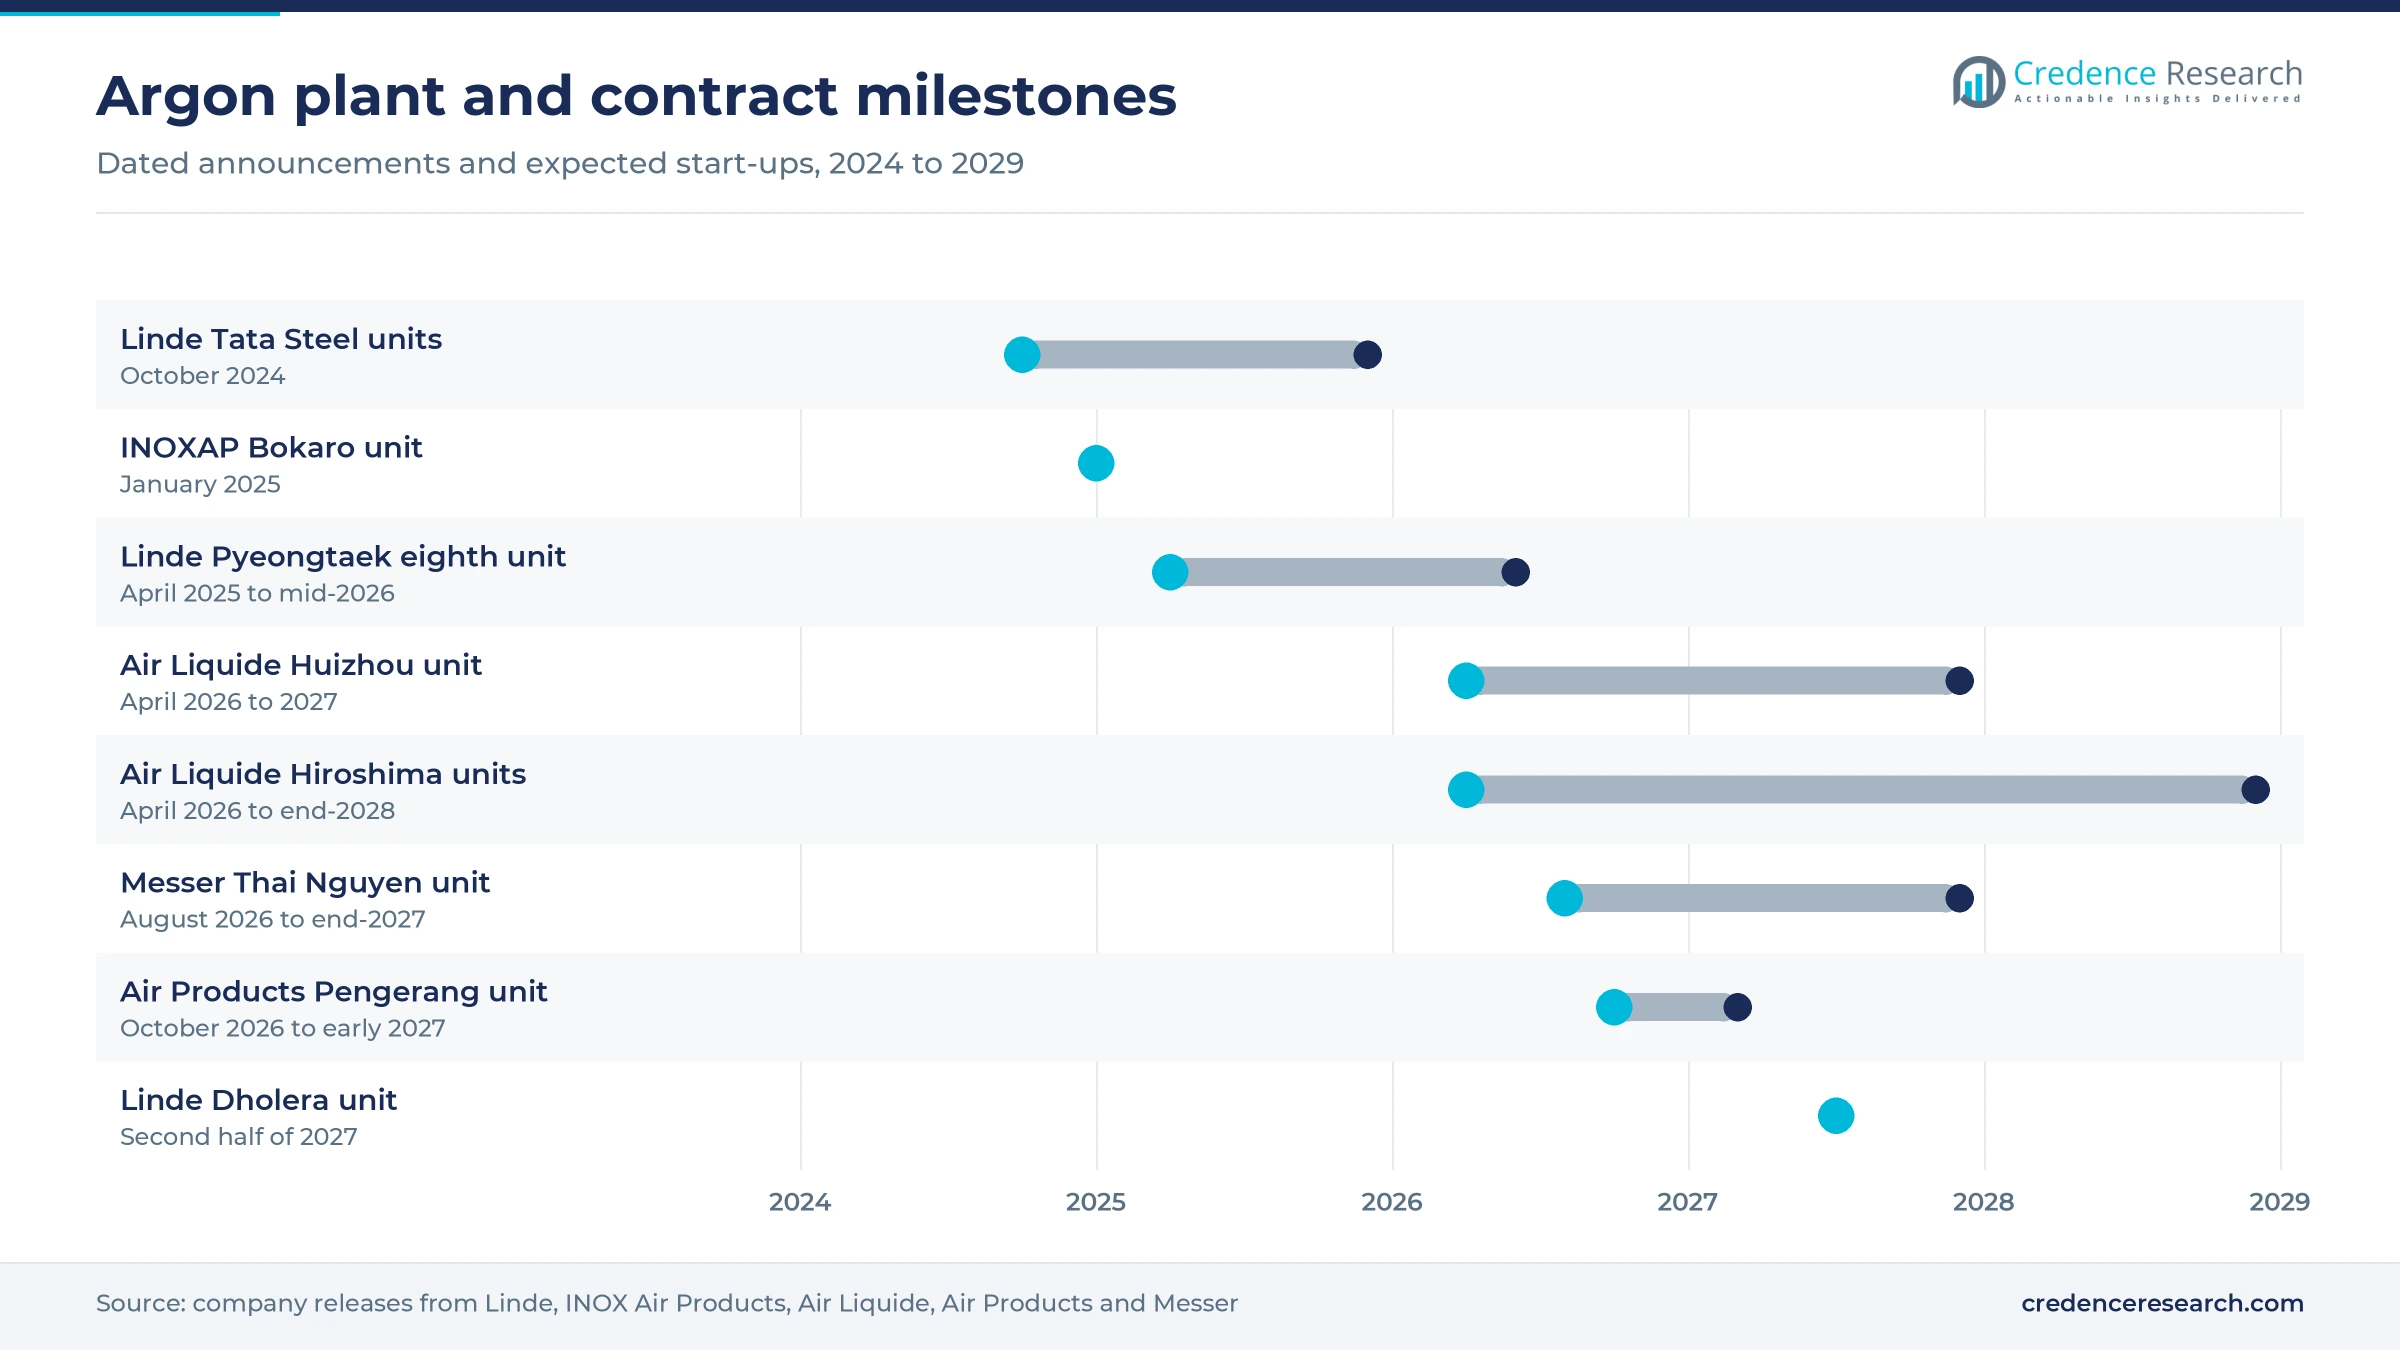
Gas companies increasingly take over steelworks plants and run them as hubs that serve both the mill and nearby merchant buyers. Linde agreed in October 2024 to take over two air separation units under construction at Tata Steel's Kalinganagar site, more than doubling on-site capacity and serving local merchant demand. INOX Air Products operates six large air separation units in Gujarat and reports more than 4,700 tons a day of liquid gas capacity across over 50 locations. Yingde Gases, China's largest independent on-site operator, is taking the same model abroad through NovaAir. Owning the mill plant gives the gas company the surplus liquid argon it then sells by tanker to nearby fabricators.
Rise of rare-gas recovery at steel and smelter plants
Plants that recover argon are increasingly built to capture rarer gases as well, so each ton of air processed earns more. Air Liquide announced in February 2025 a unit at Mitsubishi Materials' Naoshima smelter producing up to 1,400 tons a day of oxygen, plus argon and neon for semiconductor and welding uses from 2027. POSCO Air Solution completed a Gwangyang plant in June 2026 that refines xenon, krypton and neon from steelworks crude gas, covering about 52% of Korea's chip demand for these gases. Like helium, these gases were largely imported, and Northeast Asia, with 20.7% of argon value, leads this trend.
Opening in Indian chip and packaging clusters
India's chip and packaging projects open a new market for high-purity argon in a country that has so far bought mostly welding grades. INOX Air Products announced on Oct. 6, 2025, an INR 500 crore electronic specialty gas hub at Dholera to supply ultra-high-purity nitrogen, oxygen, argon and hydrogen to fabs and assembly units. Linde is building an air separation unit at Dholera for Tata Electronics, expected in the second half of 2027, with argon among its bulk gases. Linde India also secured an 8-acre site in Sanand in September 2026 for a packaging gas facility near Micron, CG Power and Kaynes projects. Suppliers that qualify their purity early should win the longest of these contracts.
Opening to replace imports in Southeast Asia
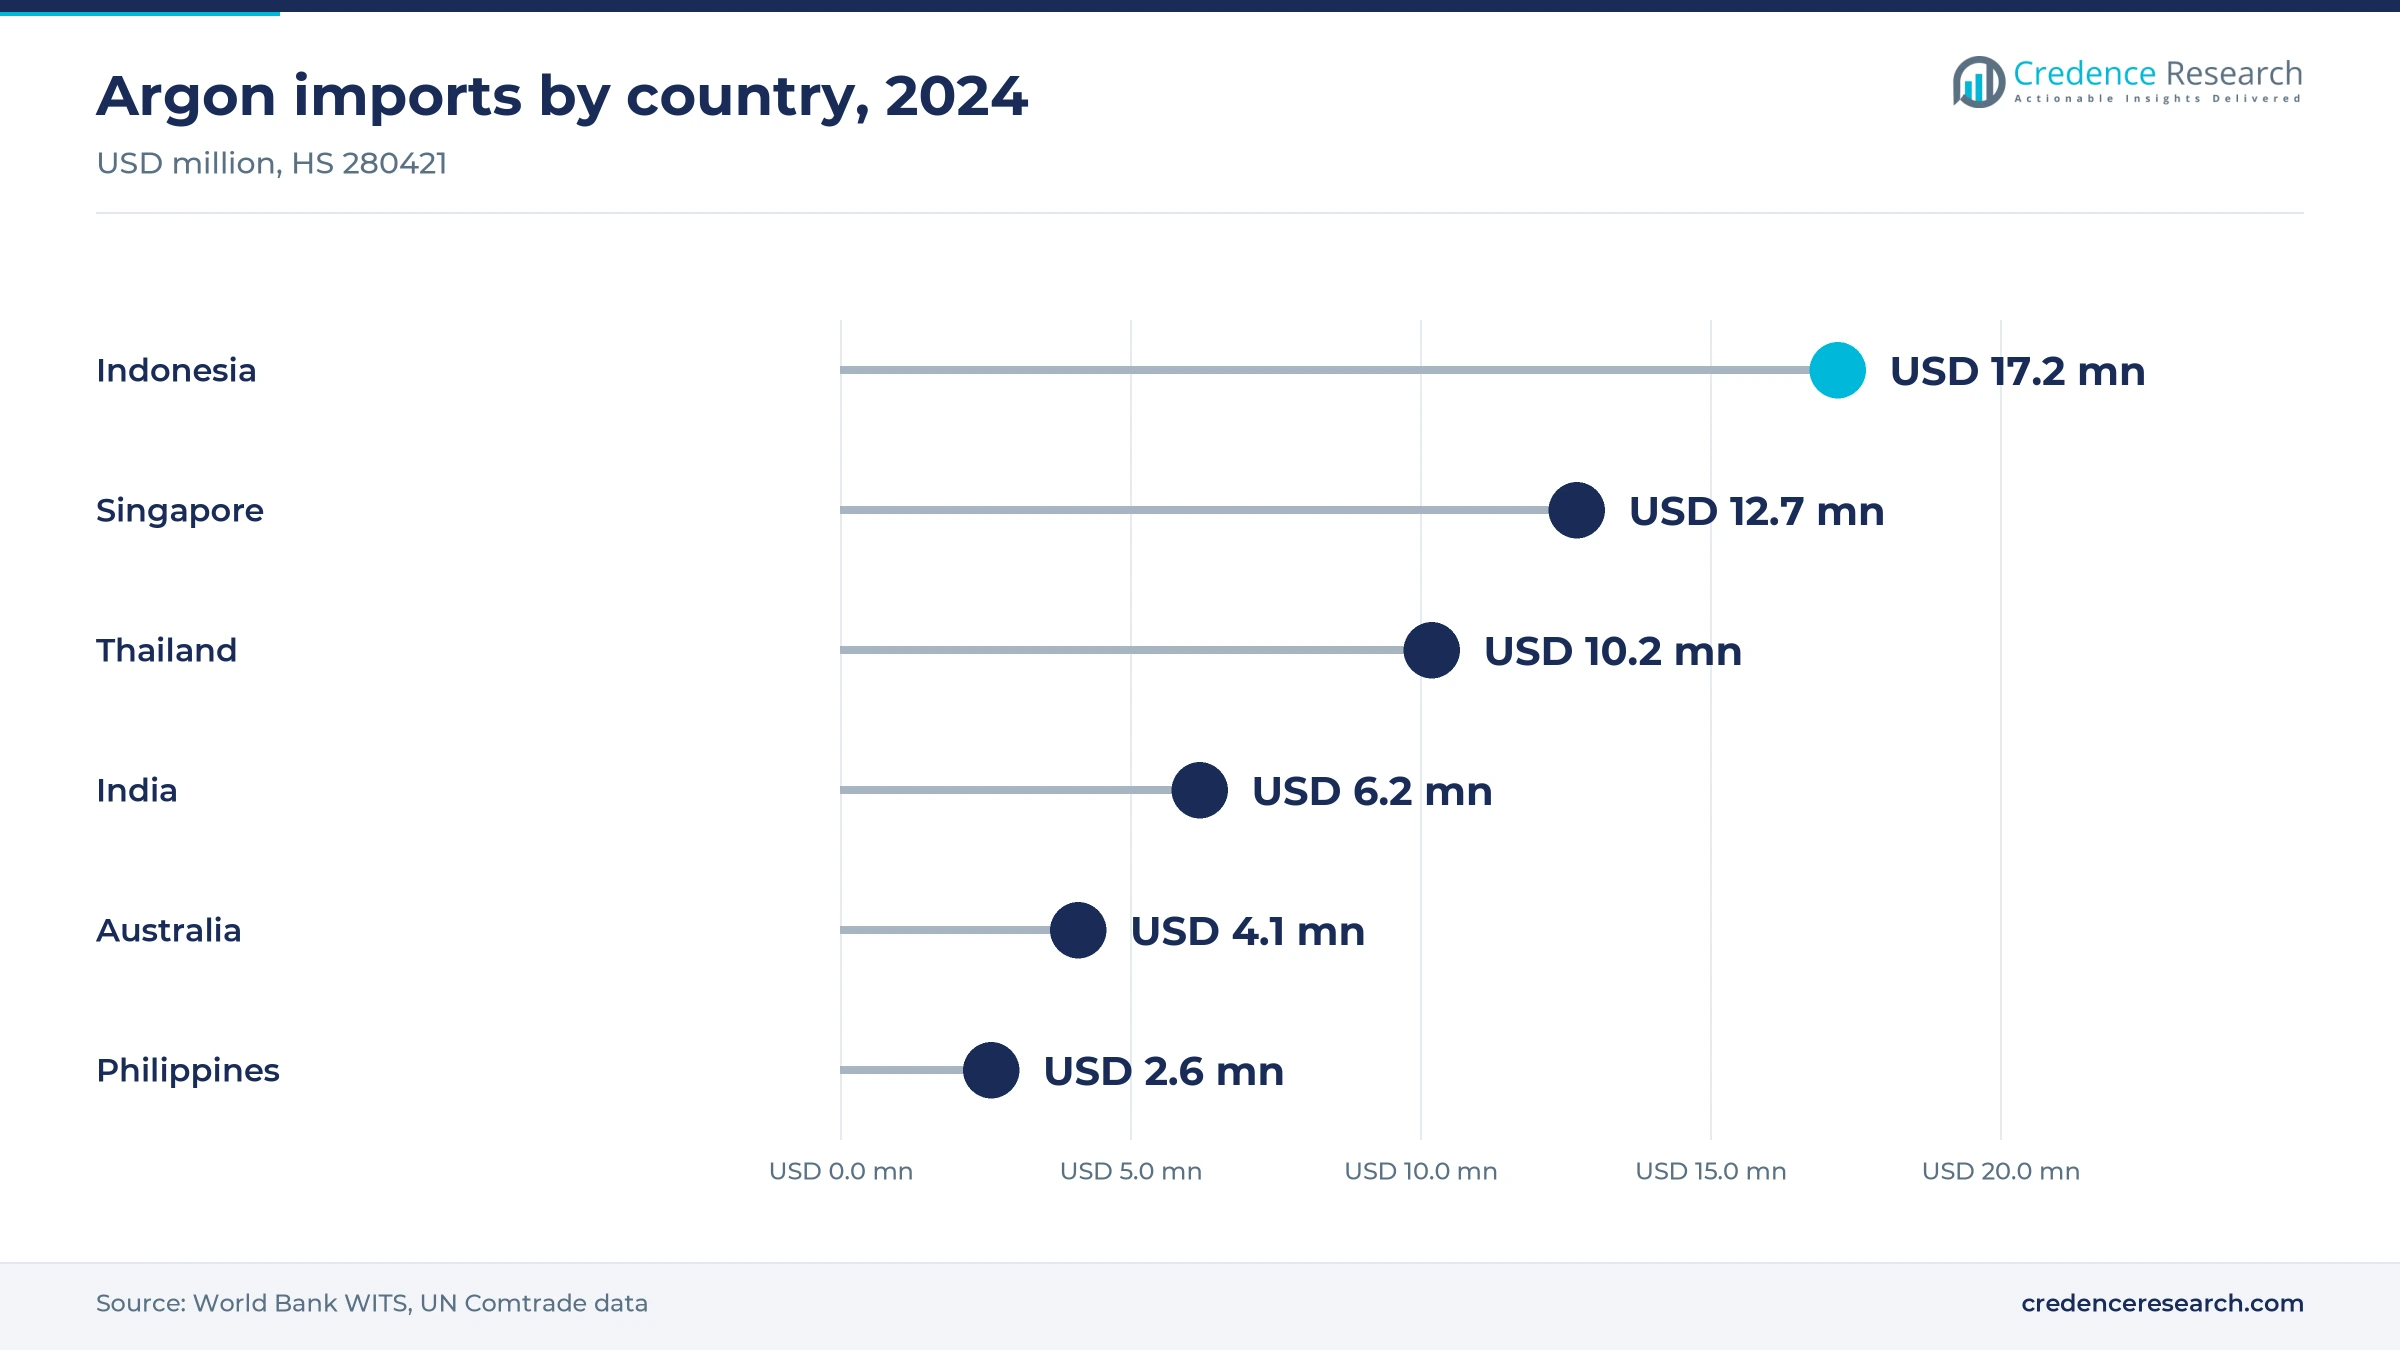
Southeast Asian buyers still import much of their argon, which leaves room for suppliers that can build local liquid plants near industrial estates. World Bank trade data show Indonesia imported about 16.2 million cubic meters of argon, roughly 29,000 tons, worth USD 17.2 million in 2024, while Thailand imported USD 10.2 million and the Philippines USD 2.6 million. Air Products agreed in October 2026 to build an LNG-based unit at Pengerang in Johor, Malaysia, for a PETRONAS Gas and DIALOG joint venture, starting in early 2027. Using regasification cold cuts power use, so such plants can undercut imported liquid on delivered cost. Ports with LNG terminals are the natural sites for this model.
Power costs, Chinese surplus and long fab lead times
Electricity and logistics costs squeeze margins
Argon is made by compressing and liquefying air, so power and delivery costs move straight into prices. Taiyo Nippon Sanso raised liquid bulk prices, including argon, by at least 20% from February 2023 after earlier rises of about 10% and 15% in 2022, citing electricity charges. It then lifted cylinder gas prices by at least 10% from April 2024 on logistics costs, according to The Gas Review. Fabricators that buy small lots feel this most, so supply contracts with indexed power clauses are spreading.
Chinese surplus weighs on regional prices
Surplus Chinese liquid caps prices for standard grades across nearby markets. China exported about 41.9 million cubic meters of argon, roughly 75,000 tons, in 2024 at an average of about USD 280 a ton, according to World Bank trade data, less than half the roughly USD 600 a ton Indonesia paid for its imports. Producers outside China that sell welding-grade liquid face the hardest pricing, while buyers gain bargaining power. Suppliers respond by shifting volume to purity grades and contract customers that imports cannot easily serve.
Long lead times for fab-linked plants
Fab-linked plants tie up capital for years before they earn revenue, and timing depends on the chipmaker. Air Liquide's Hiroshima units are due by the end of 2028, more than two years after the April 2026 agreement, while Air Products' Pyeongtaek plants come online in phases from 2028 through 2030. Any delay in fab ramp-up leaves plants underused and pushes back cash flow. Take-or-pay clauses and staged construction are the main protections suppliers negotiate.
Thin returns in fragmented distribution markets
Smaller national markets with many distributors offer limited scale, and even large producers have stepped back from some of them. Nippon Sanso sold its 68% stake in Bangkok-based distributor Taiyo Gases to Tomoe Shokai on March 31, 2025, after a review of its Asian operations. Exits like this leave fabricators with fewer suppliers in some areas and higher delivered costs. Distributors that combine cylinder routes and service with a single producer partner tend to hold their margins best.
China holds half of value while India grows fastest
| Region | Value, 2025 (USD million) | Share, 2025 | CAGR, 2026–2035 |
|---|---|---|---|
| China | 259.7 | 52.1% | 4.0% |
| Northeast Asia | 103.2 | 20.7% | 4.3% |
| Southeast Asia and Oceania | 83.7 | 16.8% | 5.8% |
| India | 51.8 | 10.4% | 7.8% |
China holds half of value despite weaker steel and solar demand
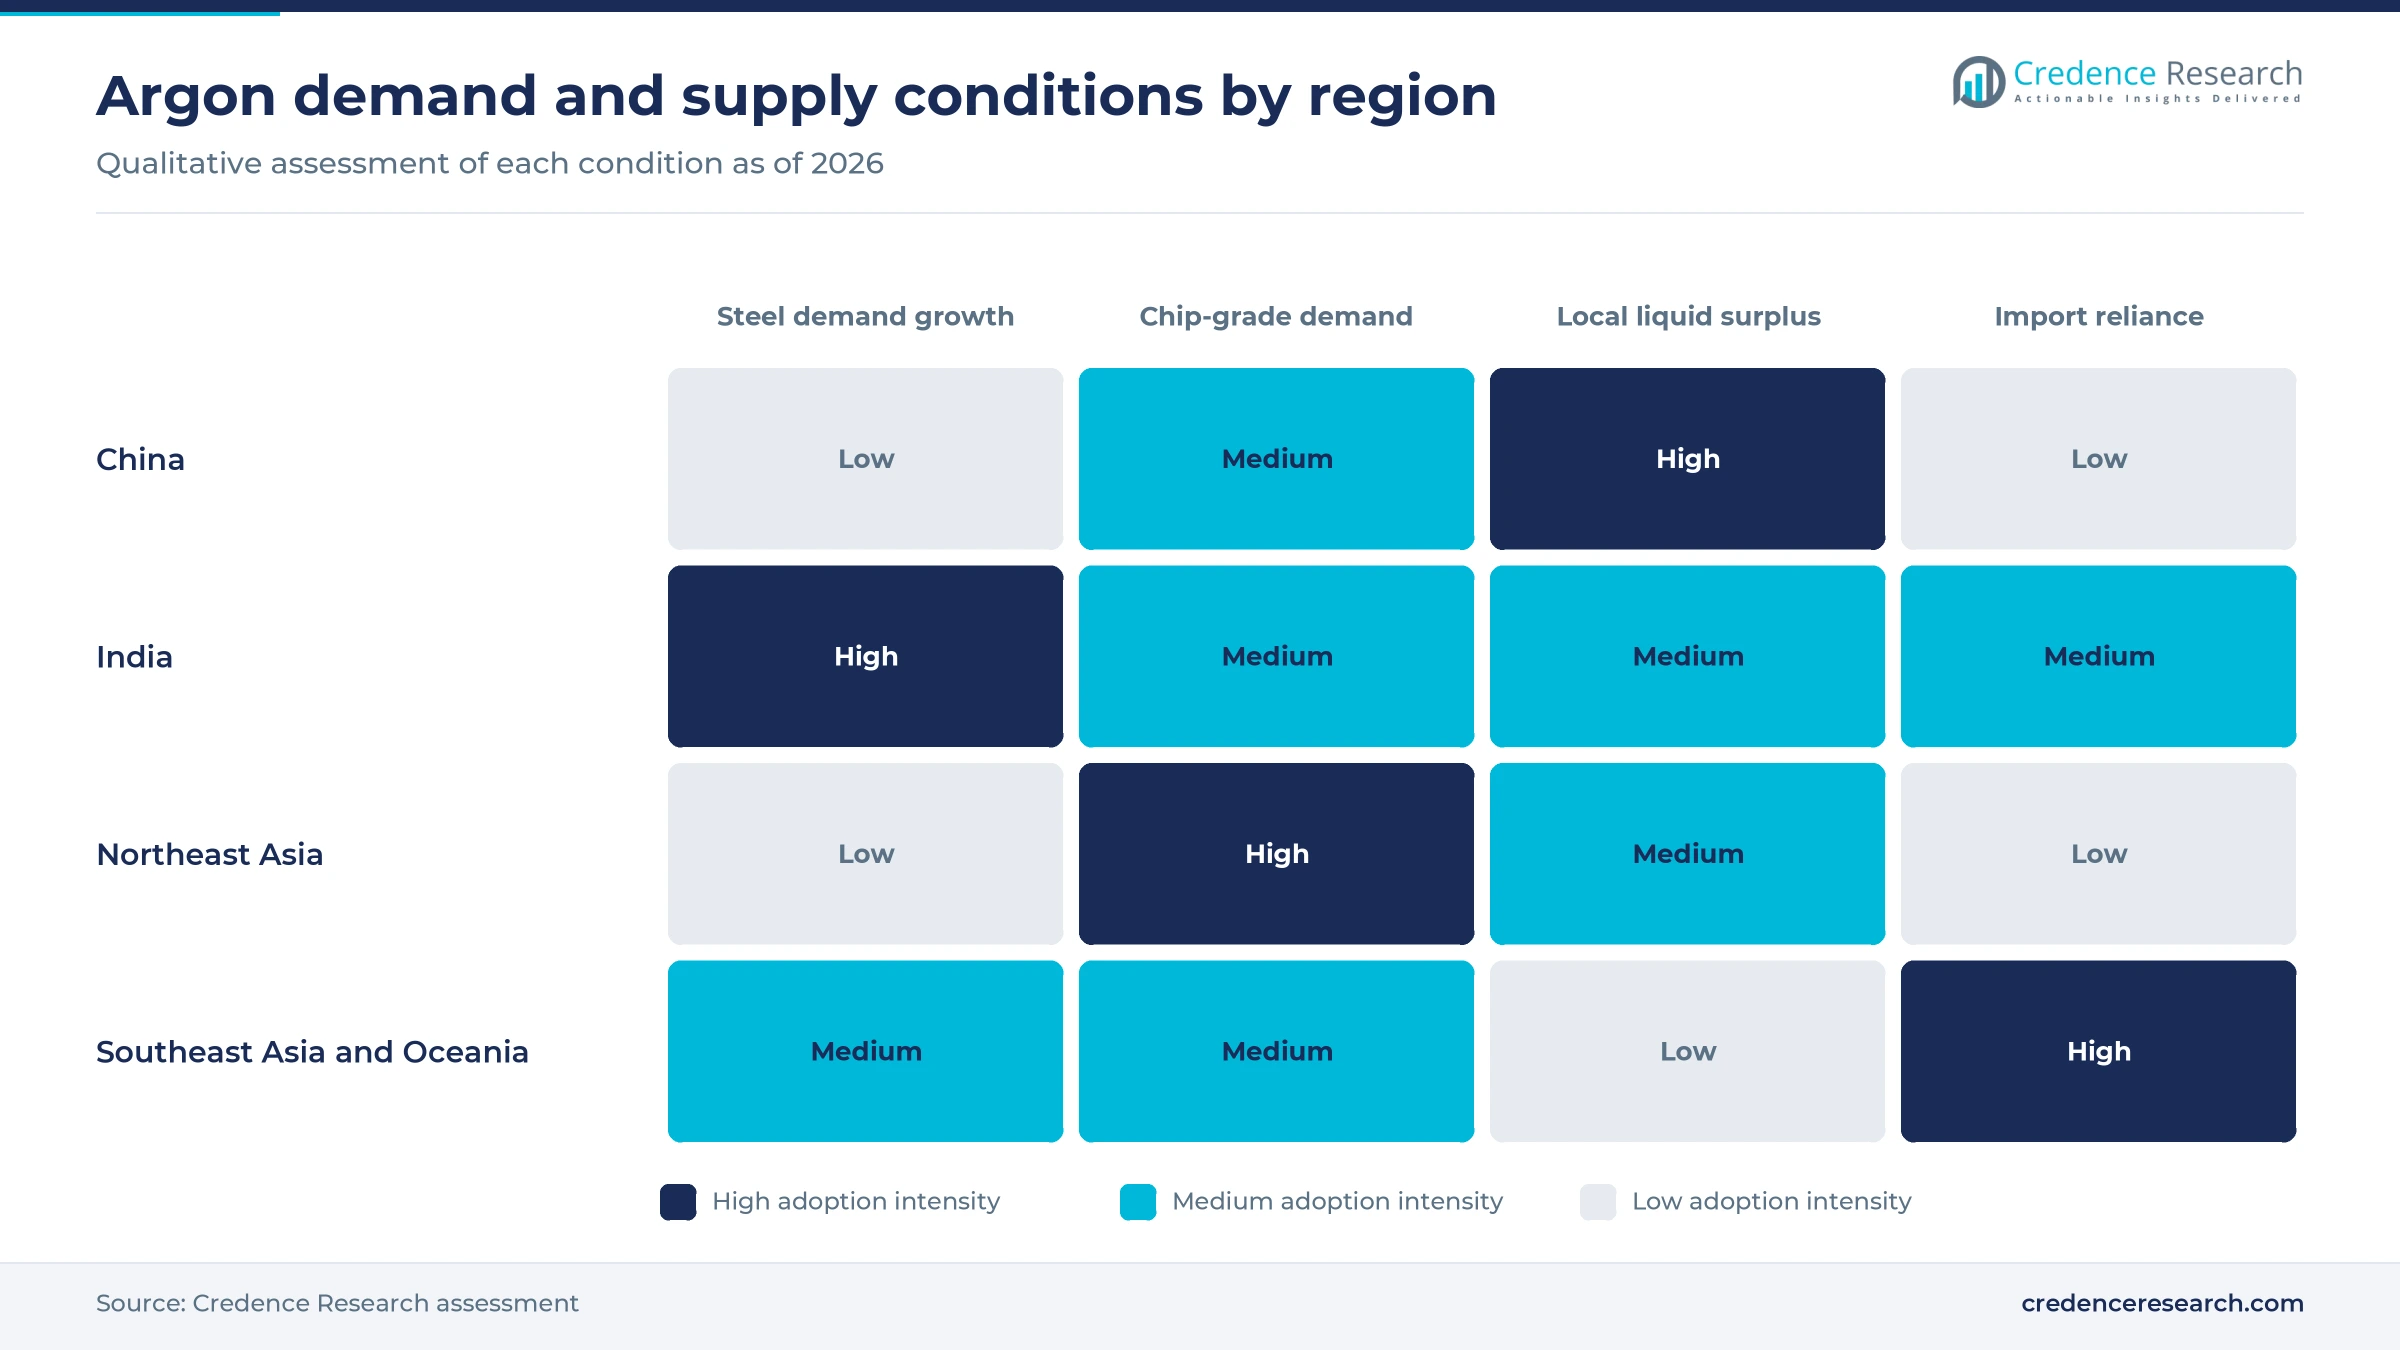
China held 52.1% of 2025 value and grows at 4.0% a year, the slowest pace in the region. Its scale comes from the world's largest steel, solar wafer and electronics base, although the output declines noted above have left the country with surplus liquid that it exports. Growth now depends on fab and advanced manufacturing clusters such as the Greater Bay Area, where Air Liquide's Huizhou unit targets chip and new materials customers. Domestic producers such as Hangzhou Hangyang and Yingde Gases compete hard on liquid prices.
Northeast Asia earns most from chip-grade argon
Northeast Asia held 20.7% of 2025 value and grows at 4.3% a year. Japan, South Korea and Taiwan buy a high share of ultra-high-purity argon, so value per ton runs well above the regional average. Air Liquide operates 78 electronics-dedicated facilities in Japan, and Samsung's Pyeongtaek complex hosts multiple on-site units. Steel demand is falling in Japan and Korea, so fab contracts and smelter recovery projects decide most new supply decisions in this region.
Southeast Asia and Oceania depend on imports and new plants
Southeast Asia and Oceania held 16.8% of 2025 value and grows at 5.8% a year, the second-fastest pace. Singapore imported argon worth USD 12.7 million in 2024 and Australia USD 4.1 million, according to World Bank trade data, showing how many buyers still rely on shipped liquid. New plants in Vietnam, Malaysia and Singapore should cut that reliance after 2027. Australian demand rests mainly on fabrication, mining equipment and welding consumables supplied through cylinder networks.
India grows fastest on steel and new fab projects
India held 10.4% of 2025 value and grows at 7.8% a year, the fastest pace in the region. Its crude steel output rose 10.4% in 2025, according to worldsteel, a pace that keeps mill-side plants busy and creates merchant surplus near each steel cluster. The Dholera and Sanand projects add a second demand base in electronics after 2027. INOX Air Products and Linde India lead supply, and both are building gas capacity in Gujarat for chip and packaging customers.
Fab and steel contracts dominated 2024 to 2026 announcements
| Development | Status and market relevance |
|---|---|
| In October 2024, Linde agreed to take over two air separation units under construction at Tata Steel's Kalinganagar site and supply oxygen, nitrogen and argon. | Long-term supply agreement; also serves local merchant buyers |
| In January 2025, INOX Air Products commissioned a 2,150-ton-a-day unit at SAIL's Bokaro plant producing 100 tons a day of argon. | In operation; largest unit in its fleet |
| In April 2025, Linde agreed to build an eighth on-site air separation unit at Samsung's Pyeongtaek complex supplying argon from mid-2026. | Under construction; supply due mid-2026 |
| In April 2026, Air Liquide committed 200 million euros to two Hiroshima units supplying ultra-pure argon, nitrogen and oxygen to a chipmaker. | Start-up by the end of 2028 |
| In August 2026, Messer announced a 600-ton-a-day air separation unit producing argon and a nitrogen liquefier in Thai Nguyen province, Vietnam. | Due mid-2027 to the end of 2027 |
Purity monitoring and cold-energy plants change supply
- Ultra-high-purity air separation with continuous purity monitoring lifted Air Liquide's Kumamoto gas center capacity more than fivefold in March 2024 and improved energy efficiency by 20%.
- LNG cold-energy air separation uses cold from regasified LNG to cut power use, the design Air Products chose for its Pengerang plant in Johor.
- Predictive maintenance and automation improve reliability at fab plants, and Air Liquide applies them at its two new Singapore facilities.
- Rare-gas refining from crude streams lets steelworks plants sell xenon, krypton and neon alongside argon, as POSCO Air Solution does at Gwangyang.
Need a Custom Version of This Report?
Tailor the scope, geography, or segments to your exact requirements.
- Custom geography or segment scope
- Direct access to our analyst team
Global majors and local producers split the supply base
Competition turns on purity qualification for fabs, plant ownership at steel mills and liquid logistics for everyone else. Linde, Air Liquide, Air Products and Nippon Sanso win most fab contracts because they bring multi-gas on-site plants, purity guarantees and long records with chipmakers. In steel, the contest is over who owns the mill's air separation units, since the owner also controls surplus argon for the local merchant market. National producers such as INOX Air Products, Hangzhou Hangyang and Yingde Gases compete on delivered liquid prices and nearby capacity. Messer and other mid-sized groups target growing electronics hubs such as Northern Vietnam, where few plants exist. Because argon is sold alongside oxygen and nitrogen, broader industrial gas contracts usually decide which supplier wins the argon volume.
How concentrated is argon supply in the region?
Argon supply in the region is concentrated at the top and fragmented below. Four global groups, Linde, Air Liquide, Nippon Sanso and Air Products, run most of the on-site plants at fabs and large mills, and they hold the purity qualifications that chipmakers demand. Below them sit national producers such as INOX Air Products in India and Hangzhou Hangyang and Yingde Gases in China, which compete on liquid prices near steel clusters. Capital is the main barrier, since a single large unit such as Bokaro cost INR 750 crore. Margins sit mainly in packaged and ultra-high-purity supply, while surplus bulk liquid earns the least.
Companies active in Asia-Pacific argon supply
| Company | Type | Role in the market |
|---|---|---|
| Linde | Global gas producer | On-site units at Samsung Pyeongtaek and Tata Steel Kalinganagar; building a Dholera plant for Tata Electronics |
| Air Liquide | Global gas producer | Ultra-pure argon units in Hiroshima and liquid argon at Huizhou; 78 electronics facilities in Japan |
| Air Products | Global gas producer | Argon plants for a new Samsung fab at Pyeongtaek and an LNG-based unit at Pengerang, Malaysia |
| Nippon Sanso Holdings | Global gas producer | Taiyo Nippon Sanso supplies bulk and cylinder argon in Japan; sold its Thai distributor in 2025 |
| INOX Air Products | National gas producer | Steel-linked units such as Bokaro and a planned Dholera electronic gas hub in India |
| Messer | Regional gas producer | Adding a 600-ton-a-day argon-producing unit in Northern Vietnam |
| Yingde Gases | Independent on-site producer | Chinese operator; its NovaAir brand runs a 300-ton-a-day liquid unit in Selangor |
| Hangzhou Hangyang | Equipment maker and gas supplier | Largest Chinese maker of air separation units, also selling industrial gases |
Purity, not tonnage, will decide supplier returns
Credence Research's view is that this market is splitting into two businesses that share the same molecule. Standard-grade argon follows steel, and with Chinese output falling and surplus liquid crossing borders, its prices will stay under pressure. Chip-grade argon follows fab construction in Korea, Japan, Singapore and India, where buyers pay for purity guarantees under long contracts. Ultra-high-purity argon, growing at 6.9% a year, therefore carries most of the value gain in Asia-Pacific argon demand. Suppliers that own plants at fabs and growing Indian mills should capture most of the value gain. The most assumption-heavy estimate in this report is the split between purity grades, because few public sources separate them.
Steel output, fab capacity and trade data anchor the model
The report uses 2025 as the base year and 2026 to 2035 as the forecast period. Market values come from the Credence Research model, while regional, product type, end-use, operating model and sales channel splits are Credence Research estimates informed by public data. Sources include worldsteel and India's Ministry of Steel output data, World Bank trade statistics, SEMI capacity data, solar industry statistics and company releases on plants and supply contracts. No interviews or surveys were conducted for this edition of the report.
Chip-grade contracts and India set the pace to 2035
Through 2035, the market should reach USD 803.3 million as fab contracts and Indian steel replace Chinese steel as the main sources of growth. China will remain the largest region, but its share should slip as surplus liquid keeps standard-grade prices low. India should gain the most share as its mills build toward the 300 million tons of capacity targeted for 2030 and its first fabs start buying high-purity gas. Northeast Asia will keep the highest value per ton because of its fab base. Consequently, suppliers that combine on-site plants, purity qualification and liquid logistics should hold the strongest position.
Fab timing and Chinese steel set the range to 2035
The range of outcomes depends mainly on how quickly announced fab plants start and how far Chinese steel output falls. If Korean, Japanese and Indian fab projects arrive on schedule, ultra-high-purity volumes lift average prices across the region. A deeper Chinese steel decline would add surplus liquid and push standard-grade prices lower across nearby import markets. India's steel capacity target is the main swing factor for volume, because new mills bring their own gas plants and merchant surplus.
| Scenario | CAGR, 2026–2035 | Value, 2035 | What has to hold |
|---|---|---|---|
| Downside | 3.6% | USD 717.7 million | Chinese steel output keeps falling, fab ramp-ups slip and surplus liquid depresses regional prices |
| Base | 4.87% | USD 803.3 million | Announced fab plants start near schedule and Indian steel capacity grows toward its 2030 target |
| Upside | 6.1% | USD 889.6 million | Indian and Southeast Asian fabs scale quickly and ultra-high-purity contracts lift average prices |
Frequently Asked Questions
How big is the Asia-Pacific argon market?
Which region leads Asia-Pacific argon demand?
Which region grows fastest in this market?
Which product type holds the largest share?
Why are semiconductor fabs important for argon suppliers?
How do argon prices vary across the region?
What are the main challenges for argon suppliers?
Which companies are active in this market?
Table of Content
Chapter 1 Market Segmentation
- 1.1 Segmentation Framework
- 1.1.1 Product and Service Classification
- 1.1.2 Application and End-Use Classification
- 1.1.3 Technology and Solution Classification
- 1.1.4 Customer and Distribution Channel Classification
- 1.1.5 Geographic Segmentation
- 1.1.6 Market Segment Definitions and Boundaries
- 1.2 By Product Type
- 1.2.1 Standard-purity argon
- 1.2.2 High-purity argon
- 1.2.3 Ultra-high-purity argon
- 1.3 By End-Use Industry
- 1.3.1 Metal manufacturing and fabrication
- 1.3.2 Electronics manufacturing
- 1.3.3 Process manufacturing
- 1.3.4 Specialty end users
- 1.4 By Operating Model
- 1.4.1 Merchant packaged supply
- 1.4.2 Merchant bulk liquid supply
- 1.4.3 On-site and pipeline supply
- 1.5 By Sales Channel
- 1.5.1 Direct enterprise supply
- 1.5.2 Producer branch sales
- 1.5.3 Independent distributor sales
Chapter 2 Introduction
- 2.1 Report Objectives and Scope
- 2.2 Product Definition and Industry Terminology
- 2.3 Market Inclusions and Exclusions
- 2.4 Research Process
- 2.4.1 Primary Research and Expert Interviews
- 2.4.2 Secondary Research and Source Review
- 2.4.3 Top-Down and Bottom-Up Estimation
- 2.4.4 Data Triangulation and Verification
- 2.5 Market Size Measurement Basis
- 2.5.1 2025: USD 498.5 million → 2035: USD 803.3 million
- 2.6 Historical and Forecast Reference Periods
- 2.6.1 Historical Period: 2018-2025
- 2.6.2 Base Year: 2025
- 2.6.3 Forecast Period: 2025-2035
- 2.7 Research Assumptions and Limitations
Chapter 3 Executive Summary
- 3.1 Market Snapshot and Key Findings
- 3.2 Base-Year Market Size, 2025
- 3.3 Forecast Market Size, 2035
- 3.4 Revenue and Volume Growth Outlook
- 3.5 Key Demand and Supply Indicators
- 3.6 Leading Market Segments
- 3.7 Fastest-Growing Market Opportunities
- 3.8 Regional Performance Highlights
- 3.9 Technology and Industry Transformation
- 3.10 Competitive Landscape Summary
- 3.11 Analyst View and Strategic Implications
Chapter 4 Asia-Pacific Argon Market Trends and Developments
- 4.1 Historical Industry Development, 2018-2025
- 4.2 Recent Market Trends and Developments
- 4.3 Demand and Customer Behavior Trends
- 4.4 Technology and Product Innovation
- 4.5 Artificial Intelligence, Automation and Digitalization
- 4.6 Local Manufacturing and Supply Chain Realignment
- 4.7 Industry Partnerships, Mergers and Acquisitions
- 4.8 Sustainability and Circular Economy Developments
- 4.9 Government and Private Sector Investment Trends
- 4.10 Emerging Business Models and Commercialization
- 4.11 Industry Developments and Announcements
Chapter 5 Asia-Pacific Argon Market Production, Supply and Demand Analysis
- 5.1 Demand Trend and Consumption Analysis, 2018-2025
- 5.2 Demand Forecast, 2025-2035
- 5.3 Production and Output Trend, 2018-2025
- 5.4 Production and Output Forecast, 2025-2035
- 5.5 Installed Capacity and Capacity Utilization
- 5.6 Company-Wise Production Plants and Statistics
- 5.6.1 Installed Production Capacity
- 5.6.2 Actual Production
- 5.6.3 Planned Capacity and Expansion Targets
- 5.7 Supply Chain Structure and Procurement Trends
- 5.8 Supply-Demand Gap and Bottlenecks
- 5.9 Import Dependence and Sourcing Structure
- 5.10 Contract Manufacturing and Outsourcing
- 5.11 Regional Supply and Demand Concentration
Chapter 6 Asia-Pacific Argon Market Pricing Analysis
- 6.1 Pricing Structure and Measurement
- 6.2 Historical Pricing Trends, 2018-2025
- 6.3 Pricing Outlook, 2025-2035
- 6.4 Average Selling Price and Unit Economics
- 6.5 Pricing by Product and Market Segment
- 6.6 Geographic Pricing Differences
- 6.7 Key Input, Energy, Labor and Logistics Costs
- 6.8 Contract Pricing and Purchasing Models
- 6.9 Pricing Sensitivity and Competitive Positioning
- 6.10 Price, Margin and Profitability Implications
Chapter 7 Asia-Pacific Argon Market Dynamics
- 7.1 Market Growth Drivers
- 7.1.1 Demand-Side Drivers
- 7.1.2 Technology and Innovation Drivers
- 7.1.3 Infrastructure and Investment Drivers
- 7.1.4 Regulatory and Policy Drivers
- 7.2 Market Restraints
- 7.2.1 Cost and Affordability Constraints
- 7.2.2 Technology and Adoption Barriers
- 7.2.3 Supply Chain and Operational Constraints
- 7.3 Market Challenges
- 7.3.1 Competitive Pressure and Margin Erosion
- 7.3.2 Skills, Infrastructure and Implementation Gaps
- 7.4 Emerging Market Opportunities
- 7.5 Market Dynamics Impact and Time-Horizon Assessment
Chapter 8 Asia-Pacific Argon Value Chain Analysis
- 8.1 Industry Value Chain Overview
- 8.2 Upstream Suppliers and Critical Inputs
- 8.3 Technology and Component Providers
- 8.4 Manufacturing or Service Delivery
- 8.5 Distribution, Channel Partners and Integrators
- 8.6 Downstream Applications and End Users
- 8.7 Value Addition and Profit Pools
- 8.8 Vertical Integration and Outsourcing
- 8.9 Supplier Concentration and Risk
- 8.10 Supply Chain Localization and Resilience
Chapter 9 Asia-Pacific Argon Market Regulations and Policies
- 9.1 Relevant Laws, Standards and Compliance Frameworks
- 9.2 Product, Service, Safety and Quality Requirements
- 9.3 Government Policies, Incentives and Subsidies
- 9.4 Imports, Exports and Trade Barriers
- 9.5 Public Procurement and Local Content Requirements
- 9.6 Environmental and Sustainability Compliance
- 9.7 Upcoming Policy Changes and Market Implications
Chapter 10 Asia-Pacific Argon Market Hotspots and Opportunities
- 10.1 Market Opportunity Mapping and Growth Hotspots
- 10.2 High-Growth Applications and Customer Groups
- 10.3 Underserved Markets and White-Space Opportunities
- 10.4 Emerging Technology and Product Opportunities
- 10.5 New Capacity and Investment Hotspots
- 10.6 Market Entry and Expansion Opportunities
- 10.7 Distribution and Partnership Opportunities
- 10.8 Near-Term and Long-Term Commercial Potential
- 10.9 Opportunity Attractiveness and Execution Risks
Chapter 11 Asia-Pacific Argon Market Outlook, 2025-2035
- 11.1 Market Size and Analysis
- 11.1.1 Revenue (Market Measurement: 2025: USD 498.5 million → 2035: USD 803.3 million)
- 11.1.2 Market Volume and Quantity Sold
- 11.1.3 Historical Market Size, 2018-2025
- 11.1.4 Base-Year Market Size, 2025
- 11.2 Market Forecast, 2025-2035
- 11.2.1 Revenue Forecast to 2035
- 11.2.2 Volume Forecast to 2035
- 11.2.3 CAGR and Year-on-Year Growth
- 11.2.4 Incremental Revenue Opportunity
- 11.3 Forecast Assumptions and Scenario Analysis
- 11.3.1 Base-Case Forecast
- 11.3.2 Optimistic and Conservative Scenarios
- 11.3.3 Technology, Pricing and Policy Sensitivities
- 11.4 Market Attractiveness and Growth Outlook
Chapter 12 Asia-Pacific Argon Market Segmentation and Outlook
- 12.1 Segmentation Summary and Market Shares, 2025
- 12.2 Largest and Fastest-Growing Segments
- 12.3 By Product Type - Market Size and Forecast, 2025-2035
- 12.3.1 Segment Definition and Scope
- 12.3.2 Historical Market Size, 2018-2025
- 12.3.3 Revenue Forecast, 2025-2035
- 12.3.4 Volume Forecast, 2025-2035
- 12.3.5 Base-Year Market Share, 2025
- 12.3.6 Segment CAGR and Growth Drivers
- 12.3.7 Subsegment Market Size and Forecast
- 12.3.7.1 Standard-purity argon
- 12.3.7.2 High-purity argon
- 12.3.7.3 Ultra-high-purity argon
- 12.3.8 Subsegment Pricing and Adoption Trends
- 12.3.9 Leading Suppliers and Competition
- 12.3.10 Regional Demand and Opportunities
- 12.4 By End-Use Industry - Market Size and Forecast, 2025-2035
- 12.4.1 Segment Definition and Scope
- 12.4.2 Historical Market Size, 2018-2025
- 12.4.3 Revenue Forecast, 2025-2035
- 12.4.4 Volume Forecast, 2025-2035
- 12.4.5 Base-Year Market Share, 2025
- 12.4.6 Segment CAGR and Growth Drivers
- 12.4.7 Subsegment Market Size and Forecast
- 12.4.7.1 Metal manufacturing and fabrication
- 12.4.7.2 Electronics manufacturing
- 12.4.7.3 Process manufacturing
- 12.4.7.4 Specialty end users
- 12.4.8 Subsegment Pricing and Adoption Trends
- 12.4.9 Leading Suppliers and Competition
- 12.4.10 Regional Demand and Opportunities
- 12.5 By Operating Model - Market Size and Forecast, 2025-2035
- 12.5.1 Segment Definition and Scope
- 12.5.2 Historical Market Size, 2018-2025
- 12.5.3 Revenue Forecast, 2025-2035
- 12.5.4 Volume Forecast, 2025-2035
- 12.5.5 Base-Year Market Share, 2025
- 12.5.6 Segment CAGR and Growth Drivers
- 12.5.7 Subsegment Market Size and Forecast
- 12.5.7.1 Merchant packaged supply
- 12.5.7.2 Merchant bulk liquid supply
- 12.5.7.3 On-site and pipeline supply
- 12.5.8 Subsegment Pricing and Adoption Trends
- 12.5.9 Leading Suppliers and Competition
- 12.5.10 Regional Demand and Opportunities
- 12.6 By Sales Channel - Market Size and Forecast, 2025-2035
- 12.6.1 Segment Definition and Scope
- 12.6.2 Historical Market Size, 2018-2025
- 12.6.3 Revenue Forecast, 2025-2035
- 12.6.4 Volume Forecast, 2025-2035
- 12.6.5 Base-Year Market Share, 2025
- 12.6.6 Segment CAGR and Growth Drivers
- 12.6.7 Subsegment Market Size and Forecast
- 12.6.7.1 Direct enterprise supply
- 12.6.7.2 Producer branch sales
- 12.6.7.3 Independent distributor sales
- 12.6.8 Subsegment Pricing and Adoption Trends
- 12.6.9 Leading Suppliers and Competition
- 12.6.10 Regional Demand and Opportunities
- 12.7 Segment Growth Comparison
- 12.8 Segment Attractiveness and Priority Matrix
Chapter 13 Asia-Pacific Argon End-Use and Application Market Outlook
- 13.1 End-Use Industry and Customer Demand Structure
- 13.2 Leading Applications and Customer Groups
- 13.3 End-Use Market Size, Share and Forecast
- 13.4 Major End-Use Industry Deep Dives
- 13.4.1 Customer Requirements and Use Cases
- 13.4.2 Demand and Replacement Cycles
- 13.4.3 Technical and Regulatory Considerations
- 13.4.4 Purchasing and Procurement Models
- 13.4.5 Leading Vendors and Distribution Channels
- 13.4.6 Forecast and Commercial Opportunities
- 13.5 Emerging Applications and Cross-Segment Demand
- 13.6 End-Use Industry Investment Priorities
Chapter 14 Asia-Pacific Argon Geographic Market Outlook, 2025-2035
- 14.1 Regional Market Size and Country-Level Shares, 2025
- 14.2 Country Market Size Comparison, 2025
- 14.3 Country Market Forecasts, 2025-2035
- 14.4 Subregional Industrial and Demand Clusters
- 14.5 Intra-Regional Pricing and Cost Differences
- 14.6 Cross-Border Trade and Supply Networks
- 14.7 Regional Supply and Demand Balances
- 14.8 Country Opportunity Comparison and Prioritization
Note: Every listed country is covered on the structure shown under the first country.
Chapter 15 Asia-Pacific Argon Technology, Innovation and Sustainability Outlook
- 15.1 Technology Landscape and Maturity
- 15.2 Product, Process and Service Innovation
- 15.3 AI, Automation and Digital Tools in the Industry
- 15.4 Technology Adoption and Performance Benchmarking
- 15.5 Innovation Pipeline and R&D Investment
- 15.6 Patent and Intellectual Property Trends
- 15.7 Energy Efficiency and Resource Management
- 15.8 Sustainability, Recycling and Circularity
- 15.9 Technology Roadmap, 2025-2035
- 15.10 Risks of Obsolescence and Technology Substitution
Chapter 16 Asia-Pacific Argon Market Key Strategic Imperatives
- 16.1 Growth and Market Entry Priorities
- 16.2 High-Return Products and Segments
- 16.3 Pricing, Profitability and Cost Optimization
- 16.4 Technology Investment and Product Differentiation
- 16.5 Supply Chain Localization and Resilience
- 16.6 Distribution and Customer Acquisition
- 16.7 Partnership, Acquisition and Capacity Strategy
- 16.8 Regional Expansion Priorities
- 16.9 Short-, Medium- and Long-Term Actions
Chapter 17 Competition Outlook
- 17.1 Industry Competition Characteristics
- 17.2 Market Structure and Concentration
- 17.3 Market Share and Competitive Positioning, 2025
- 17.4 Company-Wise Revenue and Product Benchmarking
- 17.5 Production and Service Capacity Benchmarking
- 17.6 Technology, Pricing and Differentiation
- 17.7 Regional Footprint and Distribution Strength
- 17.8 Mergers, Acquisitions and Strategic Alliances
- 17.9 New Entrants and Competitive Threats
- 17.10 Porter's Five Forces and Industry Attractiveness
- 17.11 Competitive Outlook, 2025-2035
Chapter 18 Company Profiles
- 18.1 Company Coverage and Selection Criteria
- 18.2 Linde
- 18.2.1 Business Description
- 18.2.2 Company Ownership and Geographic Presence
- 18.2.3 Product and Service Portfolio
- 18.2.4 Manufacturing and Operating Footprint
- 18.2.5 Production Capacity and Expansion Plans
- 18.2.6 Financial Performance and Investment
- 18.2.7 Market Share and Competitive Position
- 18.2.8 Technology and Innovation Capabilities
- 18.2.9 Strategic Alliances or Partnerships
- 18.2.10 Recent Developments
- 18.2.11 Growth Strategy and Outlook
- 18.3 Air Liquide
- 18.4 Nippon Sanso Holdings
- 18.5 Air Products
- 18.6 Iwatani Corporation
- 18.7 Hangzhou Hangyang
- 18.8 INOX Air Products
- 18.9 Messer
- 18.10 Yingde Gases
- 18.11 Other Relevant Market Participants
Note: Every listed company is profiled on the structure shown under the first company. The company list is preliminary and may change based on research findings, market developments, data availability and client requirements.
Chapter 19 Disclaimer
- 19.1 Research and Forecast Disclaimer
- 19.2 Data Source and Estimation Limitations
Note: The depth of individual sections depends on data availability for this market. Volume, capacity, trade and other unit-based metrics are included where applicable.

