
Asia Pacific metalworking fluids follow machining output
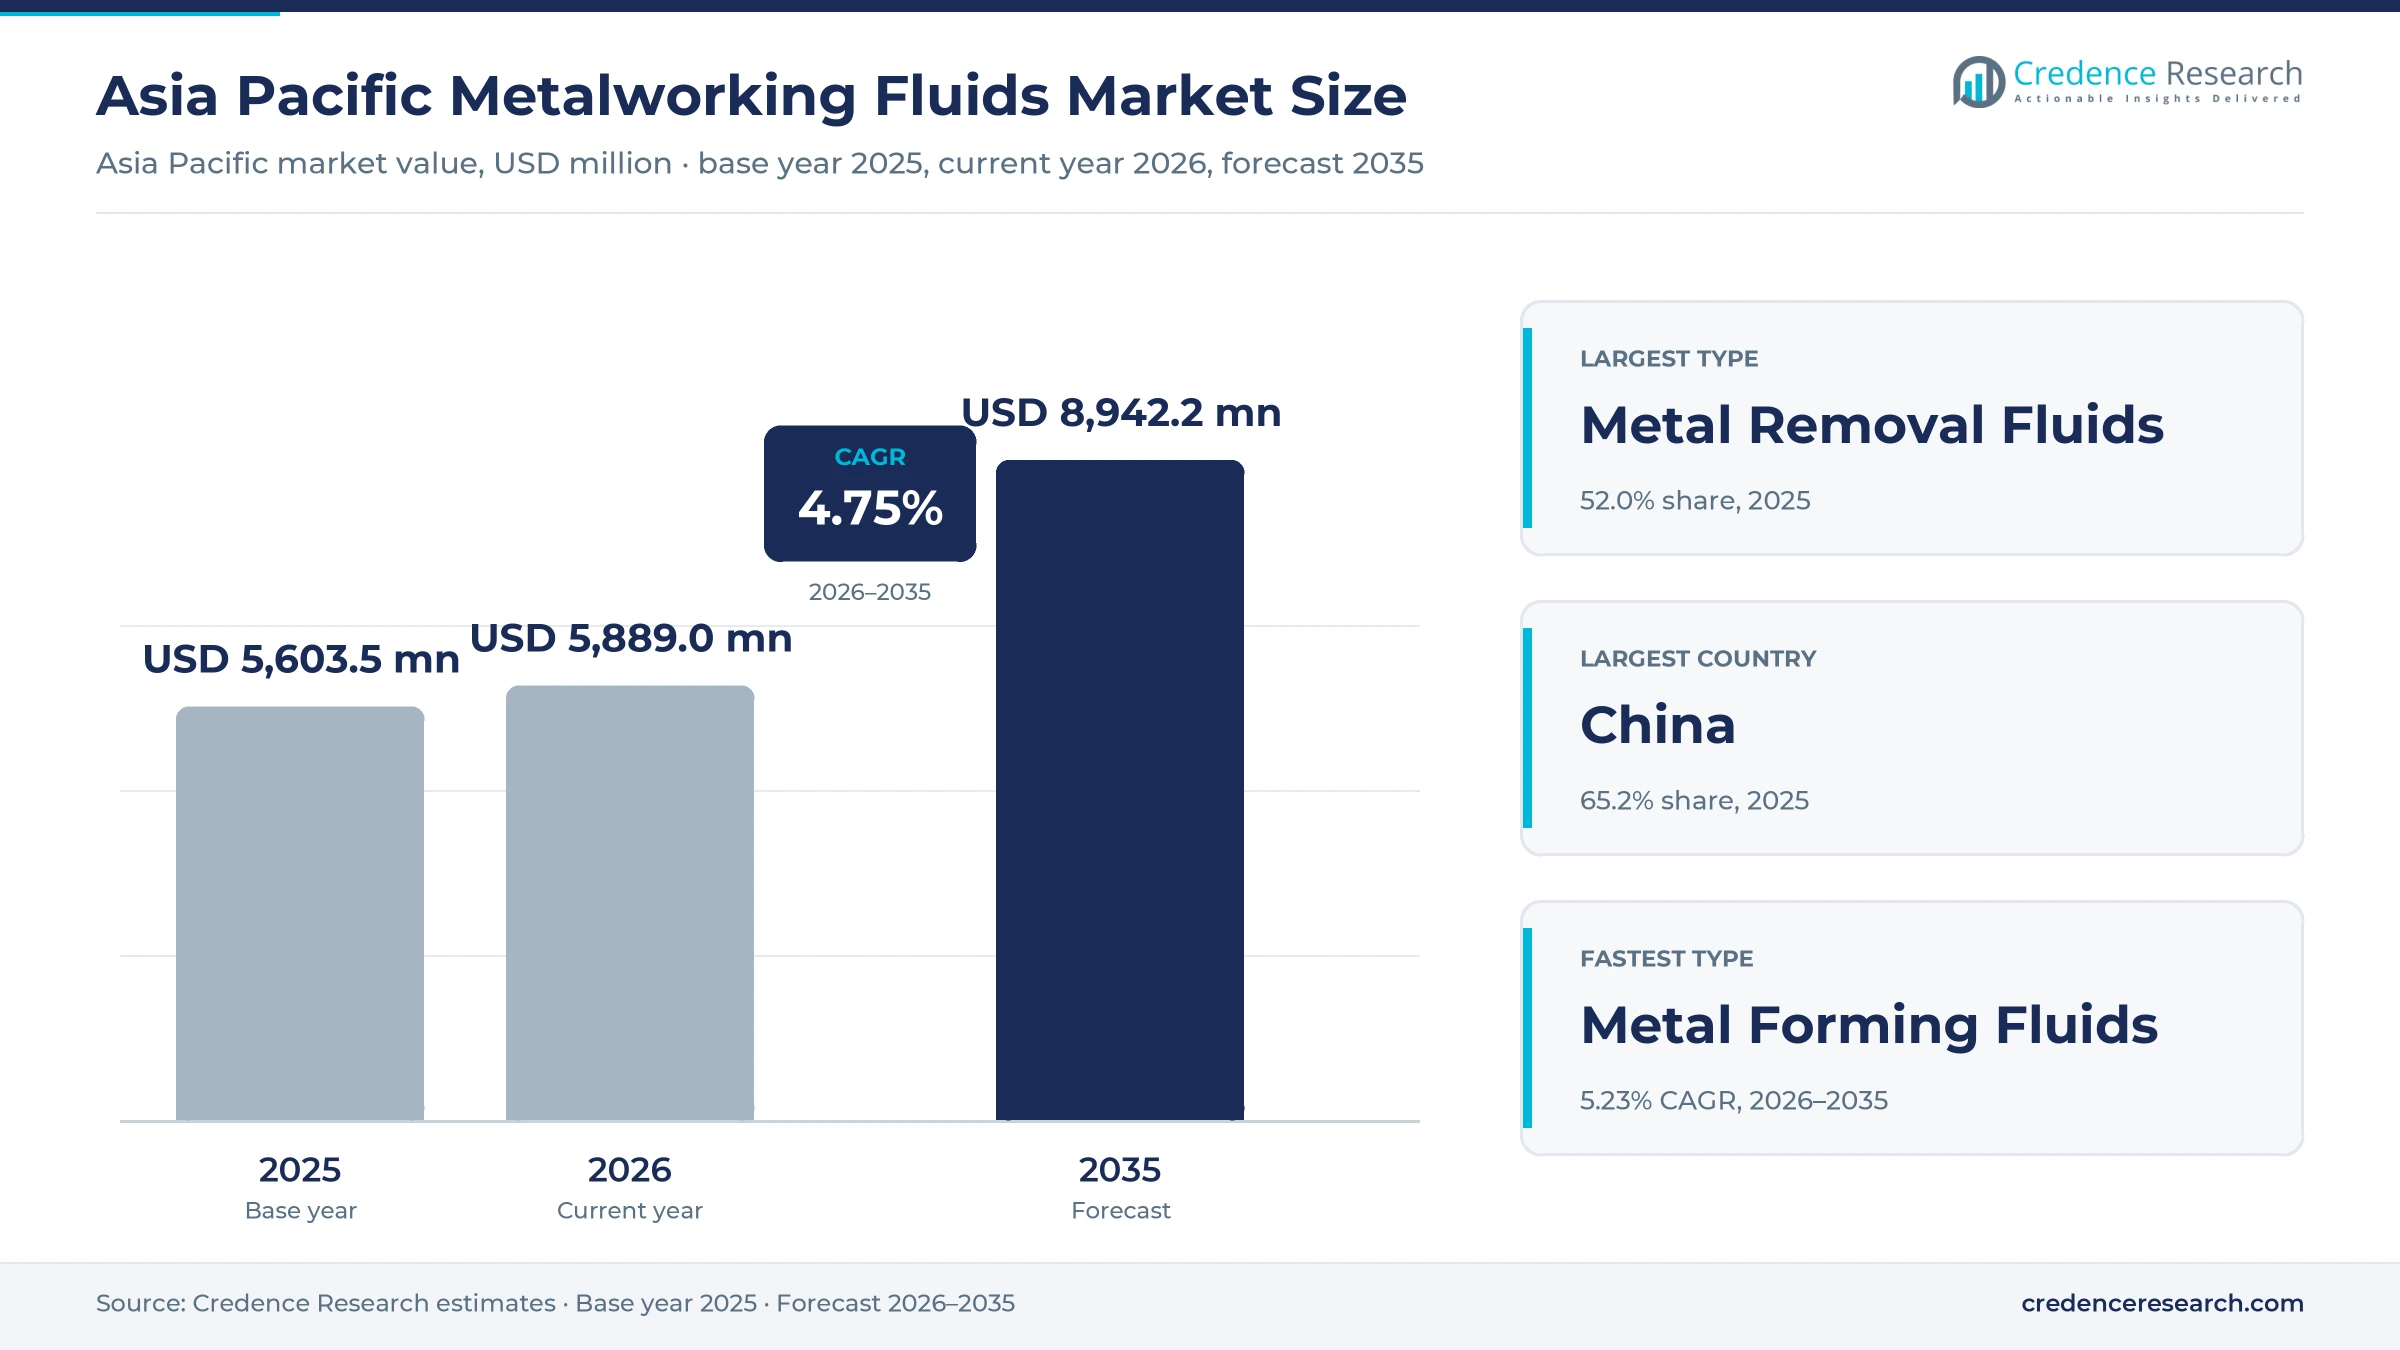
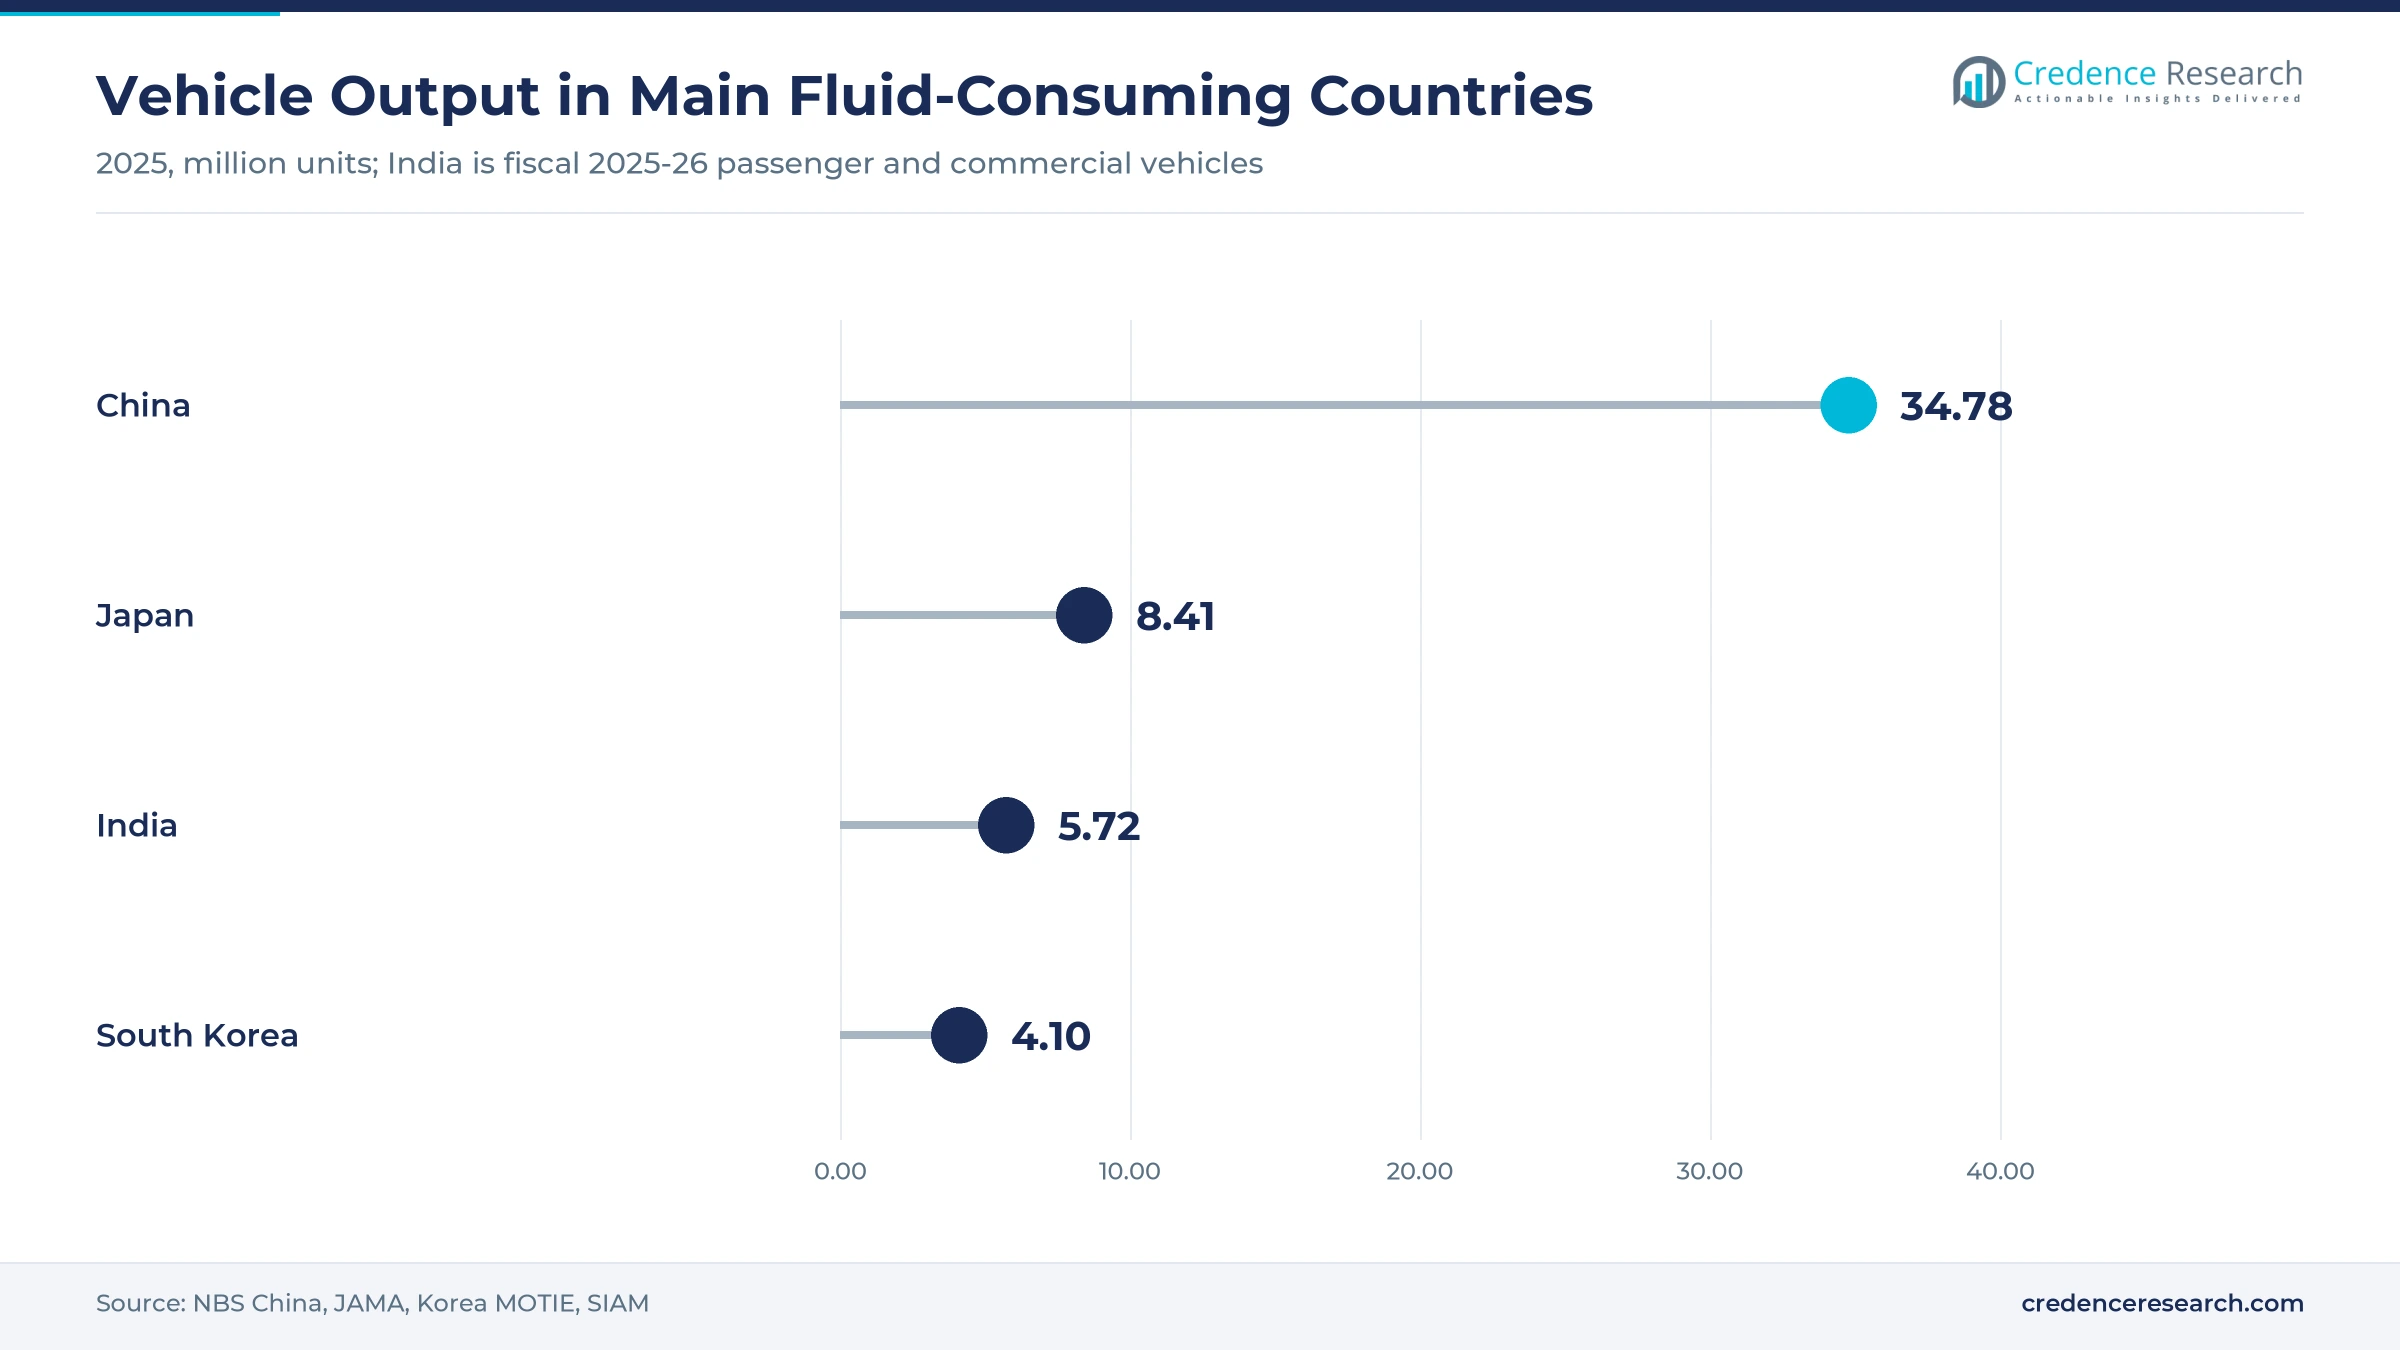
The Asia Pacific metalworking fluids market was valued at USD 5.60 billion in 2025 and is projected to increase from USD 5.89 billion in 2026 to USD 8.94 billion by 2035, registering a CAGR of 4.75% during 2026–2035. Demand follows the machining, stamping and rolling lines that consume coolants, drawing oils and rust preventives every shift. China held the largest share, 65.2% in 2025, because its plants built 34.78 million motor vehicles that year, according to the National Bureau of Statistics. India and Remaining Asia Pacific is the fastest-growing area at 6.66% a year, supported by Indian crude steel output of 164.9 million metric tons in 2025, up 10.4% on World Steel Association data. The largest commercial change is chemical, because parties to the Stockholm Convention listed medium-chain chlorinated paraffins for elimination in May 2025, pushing formulators toward chlorine-free extreme-pressure packages. Supply is the other pressure, because Fortune reported that the Strait of Hormuz closure from late February 2026 nearly tripled spot prices for affected base oils.
What counts as a metalworking fluid in this Asia Pacific estimate?
The estimate counts formulated removal, forming, protecting and treating fluids sold to factories, mills and component shops in China, Japan, South Korea, India and the remaining Asia Pacific countries. Buyers purchase through direct manufacturer contracts for large plants and through technical distributors for smaller workshops, often with coolant monitoring included in the supply agreement.
The estimate excludes engine oils, hydraulic oils, greases, standalone base oil and additive sales to blenders, and the machine tools themselves. The value chain runs from base oil and additive suppliers through formulators to plant-level fluid management, and then to spent-fluid treatment or licensed disposal.
Asia Pacific Metalworking Fluids Market Insights
- The market rises from USD 5.60 billion in 2025 to USD 8.94 billion by 2035 at a 4.75% CAGR, tracking machining and rolling output rather than oil consumption alone.
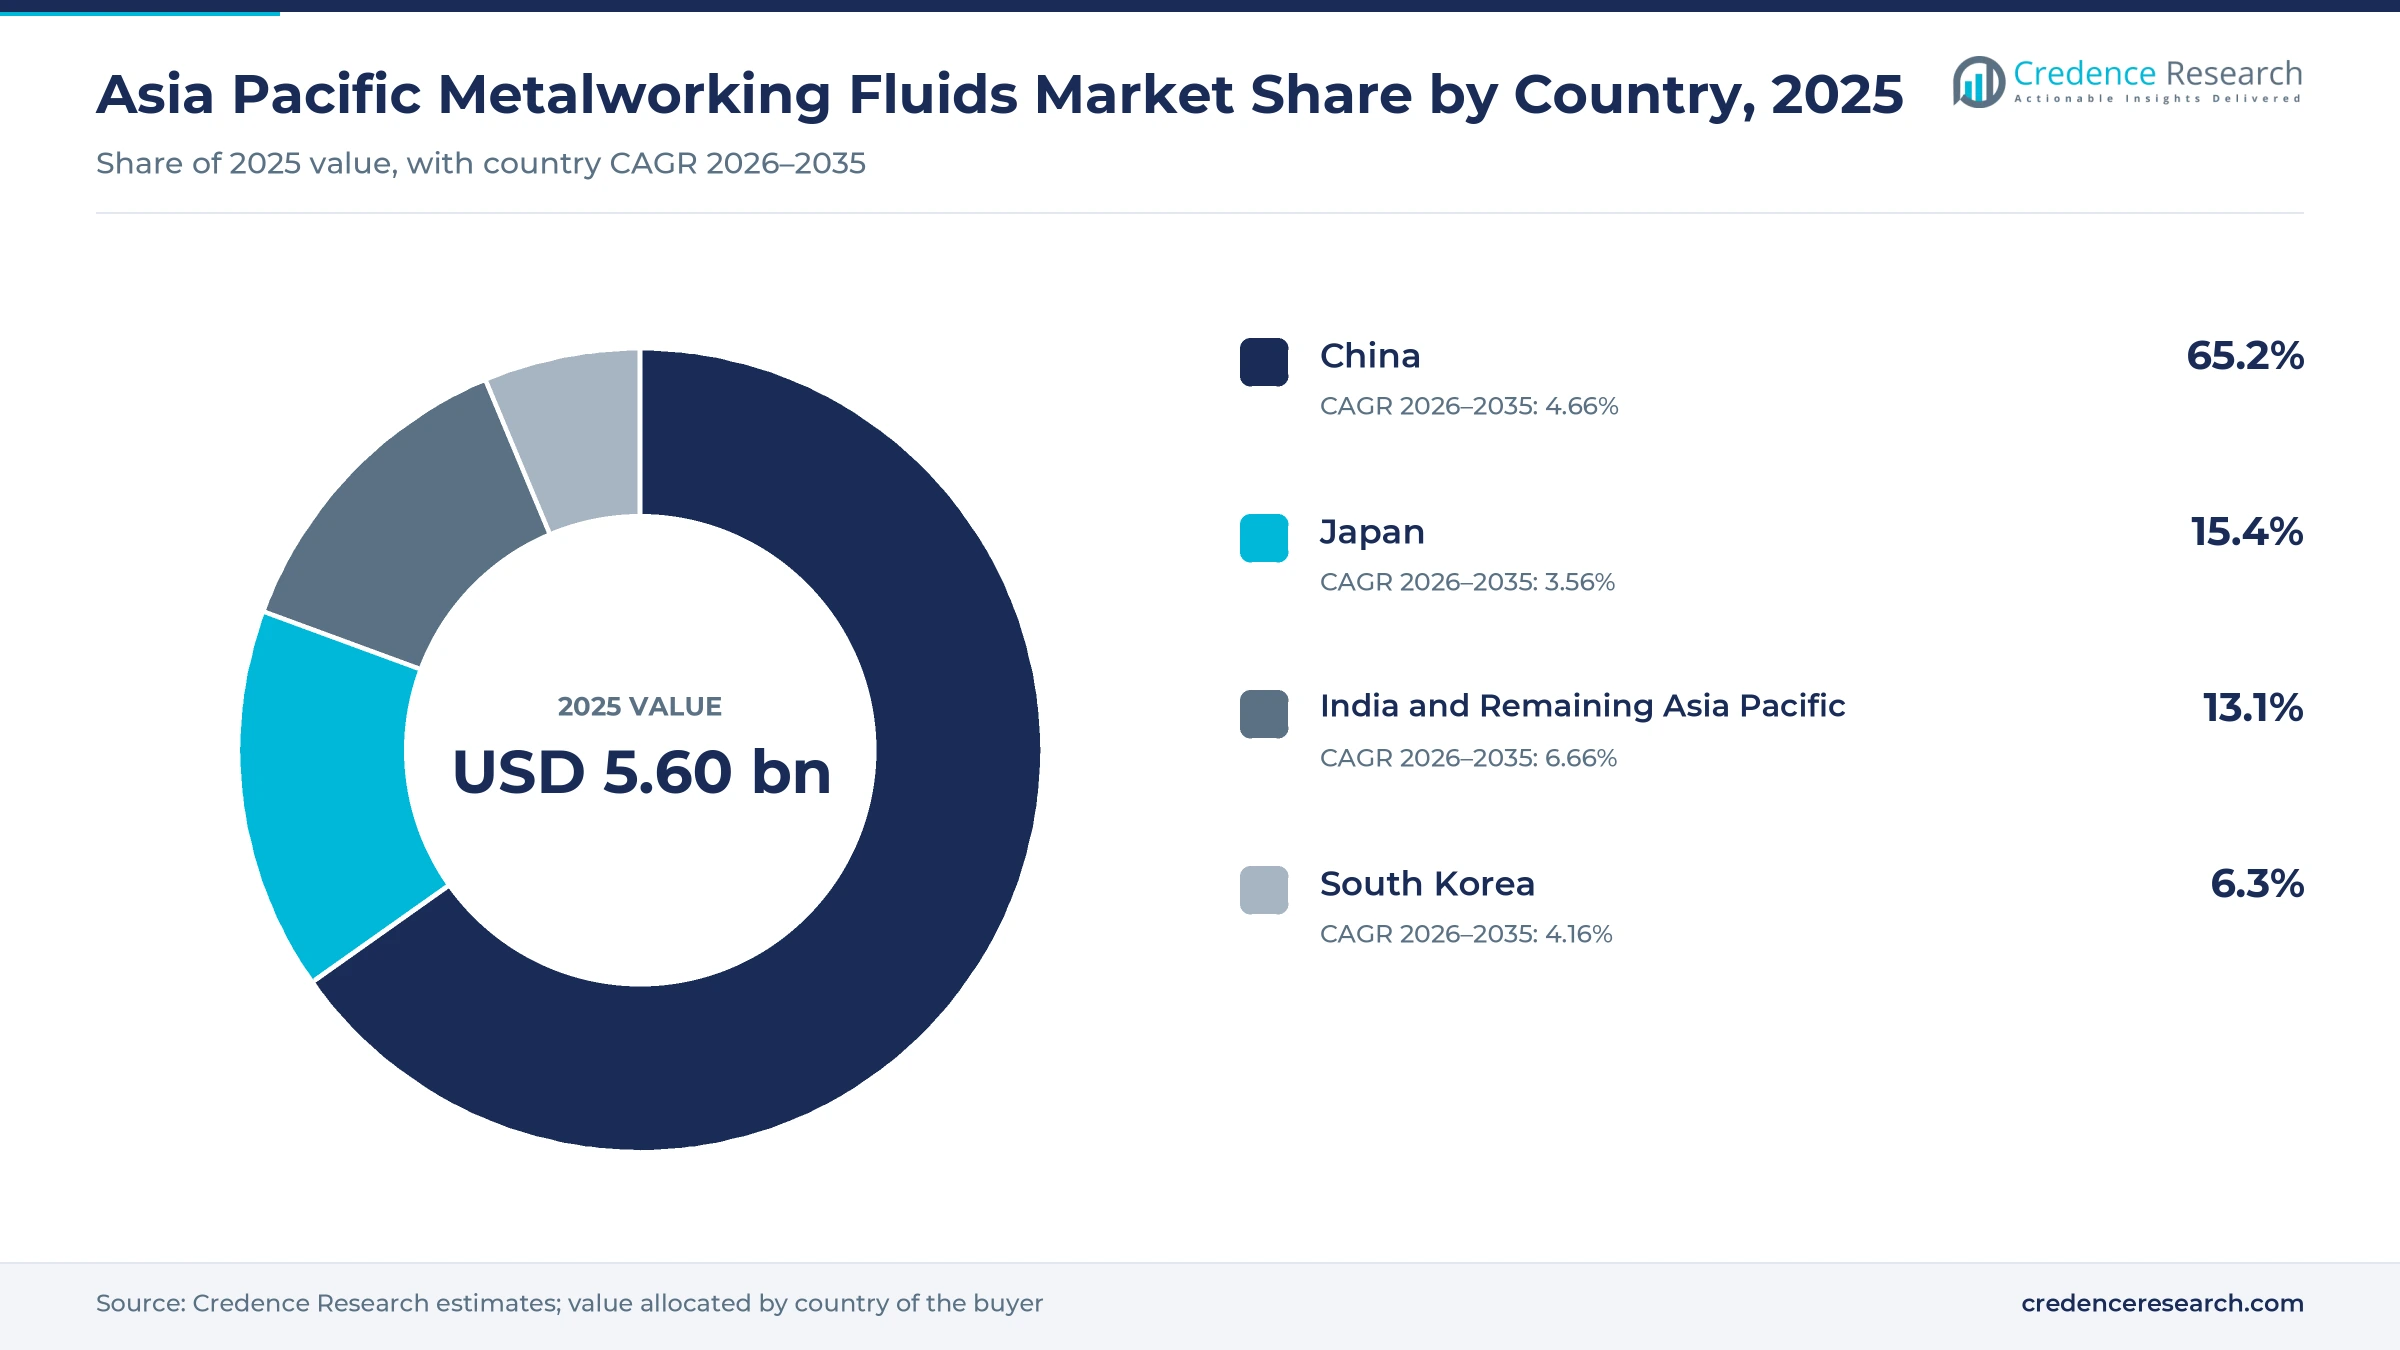
- China held 65.2% of regional value in 2025, ahead of Japan at 15.4%, because its vehicle, steel and aluminum lines remain the largest in Asia.
- Metal Removal Fluids took 52.0% of value in 2025, since cutting and grinding lines run coolant continuously and replace it more often than other fluids.
- Stockholm Convention parties listed medium-chain chlorinated paraffins in May 2025, and Japan proposed 2026 bans covering metalworking fluids that contain them.
- Quaker Houghton reported ten straight quarters of Asia-Pacific volume growth through late 2025, showing that service-led suppliers can gain share in slower Chinese demand.
Removal fluids and vehicle plants anchor coolant spending
Why do removal fluids take the largest share of plant budgets?
Based on product type, the market is categorized into metal removal fluids, metal forming fluids, metal protecting fluids and metal treating fluids. Metal Removal Fluids led with 52.0% of 2025 value because machining centers consume coolant continuously, and the Japan Machine Tool Builders' Association counted 1,604.32 billion yen of 2025 orders, up 8% from 2024. Metal Forming Fluids grow fastest at 5.23% a year as aluminum die casting spreads through electric vehicle platforms. Quaker Houghton's Zhangjiagang site, reported Aug. 12, 2026, adds die casting product lines for Chinese automotive customers.
Which factories buy the most fluid across the region?
Based on end-use industry, the market is categorized into automotive manufacturing, machinery and transport equipment, primary metal processing and precision component manufacturing. Automotive Manufacturing led with 41.0% of 2025 value because engines, gear sets and body panels pass through several fluid-using steps, and the Japan Automobile Manufacturers Association recorded 8,410,334 units of Japanese output in 2025. Precision Component Manufacturing grows fastest at 5.63% a year as tolerances tighten. China's National Bureau of Statistics reported 773,000 industrial robots built in 2025, up 28.0%, and those reducers and joints require fine finishing.
How do ferrous and aluminum lines differ in fluid demand?
Based on application, the market is categorized into Ferrous Metalworking, Aluminium Metalworking and Specialty Nonferrous Metalworking. Ferrous Metalworking led with 68.0% of 2025 value because steel dominates regional metal tonnage, with China producing 960.8 million metric tons of crude steel in 2025 on World Steel Association data. Aluminium Metalworking grows fastest at 5.54% a year as electric vehicle structures and housings shift toward lighter alloys. China's electrolytic aluminum output reached 45.02 million tons in 2025, up 2.4%, and suppliers such as ENEOS and Indian Oil list dedicated aluminum rolling oils for those mills.
Why do mineral-based oils still lead despite chemistry rules?
Based on technology, the market is categorized into mineral-based formulations, semi-synthetic formulations and synthetic formulations. Mineral-Based Formulations led with 46.0% of 2025 value because price still decides many workshop purchases, and Group I SN150 traded at USD 1,520 to USD 1,560 per ton FOB Asia on July 6, 2026, against nearly USD 3,000 for Group III. Synthetic Formulations grow fastest at 5.71% a year as plants seek lower mist and longer sump life. Indian Oil lists SERVOsynth 2 and SERVOsynth 5 synthetic soluble grades beside its neat cutting range.
| Segment Group | Leading Sub-segment | Share, 2025 | Fastest-growing Sub-segment | CAGR, 2026–2035 |
|---|---|---|---|---|
| By Product Type | Metal Removal Fluids | 52.0% | Metal Forming Fluids | 5.23% |
| By End-Use Industry | Automotive Manufacturing | 41.0% | Precision Component Manufacturing | 5.63% |
| By Application | Ferrous Metalworking | 68.0% | Aluminium Metalworking | 5.54% |
| By Technology | Mineral-Based Formulations | 46.0% | Synthetic Formulations | 5.71% |
Request a Free Sample
Fill in your details and we'll send you a free sample report.
- Sample data tables & charts
- Research methodology
Vehicle volume and machine orders set the coolant base
Vehicle output and metal tonnage keep coolant lines running
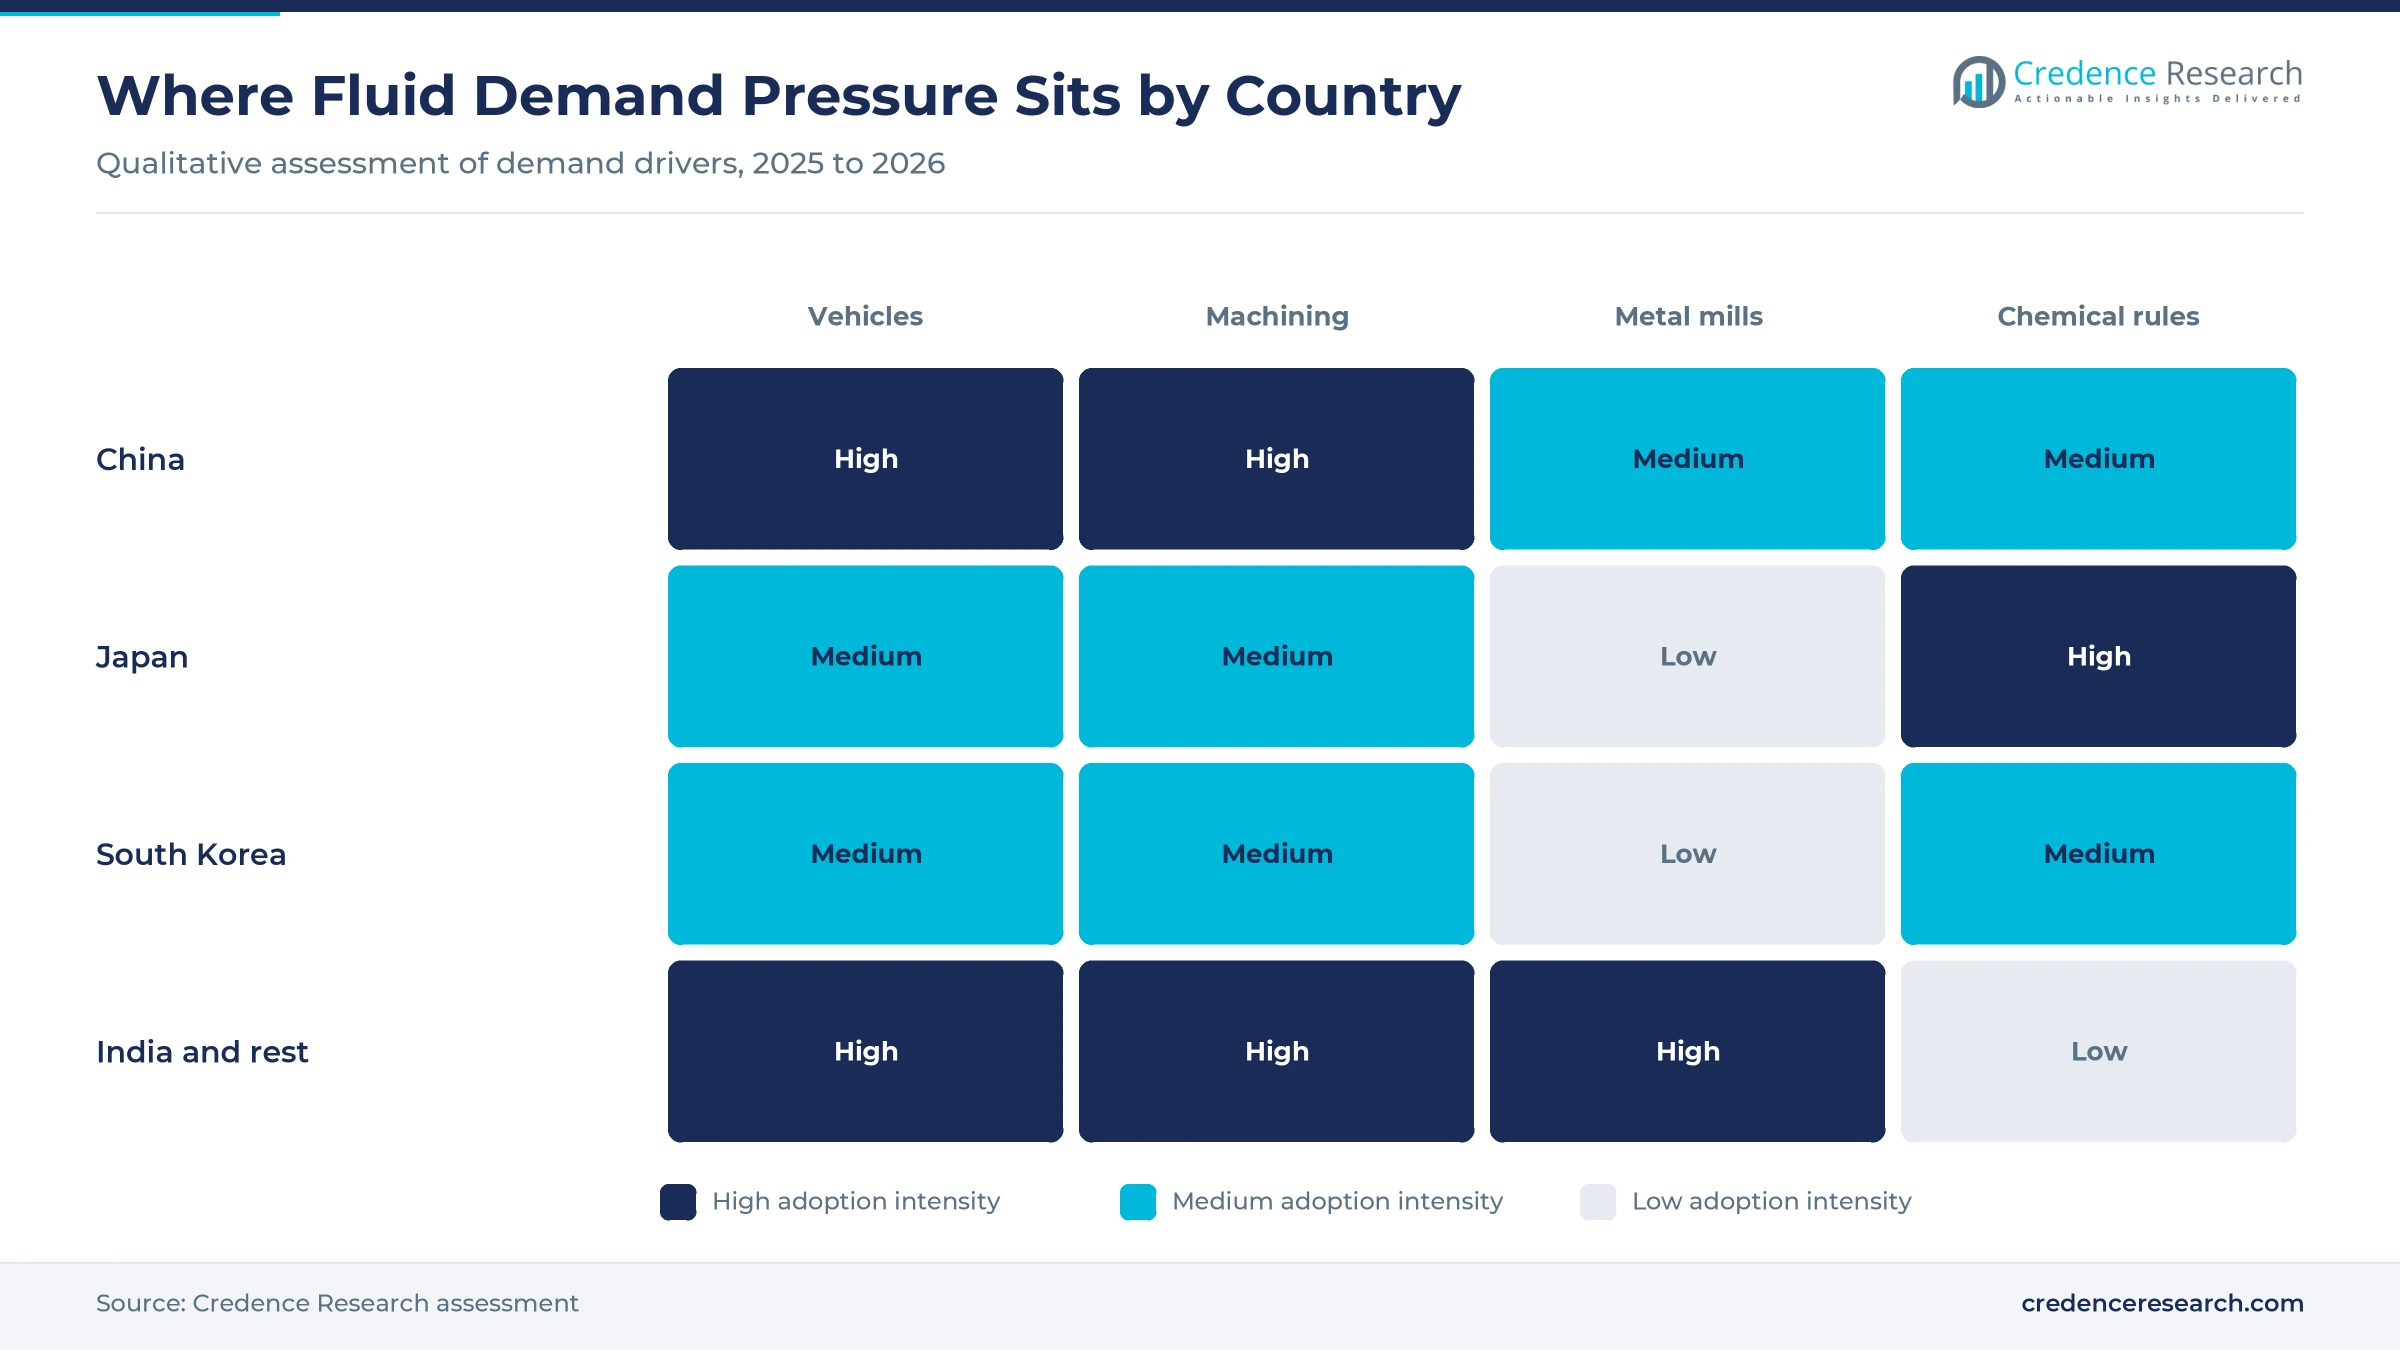
Manufacturing scale is the first driver because fluid consumption rises with machined parts, stamped panels and rolled coils. China's 2025 statistical communique reports 34.78 million motor vehicles, up 9.8%, including 16.52 million new energy vehicles, up 25.1%. Equipment manufacturing value added also grew 9.2% that year, which widens demand beyond carmakers. Metal processing adds a second layer, since mills consume rolling emulsions, and India's crude steel output rose 10.4% in 2025 on World Steel Association figures. As a result, China anchors regional value, and Metal Removal Fluids remain the largest product line at 52.0% of 2025 spending across the region's machining and grinding plants.
Local component plants tie suppliers to long service contracts
Regional component production strengthens customer retention because a fluid qualified on one line is rarely changed without a plant trial. India's Production Linked Incentive scheme for automobiles and auto components carries an outlay of Rs 25,938 crore, approved Sept. 23, 2021, and it requires 50% domestic value addition. Those rules keep machining in India, where Maruti Suzuki reported record output of 2.34 million units for fiscal 2025-26 on April 23, 2026. Castrol India reported more than 730 Chemical Management Services sites in its August 2025 analyst presentation, a model that puts supplier staff inside plants. In turn, ExxonMobil announced on March 31, 2023, an Isambe plant in Raigad of up to 159,000 kiloliters a year for manufacturing and steel customers.
Premium chemistry follows electric vehicles and advanced parts
Premiumization is the third driver because advanced parts raise the value of each liter sold. Electric vehicle housings, robot reducers and semiconductor equipment parts need cleaner finishes and tighter tolerances than conventional iron machining. China built 484.28 billion integrated circuits in 2025, up 10.9%, according to the National Bureau of Statistics, and the same release counted 773,000 industrial robots. Quaker Houghton told investors on Feb. 23, 2026, that its Asia-Pacific organic volume rose 5% in 2025, the region's tenth straight growth quarter closing that year. Idemitsu sells Daphne Alphacool CS in India for high-speed, high-pressure machining centers with lower mist and odor. These purchases favor Synthetic Formulations, the fastest technology group at 5.71% a year through 2035.
Machine tool orders signal the next round of fluid demand
New machine installations are a leading indicator because each machine adds sump capacity and a future refill cycle. The Japan Machine Tool Builders' Association reported foreign orders of 1,163.46 billion yen in 2025, up 11.5%, while domestic orders slipped 0.2%. The Manufacturing Technologies Association's review of those figures showed China taking 33.5% of Japanese exports, up 16%, and India taking 6.2%, up 12%. That gap shows overseas buyers adding capacity while Japanese demand stayed flat. Purchases of new machining centers therefore add sump volume and refill cycles once they are commissioned. This order pattern supports the faster growth projected for India and Remaining Asia Pacific through 2035.
Chlorine rules and service contracts reshape fluid buying
The shift away from chlorinated paraffin additives
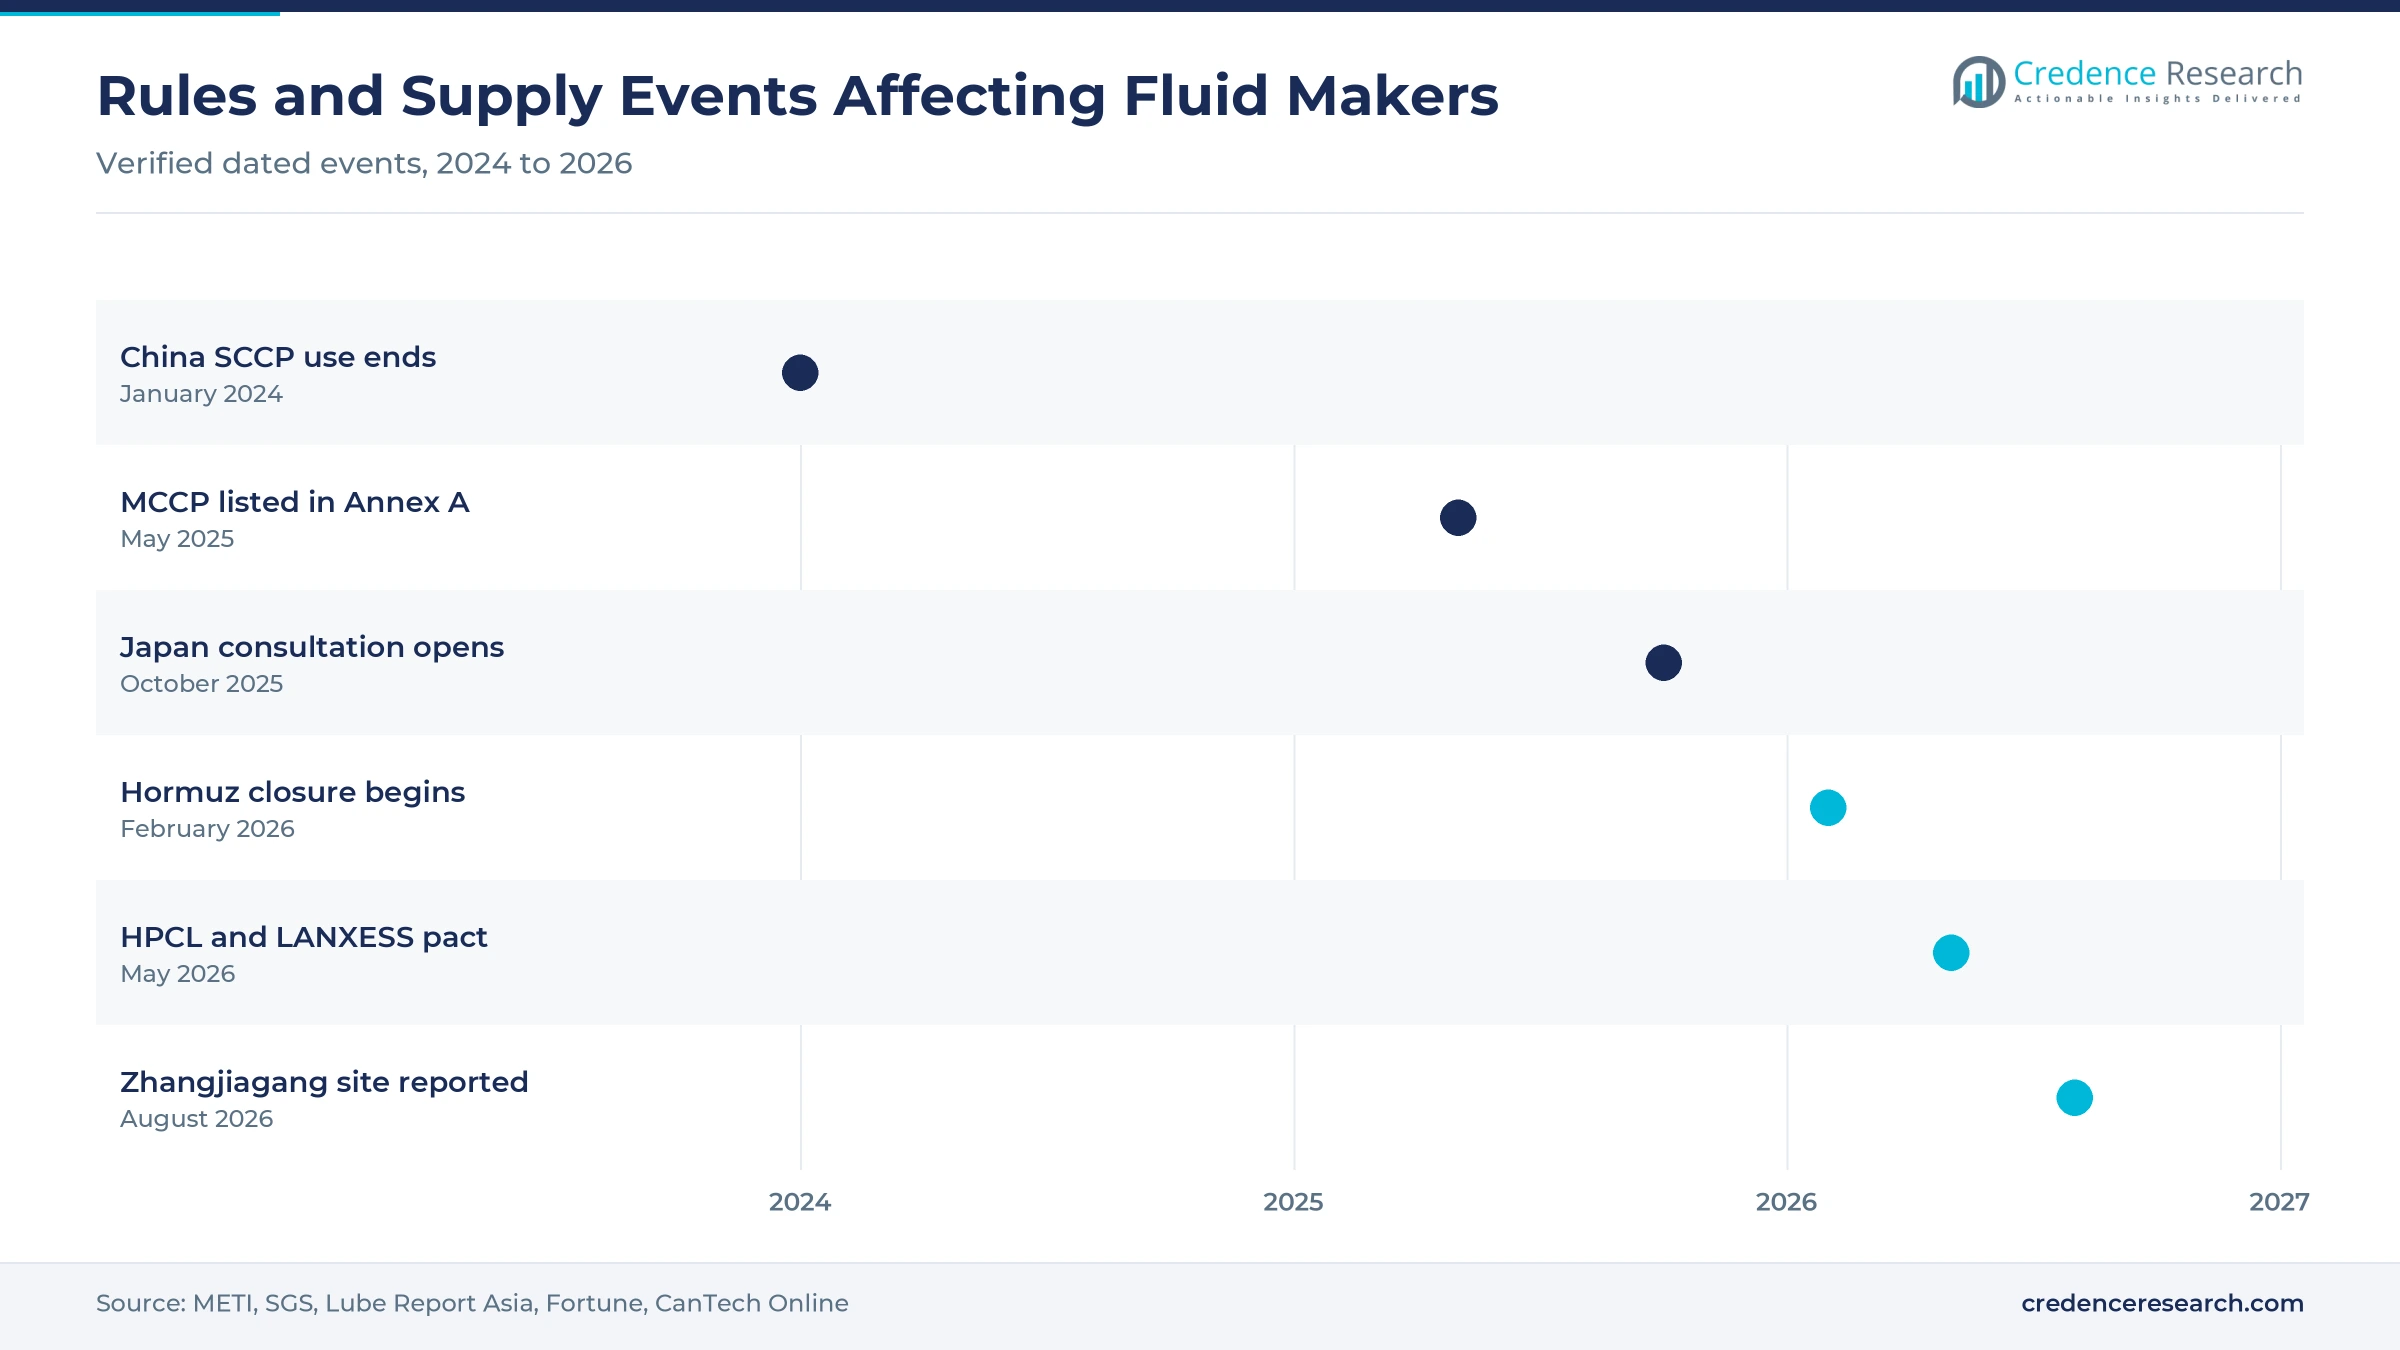
Chlorine-free formulation has moved from a preference to a compliance task. The Japanese trade ministry reported in May 2025 that Stockholm Convention parties listed medium-chain chlorinated paraffins, a material used in metalworking fluids, in Annex A. SGS reported in October 2025 that Japan proposed manufacture and import bans for 2026, naming lubricating and metalworking fluids among covered products. China had already ended its short-chain exemptions on Dec. 31, 2023, according to Lube Report Asia. Suppliers are responding with catalog changes, and ENEOS markets RELIAPRESS RC grades as non-chlorine oils for stainless steel. The Society of Tribologists and Lubrication Engineers still notes that many operations lack a workable substitute, so reformulation will take years.
The rise of supplier-run fluid management inside plants
Plants increasingly buy a managed outcome rather than drums of concentrate. Castrol India described Chemical Management Services in August 2025 as taking lubricant work off the manufacturer's mind, and it counted more than 730 sites. Quaker Houghton told investors on Feb. 23, 2026, that its Fluid Intelligence offering adds measurement, automation and digital tools to its plant service. An OEM Update Magazine case in September 2025 described one grinding shop with a sump life of only three to four months and high top-up costs, which is the expense these contracts target. This model favors Automotive Manufacturing, which held 41.0% of 2025 value and runs enough lines to justify resident engineers.
An opening for local blending near Chinese automotive clusters
Local production is an opening because shorter supply lines protect service levels during freight and feedstock disruption. Quaker Houghton's Zhangjiagang facility, reported by CanTech Online on Aug. 12, 2026, adds die casting and grease lines serving steel, aluminum and automotive customers. FUCHS named China the main driver of its Asia-Pacific development in results published March 20, 2026, with support from Australia and India. Its Suzhou plant already offers 100,000 tons of first-phase capacity. Chaoshui Technology opened a 30,000-ton metalworking fluid line in August 2023, Lube Report Asia reported, showing domestic rivals are investing too. Regional blenders that can reach Metal Forming Fluids buyers, the fastest product group at 5.23%, stand to gain the most.
An opening in Indian and southeast Asian supply partnerships
India offers the clearest opening for partnerships because domestic oil companies hold distribution while specialists hold chemistry. Hindustan Petroleum and LANXESS signed a memorandum on May 12, 2026, covering synthetic basestocks and industrial lubricants for India and SAARC countries. Autocar Professional described Hindustan Petroleum as the largest distributor of industrial lubricants in the country. Yushiro already operates in India, Thailand, Malaysia and Indonesia, according to an Envalith company summary, which gives it a route to Japanese transplant factories. SIAM reported 2.17 crore two-wheelers in fiscal 2025-26, up 10.7%, and that volume sustains small component shops. These conditions support the faster growth projected for India and Remaining Asia Pacific through 2035.
Base oil shocks and paraffin bans test fluid margins
How did the Hormuz closure change feedstock costs?
Feedstock volatility is the sharpest margin risk for mineral-heavy suppliers. Fortune reported on May 29, 2026, that spot prices for some affected base oils had nearly tripled after the Strait of Hormuz closure began in late February. Lubes'n'Greases still showed Group II 150N at USD 1,750 to USD 1,790 per ton FOB Asia on July 6. Fortune added that major lubricant makers raised prices three times in about three months. Small blenders without contract base oil supply feel this first, because they buy closest to spot.
Why is replacing chlorinated additives slow and costly?
Reformulation carries technical risk because chlorinated paraffins remain cost effective across wide temperature ranges. The Society of Tribologists and Lubrication Engineers reported that no workable substitute exists for many metalworking applications, and an EU proposal would keep medium-chain uses until 2036. Japanese suppliers face a shorter horizon after the May 2025 Stockholm listing and the proposed domestic ban, while exporters must follow both timetables. Forming shops working stainless steel carry the highest burden, so they usually need repeat tool-life trials before approving any chlorine-free oil.
Does slowing Chinese steel output limit mill demand?
Mill demand is under pressure because tonnage has stopped rising in the largest market. China's crude steel output fell 4.4% in 2025, according to World Steel Association data reported by Engineering News in January 2026. Japan's December 2025 output also fell 4.8%, according to SteelOrbis. Rolling oil suppliers therefore compete for a flatter volume pool, with steel lines more exposed than Aluminium Metalworking.
Can small suppliers survive tighter Chinese competition?
Fragmentation squeezes smaller formulators because customers now want both lower prices and newer materials support. Lube Report Asia reported in April 2023 that speakers at a Shanghai conference said Chinese metalworking fluid makers must make big changes to survive. Quaker Houghton management said in February 2026 that China is still growing, though not as it used to. Small suppliers lacking laboratories or plant technicians face the greatest exposure, so consolidation and technical alliances remain the most realistic responses for them.
China dominates while India adds the fastest volume
| Country | Value, 2025 (USD billion) | Share, 2025 | CAGR, 2026–2035 |
|---|---|---|---|
| China | 3.65 | 65.2% | 4.66% |
| Japan | 0.86 | 15.4% | 3.56% |
| India and Remaining Asia Pacific | 0.73 | 13.1% | 6.66% |
| South Korea | 0.35 | 6.3% | 4.16% |
China carries the largest fluid volume in Asia Pacific
China held 65.2% of 2025 value and grows at 4.66% a year, slightly below the regional rate as steel tonnage flattens. Vehicle production offsets that drag, because new energy vehicle output of 16.52 million units increased machining of housings, rotors and battery trays. Foreign specialists are localizing further, with Quaker Houghton adding die casting lines at Zhangjiagang and FUCHS operating its largest Chinese plant in Suzhou. Domestic blenders compete hardest at lower price points, which keeps pressure on standard soluble oils.
Japan sets chemistry standards despite slower volume
Japan held 15.4% of 2025 value and grows at 3.56% a year, the slowest rate in the region. Domestic machine tool orders slipped 0.2% in 2025, while JAMA counted vehicle output 2.1% higher. Japanese suppliers such as Yushiro, ENEOS and Idemitsu export their formulations with transplant factories across Asia, so domestic specifications travel abroad. The proposed 2026 restrictions on medium-chain chlorinated paraffins will therefore influence fluid selection well beyond Japan, particularly in Thai, Indonesian and Indian component plants.
South Korea depends on export-led vehicle lines
South Korea held 6.3% of 2025 value and grows at 4.16% a year, limited by a mature production base. The Ministry of Trade, Industry and Energy reported domestic vehicle output down 0.6% at 4.1 million units in 2025, with about 67% of that total exported. KAMA forecast only 1.2% growth for 2026 in its December 2025 outlook. Hyundai's dedicated Ulsan electric vehicle plant, planned at 200,000 units a year, gives fluid suppliers a clearer route to new specifications.
India leads growth among remaining Asia Pacific markets
India and Remaining Asia Pacific held 13.1% of 2025 value and grow fastest at 6.66% a year. India anchors this rate, since SIAM reported 46.43 lakh passenger vehicles in fiscal 2025-26, up 7.9%. Maruti Suzuki has also identified land at Sanand for a fifth plant of 10 lakh units a year. Fluid supply is deepening alongside, as ExxonMobil's Raigad project targets steel and manufacturing buyers. Indian Oil and Hindustan Petroleum extend this reach through SERVOcut products and national lubricant distribution.
Plants, pacts and chemical rules marking 2025 and 2026
| Development | Status and market relevance |
|---|---|
| In May 2025, Stockholm Convention parties listed medium-chain chlorinated paraffins in Annex A, according to Japan's trade ministry. | Sets the elimination path for a metalworking additive |
| In September 2025, Yushiro deconsolidated its Shanghai joint venture, according to an Envalith company summary. | Changes how Yushiro participates in Chinese demand |
| In October 2025, Japanese authorities opened consultation on bans covering metalworking fluids containing these paraffins, SGS reported. | Proposed manufacture and import bans for 2026 |
| In May 2026, Hindustan Petroleum and LANXESS signed a memorandum on industrial lubricants and synthetic basestocks. | Widens synthetic supply for India and SAARC buyers |
| In August 2026, CanTech Online reported Quaker Houghton's new Zhangjiagang manufacturing site in China. | Adds die casting and grease product lines |
Chemistry choices now decide which formulations win
- Chlorine-free forming oils are replacing paraffin-based packages on stainless steel work, with ENEOS positioning RELIAPRESS RC grades as comparable to chlorinated oils.
- Synthetic soluble grades reduce dependence on mineral base stocks, and Indian Oil now lists SERVOsynth grades alongside soluble and neat cutting oils.
- Low-aromatic rolling oils serve aluminum mills that need clean surfaces, which explains ENEOS's UNIROLL NAR range for that specific duty.
- Fluid monitoring tools give plants earlier warning of concentration and contamination faults, as Quaker Houghton describes in its Fluid Intelligence service offering.
Need a Custom Version of This Report?
Tailor the scope, geography, or segments to your exact requirements.
- Custom geography or segment scope
- Direct access to our analyst team
Global specialists compete with regional oil companies
Competition splits into three groups, and each one defends a different kind of customer relationship. Global specialists such as Quaker Houghton and FUCHS sell plant service and qualified chemistry to carmakers and mills. Quaker Houghton reported Asia-Pacific organic volume growth of 5% for 2025, while its 2025 acquisitions included Dipsol. Japanese suppliers including Yushiro, Idemitsu and ENEOS follow domestic manufacturers overseas and hold long approvals on their lines. Oil companies such as Indian Oil, Hindustan Petroleum, Castrol and ExxonMobil use blending scale and distribution, with broad catalogs covering soluble, neat and rolling oils. Pricing power varies by duty, since standard soluble oils trade close to feedstock cost while qualified forming and aerospace grades hold value. Service depth, rather than tonnage alone, increasingly separates the suppliers gaining share.
Companies profiled and their roles in this market
| Company | Type | Role in the market |
|---|---|---|
| Quaker Houghton | Specialist | New Zhangjiagang lines and plant-level fluid service for steel, aluminum and automotive customers |
| FUCHS SE | Specialist | Suzhou plant with 100,000 tons of first-phase capacity, serving automotive and industrial users |
| Yushiro Inc. | Specialist | Japanese fluid maker with operations in India, Thailand, Malaysia and Indonesia |
| Idemitsu Kosan | Oil company | Daphne Alphacool CS cutting oil sold from its Indian Patalganga operation |
| ENEOS Corporation | Oil company | RELIAPRESS forming oils, RELIASOL cutting fluids and UNIROLL rolling oils |
| Castrol | Oil company | More than 730 Chemical Management Services sites reported by Castrol India |
| ExxonMobil | Oil company | Isambe plant in Raigad, planned at up to 159,000 kiloliters a year |
| Hindustan Petroleum Corporation Limited | Oil company | Industrial lubricant distributor and LANXESS memorandum partner |
| Indian Oil Corporation | Oil company | SERVOcut, SERVOsynth and SERVOarol metalworking ranges |
Service depth matters more than tonnage growth
Credence Research's view is that this market rewards plant presence more than simple volume exposure. Chinese steel tonnage is falling, yet Quaker Houghton still reported ten straight quarters of regional volume growth through the fourth quarter of 2025. That contrast suggests share is moving toward suppliers that can manage sumps and prove longer tool life. Buyers should test chlorine-free packages now, because Japan's proposed 2026 restrictions shorten qualification time. Suppliers should also treat Synthetic Formulations as a hedge against mineral feedstock swings, though synthetic grades need their own feedstock checks.
How the coolant and forming oil estimates were built
The report uses 2025 as the base year and forecasts to 2035 using the Credence Research market model. Values are model outputs, while segment and country splits are Credence Research estimates informed by public output data. Sources include national statistics, trade association releases, company filings and presentations, regulator notices and named trade press pages. No primary interviews or surveys were conducted for this edition. Pricing inputs rely on published Asian base oil assessments, and they are the most assumption-sensitive part of the estimate because delivered fluid prices are rarely disclosed.
Aluminum parts and synthetics lead demand through 2035
Through 2035 the market grows to USD 8.94 billion at a 4.75% CAGR, with value rising faster than liters as plants adopt longer-life chemistry. Aluminum work should gain share as electric vehicle structures expand, and Aluminium Metalworking is projected at 5.54% a year. China stays dominant, though its share eases as India adds capacity. Chemical rules will keep removing older additives, particularly where exports to Japan or Europe matter. Base oil prices remain the main uncertainty in the near term, since Fortune cited one analyst expecting normal supply only well into 2027.
Frequently Asked Questions
How big is the Asia Pacific metalworking fluids market?
Which country leads the regional market?
Which product type holds the largest share?
Which area is growing fastest?
How do chemical rules affect fluid suppliers?
How did the 2026 Hormuz closure affect suppliers?
Which technology is growing fastest?
Who are the main companies in this market?
Table of Content
Chapter 1 Market Segmentation
- 1.1 Segmentation Framework
- 1.1.1 Product and Service Classification
- 1.1.2 Application and End-Use Classification
- 1.1.3 Technology and Solution Classification
- 1.1.4 Customer and Distribution Channel Classification
- 1.1.5 Geographic Segmentation
- 1.1.6 Market Segment Definitions and Boundaries
- 1.2 By Product Type
- 1.2.1 Metal Removal Fluids
- 1.2.2 Metal Forming Fluids
- 1.2.3 Metal Protecting Fluids
- 1.2.4 Metal Treating Fluids
- 1.3 By End-Use Industry
- 1.3.1 Automotive Manufacturing
- 1.3.2 Machinery and Transport Equipment
- 1.3.3 Primary Metal Processing
- 1.3.4 Precision Component Manufacturing
- 1.4 By Application
- 1.4.1 Ferrous Metalworking
- 1.4.2 Aluminium Metalworking
- 1.4.3 Specialty Nonferrous Metalworking
- 1.5 By Technology
- 1.5.1 Mineral-Based Formulations
- 1.5.2 Semi-Synthetic Formulations
- 1.5.3 Synthetic Formulations
- 1.6 By Country
- 1.6.1 China
- 1.6.2 Japan
- 1.6.3 South Korea
- 1.6.4 India and Remaining Asia Pacific
Chapter 2 Introduction
- 2.1 Report Objectives and Scope
- 2.2 Product Definition and Industry Terminology
- 2.3 Market Inclusions and Exclusions
- 2.4 Research Process
- 2.4.1 Primary Research and Expert Interviews
- 2.4.2 Secondary Research and Source Review
- 2.4.3 Top-Down and Bottom-Up Estimation
- 2.4.4 Data Triangulation and Verification
- 2.5 Market Size Measurement Basis
- 2.5.1 2025: USD 5.60 billion → 2035: USD 8.94 billion
- 2.6 Historical and Forecast Reference Periods
- 2.6.1 Historical Period: 2018-2025
- 2.6.2 Base Year: 2025
- 2.6.3 Forecast Period: 2025-2035
- 2.7 Research Assumptions and Limitations
Chapter 3 Executive Summary
- 3.1 Market Snapshot and Key Findings
- 3.2 Base-Year Market Size, 2025
- 3.3 Forecast Market Size, 2035
- 3.4 Revenue and Volume Growth Outlook
- 3.5 Key Demand and Supply Indicators
- 3.6 Leading Market Segments
- 3.7 Fastest-Growing Market Opportunities
- 3.8 Regional Performance Highlights
- 3.9 Technology and Industry Transformation
- 3.10 Competitive Landscape Summary
- 3.11 Analyst View and Strategic Implications
Chapter 4 Asia Pacific Metalworking Fluids Market Trends and Developments
- 4.1 Historical Industry Development, 2018-2025
- 4.2 Recent Market Trends and Developments
- 4.3 Demand and Customer Behavior Trends
- 4.4 Technology and Product Innovation
- 4.5 Artificial Intelligence, Automation and Digitalization
- 4.6 Local Manufacturing and Supply Chain Realignment
- 4.7 Industry Partnerships, Mergers and Acquisitions
- 4.8 Sustainability and Circular Economy Developments
- 4.9 Government and Private Sector Investment Trends
- 4.10 Emerging Business Models and Commercialization
- 4.11 Industry Developments and Announcements
Chapter 5 Asia Pacific Metalworking Fluids Market Production, Supply and Demand Analysis
- 5.1 Demand Trend and Consumption Analysis, 2018-2025
- 5.2 Demand Forecast, 2025-2035
- 5.3 Production and Output Trend, 2018-2025
- 5.4 Production and Output Forecast, 2025-2035
- 5.5 Installed Capacity and Capacity Utilization
- 5.6 Company-Wise Production Plants and Statistics
- 5.6.1 Installed Production Capacity
- 5.6.2 Actual Production
- 5.6.3 Planned Capacity and Expansion Targets
- 5.7 Supply Chain Structure and Procurement Trends
- 5.8 Supply-Demand Gap and Bottlenecks
- 5.9 Import Dependence and Sourcing Structure
- 5.10 Contract Manufacturing and Outsourcing
- 5.11 Regional Supply and Demand Concentration
Chapter 6 Asia Pacific Metalworking Fluids Market Pricing Analysis
- 6.1 Pricing Structure and Measurement
- 6.2 Historical Pricing Trends, 2018-2025
- 6.3 Pricing Outlook, 2025-2035
- 6.4 Average Selling Price and Unit Economics
- 6.5 Pricing by Product and Market Segment
- 6.6 Geographic Pricing Differences
- 6.7 Key Input, Energy, Labor and Logistics Costs
- 6.8 Contract Pricing and Purchasing Models
- 6.9 Pricing Sensitivity and Competitive Positioning
- 6.10 Price, Margin and Profitability Implications
Chapter 7 Asia Pacific Metalworking Fluids Market Dynamics
- 7.1 Market Growth Drivers
- 7.1.1 Demand-Side Drivers
- 7.1.2 Technology and Innovation Drivers
- 7.1.3 Infrastructure and Investment Drivers
- 7.1.4 Regulatory and Policy Drivers
- 7.2 Market Restraints
- 7.2.1 Cost and Affordability Constraints
- 7.2.2 Technology and Adoption Barriers
- 7.2.3 Supply Chain and Operational Constraints
- 7.3 Market Challenges
- 7.3.1 Competitive Pressure and Margin Erosion
- 7.3.2 Skills, Infrastructure and Implementation Gaps
- 7.4 Emerging Market Opportunities
- 7.5 Market Dynamics Impact and Time-Horizon Assessment
Chapter 8 Asia Pacific Metalworking Fluids Value Chain Analysis
- 8.1 Industry Value Chain Overview
- 8.2 Upstream Suppliers and Critical Inputs
- 8.3 Technology and Component Providers
- 8.4 Manufacturing or Service Delivery
- 8.5 Distribution, Channel Partners and Integrators
- 8.6 Downstream Applications and End Users
- 8.7 Value Addition and Profit Pools
- 8.8 Vertical Integration and Outsourcing
- 8.9 Supplier Concentration and Risk
- 8.10 Supply Chain Localization and Resilience
Chapter 9 Asia Pacific Metalworking Fluids Market Regulations and Policies
- 9.1 Relevant Laws, Standards and Compliance Frameworks
- 9.2 Product, Service, Safety and Quality Requirements
- 9.3 Government Policies, Incentives and Subsidies
- 9.4 Imports, Exports and Trade Barriers
- 9.5 Public Procurement and Local Content Requirements
- 9.6 Environmental and Sustainability Compliance
- 9.7 Upcoming Policy Changes and Market Implications
Chapter 10 Asia Pacific Metalworking Fluids Market Hotspots and Opportunities
- 10.1 Market Opportunity Mapping and Growth Hotspots
- 10.2 High-Growth Applications and Customer Groups
- 10.3 Underserved Markets and White-Space Opportunities
- 10.4 Emerging Technology and Product Opportunities
- 10.5 New Capacity and Investment Hotspots
- 10.6 Market Entry and Expansion Opportunities
- 10.7 Distribution and Partnership Opportunities
- 10.8 Near-Term and Long-Term Commercial Potential
- 10.9 Opportunity Attractiveness and Execution Risks
Chapter 11 Asia Pacific Metalworking Fluids Market Outlook, 2025-2035
- 11.1 Market Size and Analysis
- 11.1.1 Revenue (Market Measurement: 2025: USD 5.60 billion → 2035: USD 8.94 billion)
- 11.1.2 Market Volume and Quantity Sold
- 11.1.3 Historical Market Size, 2018-2025
- 11.1.4 Base-Year Market Size, 2025
- 11.2 Market Forecast, 2025-2035
- 11.2.1 Revenue Forecast to 2035
- 11.2.2 Volume Forecast to 2035
- 11.2.3 CAGR and Year-on-Year Growth
- 11.2.4 Incremental Revenue Opportunity
- 11.3 Forecast Assumptions and Scenario Analysis
- 11.3.1 Base-Case Forecast
- 11.3.2 Optimistic and Conservative Scenarios
- 11.3.3 Technology, Pricing and Policy Sensitivities
- 11.4 Market Attractiveness and Growth Outlook
Chapter 12 Asia Pacific Metalworking Fluids Market Segmentation and Outlook
- 12.1 Segmentation Summary and Market Shares, 2025
- 12.2 Largest and Fastest-Growing Segments
- 12.3 By Product Type - Market Size and Forecast, 2025-2035
- 12.3.1 Segment Definition and Scope
- 12.3.2 Historical Market Size, 2018-2025
- 12.3.3 Revenue Forecast, 2025-2035
- 12.3.4 Volume Forecast, 2025-2035
- 12.3.5 Base-Year Market Share, 2025
- 12.3.6 Segment CAGR and Growth Drivers
- 12.3.7 Subsegment Market Size and Forecast
- 12.3.7.1 Metal Removal Fluids
- 12.3.7.2 Metal Forming Fluids
- 12.3.7.3 Metal Protecting Fluids
- 12.3.7.4 Metal Treating Fluids
- 12.3.8 Subsegment Pricing and Adoption Trends
- 12.3.9 Leading Suppliers and Competition
- 12.3.10 Regional Demand and Opportunities
- 12.4 By End-Use Industry - Market Size and Forecast, 2025-2035
- 12.4.1 Segment Definition and Scope
- 12.4.2 Historical Market Size, 2018-2025
- 12.4.3 Revenue Forecast, 2025-2035
- 12.4.4 Volume Forecast, 2025-2035
- 12.4.5 Base-Year Market Share, 2025
- 12.4.6 Segment CAGR and Growth Drivers
- 12.4.7 Subsegment Market Size and Forecast
- 12.4.7.1 Automotive Manufacturing
- 12.4.7.2 Machinery and Transport Equipment
- 12.4.7.3 Primary Metal Processing
- 12.4.7.4 Precision Component Manufacturing
- 12.4.8 Subsegment Pricing and Adoption Trends
- 12.4.9 Leading Suppliers and Competition
- 12.4.10 Regional Demand and Opportunities
- 12.5 By Application - Market Size and Forecast, 2025-2035
- 12.5.1 Segment Definition and Scope
- 12.5.2 Historical Market Size, 2018-2025
- 12.5.3 Revenue Forecast, 2025-2035
- 12.5.4 Volume Forecast, 2025-2035
- 12.5.5 Base-Year Market Share, 2025
- 12.5.6 Segment CAGR and Growth Drivers
- 12.5.7 Subsegment Market Size and Forecast
- 12.5.7.1 Ferrous Metalworking
- 12.5.7.2 Aluminium Metalworking
- 12.5.7.3 Specialty Nonferrous Metalworking
- 12.5.8 Subsegment Pricing and Adoption Trends
- 12.5.9 Leading Suppliers and Competition
- 12.5.10 Regional Demand and Opportunities
- 12.6 By Technology - Market Size and Forecast, 2025-2035
- 12.6.1 Segment Definition and Scope
- 12.6.2 Historical Market Size, 2018-2025
- 12.6.3 Revenue Forecast, 2025-2035
- 12.6.4 Volume Forecast, 2025-2035
- 12.6.5 Base-Year Market Share, 2025
- 12.6.6 Segment CAGR and Growth Drivers
- 12.6.7 Subsegment Market Size and Forecast
- 12.6.7.1 Mineral-Based Formulations
- 12.6.7.2 Semi-Synthetic Formulations
- 12.6.7.3 Synthetic Formulations
- 12.6.8 Subsegment Pricing and Adoption Trends
- 12.6.9 Leading Suppliers and Competition
- 12.6.10 Regional Demand and Opportunities
- 12.7 By Country - Market Size and Forecast, 2025-2035
- 12.7.1 Segment Definition and Scope
- 12.7.2 Historical Market Size, 2018-2025
- 12.7.3 Revenue Forecast, 2025-2035
- 12.7.4 Volume Forecast, 2025-2035
- 12.7.5 Base-Year Market Share, 2025
- 12.7.6 Segment CAGR and Growth Drivers
- 12.7.7 Subsegment Market Size and Forecast
- 12.7.7.1 China
- 12.7.7.2 Japan
- 12.7.7.3 South Korea
- 12.7.7.4 India and Remaining Asia Pacific
- 12.7.8 Subsegment Pricing and Adoption Trends
- 12.7.9 Leading Suppliers and Competition
- 12.7.10 Regional Demand and Opportunities
- 12.8 Segment Growth Comparison
- 12.9 Segment Attractiveness and Priority Matrix
Chapter 13 Asia Pacific Metalworking Fluids End-Use and Application Market Outlook
- 13.1 End-Use Industry and Customer Demand Structure
- 13.2 Leading Applications and Customer Groups
- 13.3 End-Use Market Size, Share and Forecast
- 13.4 Major End-Use Industry Deep Dives
- 13.4.1 Customer Requirements and Use Cases
- 13.4.2 Demand and Replacement Cycles
- 13.4.3 Technical and Regulatory Considerations
- 13.4.4 Purchasing and Procurement Models
- 13.4.5 Leading Vendors and Distribution Channels
- 13.4.6 Forecast and Commercial Opportunities
- 13.5 Emerging Applications and Cross-Segment Demand
- 13.6 End-Use Industry Investment Priorities
Chapter 14 Asia Pacific Metalworking Fluids Geographic Market Outlook, 2025-2035
- 14.1 Regional Market Size and Country-Level Shares, 2025
- 14.2 Country Market Size Comparison, 2025
- 14.3 Country Market Forecasts, 2025-2035
- 14.4 Subregional Industrial and Demand Clusters
- 14.5 Intra-Regional Pricing and Cost Differences
- 14.6 Cross-Border Trade and Supply Networks
- 14.7 Regional Supply and Demand Balances
- 14.8 Country Opportunity Comparison and Prioritization
Note: Every listed country is covered on the structure shown under the first country.
Chapter 15 Asia Pacific Metalworking Fluids Technology, Innovation and Sustainability Outlook
- 15.1 Technology Landscape and Maturity
- 15.2 Product, Process and Service Innovation
- 15.3 AI, Automation and Digital Tools in the Industry
- 15.4 Technology Adoption and Performance Benchmarking
- 15.5 Innovation Pipeline and R&D Investment
- 15.6 Patent and Intellectual Property Trends
- 15.7 Energy Efficiency and Resource Management
- 15.8 Sustainability, Recycling and Circularity
- 15.9 Technology Roadmap, 2025-2035
- 15.10 Risks of Obsolescence and Technology Substitution
Chapter 16 Asia Pacific Metalworking Fluids Market Key Strategic Imperatives
- 16.1 Growth and Market Entry Priorities
- 16.2 High-Return Products and Segments
- 16.3 Pricing, Profitability and Cost Optimization
- 16.4 Technology Investment and Product Differentiation
- 16.5 Supply Chain Localization and Resilience
- 16.6 Distribution and Customer Acquisition
- 16.7 Partnership, Acquisition and Capacity Strategy
- 16.8 Regional Expansion Priorities
- 16.9 Short-, Medium- and Long-Term Actions
Chapter 17 Competition Outlook
- 17.1 Industry Competition Characteristics
- 17.2 Market Structure and Concentration
- 17.3 Market Share and Competitive Positioning, 2025
- 17.4 Company-Wise Revenue and Product Benchmarking
- 17.5 Production and Service Capacity Benchmarking
- 17.6 Technology, Pricing and Differentiation
- 17.7 Regional Footprint and Distribution Strength
- 17.8 Mergers, Acquisitions and Strategic Alliances
- 17.9 New Entrants and Competitive Threats
- 17.10 Porter's Five Forces and Industry Attractiveness
- 17.11 Competitive Outlook, 2025-2035
Chapter 18 Company Profiles
- 18.1 Company Coverage and Selection Criteria
- 18.2 Quaker Houghton
- 18.2.1 Business Description
- 18.2.2 Company Ownership and Geographic Presence
- 18.2.3 Product and Service Portfolio
- 18.2.4 Manufacturing and Operating Footprint
- 18.2.5 Production Capacity and Expansion Plans
- 18.2.6 Financial Performance and Investment
- 18.2.7 Market Share and Competitive Position
- 18.2.8 Technology and Innovation Capabilities
- 18.2.9 Strategic Alliances or Partnerships
- 18.2.10 Recent Developments
- 18.2.11 Growth Strategy and Outlook
- 18.3 FUCHS SE
- 18.4 Sinopec Lubricant Company
- 18.5 Yushiro Inc.
- 18.6 Idemitsu Kosan
- 18.7 Castrol
- 18.8 ExxonMobil
- 18.9 ENEOS Corporation
- 18.10 Hindustan Petroleum Corporation Limited
- 18.11 Indian Oil Corporation
- 18.12 Other Relevant Market Participants
Note: Every listed company is profiled on the structure shown under the first company. The company list is preliminary and may change based on research findings, market developments, data availability and client requirements.
Chapter 19 Disclaimer
- 19.1 Research and Forecast Disclaimer
- 19.2 Data Source and Estimation Limitations
Note: The depth of individual sections depends on data availability for this market. Volume, capacity, trade and other unit-based metrics are included where applicable.

