National genome programs turn analysis into repeat spending
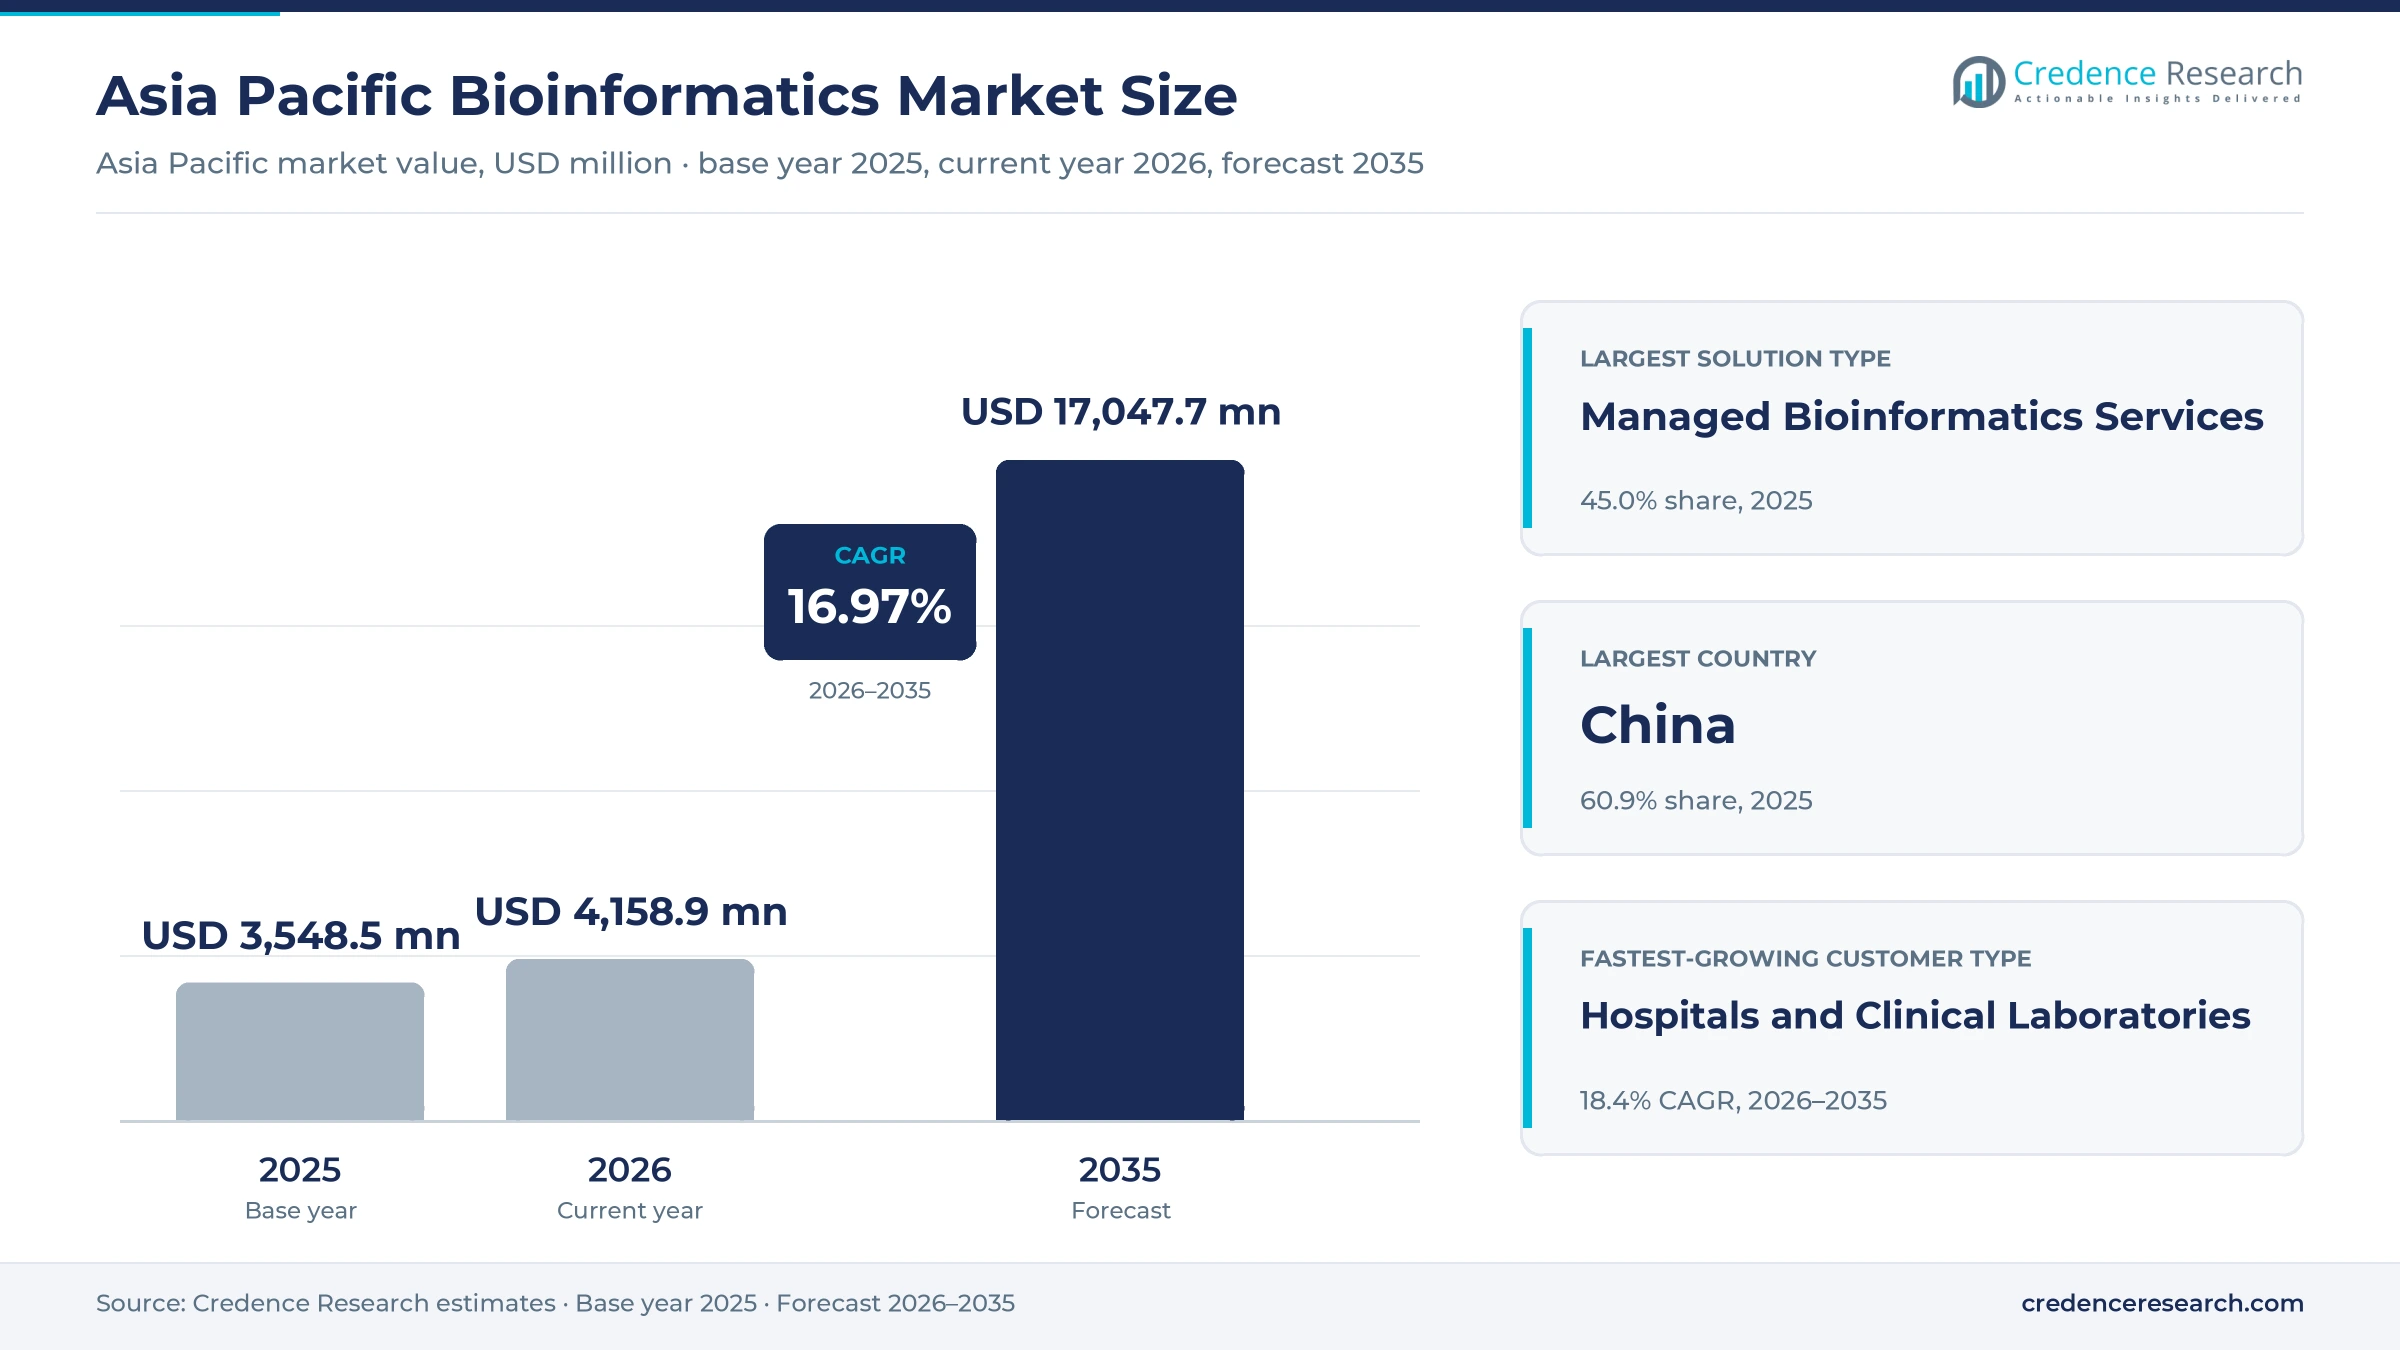
The Asia Pacific bioinformatics market was valued at USD 3.55 billion in 2025 and is projected to increase from USD 4.16 billion in 2026 to USD 17.05 billion by 2035, registering a CAGR of 16.97% during 2026–2035. Demand comes from national population genome programs, outsourced sequencing laboratories, drug developers and hospitals that must turn raw sequence data into variants, reports and drug targets. China held the largest regional share, 60.9% in 2025, because the country hosts the region's largest sequencing service laboratories and keeps most human genetic data under domestic processing rules. India is the fastest-growing country at 19.2% a year, as national genome data and cheaper clinical sequencing reach hospital chains. A notable commercial change came in July 2026, when AWS opened managed genomics workflows in Tokyo, its third Asia Pacific region for the service. Buyers now choose analysis partners on data residency, platform compatibility and clinical validation as much as on price per sample.
Software, services and data that turn sequence reads into decisions
The market counts what research institutes, drug developers, hospitals and contract research organizations in Asia Pacific pay for analytical software platforms, managed bioinformatics services and licensed tools and databases. It covers secondary and tertiary analysis of genomic and other omics data, variant interpretation, drug discovery and cheminformatics software, sold as subscriptions, perpetual licenses, usage-based fees or project contracts.
The count excludes sequencing instruments, reagents and consumables, general laboratory information systems and the raw compute and storage that clouds bill separately. Value moves from sequencer makers that bundle primary analysis to service laboratories, software specialists and cloud platforms that deliver interpretation and drug discovery outputs to end users.
Asia Pacific Bioinformatics Market Insights
- The market rises from USD 3.55 billion in 2025 to USD 17.05 billion by 2035, a 16.97% CAGR, as population genome programs and clinical sequencing create repeat demand for analysis.
- China held 60.9% of 2025 value because large domestic sequencing laboratories and human genetic resource rules keep most analysis inside the country.
- Managed Bioinformatics Services led with 45.0% of 2025 value, since most buyers still send samples to laboratories that return analyzed results.
- India is the fastest-growing country group at 19.2% a year during 2026–2035, as national genome data and in-house hospital sequencing labs widen demand for analysis.
- Insilico Medicine listed in Hong Kong on Dec. 30, 2025, raising HKD 2.277 billion for an AI drug discovery business built on licensed software.
Managed services lead as clinical software grows fastest
Managed services lead while analytical platforms grow fastest
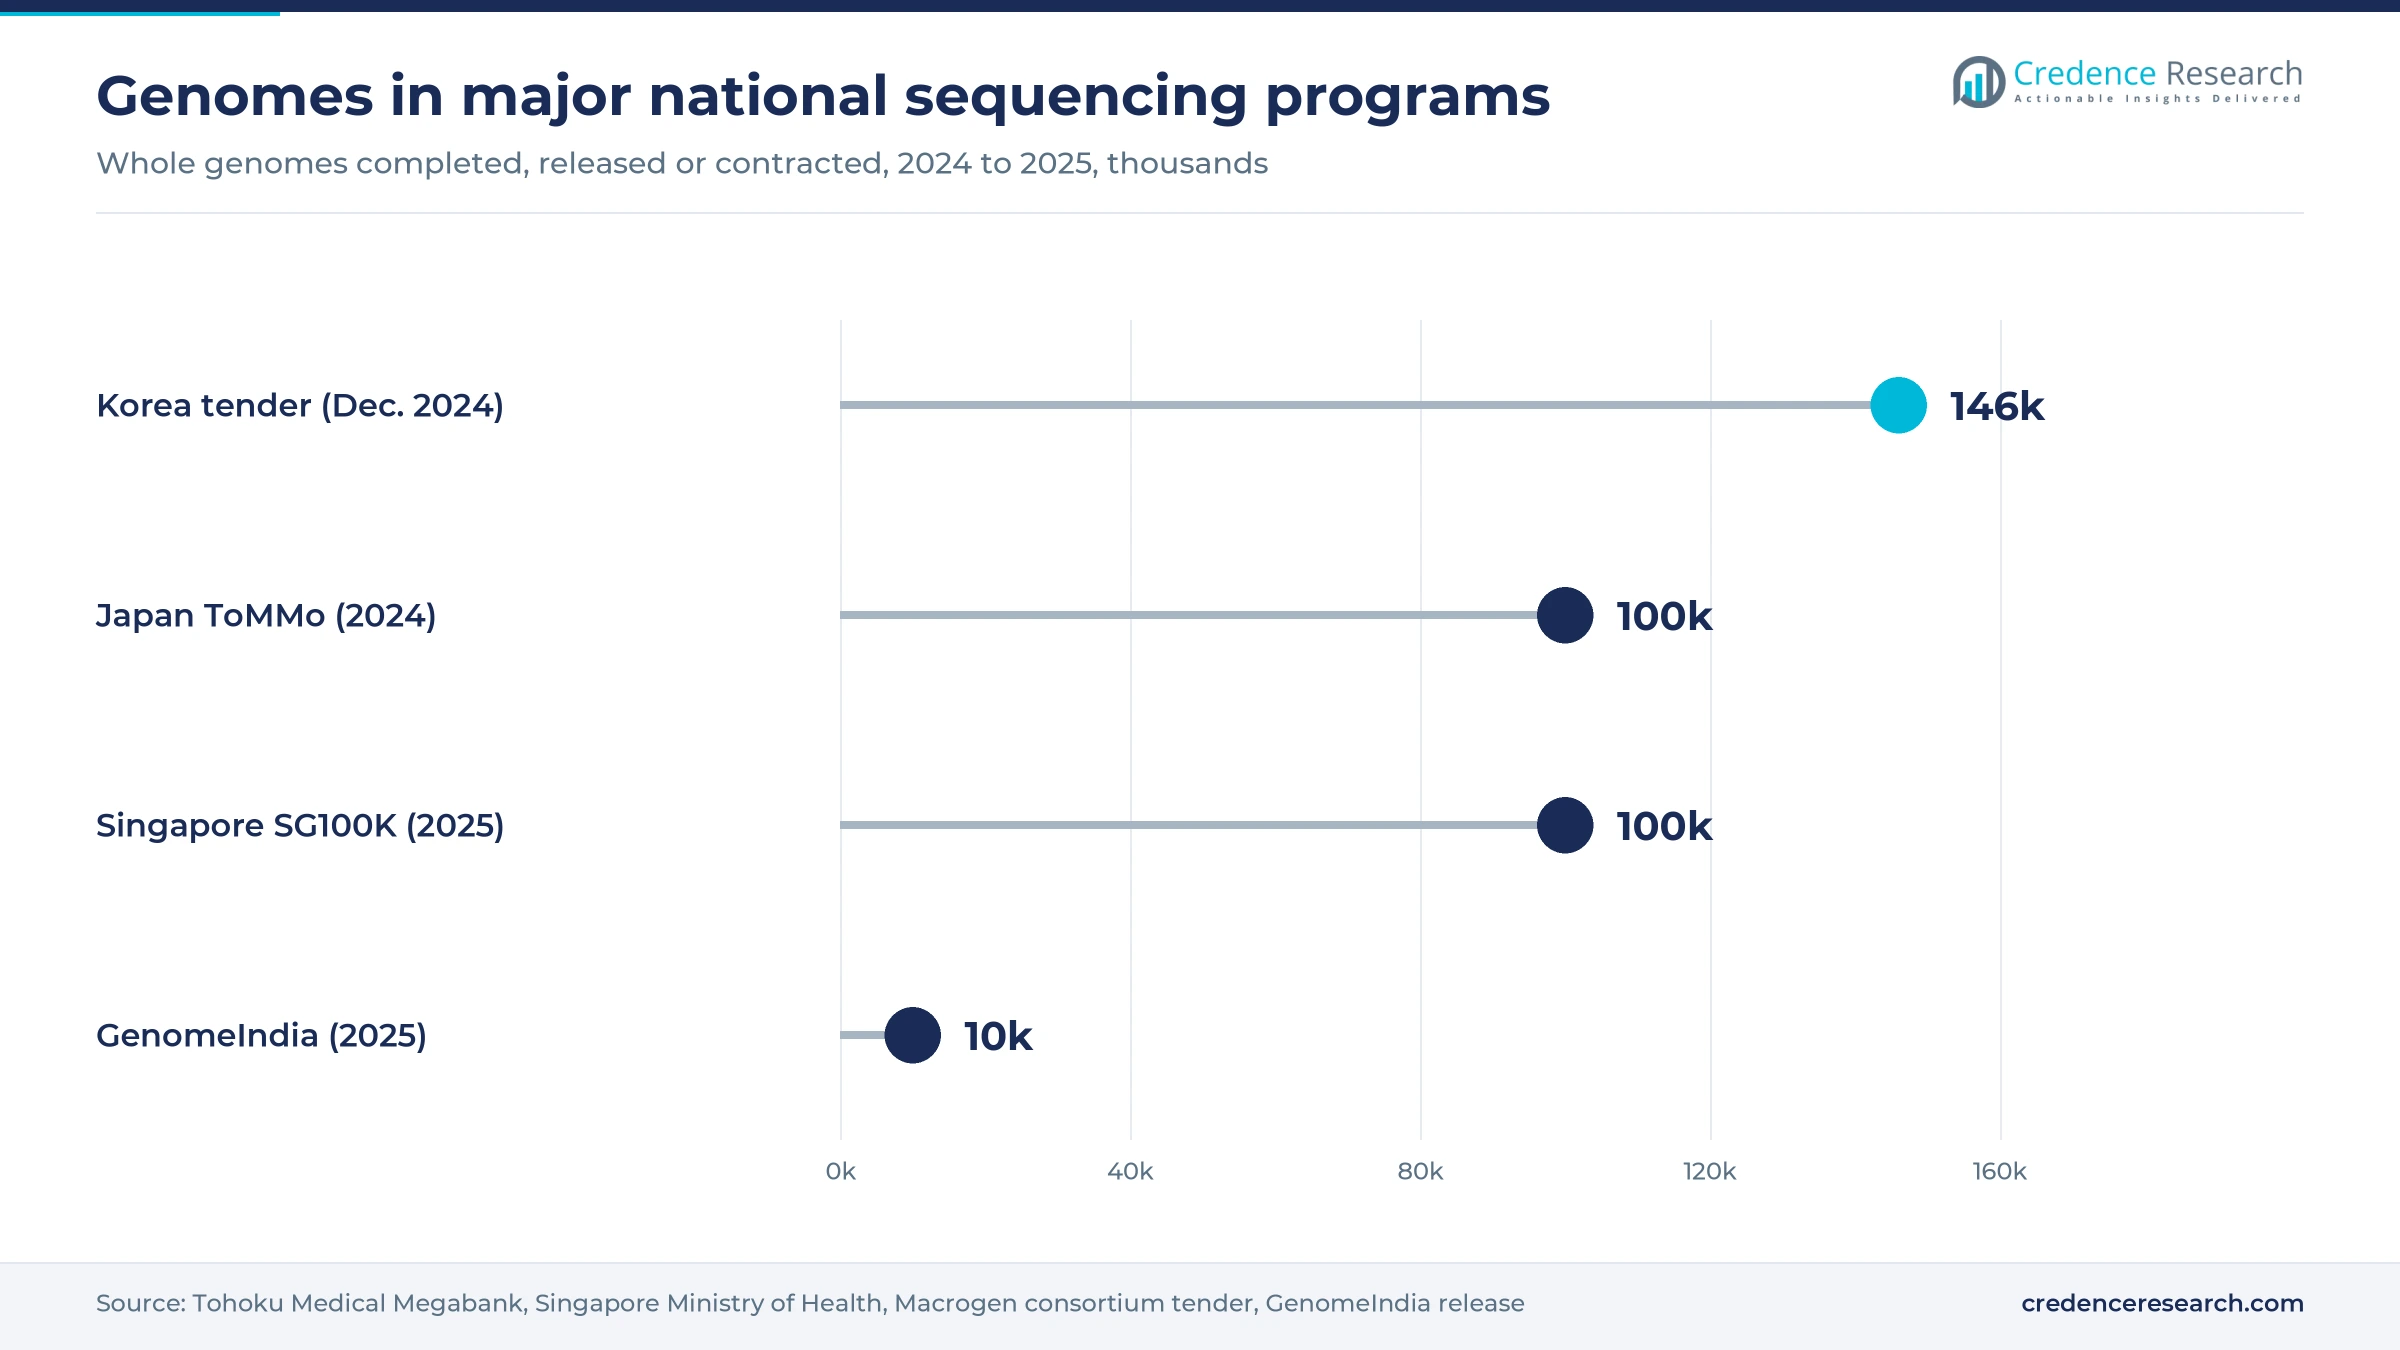
Based on solution type, the market is categorized into analytical software platforms, managed bioinformatics services and licensed tools and databases. Managed Bioinformatics Services led with 45.0% of 2025 value because most buyers send samples to laboratories that sequence and analyze them, and the Macrogen consortium won a Korean tender in December 2024 to sequence and analyze 145,952 genomes, according to MedTech Spectrum. Analytical software platforms grow fastest at 18.1% a year as clinical users bring analysis in house, and Berry Genomics said in November 2025 that it plans to improve AI algorithms and local deployment, Yicai reported. Licensed databases remain essential wherever laboratories must interpret rare or novel variants.
Private infrastructure leads as public cloud grows fastest
Based on deployment model, the market is categorized into public cloud, private infrastructure and hybrid infrastructure. Private Infrastructure led with 44.0% of 2025 value because China bars foreign individuals and foreign-controlled entities from collecting, preserving and exporting human genetic resources, according to Hogan Lovells, so most Chinese analysis stays on domestic servers. Public Cloud grows fastest at 18.3% a year as managed workflows get cheaper, and AWS lists a 30x germline genome workflow at USD 10 per run on HealthOmics. Hybrid estates link hospital servers in Japan, Korea and Australia to cloud capacity for peak sequencing loads and archive storage.
Research institutes lead as hospitals grow fastest
Based on customer type, the market is categorized into academic and research institutes, pharmaceutical and biotechnology companies, hospitals and clinical laboratories, and contract research and development organizations. Academic and Research Institutes led with 41.0% of 2025 value because national cohorts run through research bodies, and Korea plans to open its bio big data to university and hospital researchers from 2026, Asia Economy reported. Hospitals and clinical laboratories grow fastest at 18.4% a year as hospital chains set up in-house sequencing labs, which Illumina named as a target customer group in India in September 2025, according to Business Today.
Genomics leads while drug discovery grows fastest
Based on application, the market is categorized into genomics, drug discovery, molecular omics analytics and cheminformatics. Genomics led with 52.0% of 2025 value because population programs generate the largest data sets, and Tohoku Medical Megabank said in June 2024 that it would release a Japanese whole genome reference panel built from 85,000 people. Drug Discovery grows fastest at 18.2% a year as computational pipelines reach the clinic, and Insilico Medicine said at its Hong Kong listing that 10 of its programs had IND clearance. Molecular omics analytics expand as proteomics and spatial data reach more laboratories.
| Segment Group | Leading Sub-segment | Share, 2025 | Fastest-growing Sub-segment | CAGR, 2026–2035 |
|---|---|---|---|---|
| By Solution Type | Managed Bioinformatics Services | 45.0% | Analytical Software Platforms | 18.1% |
| By Deployment Model | Private Infrastructure | 44.0% | Public Cloud | 18.3% |
| By Customer Type | Academic and Research Institutes | 41.0% | Hospitals and Clinical Laboratories | 18.4% |
| By Application | Genomics | 52.0% | Drug Discovery | 18.2% |
Cheap cloud compute meets costly interpretation
Bioinformatics is priced per sample, per hour of compute, per gigabase stored or per project, and the gap between compute and interpretation is wide. Cloud list prices put a standard 30x germline genome workflow at about USD 10, yet clinical exome and genome tests in India sell for thousands of rupees because they include interpretation and reporting. Drug discovery contracts are priced on milestones rather than per sample. Suppliers earn the best margins on curated databases, clinical reports and milestone deals, while raw pipeline compute is close to a commodity.
| Offer or segment | Typical price or fee | Basis |
|---|---|---|
| Managed genome workflow, cloud (AWS HealthOmics Ready2Run) | USD 10 per 30x germline genome run | AWS HealthOmics price list, U.S. East, 2026 |
| Workflow compute, cloud (omics.c.4xlarge) | USD 0.918 per hour | AWS HealthOmics price list, U.S. East, 2026 |
| Clinical whole exome test, India | About Rs 18,000, down from about Rs 25,000 | YourStory, December 2025 |
| Clinical whole genome test, India | Rs 60,000 or more | YourStory, December 2025 |
| AI drug discovery project contract | Up to USD 18 million upfront and near-term milestones | SK Biopharmaceuticals and Insilico deal, BioSpectrum Asia, June 2026 |
Request a Free Sample
Fill in your details and we'll send you a free sample report.
- Sample data tables & charts
- Research methodology
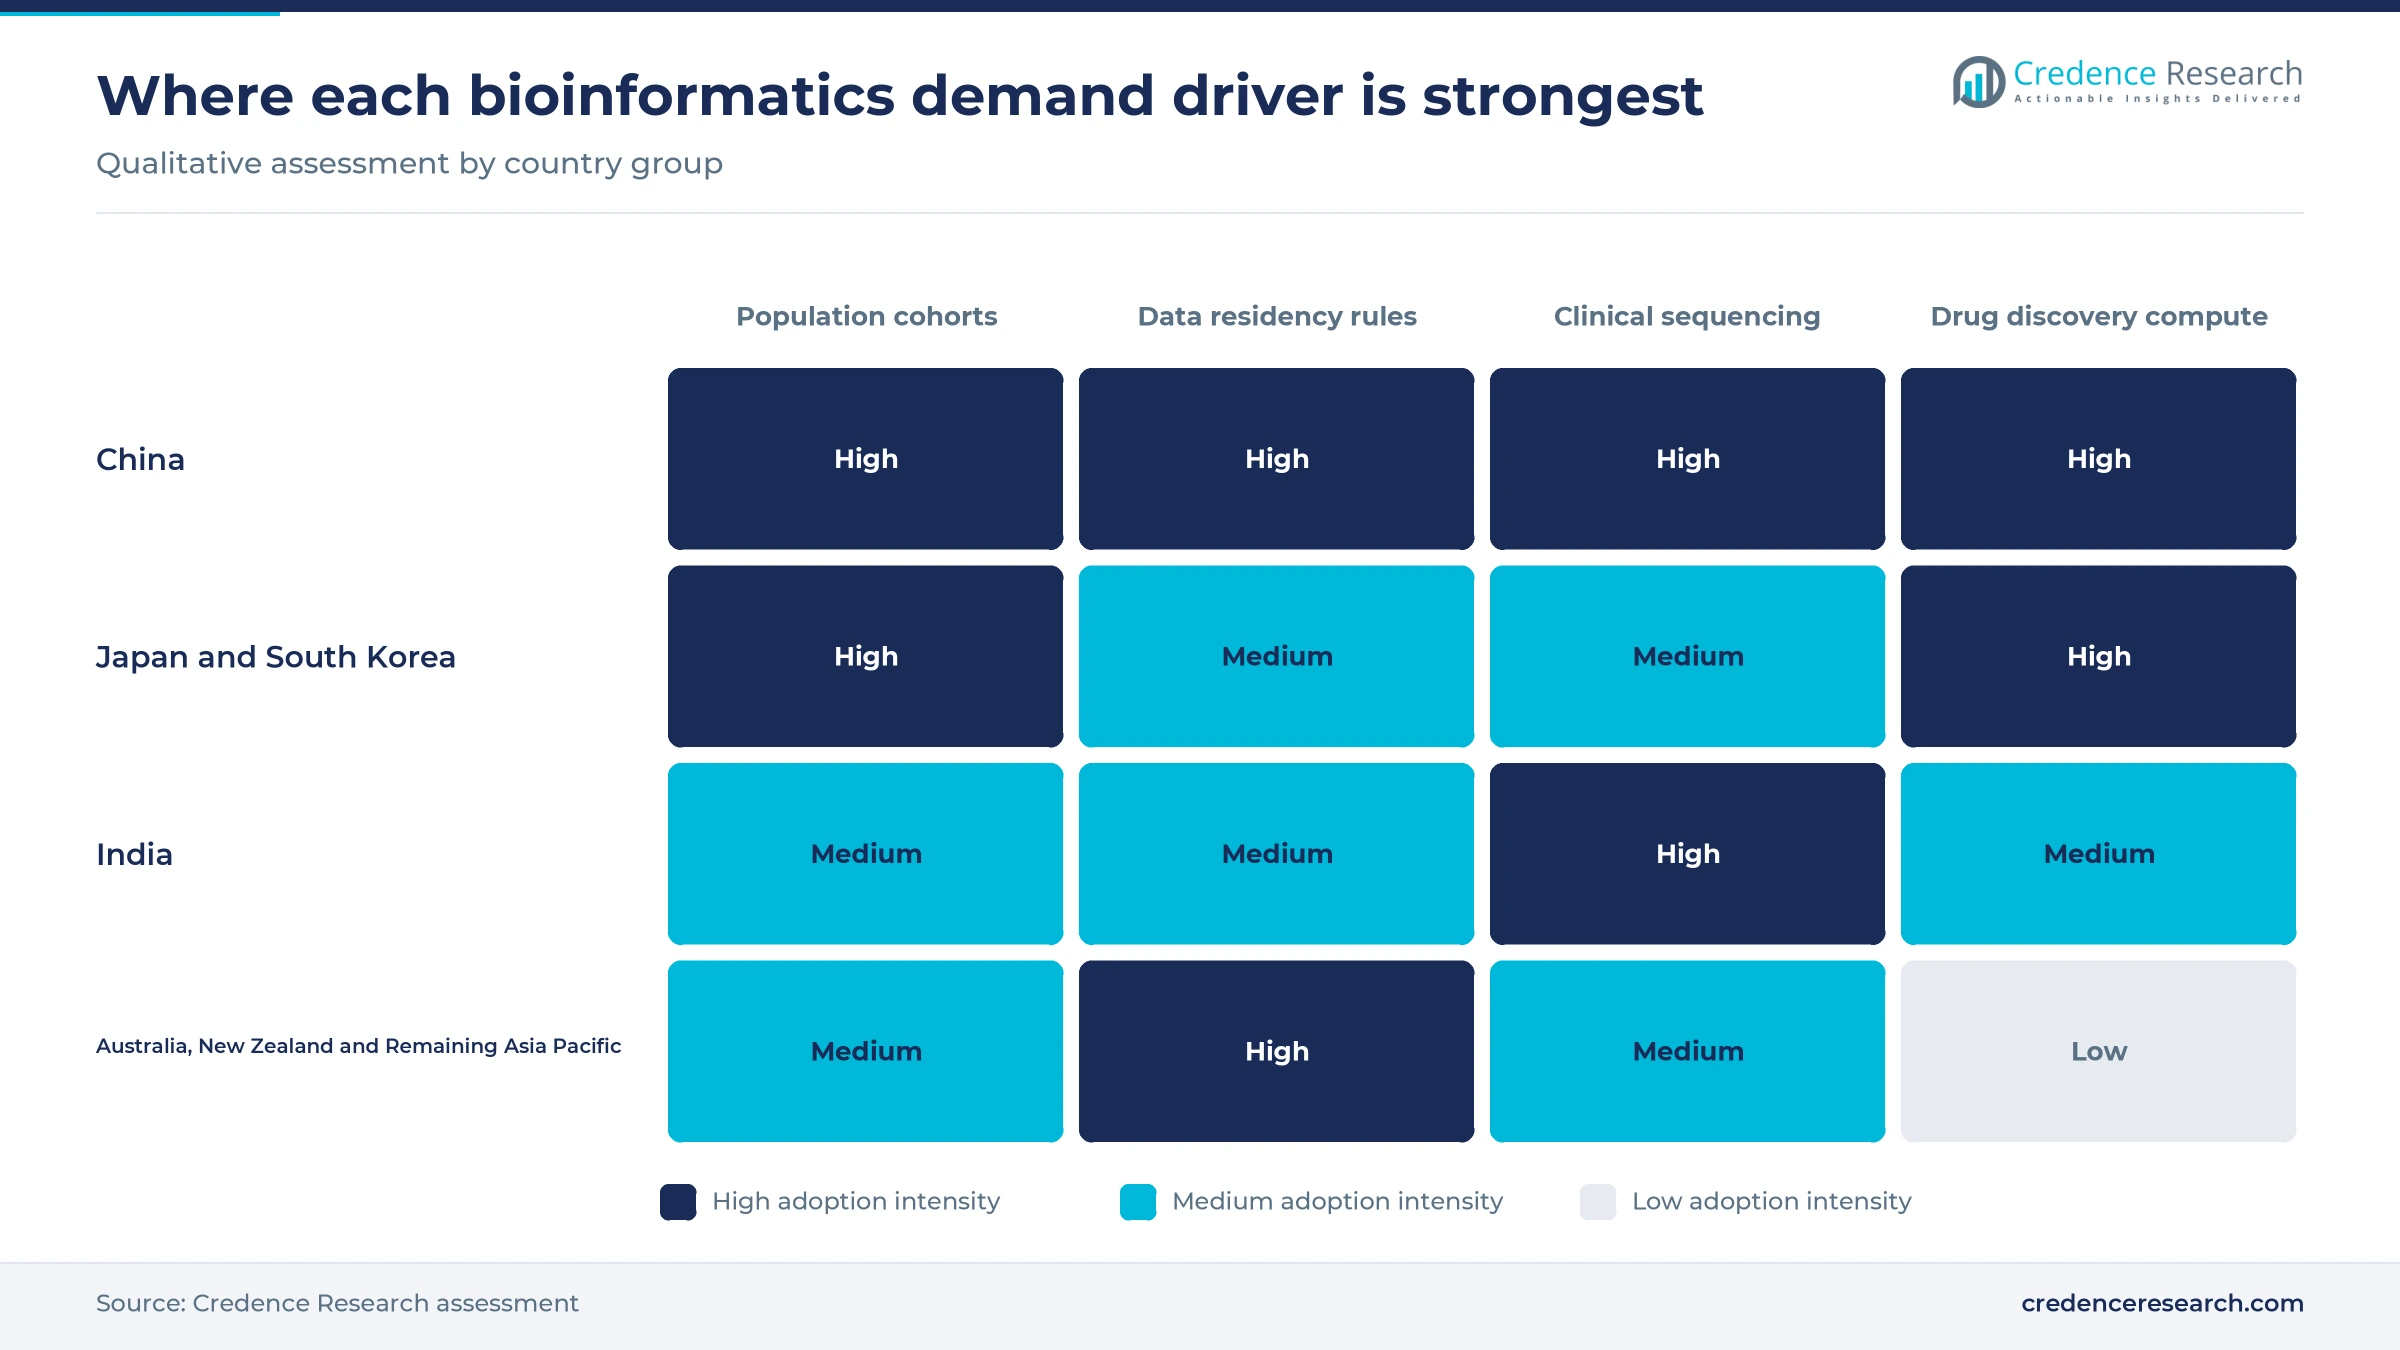
Population cohorts and local hosting widen paid analysis
Population genome programs create reusable analysis demand
Population genomics creates reusable analytical demand, because national cohorts are sequenced once but analyzed repeatedly by many research teams and hospitals. Tohoku Medical Megabank completed 100,000 whole genome analyses of the Japanese general population on June 20, 2024. India unveiled genome data of 10,000 people on Jan. 9, 2025, held at the Indian Biological Data Centre under managed access, Business Standard reported. Korea launched its national bio big data project on Dec. 19, 2024, aiming to recruit 772,000 participants by 2028, according to Asia Economy. Singapore's health ministry said on Nov. 14, 2025 that SG100K is complete and that a new phase will reach more than 500,000 sequenced people. Each cohort needs pipelines, storage, access control and interpretation for years.
Regional hosting moves analysis into production
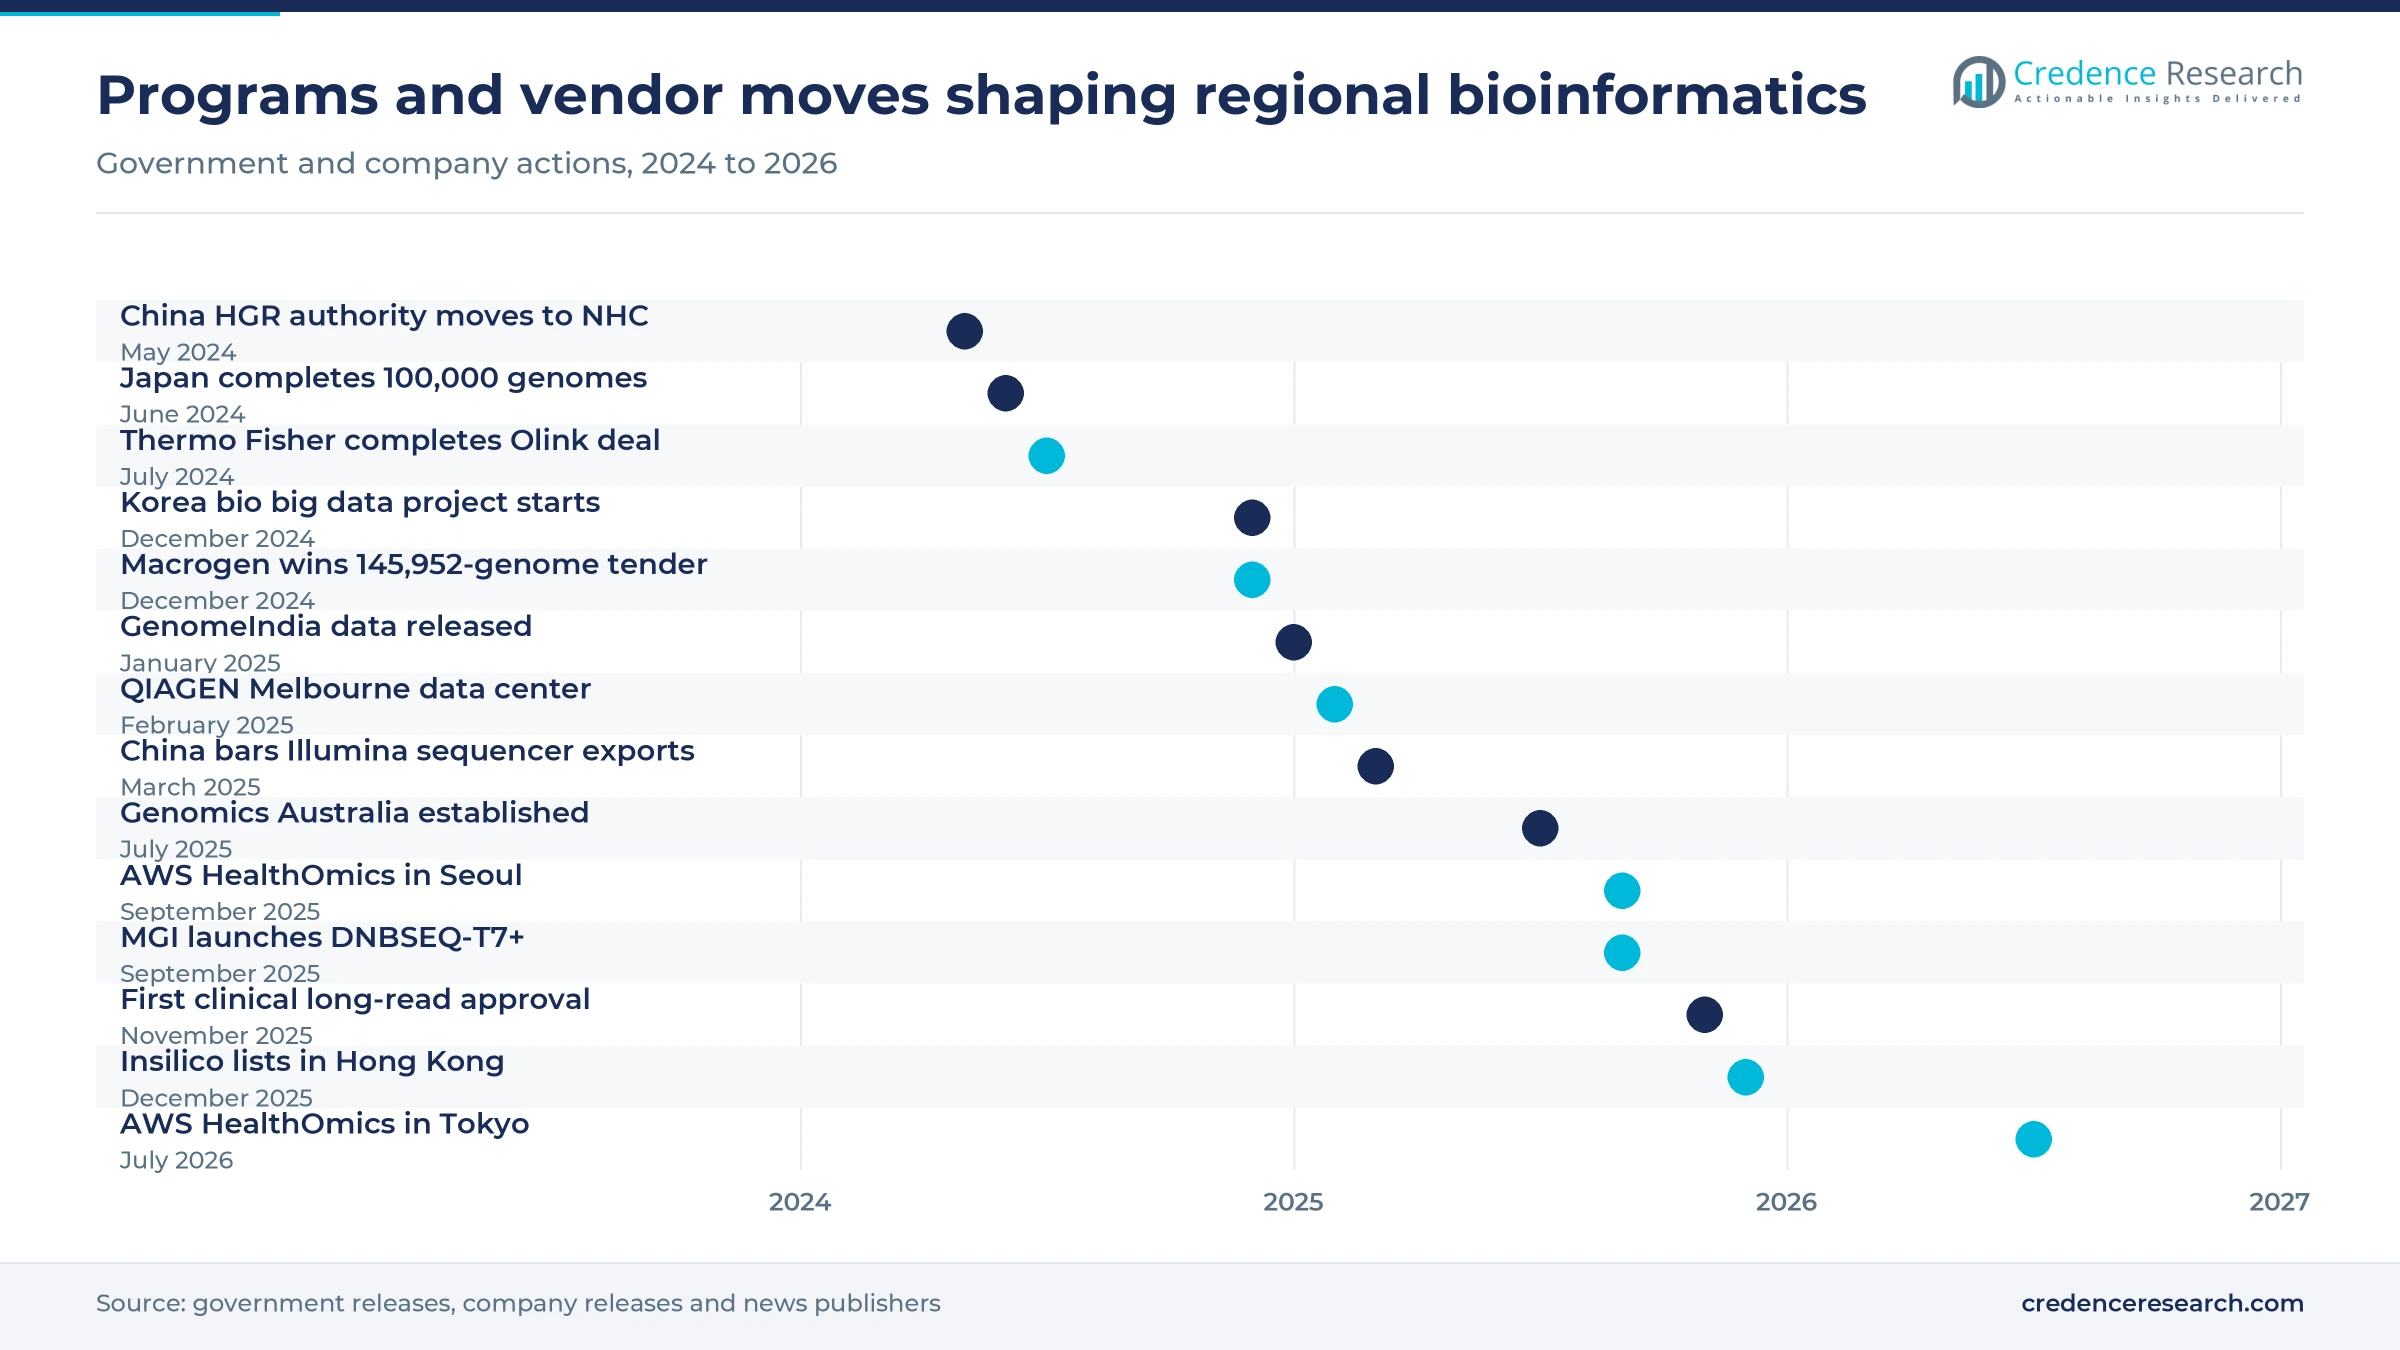
Regional hosting supports production bioinformatics, because clinical laboratories can move analysis into daily use only when data stays in the country or region. QIAGEN opened a bioinformatics data center in Melbourne on Feb. 13, 2025, its eighth worldwide, so Australian genomic testing laboratories can host sensitive data under local privacy law. AWS made HealthOmics available in its Seoul region on Sept. 4, 2025, and added Tokyo on July 20, 2026, giving Korean and Japanese users in-country managed workflows. Genomics Australia began operating on July 1, 2025, to lead the national integration of genomics into the health system. Local hosting removes a common barrier in hospital procurement, which shortens the path from pilot projects to routine clinical analysis.
Computational drug discovery broadens paid use cases
Integrated computational discovery broadens paid use cases, because drug developers now buy target discovery, molecule design and omics analysis as linked software. Insilico Medicine said at its Hong Kong listing on Dec. 30, 2025 that its Pharma.AI suite has software licensing deals with 13 of the 20 largest pharmaceutical companies. SK Biopharmaceuticals agreed on June 22, 2026 to work with Insilico on neuroimmune drug candidates in a deal worth more than USD 2.5 billion in potential payments, BioSpectrum Asia reported. BGI-Research and Zhejiang Lab released Genos, an open-source human genomic foundation model, on Oct. 23, 2025, China Daily reported. Such work ties bioinformatics budgets to AI-led drug design and lengthens contracts beyond single studies.
Clinical sequencing approvals bring analysis into hospitals
Clinical sequencing approvals bring analysis into hospitals, because every approved test needs a validated pipeline and a report that physicians can act on. China's medical products regulator gave Class III registration to the Sequel II CNDx long-read sequencer on Nov. 4, 2025, paired with Berry Genomics' thalassemia assay and software system, PacBio said. Singapore launched a national familial hypercholesterolemia testing program in June 2025, and its next cohort phase targets about 10% of the resident population. Korean participants enroll through 38 recruitment institutions, many of them hospitals, which builds clinical data skills on site. Each approval moves spending from research grants toward recurring per-test analysis, which is why hospitals and clinical laboratories are the fastest-growing customer group.
Fast sequencers and trade curbs reshape analysis supply
Faster sequencers shift the bottleneck to analysis
Faster sequencers are shifting the bottleneck from data generation to analysis, which raises the value of accelerated pipelines. MGI Tech launched the DNBSEQ-T7+ on Sept. 16, 2025, claiming more than 14 Tb of output a day and 144 human genomes in a single day, BioSpectrum Asia reported. MGI says its MegaBOLT accelerator completes a 30x germline genome analysis in 0.69 hours, against 26.26 hours for a classic algorithm. Its ZBOLT Pro lists 0.11 hours for the same task. Laboratories that buy high-output sequencing instruments now budget for hardware-accelerated or cloud pipelines at the same time, so analysis spending rises with each new instrument.
Trade curbs split China's platform base from the region
Trade curbs are splitting China's sequencing and analysis base from the rest of the region, which changes which pipelines buyers standardize on. China's commerce ministry said on March 4, 2025 that Illumina may not export sequencing instruments into China, after placing the company on its unreliable entity list. Illumina responded on March 10, 2025 with a cost reduction program of about USD 100 million and guidance for limited further earnings contribution from China. Outside China, Novogene agreed to buy 10 more NovaSeq X Plus systems for regional laboratories that include Singapore and Japan. Chinese buyers lean toward domestic platforms, while service laboratories run separate pipelines for domestic and export work.
Opportunity in clinical interpretation for India
Clinical interpretation for India is an opening, because falling test prices and national data are widening the base of laboratories that need validated pipelines. The 10,000 Indian genomes released in January 2025 give local developers a reference set that Western databases lack. The BioE3 policy approved in August 2024 calls for biomanufacturing and Bio-AI hubs, BioSpectrum India reported. Reliance Industries, through its majority-owned unit Strand Life Sciences, plans population-scale sequencing and a blood-based multi-cancer early detection test, YourStory reported in December 2025. Illumina's Bengaluru Global Capability Centre grew to nearly 300 employees within a year, is heading for about 500 and is hiring for bioinformatics, Business Today reported in September 2025. Vendors that offer Indian reference data and reporting as one service can win hospital chains.
Opportunity in spatial and multi-omics analysis services
Spatial and multi-omics analysis services are an opening, because new instruments produce data that few hospitals or biotech firms can analyze themselves. Macrogen introduced the Atera spatial biology platform in Asia on Sept. 9, 2026, covering more than 18,000 genes at single-cell resolution, Asia Economy reported. The company completed its Songdo Global Genome Center in June 2026 as the base for these services. Thermo Fisher now sells Olink proteomics panels and analysis software, which brings protein data into the pipelines that regional laboratories already run for genomes. Demand for spatial transcriptomics tools adds analysis projects that pay more per sample than standard genome work.
Data rules, storage costs and thin skills slow buyers
Genetic data rules fragment deployment choices
Genetic data rules fragment deployment choices because vendors must run separate stacks for China and the rest of the region. China moved authority over human genetic resources to the National Health Commission on May 1, 2024, and requires security reviews to export genome data for more than 500 cases, according to Hogan Lovells. Foreign vendors therefore struggle to offer one cloud service across Asia Pacific. Multinational sponsors face slower study setup, and suppliers answer with domestic partners and on-premises licenses.
Growing data volumes raise storage bills
Growing data volumes raise storage bills that buyers often underestimate when they budget for analysis. The China National GeneBank sequence archive held more than 16.3 petabytes of biological data from over 560 institutions in its 2025 update, according to EurekAlert. Public clouds such as AWS HealthOmics bill sequence storage per gigabase for every month that files stay active. Cohort owners must therefore pay to store data for decades, which squeezes funds for interpretation and pushes buyers toward archive tiers and compression.
Thin skills limit adoption in smaller health systems
Thin skills limit adoption in smaller health systems because laboratories cannot run pipelines without trained staff. WHO says 15 countries in the Western Pacific had in-country sequencing capacity in 2025, up from 11 in 2021, against a 2029 target of 70% of member states. WHO's South-East Asia office lists four of its 11 countries with limited in-country sequencing capacity. Vendors selling into these markets must bundle training and managed services, which lengthens sales cycles and raises delivery costs.
Low clinical test prices squeeze analysis fees
Low clinical test prices squeeze analysis fees because interpretation is bundled into the price that patients and hospitals pay. In India, the exome and genome test prices shown in the pricing table already include interpretation and reporting, so every price cut lands partly on analysis fees. Reliance plans genome tests priced for India's middle class, YourStory reported in December 2025, which would push rival prices lower. Laboratories competing on these prices cut software and staff costs first. Vendors respond with automated reporting and usage-based pricing, which protects volume but lowers revenue per sample.
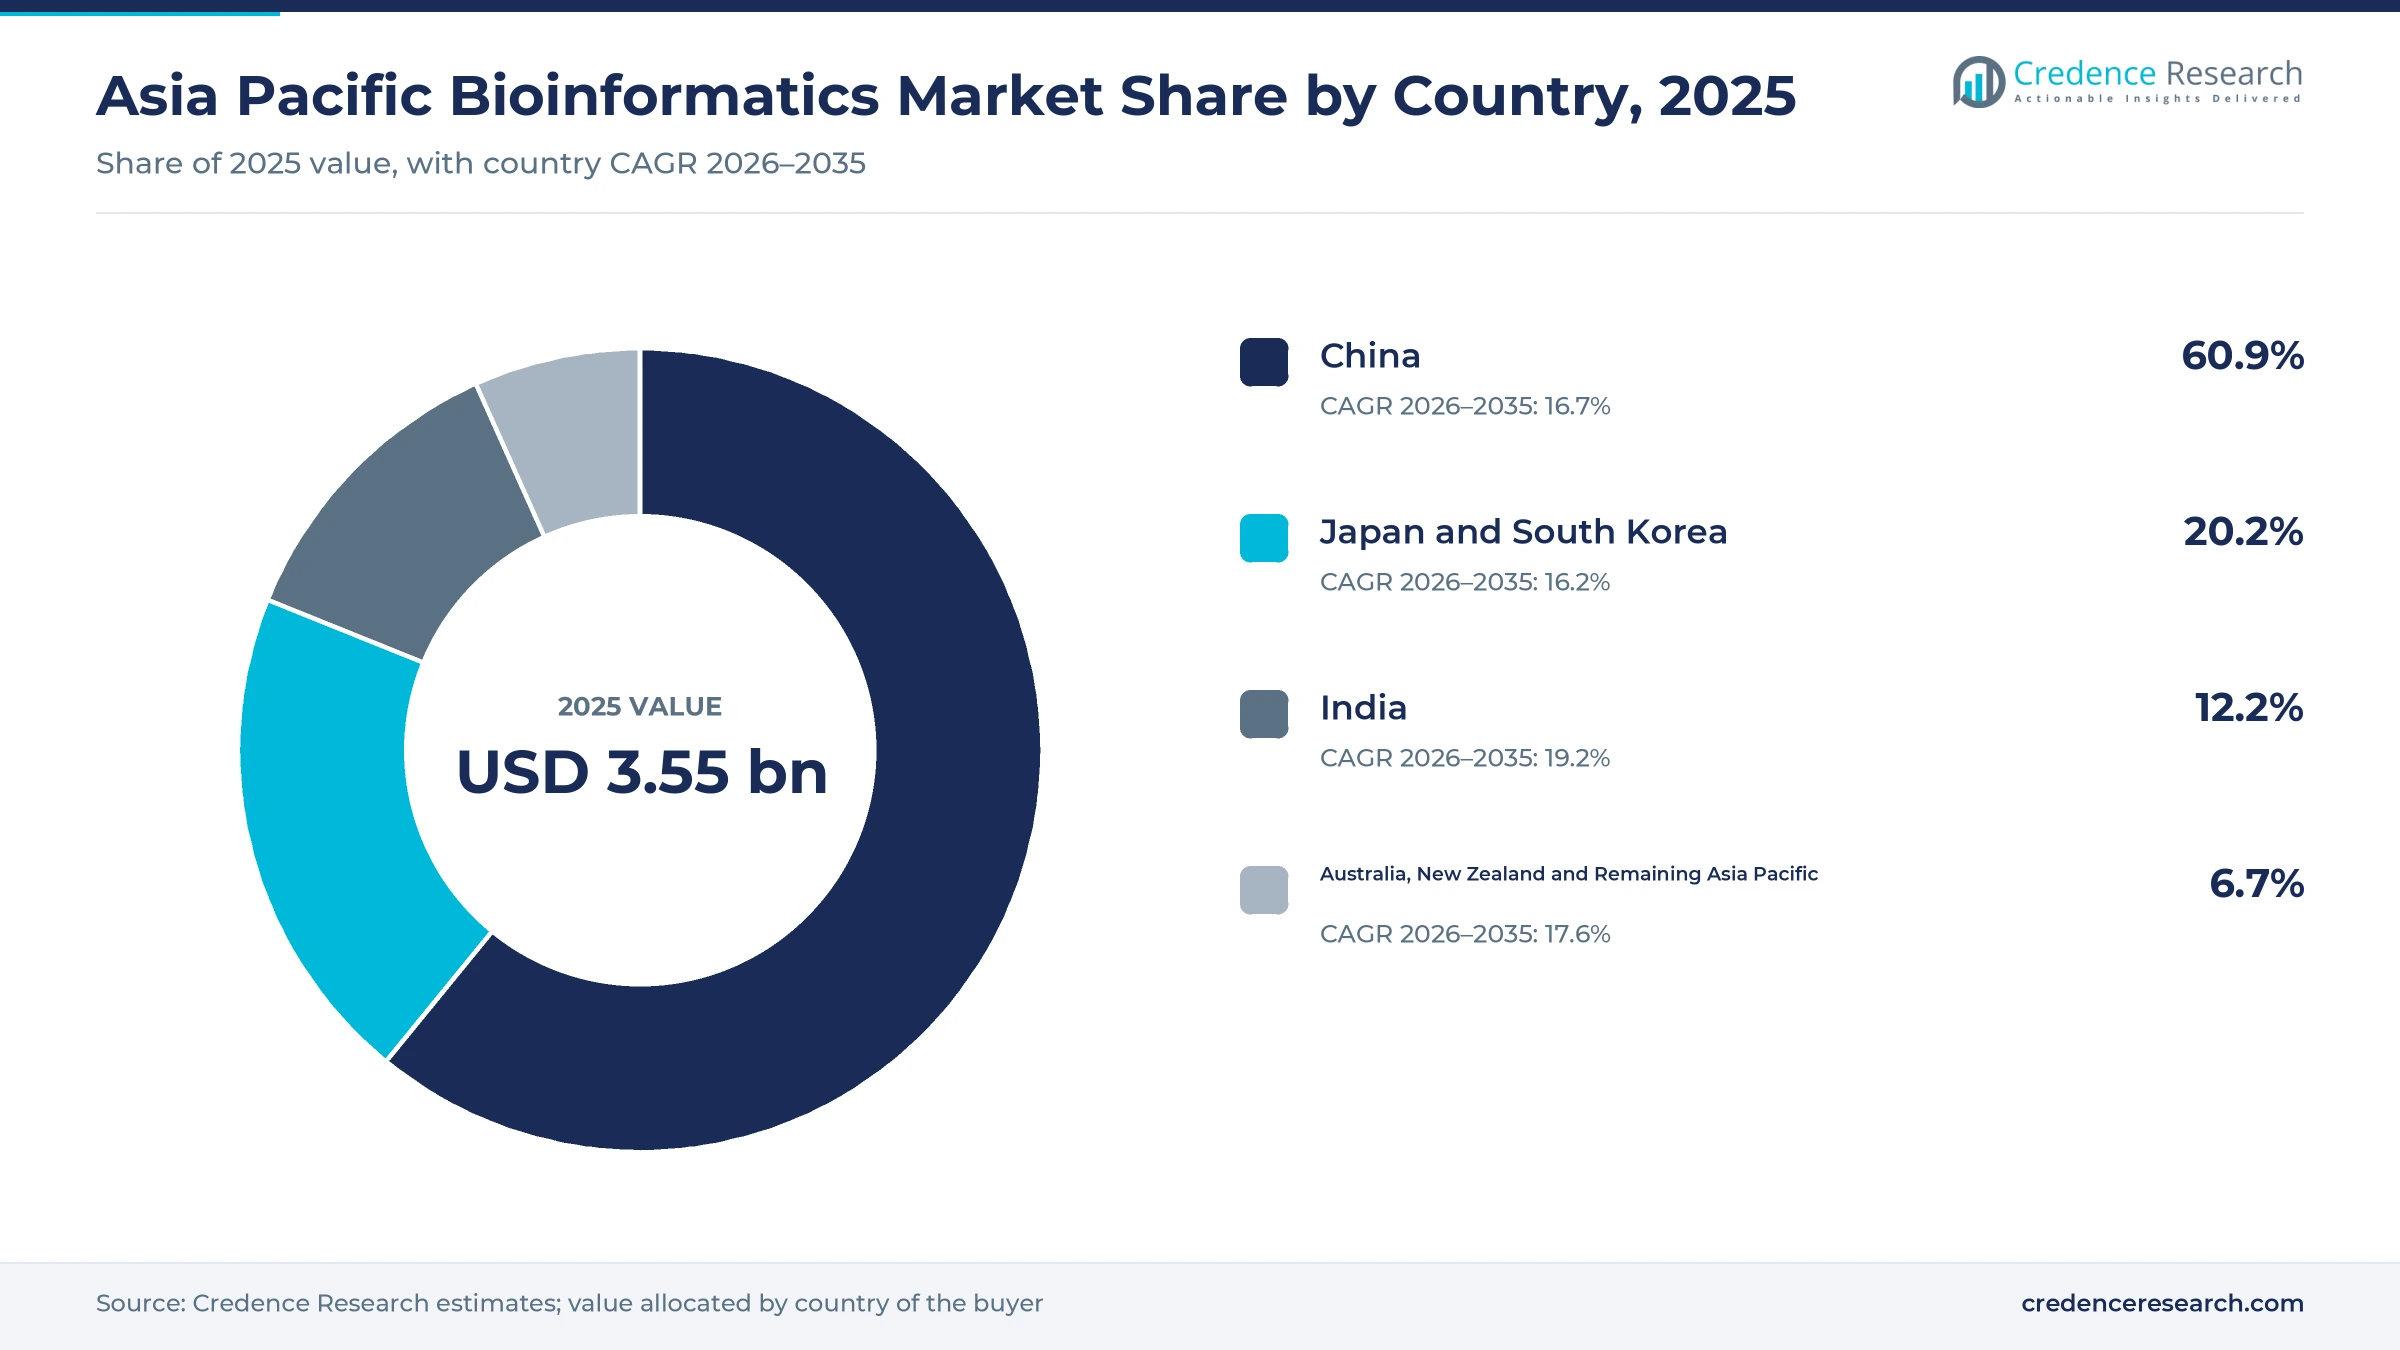
China dominates as India grows fastest
| Country | Value, 2025 (USD billion) | Share, 2025 | CAGR, 2026–2035 |
|---|---|---|---|
| China | 2.16 | 60.9% | 16.7% |
| Japan and South Korea | 0.72 | 20.2% | 16.2% |
| India | 0.43 | 12.2% | 19.2% |
| Australia, New Zealand and Remaining Asia Pacific | 0.24 | 6.7% | 17.6% |
China leads on laboratory scale and domestic platforms
China held 60.9% of 2025 value and grows at 16.7% a year because Novogene, BGI Genomics and Berry Genomics run some of the largest sequencing and analysis laboratories in the world. MGI Tech supplies domestic sequencers and accelerators, which matters more after the Illumina export ban noted above. Genetic resource rules keep most analysis on domestic servers, and the national archive scale described above shows the data load. Growth trails India because the base is large and research budgets already fund mature pipelines.
Japan and South Korea build on national cohorts
Japan and South Korea held 20.2% of 2025 value and grow at 16.2% a year, the slowest pace, because large research cohorts and pharma buyers already run established pipelines. Japan's Tohoku cohort and Korea's bio big data project, both noted above, provide reference data for hospitals and drug developers. Macrogen anchors Korean services, while in-country AWS regions in Seoul and Tokyo support cloud workflows. Pharma demand for drug discovery software keeps Japanese spending on licensed tools steady, so licenses make up a larger part of spending there than in China or India.
India grows fastest on new data and hospital demand
India held 12.2% of 2025 value and is the fastest-growing country group at 19.2% a year, as national genome data and hospital chains widen demand. Strand Life Sciences adds local interpretation capacity under Reliance ownership, and Illumina is building a bioinformatics team in Bengaluru, as noted above. Illumina is also testing instrument leasing and reagent-based access to lower upfront costs for hospitals in smaller cities. Low test prices keep spending per sample thin, so growth depends on volume and automated reporting.
Australia, New Zealand and the rest gain from clinical programs
Australia, New Zealand and Remaining Asia Pacific held 6.7% of 2025 value and grow at 17.6% a year as national programs move genomics into health care. Australia now has in-country hosting from QIAGEN and a national genomics agency, both noted above. Singapore's expanded cohort and familial hypercholesterolemia testing add clinical demand, and Novogene runs a laboratory in Singapore. Smaller Southeast Asian systems still depend on donor-funded support, so the group stays below 7% of 2025 regional demand.
Tenders, approvals and listings marked 2024 to 2026
| Development | Status and market relevance |
|---|---|
| In December 2024, the Macrogen consortium, with Illumina as sequencing partner, won Korea's tender to sequence and analyze 145,952 genomes. | Awarded, creating one of the largest analysis contracts in the region. |
| In February 2025, QIAGEN opened a bioinformatics data center in Melbourne for Australian and Asia Pacific laboratories. | Operating, giving clinical labs in-country hosting for interpretation software. |
| In March 2025, China's commerce ministry barred Illumina from exporting sequencing instruments into China. | In force, pushing Chinese buyers toward domestic platforms and pipelines. |
| In November 2025, China's regulator approved the first clinical long-read sequencer, paired with Berry Genomics' thalassemia assay and software. | Approved, moving long-read analysis into clinical use in China. |
| In December 2025, Insilico Medicine listed on the Hong Kong stock exchange, raising HKD 2.277 billion. | Listed, funding further growth of its licensed Pharma.AI software and pipeline. |
Accelerated pipelines and genomic models cut analysis time
- Hardware-accelerated secondary analysis uses FPGA or GPU chips to align and call variants for a whole genome in minutes instead of a day.
- Managed cloud workflows run validated pipelines on demand and bill per run, which suits laboratories without in-house engineers.
- Genomic foundation models learn from large sequence collections to predict variant effects and gene expression for diagnosis and research.
- Long-read clinical analysis resolves structural variants and repeat regions that short reads miss, which supports thalassemia and rare disease tests.
Need a Custom Version of This Report?
Tailor the scope, geography, or segments to your exact requirements.
- Custom geography or segment scope
- Direct access to our analyst team
Sequencing labs and platform owners shape competition
Competition in Asia Pacific bioinformatics is decided by who holds the sample and the data, because the laboratory that sequences a sample usually runs its analysis. Novogene, BGI Genomics, Macrogen and Berry Genomics bundle analysis with sequencing for research and clinical buyers, while MGI Tech and Illumina tie pipelines to their instruments. QIAGEN competes on clinical interpretation software and curated knowledge bases, and Thermo Fisher adds proteomics and sequencing software. Insilico Medicine sells Pharma.AI licenses and runs its own pipeline, competing with drug discovery informatics suppliers for pharma budgets. Strand Life Sciences serves Indian clinical laboratories with interpretation and reporting. BGI Genomics and MGI Tech are separately listed affiliates of BGI Group with distinct services and instrument businesses. Buyers compare turnaround, validation, data residency and cost per sample, and switching costs rise once databases and reports are built around one platform.
Sequencing labs and platform owners hold most of the value
Supply in Asia Pacific bioinformatics is organized in four distinct layers of providers. Sequencer makers such as Illumina, MGI Tech and Thermo Fisher embed primary and secondary analysis in their instruments and sell software on top. Service laboratories including Novogene, BGI Genomics, Macrogen and Berry Genomics bundle sequencing with analysis and hold the largest share of buyer spending. Software specialists such as QIAGEN, Strand Life Sciences and Insilico Medicine license interpretation, databases and discovery tools. Public clouds supply the underlying compute and storage on usage-based terms. Barriers are highest in clinical interpretation, where validated databases and regulatory approvals take years to build and margins are richest.
Companies profiled and their roles in this market
| Company | Type | Role in the market |
|---|---|---|
| Novogene Co., Ltd. | Sequencing and analysis service provider | Sequences and analyzes research samples in China, Singapore and Japan labs |
| BGI Genomics Co., Ltd. (BGI Group) | Sequencing and analysis service provider | Offers genomic testing, analysis and genomic model tools through BGI platforms |
| MGI Tech Co., Ltd. (BGI Group) | Sequencer and accelerator maker | Sells DNBSEQ sequencers and MegaBOLT and ZBOLT analysis accelerators |
| Illumina, Inc. | Sequencer and software vendor | Sells DRAGEN analysis and sequencers outside China, with an India capability center |
| QIAGEN N.V. | Interpretation software vendor | Sells clinical interpretation software hosted in Melbourne for regional labs |
| Thermo Fisher Scientific Inc. | Instrument and software vendor | Sells sequencing and proteomics analysis software, including Olink tools |
| Macrogen, Inc. | Sequencing and analysis service provider | Sequences and analyzes genomes for Korea's national bio big data project |
| Insilico Medicine | AI drug discovery software vendor | Licenses Pharma.AI software and runs AI-designed drug programs |
| Strand Life Sciences (Reliance Industries) | Clinical genomics and bioinformatics firm | Provides genomic testing, interpretation and bioinformatics in India |
| Berry Genomics Co., Ltd. | Clinical genomics service provider | Runs clinical genetic tests with in-house analysis and report software in China |
Interpretation, not raw compute, will hold the margin
Credence Research's view is that interpretation and validated clinical reporting, not raw compute, will decide returns in Asia Pacific bioinformatics through 2035. Cloud pipeline prices are already low, while population cohorts and new clinical approvals create demand for curated databases, local reference data and reports that physicians trust. China will stay a largely separate market because of data rules and trade curbs. India and Southeast Asia offer the fastest growth but thin prices. Buyers should ask vendors for validation evidence on local populations and clear data residency terms before signing multi-year contracts.
Model values rest on program, vendor and price evidence
The report uses 2025 as the base year and 2026 to 2035 as the forecast period. Market values come from the Credence Research model, and country, solution, deployment, customer and application splits are Credence Research estimates informed by public data. Sources include government and regulator releases, national genome program announcements, company filings and press releases, cloud price lists and regional news publishers. No interviews or surveys were used to build these estimates.
Clinical use and drug discovery set the pace to 2035
Credence Research expects Asia Pacific bioinformatics spending to reach USD 17.05 billion by 2035 as national cohorts grow and clinical sequencing becomes routine across the region. India should keep the fastest pace, while China remains the largest source of value because of its laboratory scale. Spending will move toward analytical software platforms, public cloud workflows and hospital customers as clinical tests multiply. Drug discovery software will take a larger share as AI-designed candidates advance. Stricter data localization is the main risk, because separate stacks for each country would raise costs for buyers and vendors alike.
Clinical uptake and data rules set the range to 2035
The range of outcomes depends mainly on how fast clinical sequencing becomes routine in hospitals and on whether data rules allow shared regional platforms. Fast clinical uptake multiplies paid interpretation, while stricter localization would raise costs and slow cloud adoption. Drug discovery demand adds upside if AI-designed candidates keep moving through trials. Country programs matter too, because a pause in any one national cohort removes years of repeat analysis work.
| Scenario | CAGR, 2026–2035 | Value, 2035 | What has to hold |
|---|---|---|---|
| Downside | 14.0% | USD 13.49 billion | Clinical reimbursement stays thin, data rules tighten and research budgets flatten across major economies |
| Base | 16.97% | USD 17.05 billion | National cohorts expand on current budgets and hospitals adopt genomic tests at the present pace |
| Upside | 19.5% | USD 20.62 billion | Clinical genomics gains broad reimbursement and AI-designed drugs advance, lifting software licensing |
Frequently Asked Questions
How big is the Asia Pacific bioinformatics market?
Which country leads the market?
Which country group is growing fastest?
Which solution type holds the largest share?
Why do national genome programs matter to vendors?
What holds the market back?
How is bioinformatics priced in the region?
Who are the main companies in this market?
Table of Content
Chapter 1 Market Segmentation
- 1.1 Segmentation Framework
- 1.1.1 Product and Service Classification
- 1.1.2 Application and End-Use Classification
- 1.1.3 Technology and Solution Classification
- 1.1.4 Customer and Distribution Channel Classification
- 1.1.5 Geographic Segmentation
- 1.1.6 Market Segment Definitions and Boundaries
- 1.2 By Solution Type
- 1.2.1 Managed Bioinformatics Services
- 1.2.2 Analytical Software Platforms
- 1.2.3 Licensed Tools and Databases
- 1.3 By Deployment Model
- 1.3.1 Private Infrastructure
- 1.3.2 Public Cloud
- 1.3.3 Hybrid Infrastructure
- 1.4 By Customer Type
- 1.4.1 Academic and Research Institutes
- 1.4.2 Pharmaceutical and Biotechnology Companies
- 1.4.3 Hospitals and Clinical Laboratories
- 1.4.4 Contract Research and Development Organizations
- 1.5 By Application
- 1.5.1 Genomics
- 1.5.2 Drug Discovery
- 1.5.3 Molecular Omics Analytics
- 1.5.4 Cheminformatics
- 1.6 By Country
- 1.6.1 China
- 1.6.2 Japan and South Korea
- 1.6.3 India
- 1.6.4 Australia, New Zealand and Remaining Asia Pacific
Chapter 2 Introduction
- 2.1 Report Objectives and Scope
- 2.2 Product Definition and Industry Terminology
- 2.3 Market Inclusions and Exclusions
- 2.4 Research Process
- 2.4.1 Primary Research and Expert Interviews
- 2.4.2 Secondary Research and Source Review
- 2.4.3 Top-Down and Bottom-Up Estimation
- 2.4.4 Data Triangulation and Verification
- 2.5 Market Size Measurement Basis
- 2.5.1 2025: USD 3.55 billion → 2035: USD 17.05 billion
- 2.6 Historical and Forecast Reference Periods
- 2.6.1 Historical Period: 2018-2025
- 2.6.2 Base Year: 2025
- 2.6.3 Forecast Period: 2025-2035
- 2.7 Research Assumptions and Limitations
Chapter 3 Executive Summary
- 3.1 Market Snapshot and Key Findings
- 3.2 Base-Year Market Size, 2025
- 3.3 Forecast Market Size, 2035
- 3.4 Revenue and Volume Growth Outlook
- 3.5 Key Demand and Supply Indicators
- 3.6 Leading Market Segments
- 3.7 Fastest-Growing Market Opportunities
- 3.8 Regional Performance Highlights
- 3.9 Technology and Industry Transformation
- 3.10 Competitive Landscape Summary
- 3.11 Analyst View and Strategic Implications
Chapter 4 Asia Pacific Bioinformatics Market Trends and Developments
- 4.1 Historical Industry Development, 2018-2025
- 4.2 Recent Market Trends and Developments
- 4.3 Demand and Customer Behavior Trends
- 4.4 Technology and Product Innovation
- 4.5 Artificial Intelligence, Automation and Digitalization
- 4.6 Local Manufacturing and Supply Chain Realignment
- 4.7 Industry Partnerships, Mergers and Acquisitions
- 4.8 Sustainability and Circular Economy Developments
- 4.9 Government and Private Sector Investment Trends
- 4.10 Emerging Business Models and Commercialization
- 4.11 Industry Developments and Announcements
Chapter 5 Asia Pacific Bioinformatics Market Production, Supply and Demand Analysis
- 5.1 Demand Trend and Consumption Analysis, 2018-2025
- 5.2 Demand Forecast, 2025-2035
- 5.3 Production and Output Trend, 2018-2025
- 5.4 Production and Output Forecast, 2025-2035
- 5.5 Installed Capacity and Capacity Utilization
- 5.6 Company-Wise Production Plants and Statistics
- 5.6.1 Installed Production Capacity
- 5.6.2 Actual Production
- 5.6.3 Planned Capacity and Expansion Targets
- 5.7 Supply Chain Structure and Procurement Trends
- 5.8 Supply-Demand Gap and Bottlenecks
- 5.9 Import Dependence and Sourcing Structure
- 5.10 Contract Manufacturing and Outsourcing
- 5.11 Regional Supply and Demand Concentration
Chapter 6 Asia Pacific Bioinformatics Market Pricing Analysis
- 6.1 Pricing Structure and Measurement
- 6.2 Historical Pricing Trends, 2018-2025
- 6.3 Pricing Outlook, 2025-2035
- 6.4 Average Selling Price and Unit Economics
- 6.5 Pricing by Product and Market Segment
- 6.6 Geographic Pricing Differences
- 6.7 Key Input, Energy, Labor and Logistics Costs
- 6.8 Contract Pricing and Purchasing Models
- 6.9 Pricing Sensitivity and Competitive Positioning
- 6.10 Price, Margin and Profitability Implications
Chapter 7 Asia Pacific Bioinformatics Market Dynamics
- 7.1 Market Growth Drivers
- 7.1.1 Demand-Side Drivers
- 7.1.2 Technology and Innovation Drivers
- 7.1.3 Infrastructure and Investment Drivers
- 7.1.4 Regulatory and Policy Drivers
- 7.2 Market Restraints
- 7.2.1 Cost and Affordability Constraints
- 7.2.2 Technology and Adoption Barriers
- 7.2.3 Supply Chain and Operational Constraints
- 7.3 Market Challenges
- 7.3.1 Competitive Pressure and Margin Erosion
- 7.3.2 Skills, Infrastructure and Implementation Gaps
- 7.4 Emerging Market Opportunities
- 7.5 Market Dynamics Impact and Time-Horizon Assessment
Chapter 8 Asia Pacific Bioinformatics Value Chain Analysis
- 8.1 Industry Value Chain Overview
- 8.2 Upstream Suppliers and Critical Inputs
- 8.3 Technology and Component Providers
- 8.4 Manufacturing or Service Delivery
- 8.5 Distribution, Channel Partners and Integrators
- 8.6 Downstream Applications and End Users
- 8.7 Value Addition and Profit Pools
- 8.8 Vertical Integration and Outsourcing
- 8.9 Supplier Concentration and Risk
- 8.10 Supply Chain Localization and Resilience
Chapter 9 Asia Pacific Bioinformatics Market Regulations and Policies
- 9.1 Relevant Laws, Standards and Compliance Frameworks
- 9.2 Product, Service, Safety and Quality Requirements
- 9.3 Government Policies, Incentives and Subsidies
- 9.4 Imports, Exports and Trade Barriers
- 9.5 Public Procurement and Local Content Requirements
- 9.6 Environmental and Sustainability Compliance
- 9.7 Upcoming Policy Changes and Market Implications
Chapter 10 Asia Pacific Bioinformatics Market Hotspots and Opportunities
- 10.1 Market Opportunity Mapping and Growth Hotspots
- 10.2 High-Growth Applications and Customer Groups
- 10.3 Underserved Markets and White-Space Opportunities
- 10.4 Emerging Technology and Product Opportunities
- 10.5 New Capacity and Investment Hotspots
- 10.6 Market Entry and Expansion Opportunities
- 10.7 Distribution and Partnership Opportunities
- 10.8 Near-Term and Long-Term Commercial Potential
- 10.9 Opportunity Attractiveness and Execution Risks
Chapter 11 Asia Pacific Bioinformatics Market Outlook, 2025-2035
- 11.1 Market Size and Analysis
- 11.1.1 Revenue (Market Measurement: 2025: USD 3.55 billion → 2035: USD 17.05 billion)
- 11.1.2 Market Volume and Quantity Sold
- 11.1.3 Historical Market Size, 2018-2025
- 11.1.4 Base-Year Market Size, 2025
- 11.2 Market Forecast, 2025-2035
- 11.2.1 Revenue Forecast to 2035
- 11.2.2 Volume Forecast to 2035
- 11.2.3 CAGR and Year-on-Year Growth
- 11.2.4 Incremental Revenue Opportunity
- 11.3 Forecast Assumptions and Scenario Analysis
- 11.3.1 Base-Case Forecast
- 11.3.2 Optimistic and Conservative Scenarios
- 11.3.3 Technology, Pricing and Policy Sensitivities
- 11.4 Market Attractiveness and Growth Outlook
Chapter 12 Asia Pacific Bioinformatics Market Segmentation and Outlook
- 12.1 Segmentation Summary and Market Shares, 2025
- 12.2 Largest and Fastest-Growing Segments
- 12.3 By Solution Type - Market Size and Forecast, 2025-2035
- 12.3.1 Segment Definition and Scope
- 12.3.2 Historical Market Size, 2018-2025
- 12.3.3 Revenue Forecast, 2025-2035
- 12.3.4 Volume Forecast, 2025-2035
- 12.3.5 Base-Year Market Share, 2025
- 12.3.6 Segment CAGR and Growth Drivers
- 12.3.7 Subsegment Market Size and Forecast
- 12.3.7.1 Managed Bioinformatics Services
- 12.3.7.2 Analytical Software Platforms
- 12.3.7.3 Licensed Tools and Databases
- 12.3.8 Subsegment Pricing and Adoption Trends
- 12.3.9 Leading Suppliers and Competition
- 12.3.10 Regional Demand and Opportunities
- 12.4 By Deployment Model - Market Size and Forecast, 2025-2035
- 12.4.1 Segment Definition and Scope
- 12.4.2 Historical Market Size, 2018-2025
- 12.4.3 Revenue Forecast, 2025-2035
- 12.4.4 Volume Forecast, 2025-2035
- 12.4.5 Base-Year Market Share, 2025
- 12.4.6 Segment CAGR and Growth Drivers
- 12.4.7 Subsegment Market Size and Forecast
- 12.4.7.1 Private Infrastructure
- 12.4.7.2 Public Cloud
- 12.4.7.3 Hybrid Infrastructure
- 12.4.8 Subsegment Pricing and Adoption Trends
- 12.4.9 Leading Suppliers and Competition
- 12.4.10 Regional Demand and Opportunities
- 12.5 By Customer Type - Market Size and Forecast, 2025-2035
- 12.5.1 Segment Definition and Scope
- 12.5.2 Historical Market Size, 2018-2025
- 12.5.3 Revenue Forecast, 2025-2035
- 12.5.4 Volume Forecast, 2025-2035
- 12.5.5 Base-Year Market Share, 2025
- 12.5.6 Segment CAGR and Growth Drivers
- 12.5.7 Subsegment Market Size and Forecast
- 12.5.7.1 Academic and Research Institutes
- 12.5.7.2 Pharmaceutical and Biotechnology Companies
- 12.5.7.3 Hospitals and Clinical Laboratories
- 12.5.7.4 Contract Research and Development Organizations
- 12.5.8 Subsegment Pricing and Adoption Trends
- 12.5.9 Leading Suppliers and Competition
- 12.5.10 Regional Demand and Opportunities
- 12.6 By Application - Market Size and Forecast, 2025-2035
- 12.6.1 Segment Definition and Scope
- 12.6.2 Historical Market Size, 2018-2025
- 12.6.3 Revenue Forecast, 2025-2035
- 12.6.4 Volume Forecast, 2025-2035
- 12.6.5 Base-Year Market Share, 2025
- 12.6.6 Segment CAGR and Growth Drivers
- 12.6.7 Subsegment Market Size and Forecast
- 12.6.7.1 Genomics
- 12.6.7.2 Drug Discovery
- 12.6.7.3 Molecular Omics Analytics
- 12.6.7.4 Cheminformatics
- 12.6.8 Subsegment Pricing and Adoption Trends
- 12.6.9 Leading Suppliers and Competition
- 12.6.10 Regional Demand and Opportunities
- 12.7 By Country - Market Size and Forecast, 2025-2035
- 12.7.1 Segment Definition and Scope
- 12.7.2 Historical Market Size, 2018-2025
- 12.7.3 Revenue Forecast, 2025-2035
- 12.7.4 Volume Forecast, 2025-2035
- 12.7.5 Base-Year Market Share, 2025
- 12.7.6 Segment CAGR and Growth Drivers
- 12.7.7 Subsegment Market Size and Forecast
- 12.7.7.1 China
- 12.7.7.2 Japan and South Korea
- 12.7.7.3 India
- 12.7.7.4 Australia, New Zealand and Remaining Asia Pacific
- 12.7.8 Subsegment Pricing and Adoption Trends
- 12.7.9 Leading Suppliers and Competition
- 12.7.10 Regional Demand and Opportunities
- 12.8 Segment Growth Comparison
- 12.9 Segment Attractiveness and Priority Matrix
Chapter 13 Asia Pacific Bioinformatics End-Use and Application Market Outlook
- 13.1 End-Use Industry and Customer Demand Structure
- 13.2 Leading Applications and Customer Groups
- 13.3 End-Use Market Size, Share and Forecast
- 13.4 Major End-Use Industry Deep Dives
- 13.4.1 Customer Requirements and Use Cases
- 13.4.2 Demand and Replacement Cycles
- 13.4.3 Technical and Regulatory Considerations
- 13.4.4 Purchasing and Procurement Models
- 13.4.5 Leading Vendors and Distribution Channels
- 13.4.6 Forecast and Commercial Opportunities
- 13.5 Emerging Applications and Cross-Segment Demand
- 13.6 End-Use Industry Investment Priorities
Chapter 14 Asia Pacific Bioinformatics Geographic Market Outlook, 2025-2035
- 14.1 Regional Market Size and Country-Level Shares, 2025
- 14.2 Country Market Size Comparison, 2025
- 14.3 Country Market Forecasts, 2025-2035
- 14.4 Subregional Industrial and Demand Clusters
- 14.5 Intra-Regional Pricing and Cost Differences
- 14.6 Cross-Border Trade and Supply Networks
- 14.7 Regional Supply and Demand Balances
- 14.8 Country Opportunity Comparison and Prioritization
Note: Every listed country is covered on the structure shown under the first country.
Chapter 15 Asia Pacific Bioinformatics Technology, Innovation and Sustainability Outlook
- 15.1 Technology Landscape and Maturity
- 15.2 Product, Process and Service Innovation
- 15.3 AI, Automation and Digital Tools in the Industry
- 15.4 Technology Adoption and Performance Benchmarking
- 15.5 Innovation Pipeline and R&D Investment
- 15.6 Patent and Intellectual Property Trends
- 15.7 Energy Efficiency and Resource Management
- 15.8 Sustainability, Recycling and Circularity
- 15.9 Technology Roadmap, 2025-2035
- 15.10 Risks of Obsolescence and Technology Substitution
Chapter 16 Asia Pacific Bioinformatics Market Key Strategic Imperatives
- 16.1 Growth and Market Entry Priorities
- 16.2 High-Return Products and Segments
- 16.3 Pricing, Profitability and Cost Optimization
- 16.4 Technology Investment and Product Differentiation
- 16.5 Supply Chain Localization and Resilience
- 16.6 Distribution and Customer Acquisition
- 16.7 Partnership, Acquisition and Capacity Strategy
- 16.8 Regional Expansion Priorities
- 16.9 Short-, Medium- and Long-Term Actions
Chapter 17 Competition Outlook
- 17.1 Industry Competition Characteristics
- 17.2 Market Structure and Concentration
- 17.3 Market Share and Competitive Positioning, 2025
- 17.4 Company-Wise Revenue and Product Benchmarking
- 17.5 Production and Service Capacity Benchmarking
- 17.6 Technology, Pricing and Differentiation
- 17.7 Regional Footprint and Distribution Strength
- 17.8 Mergers, Acquisitions and Strategic Alliances
- 17.9 New Entrants and Competitive Threats
- 17.10 Porter's Five Forces and Industry Attractiveness
- 17.11 Competitive Outlook, 2025-2035
Chapter 18 Company Profiles
- 18.1 Company Coverage and Selection Criteria
- 18.2 Novogene Co., Ltd.
- 18.2.1 Business Description
- 18.2.2 Company Ownership and Geographic Presence
- 18.2.3 Product and Service Portfolio
- 18.2.4 Manufacturing and Operating Footprint
- 18.2.5 Production Capacity and Expansion Plans
- 18.2.6 Financial Performance and Investment
- 18.2.7 Market Share and Competitive Position
- 18.2.8 Technology and Innovation Capabilities
- 18.2.9 Strategic Alliances or Partnerships
- 18.2.10 Recent Developments
- 18.2.11 Growth Strategy and Outlook
- 18.3 BGI Genomics Co., Ltd. (BGI Group)
- 18.4 MGI Tech Co., Ltd. (BGI Group)
- 18.5 Illumina, Inc.
- 18.6 QIAGEN N.V.
- 18.7 Thermo Fisher Scientific Inc.
- 18.8 Macrogen, Inc.
- 18.9 Insilico Medicine
- 18.10 Strand Life Sciences (Reliance Industries)
- 18.11 Berry Genomics Co., Ltd.
- 18.12 Other Relevant Market Participants
Note: Every listed company is profiled on the structure shown under the first company. The company list is preliminary and may change based on research findings, market developments, data availability and client requirements.
Chapter 19 Disclaimer
- 19.1 Research and Forecast Disclaimer
- 19.2 Data Source and Estimation Limitations
Note: The depth of individual sections depends on data availability for this market. Volume, capacity, trade and other unit-based metrics are included where applicable.