Medicare and sovereign plants reshape Australian biotech
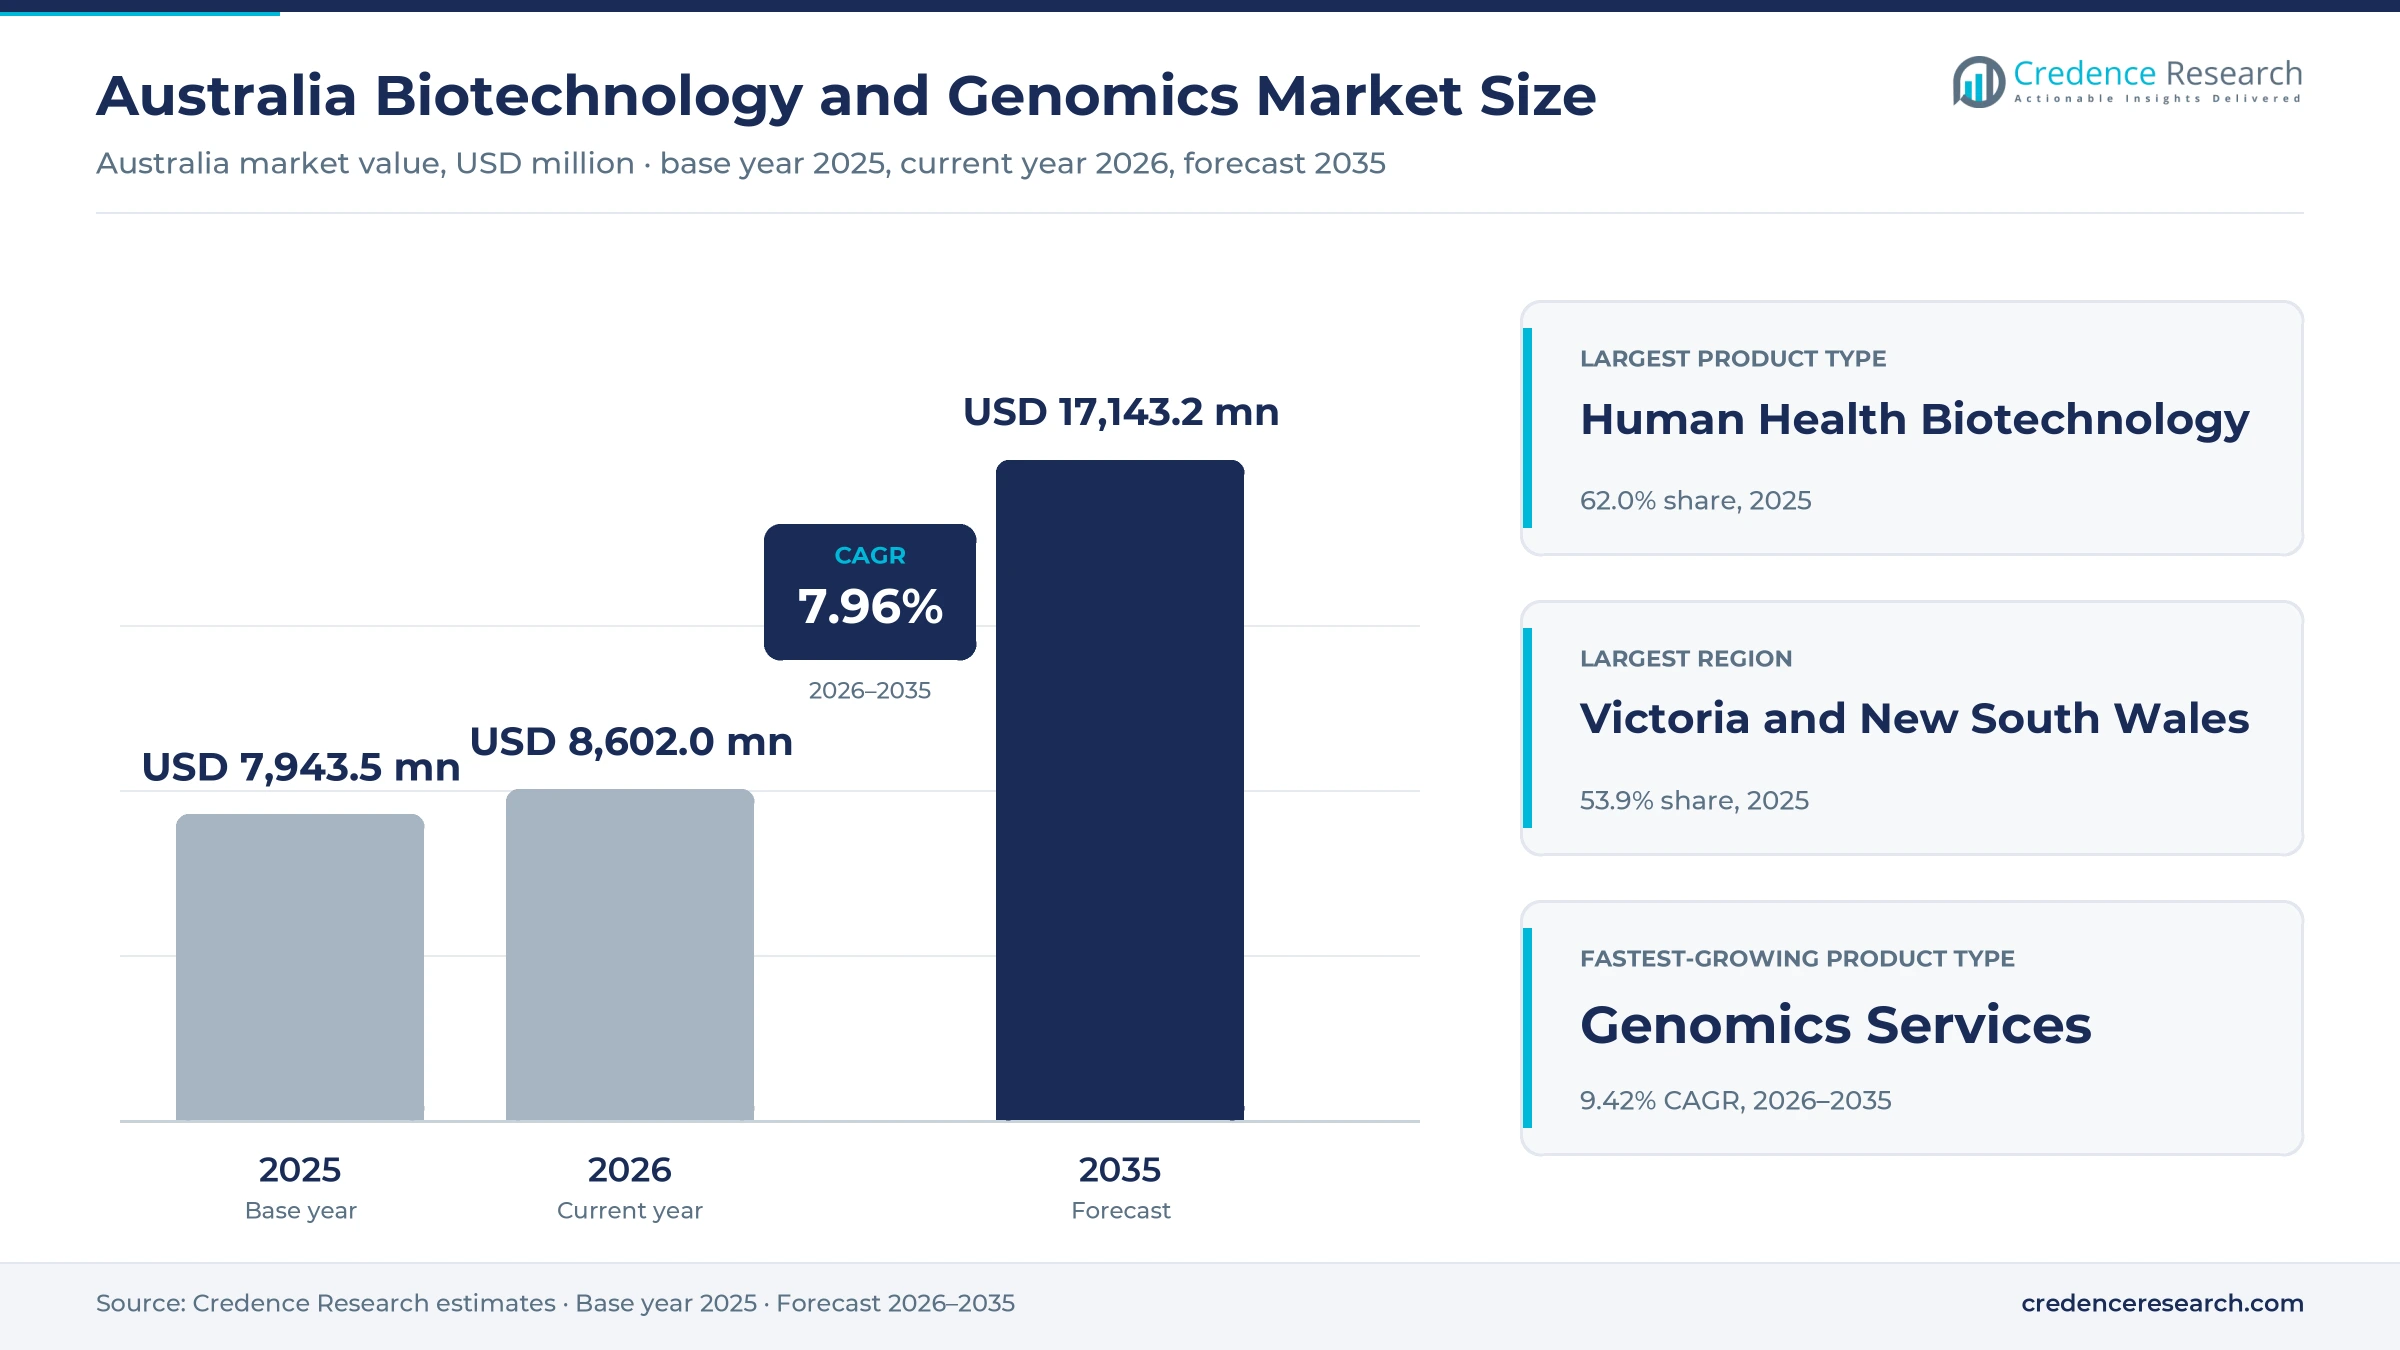
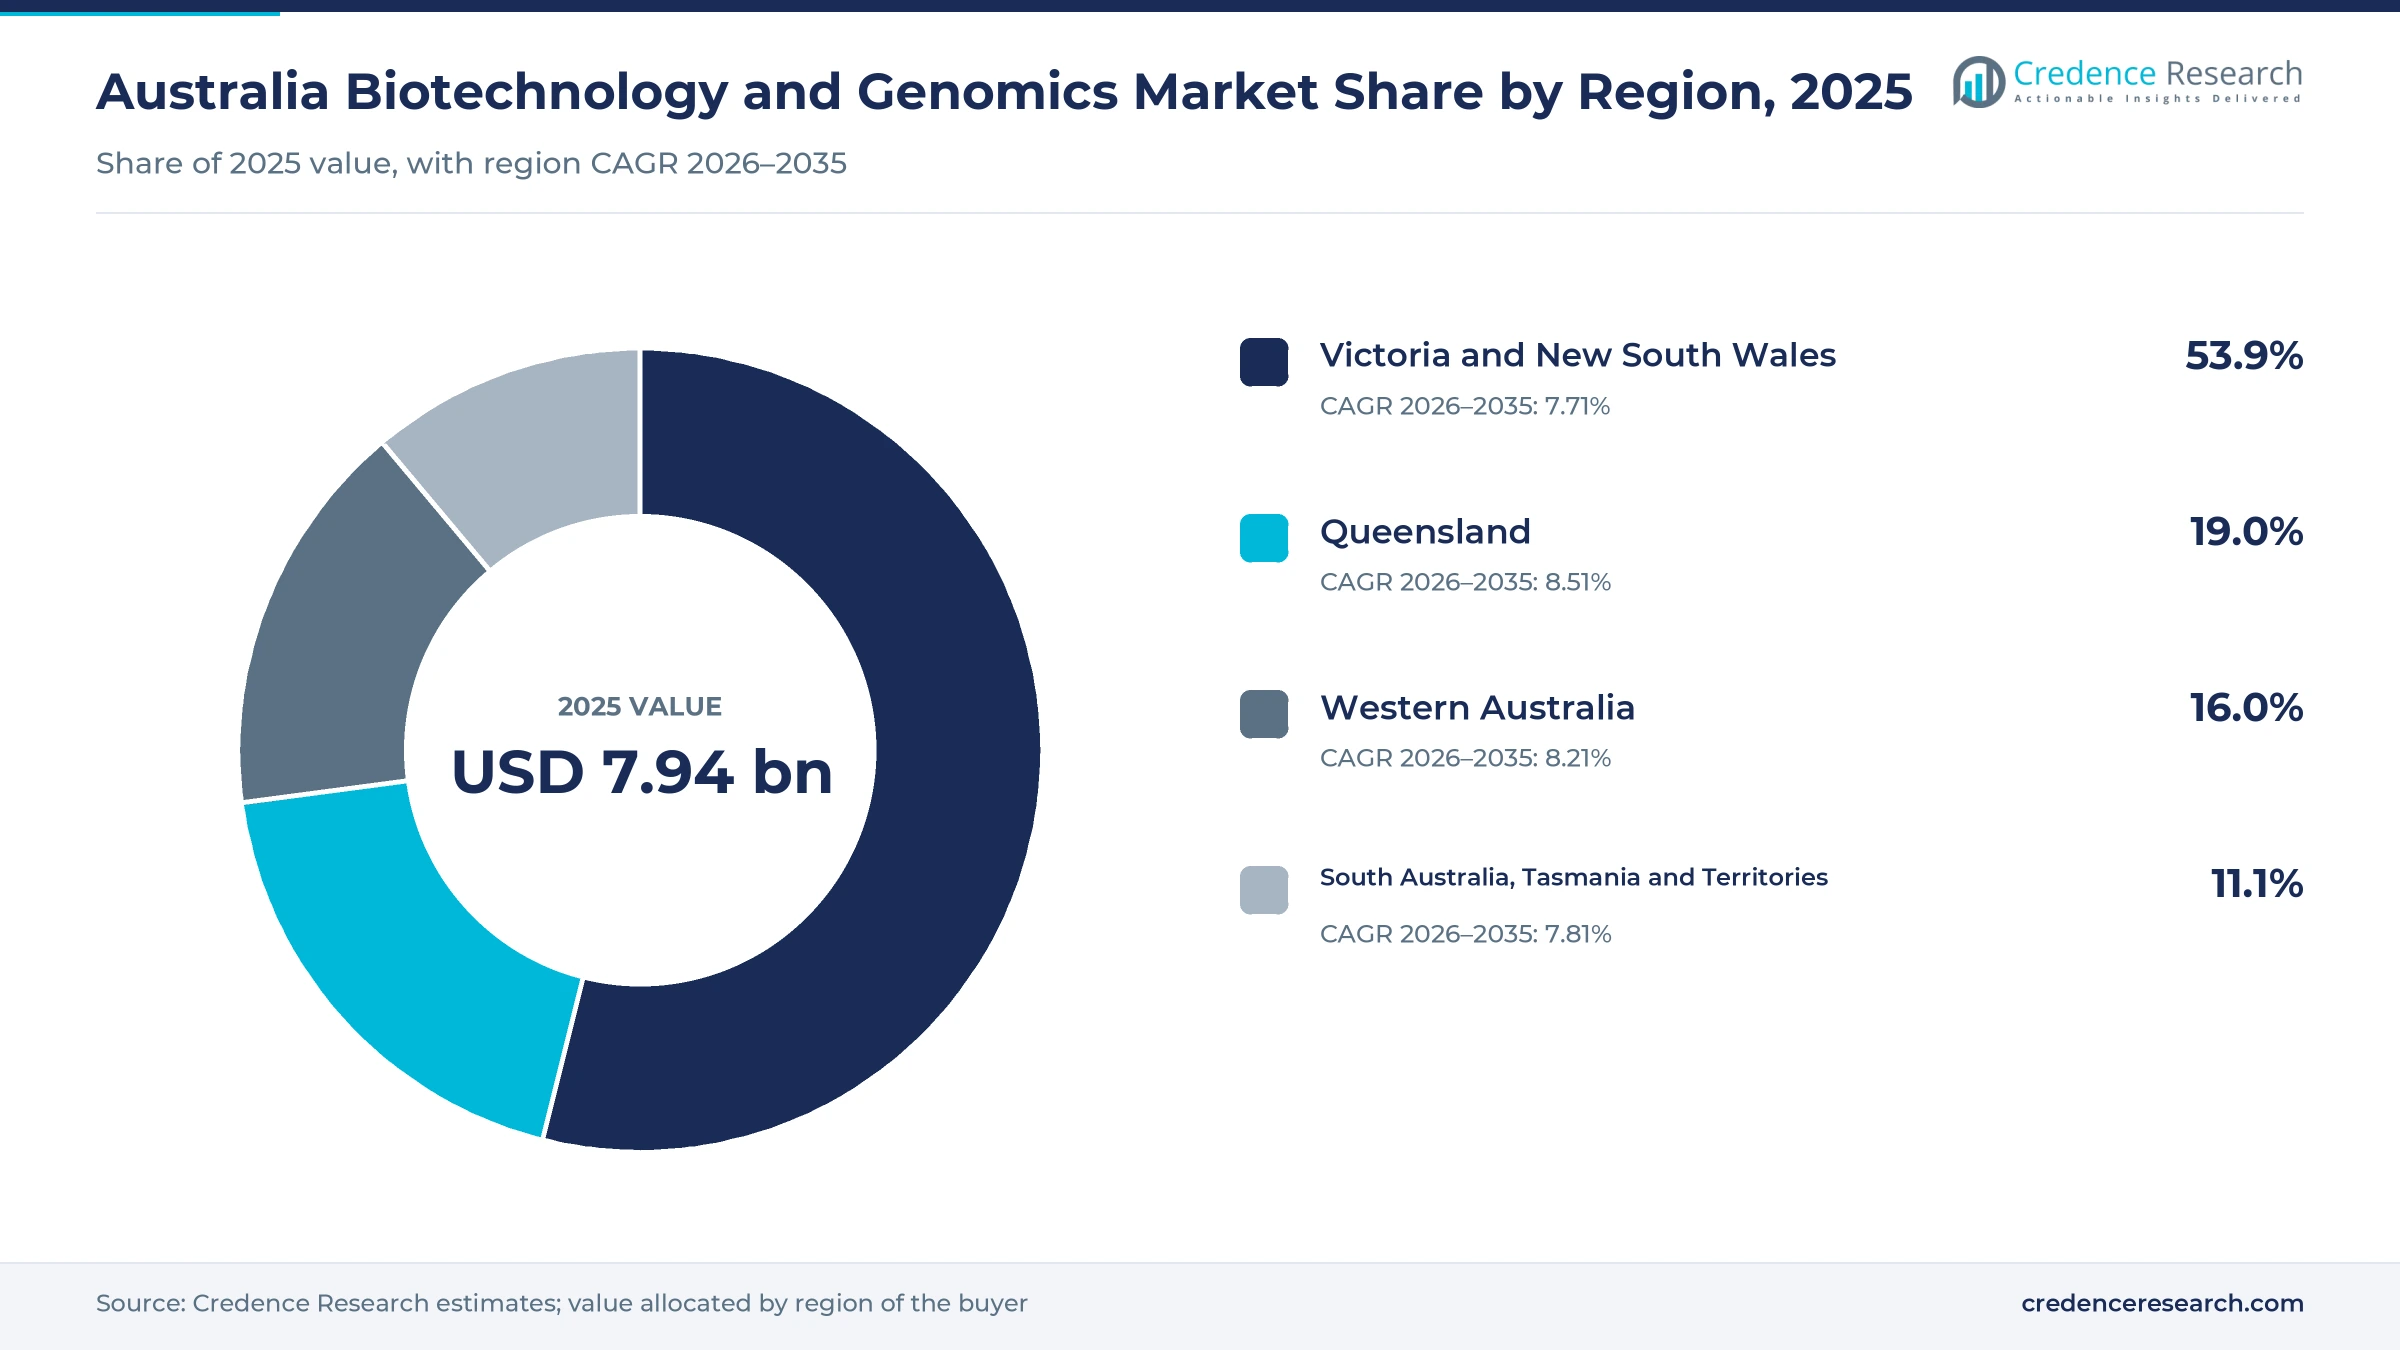
The Australia biotechnology and genomics market was valued at USD 7.94 billion in 2025 and is projected to increase from USD 8.60 billion in 2026 to USD 17.14 billion by 2035, registering a CAGR of 7.96% during 2026–2035. Demand comes from subsidized biologic medicines, Medicare-funded genomic tests, early-phase clinical trials, sovereign vaccine contracts and licensed crop traits. Victoria and New South Wales held the largest regional share, 53.9% in 2025, supported by vaccine plants in Melbourne and a new RNA facility in Sydney. Queensland is the fastest-growing region at 8.51% a year, helped by translational science investment and planned fermentation capacity in Mackay. Commercial conditions are changing as well, because Genomics Australia began work on July 1, 2025, while the 2026–27 federal budget proposes narrower access to refundable research tax offsets from July 1, 2028.
What does the Australian biotechnology and genomics market count, and who pays?
The market counts human health biologics and cell therapies, agricultural and industrial biotechnology products, and genomics services sold to Australian buyers. Payment comes mainly through the Pharmaceutical Benefits Scheme, Medicare rebates, state health procurement, private pathology, sponsors of clinical trials and research institutes.
The estimate excludes medical devices without a biological or genomic function, general chemistry pathology and small-molecule generics. The value chain runs from university discovery and contract research through regulated manufacturing to reimbursed clinical supply, with licensing income supporting companies whose lead products are still in trials.
Australia Biotechnology and Genomics Market Insights
- The market grows from USD 7.94 billion in 2025 to USD 17.14 billion by 2035, a 7.96% CAGR across 2026–2035, as reimbursed genomics and sovereign manufacturing expand together.
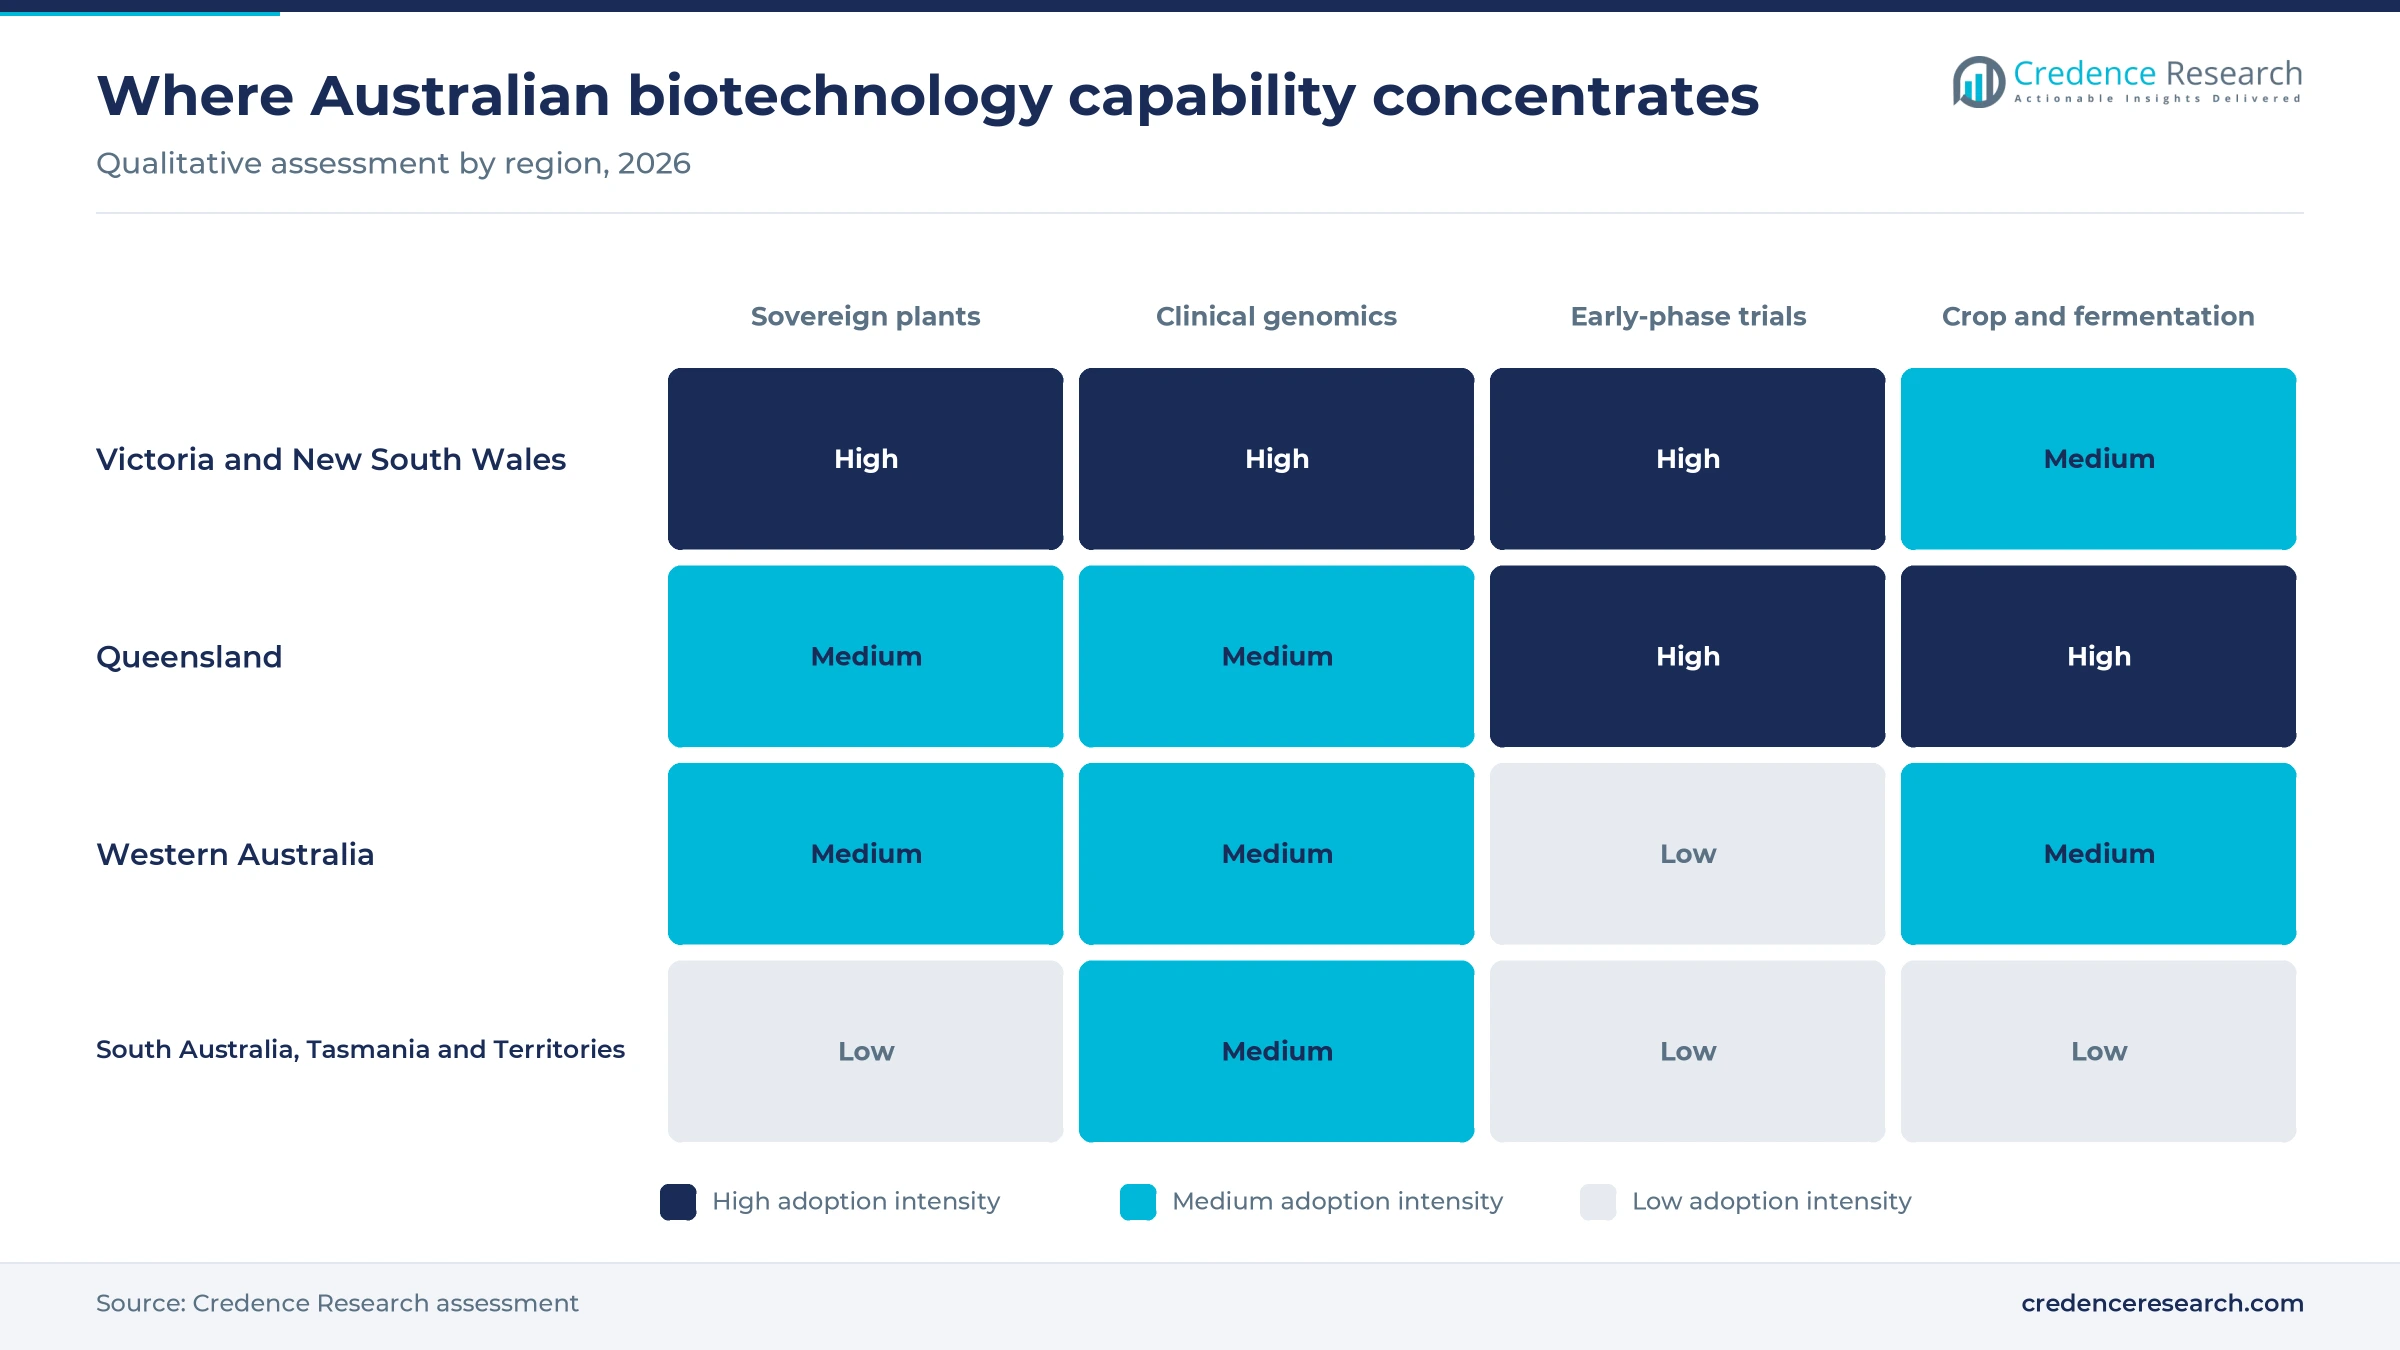
- Victoria and New South Wales held 53.9% of 2025 value, reflecting the Melbourne vaccine plants, Sydney RNA capacity and the largest concentration of biotechnology organizations in the country.
- Human Health Biotechnology led the product mix with 62.0% in 2025, because subsidized biologic medicines remain the largest single spending pool for public payers.
- Genomics Australia began on July 1, 2025, giving health genomics a national agency, while CSL Seqirus opened a cell-based vaccine plant at Tullamarine in late 2025.
- Competition splits between integrated vaccine and plasma producers, pathology networks and listed trial-stage developers, and the proposed research tax changes from July 2028 will test the younger group.
Human health and public buyers set the demand base
Why human health biotechnology leads the product mix
Based on product type, the market is categorized into human health biotechnology, agricultural biotechnology, industrial biotechnology and genomics services. Human Health Biotechnology led with 62.0% of 2025 value because subsidized biologic medicines anchor spending, and the Australian Institute of Health and Welfare counted six biologics among the 10 costliest Pharmaceutical Benefits Scheme medicines in 2022–23. Genomics Services grows fastest at 9.42% a year as Medicare demand widens, after the Department of Health recorded more than 376,000 subsidized genetic and genomic tests in 2022–23. Crop and fermentation work remains smaller, although both hold licensed or planned commercial assets in Queensland.
Public purchasers fund the largest share of demand
Based on customer type, the market is categorized into public health purchasers, private healthcare providers, biopharmaceutical companies and research and bioeconomy customers. Public Health Purchasers led with 44.0% because federal reimbursement sets the largest budgets, and the Australian Institute of Health and Welfare reported that government paid A$17.0 billion, or 83%, of the A$20.4 billion spent on subsidized medicines in 2022–23. Research and Bioeconomy Customers grows fastest at 9.31% a year as research funding scales, with Opportuna Legal's review of the 2026–27 federal budget showing Medical Research Future Fund disbursements rising from A$650 million in 2025–26 to A$1 billion from 2030–31.
Diagnosis and treatment outweigh research applications
Based on application, the market is categorized into disease diagnosis and treatment, drug discovery and clinical development, crop and animal improvement, and bioprocess and material optimization. Disease Diagnosis and Treatment led with 58.0% because cancer and immune care absorb the highest-cost therapies, and the Australian Institute of Health and Welfare attributed about 39% of 2022–23 government medicine spending to antineoplastic and immunomodulating agents. Bioprocess and Material Optimization grows fastest at 9.68% a year as fermentation moves toward commercial scale, including a Cauldron plant planned for Mackay at more than 1,000 metric tons a year, according to a September 2024 company release. Demand for drug discovery laboratory services follows trial activity at sponsors nationwide.
Cell-based plants lead while sequencing grows fastest
Based on technology, the market is categorized into cell-based biomanufacturing, molecular assay platforms, genomic sequencing and computational biology. Cell-Based Biomanufacturing led with 46.0% because large dedicated plants define national supply, and CSL Seqirus opened its A$1 billion Tullamarine cell-based vaccine facility in late 2025, according to Australian Manufacturing. Genomic Sequencing grows fastest at 9.26% a year as cancer profiling gains federal backing, with the 2026–27 budget allocating A$71.0 million over three years to the PrOSPeCT genomic profiling program, according to Opportuna Legal. Sequencing access also broadens through the South Australian Genomics Centre's Flinders node, an investment above A$7 million.
| Segment Group | Leading Sub-segment | Share, 2025 | Fastest-growing Sub-segment | CAGR, 2026–2035 |
|---|---|---|---|---|
| By Product Type | Human Health Biotechnology | 62.0% | Genomics Services | 9.42% |
| By Customer Type | Public Health Purchasers | 44.0% | Research and Bioeconomy Customers | 9.31% |
| By Application | Disease Diagnosis and Treatment | 58.0% | Bioprocess and Material Optimization | 9.68% |
| By Technology | Cell-Based Biomanufacturing | 46.0% | Genomic Sequencing | 9.26% |
Request a Free Sample
Fill in your details and we'll send you a free sample report.
- Sample data tables & charts
- Research methodology
Rebates, research funds and plants lift spending
Clinical genomics translation through Medicare rebates
Clinical genomics is moving from research into reimbursed practice, which lifts recurring test volumes for laboratories and cancer centers. The federal government committed A$148.5 million over four years for 34 new, expanded or increased Medicare rebates from Nov. 1, 2023, serving about 112,000 people a year. That package followed more than 376,000 subsidized tests and about A$76.8 million in benefits during 2022–23. Genomics Australia then began work on July 1, 2025, with over A$30 million for its first four years, according to the Department of Health. As a result, genetic testing providers can plan around the updated National Health Genomics Policy Framework, while reproductive carrier screening alone is expected to reach about 85,000 people each year.
Research incentives and commercial runway for developers
Public research money and tax offsets let young companies fund longer clinical programs before product income arrives. Opportuna Legal's review of the 2026–27 federal budget records A$508.5 million over four years in added Medical Research Future Fund disbursements, plus A$15.8 million over two years for a national clinical trial approval platform. AusBiotech counted more than 350,000 supported jobs across almost 3,000 organizations in June 2026, up from 2,654 organizations in its 2022 snapshot reported by BiotechDispatch. That runway can produce exportable assets, as shown when the FDA approved Ryoncil from Mesoblast on Dec. 18, 2024, for children aged two months and older with steroid-refractory acute graft-versus-host disease.
Sequencing productivity and wider service breadth
Wider instrument choice and shared facilities let smaller sponsors order whole-genome, single-cell and spatial studies without buying their own platforms. The Australian National University's John Curtin School of Medical Research lists Illumina, PacBio Revio and Oxford Nanopore PromethION sequencing among its services. The Flinders University node of the South Australian Genomics Centre, established in July 2020 with more than A$7 million invested, adds Stereo-seq and Xenium spatial systems and handles up to 1 million cells per Evercode experiment. Budget planning also remains open, since a March 2026 Value in Health study reported observed testing volumes below diffusion-implied trajectories and suggested likely under-budgeting. Consequently, Genomic Sequencing holds the fastest technology growth at 9.26% a year across the forecast period.
Sovereign supply contracts anchor domestic plants
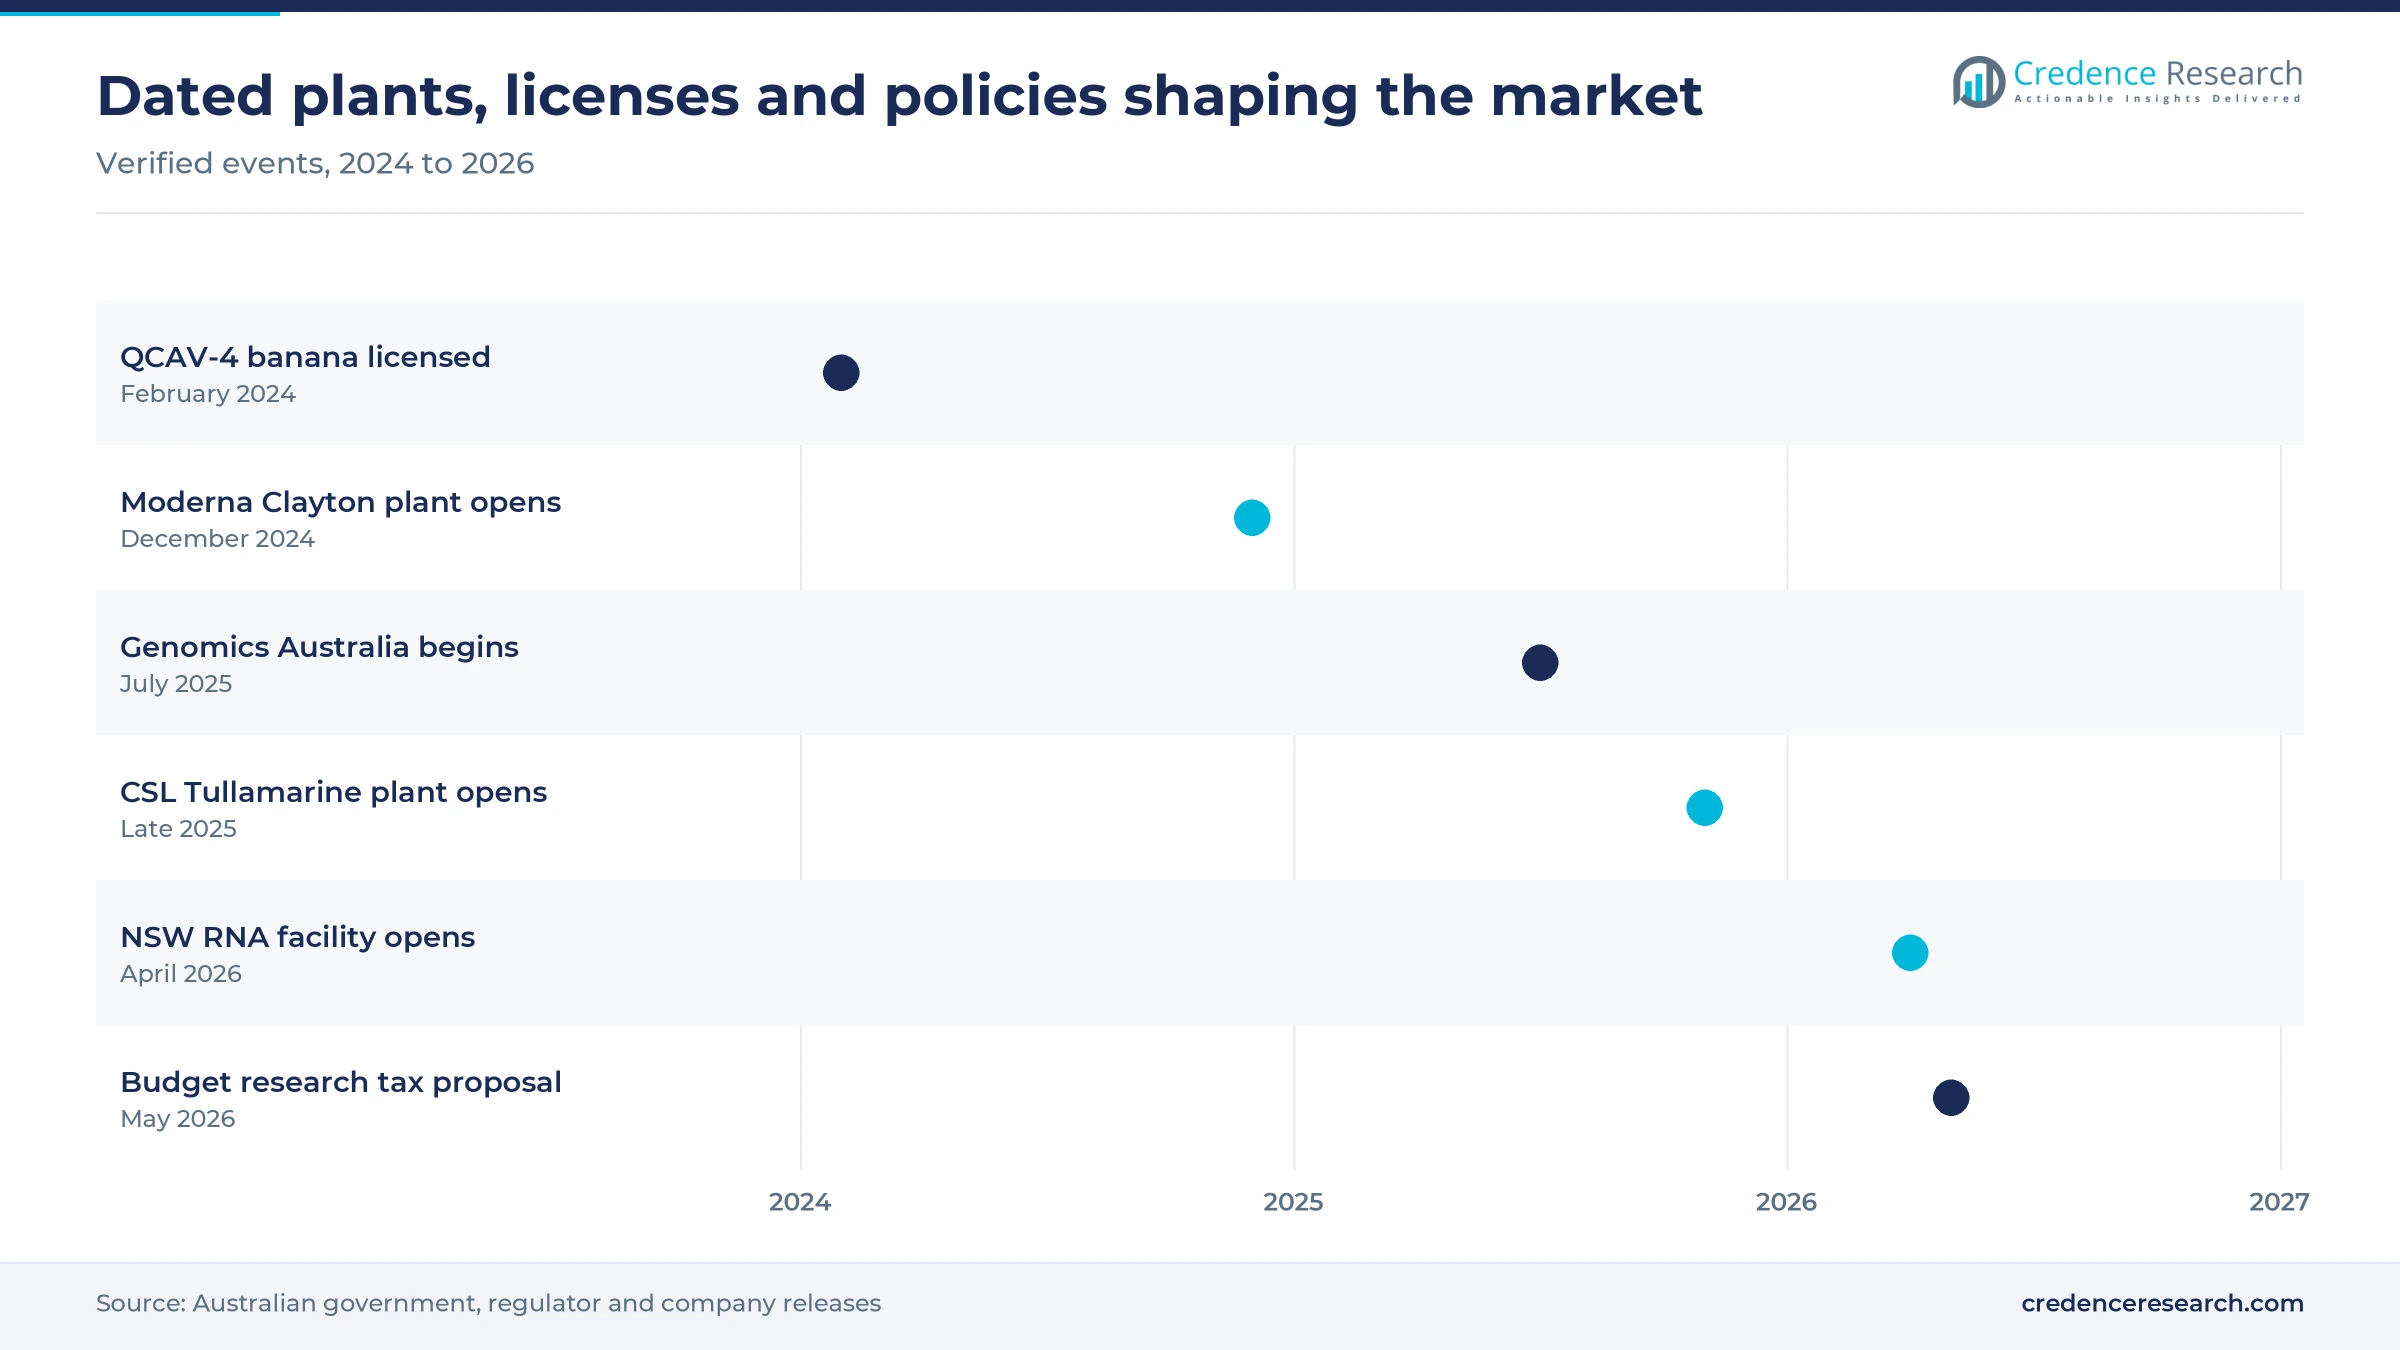
Long-term government supply agreements underwrite plants that private demand alone would struggle to justify. Moderna opened its Clayton facility on Dec. 4, 2024, with capacity for up to 100 million doses a year under a 10-year partnership with the federal and Victorian governments, according to Investment Monitor. CSL Seqirus backs its Tullamarine site with a 12-year federal agreement running through 2036, according to Australian Manufacturing. In New South Wales, an A$96 million RNA facility covering 4,500 square meters opened at Macquarie University in April 2026, according to LabOnline. These commitments feed local contract manufacturing work and help the southern states keep their lead in national supply.
RNA capacity and crop licenses open new revenue pools
RNA capacity shifts beyond a single Victorian plant
RNA production is spreading across states, which gives developers more domestic options for early and pilot batches. The Macquarie University facility, operated with industry partner Aurora Biosynthetics, is described by the New South Wales government as the only Australian site able to produce a wide range of RNA therapeutics under one roof, according to LabOnline. In July 2024, Western Australia's Future Health Research and Innovation Fund awarded just over A$2 million toward the TIA RNA Foundry at the University of Western Australia, within a combined A$6.85 million investment. This capacity joins Clayton, whose vaccine focus covers influenza, RSV and COVID-19. Together, these sites support the Therapeutic Innovation Australia national RNA network and shorten supply lines for local sponsors.
Rising consolidation among diagnostics and trial providers
Smaller diagnostics and clinical research providers are seeking scale, because laboratory costs and capital needs favor larger networks. Genetic Signatures and Microba Life Sciences announced preliminary merger talks on Aug. 26, 2026, although BiotechDispatch reported that no binding decision or terms were agreed. Nucleus Network bought Britain's Hammersmith Medicines Research in August 2025 and now cites more than 1,500 first-in-human studies, according to its release. Healius has also moved to a single national operating model, replacing four standalone businesses, according to Quartr's summary of its 2025 investor day. For buyers of in vitro diagnostics, these moves point to fewer vendors with broader test menus and national logistics.
Opportunity in disease-resistant and oil-trait crops
Licensed crop traits offer a commercial opening for agricultural biotechnology beyond the established cotton base. The Office of the Gene Technology Regulator issued license DIR 199 for the QCAV-4 banana, developed by Queensland University of Technology to resist Panama disease, and Food Standards Australia New Zealand cleared it for food on Feb. 16, 2024, according to ISAAA. The regulator's crop snapshot shows about 46% of the national canola crop was genetically modified in 2024, while almost all cotton is modified. Safflower with increased oleic acid has been released since 2018, and commercial safflower is mainly grown in New South Wales, Victoria and South Australia. Seed developers can therefore build on established grower familiarity when they introduce new traits.
Opportunity in precision fermentation and Queensland hubs
Fermentation and translational science give Queensland a route into industrial and vaccine work that does not depend on existing Melbourne plants. Cauldron plans its first industrial facility in Mackay at more than 1,000 metric tons a year, supported by Queensland's Industry Partnership Program, and already runs a 25,000-liter demonstration site in New South Wales, according to its September 2024 release. An A$280 million Translational Science Hub links the Queensland government, Sanofi, the University of Queensland and Griffith University under a December 2022 agreement. Queensland's government also reports more than 230 biomedical firms supporting regional demand for contract and trial services. As a result, Bioprocess and Material Optimization carries the fastest application growth at 9.68% a year across the forecast period.
Tax changes and uneven access slow younger companies
Research tax changes threaten mature pre-profit sponsors
The 2026–27 federal budget limits refundable research offsets to businesses under 10 years old from July 1, 2028, and removes supporting R&D from eligibility, according to Opportuna Legal. AusBiotech reported in June 2026 that 76% of 59 surveyed members expect significant or moderate effects. Companies aged six to 15 years are most exposed, since all of them expect an impact. As a result, some sponsors warn they could move critical trials overseas unless the design changes.
Rebate coverage leaves genomic access uneven
Medicare funding covers listed indications rather than every clinical need, so access depends on where a patient's condition sits on the schedule. Melbourne Genomics counted eight funded genomic tests as of October 2023, and the reproductive carrier rebate pays each parent A$300 to A$340. Laboratories and patients outside those items rely on hospital budgets, research studies or self-funding. Consequently, providers must plan volumes carefully until Genomics Australia and federal assessors extend coverage to further indications.
State limits narrow the planted area for modified crops
Regulatory approval does not guarantee planting, because states can still restrict cultivation for marketing reasons. In its December 2025 snapshot, the Office of the Gene Technology Regulator notes that the Australian Capital Territory, Tasmania and parts of South Australia restrict genetically modified crops, and that approved Indian mustard has not yet been planted. Seed developers therefore face smaller addressable areas than national licenses imply. Commercial cotton, by comparison, is grown in inland New South Wales and Victoria and in central and southern Queensland.
Thin capital and cost pressure test listed diagnostics
Smaller listed diagnostics companies have limited cash for commercial expansion, which slows launches and sales coverage. Genetic Signatures and Microba would hold about A$30 million in combined cash and term deposits at June 30, 2026, according to BiotechDispatch, and AusBiotech found 61% of surveyed members expect proposed capital gains changes to hurt them. Larger networks face pressure too, since Healius targets A$15 million to A$20 million in cost cuts. Partnerships and merger talks are therefore the visible response among smaller listed suppliers.
Victoria and New South Wales lead, Queensland gains
| Region | Value, 2025 (USD billion) | Share, 2025 | CAGR, 2026–2035 |
|---|---|---|---|
| Victoria and New South Wales | 4.28 | 53.9% | 7.71% |
| Queensland | 1.51 | 19.0% | 8.51% |
| Western Australia | 1.27 | 16.0% | 8.21% |
| South Australia, Tasmania and Territories | 0.88 | 11.1% | 7.81% |
Victoria and New South Wales hold the plants and the clusters
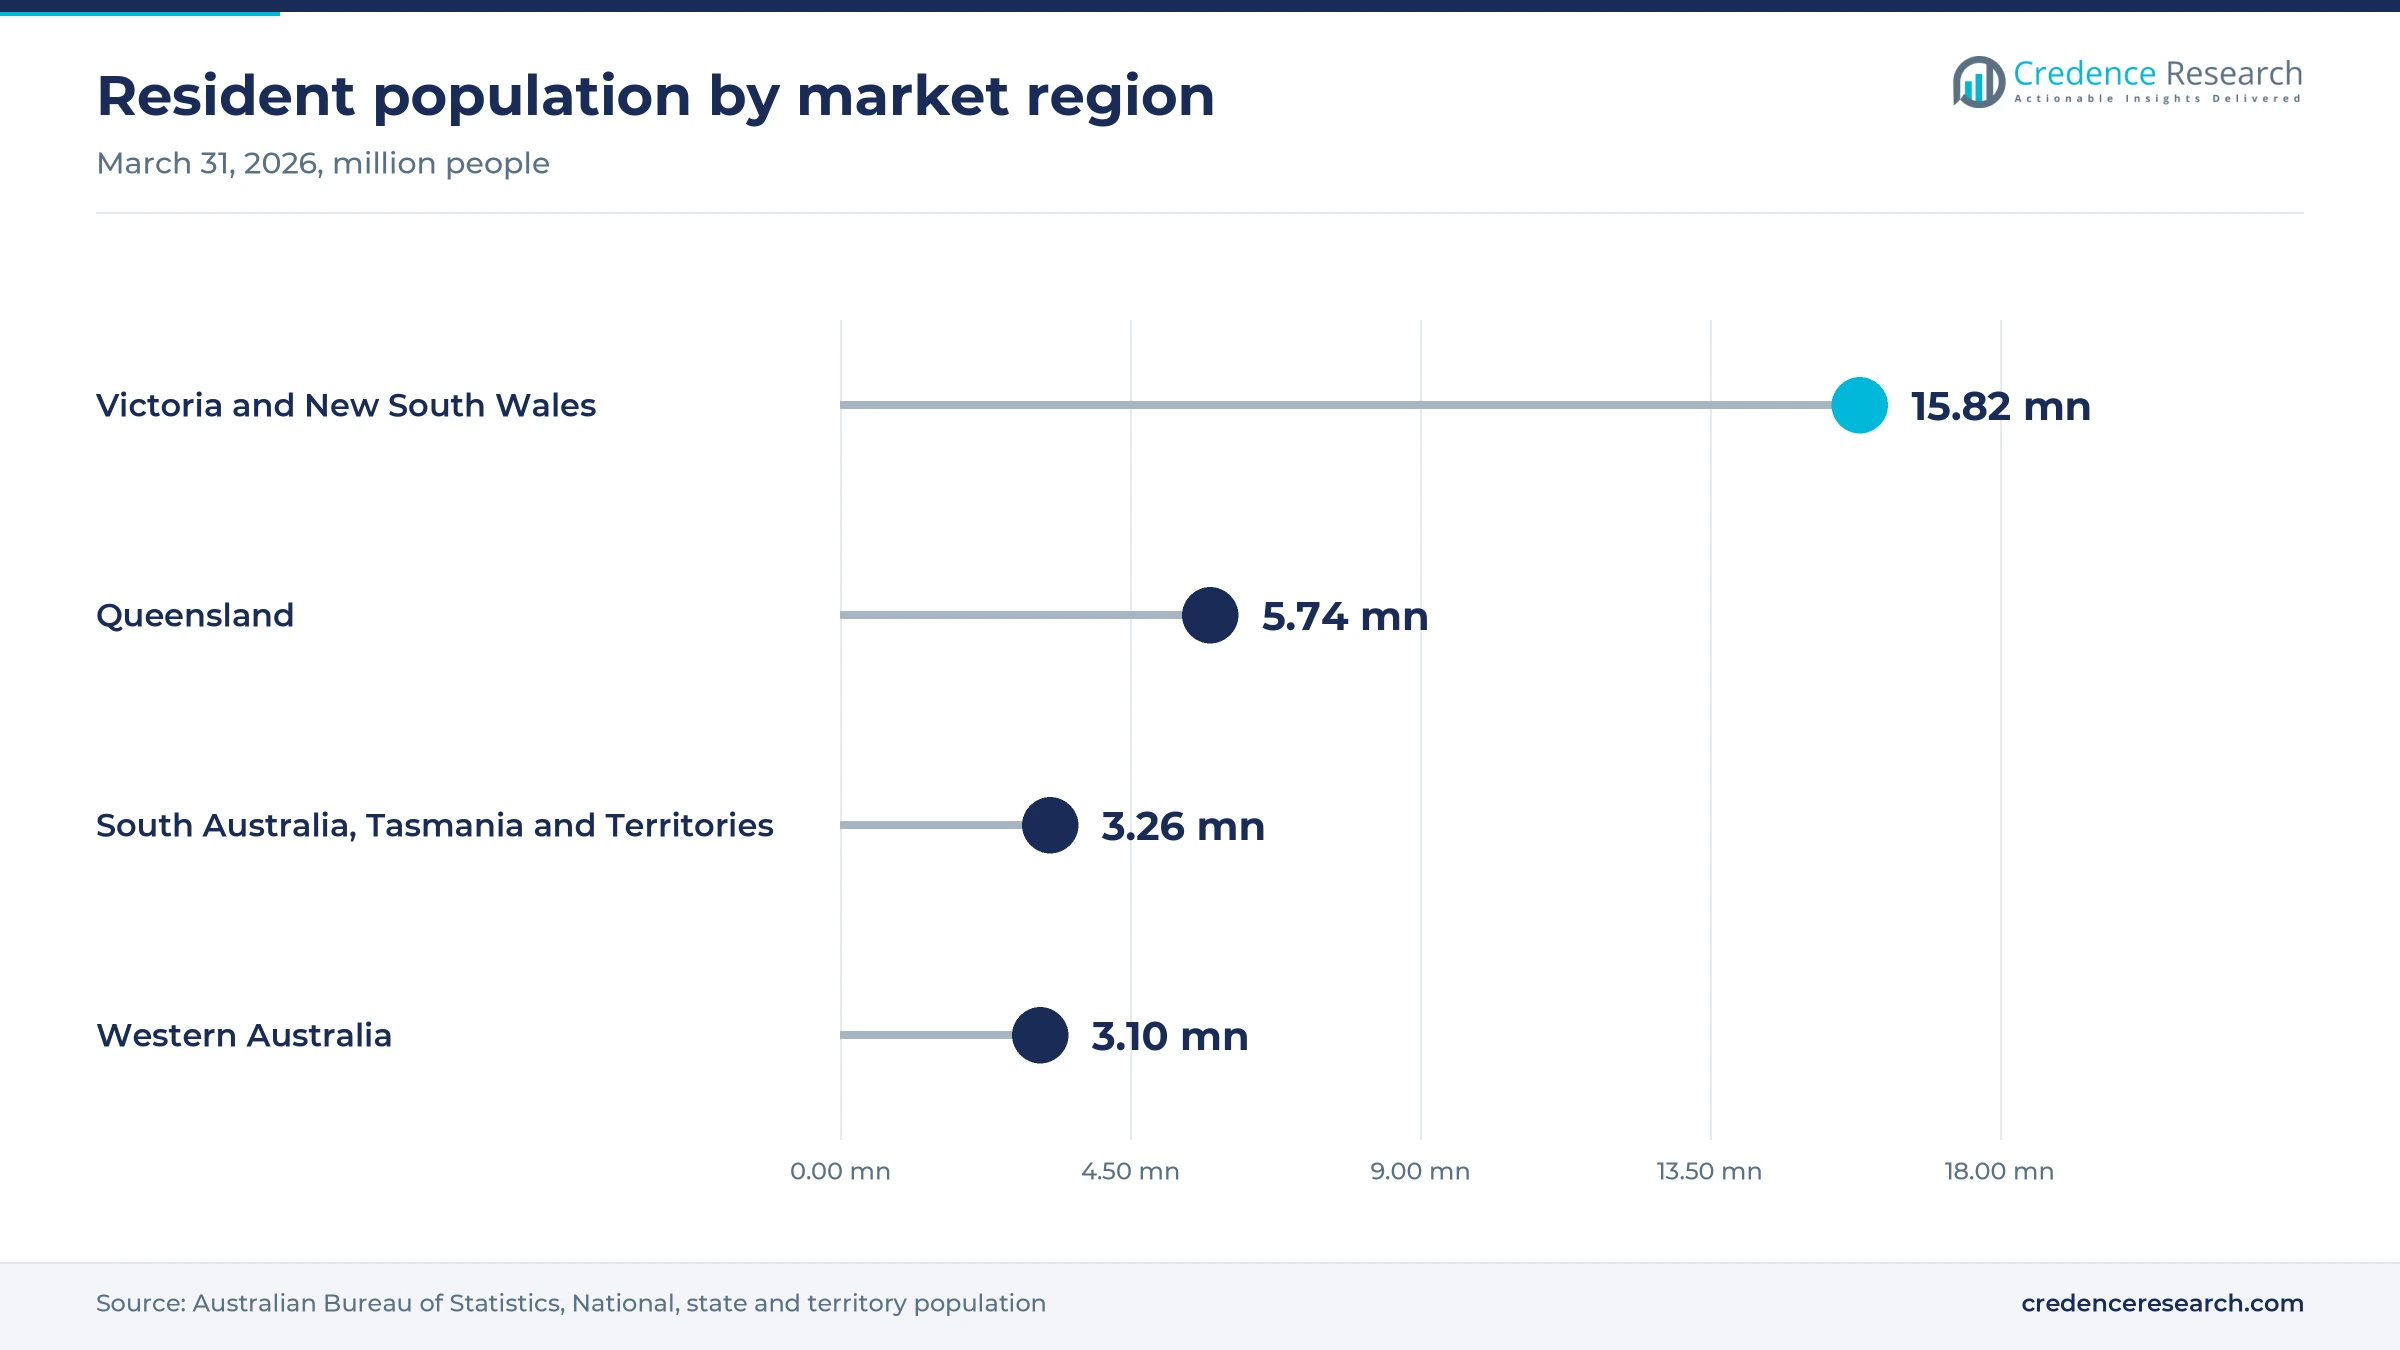
Victoria and New South Wales held 53.9% of 2025 value and grow at 7.71% a year. BiotechDispatch reported in June 2022 that the two states host 73% of sector organizations in the AusBiotech snapshot. The Australian Bureau of Statistics counted about 15.82 million residents there at March 31, 2026. Tullamarine, Clayton and Macquarie Park supply most sovereign capacity, while Telix lists a North Melbourne manufacturing site opening as a 2026 milestone.
Queensland gains from biomedical investment and fermentation
Queensland held 19.0% of 2025 value and is the fastest-growing region at 8.51% a year. The Queensland government reports over 27,300 biomedical workers, about A$4.15 billion in annual gross value added and about A$533 million in exports. Nucleus Network operates an early-phase clinic in Brisbane, which draws sponsors into the state. Planned Mackay fermentation capacity and the ENTRI manufacturing facility, scheduled to open in 2026, give the state a broader industrial base than clinical services alone.
Western Australia builds on sterile manufacturing and RNA
Western Australia held 16.0% of 2025 value and grows at 8.21% a year. BioCina runs a 34,000-square-meter injectables site at Technology Park that has supplied medicines to 98 countries, according to the state's Future Health Research and Innovation Fund in December 2025. The TIA RNA Foundry at the University of Western Australia adds research-grade capacity. Population grew 2.1% in the year to March 2026, the fastest state rate, which supports clinical and pathology volumes.
South Australia, Tasmania and territories rely on specialist nodes
South Australia, Tasmania and Territories held 11.1% of 2025 value and grow at 7.81% a year. South Australia alone accounted for 5% of organizations and 135 entities in the 2022 AusBiotech snapshot reported by BiotechDispatch. The South Australian Genomics Centre, with its hub at SAHMRI in Adelaide, gives researchers spatial and single-cell services. Healius also won a Tasmanian Department of Health tender, according to Quartr's investor day summary, adding public volume in a smaller market.
Dated plants, rebates and approvals since 2024
| Development | Status and market relevance |
|---|---|
| In February 2024, the Office of the Gene Technology Regulator licensed the QCAV-4 banana for commercial cultivation, and food clearance followed on Feb. 16. | Licensed; first genetically modified banana cleared for Australian cultivation |
| In December 2024, Moderna opened its Clayton mRNA plant at Monash University with capacity for up to 100 million doses a year. | Operating under a 10-year government partnership |
| In July 2025, Genomics Australia began operating as the national health genomics body with over A$30 million for four years. | Operating; implements the updated national policy framework |
| In April 2026, New South Wales opened an A$96 million RNA Research and Manufacturing Facility at Macquarie University. | Open; Aurora Biosynthetics is the industry operator |
| In August 2026, Genetic Signatures and Microba Life Sciences announced preliminary merger discussions. | Preliminary; no binding terms agreed |
Sequencing and cell platforms set service capability
- Cell-based biomanufacturing relies on dedicated plants such as CSL Seqirus at Tullamarine, which opened in late 2025 as a cell-based vaccine facility.
- Molecular assay platforms include the EasyScreen tests from Genetic Signatures, whose 3base chemistry is designed for high-volume hospital and pathology laboratories.
- Genomic sequencing spans Illumina, PacBio Revio and Oxford Nanopore PromethION instruments at university facilities, including the John Curtin School of Medical Research in Canberra.
- Computational biology supports these laboratories through services such as the bioinformatics platform at the South Australian Genomics Centre, which handles analysis, integration and visualization of sequence data.
Need a Custom Version of This Report?
Tailor the scope, geography, or segments to your exact requirements.
- Custom geography or segment scope
- Direct access to our analyst team
Vaccines, radiopharma and pathology networks compete
Competition is organized around supply position rather than a single product category. CSL Limited holds the sovereign vaccine and antivenom role through its long-term federal agreement, while Telix Pharmaceuticals competes in radiopharmaceutical imaging and lists Illuccix as commercially available in Australia. Mesoblast and Imugene compete for trial capital with cell therapies, and Imugene runs its azer-cel Phase 1b study at five Australian sites. Clinuvel Pharmaceuticals, based in Melbourne, reached its Phase III vitiligo recruitment target in May 2025. Sonic Healthcare and Healius compete through national pathology networks, and Sonic also distributes Microba tests. Nucleus Network supplies early-phase trial capacity in Melbourne and Brisbane, and Genetic Signatures sells assays to hospital laboratories. Scale matters most in reimbursed services, whereas clinical data decides value among developers.
Companies profiled and their roles in this market
| Company | Type | Role in the market |
|---|---|---|
| CSL Limited | Vaccine and plasma producer | Operates the Tullamarine cell-based plant through CSL Seqirus under a federal agreement through 2036 |
| Telix Pharmaceuticals | Radiopharmaceutical developer | Supplies Illuccix in Australia and runs a Phase 3 LUTEON study locally |
| Mesoblast | Cell therapy developer | Holds FDA approval for Ryoncil in pediatric graft-versus-host disease |
| Clinuvel Pharmaceuticals | Specialty biologic developer | Melbourne-based sponsor of the CUV105 Phase III vitiligo trial |
| Imugene | Immuno-oncology developer | Runs azer-cel at five Australian and 10 U.S. sites |
| Sonic Healthcare | Pathology network | Distributes Microba microbiome testing through its laboratory relationships |
| Healius | Pathology network | Operates Genomic Diagnostics and Agilex Biolabs under one national model |
| Nucleus Network | Early-phase trial provider | Runs clinics in Melbourne and Brisbane, with Sydney planned from about 2026 |
| Genetic Signatures | Molecular diagnostics maker | Sells EasyScreen assays to high-volume hospital and pathology laboratories |
| Microba | Microbiome testing company | Provides clinical-grade gut microbiome testing to Australian healthcare professionals |
Reimbursement and tax design will decide the pace
Credence Research's view is that reimbursement design and research tax settings will shape this market more than laboratory capability does. Plants and sequencers are already funded, including Clayton, Tullamarine and Macquarie Park, yet younger sponsors depend on rules taking effect from July 1, 2028. Genomics services should keep gaining share because Medicare items and precision oncology funding are widening access. However, buyers should expect a thinner field of listed diagnostics suppliers if preliminary talks such as the Genetic Signatures and Microba discussions produce mergers. Sponsors with trial plans beyond 2028 should test offset eligibility now, because demand for local studies depends on those rules.
Public registers and releases underpin these estimates
The report uses 2025 as the base year and 2035 as the forecast year, with market values from the Credence Research model. Segment and regional splits are Credence Research estimates informed by public data. Sources used include Australian government releases, the Australian Bureau of Statistics, the Australian Institute of Health and Welfare, the Office of the Gene Technology Regulator, the U.S. Food and Drug Administration, company announcements and named trade publications. No primary interviews or surveys were conducted for this report.
Genomics services and bioprocessing outpace the base by 2035
The market is forecast to reach USD 17.14 billion by 2035 from USD 8.60 billion in 2026, a 7.96% CAGR across 2026–2035. Human health biologics will remain the base, while Genomics Services expands at 9.42% a year on wider Medicare coverage and precision oncology funding. Queensland should gain share as Mackay fermentation and hub projects mature. The main uncertainty is the 2028 tax change, because a narrower refundable offset could shift some trial spending overseas. Conversely, sovereign supply contracts running into the mid-2030s give manufacturers a stable volume floor through most of the forecast.
Frequently Asked Questions
How big is the Australia biotechnology and genomics market?
Which product type leads the Australian market?
Which product type is growing fastest?
Which region holds the largest share?
Which region is growing fastest?
What does Genomics Australia do for this market?
How could research tax changes affect companies?
Which companies are active in this market?
Table of Content
Chapter 1 Market Segmentation
- 1.1 Segmentation Framework
- 1.1.1 Product and Service Classification
- 1.1.2 Application and End-Use Classification
- 1.1.3 Technology and Solution Classification
- 1.1.4 Customer and Distribution Channel Classification
- 1.1.5 Geographic Segmentation
- 1.1.6 Market Segment Definitions and Boundaries
- 1.2 By Product Type
- 1.2.1 Human Health Biotechnology
- 1.2.2 Agricultural Biotechnology
- 1.2.3 Industrial Biotechnology
- 1.2.4 Genomics Services
- 1.3 By Customer Type
- 1.3.1 Public Health Purchasers
- 1.3.2 Private Healthcare Providers
- 1.3.3 Biopharmaceutical Companies
- 1.3.4 Research and Bioeconomy Customers
- 1.4 By Application
- 1.4.1 Disease Diagnosis and Treatment
- 1.4.2 Drug Discovery and Clinical Development
- 1.4.3 Crop and Animal Improvement
- 1.4.4 Bioprocess and Material Optimization
- 1.5 By Technology
- 1.5.1 Cell-Based Biomanufacturing
- 1.5.2 Molecular Assay Platforms
- 1.5.3 Genomic Sequencing
- 1.5.4 Computational Biology
Chapter 2 Introduction
- 2.1 Report Objectives and Scope
- 2.2 Product Definition and Industry Terminology
- 2.3 Market Inclusions and Exclusions
- 2.4 Research Process
- 2.4.1 Primary Research and Expert Interviews
- 2.4.2 Secondary Research and Source Review
- 2.4.3 Top-Down and Bottom-Up Estimation
- 2.4.4 Data Triangulation and Verification
- 2.5 Market Size Measurement Basis
- 2.5.1 2025: USD 7.94 billion → 2035: USD 17.14 billion
- 2.6 Historical and Forecast Reference Periods
- 2.6.1 Historical Period: 2018-2025
- 2.6.2 Base Year: 2025
- 2.6.3 Forecast Period: 2025-2035
- 2.7 Research Assumptions and Limitations
Chapter 3 Executive Summary
- 3.1 Market Snapshot and Key Findings
- 3.2 Base-Year Market Size, 2025
- 3.3 Forecast Market Size, 2035
- 3.4 Revenue and Volume Growth Outlook
- 3.5 Key Demand and Supply Indicators
- 3.6 Leading Market Segments
- 3.7 Fastest-Growing Market Opportunities
- 3.8 Regional Performance Highlights
- 3.9 Technology and Industry Transformation
- 3.10 Competitive Landscape Summary
- 3.11 Analyst View and Strategic Implications
Chapter 4 Australia Biotechnology and Genomics Market Trends and Developments
- 4.1 Historical Industry Development, 2018-2025
- 4.2 Recent Market Trends and Developments
- 4.3 Demand and Customer Behavior Trends
- 4.4 Technology and Product Innovation
- 4.5 Artificial Intelligence, Automation and Digitalization
- 4.6 Local Manufacturing and Supply Chain Realignment
- 4.7 Industry Partnerships, Mergers and Acquisitions
- 4.8 Sustainability and Circular Economy Developments
- 4.9 Government and Private Sector Investment Trends
- 4.10 Emerging Business Models and Commercialization
- 4.11 Industry Developments and Announcements
Chapter 5 Australia Biotechnology and Genomics Market Production, Supply and Demand Analysis
- 5.1 Demand Trend and Consumption Analysis, 2018-2025
- 5.2 Demand Forecast, 2025-2035
- 5.3 Production and Output Trend, 2018-2025
- 5.4 Production and Output Forecast, 2025-2035
- 5.5 Installed Capacity and Capacity Utilization
- 5.6 Company-Wise Production Plants and Statistics
- 5.6.1 Installed Production Capacity
- 5.6.2 Actual Production
- 5.6.3 Planned Capacity and Expansion Targets
- 5.7 Supply Chain Structure and Procurement Trends
- 5.8 Supply-Demand Gap and Bottlenecks
- 5.9 Import Dependence and Sourcing Structure
- 5.10 Contract Manufacturing and Outsourcing
- 5.11 Regional Supply and Demand Concentration
Chapter 6 Australia Biotechnology and Genomics Market Pricing Analysis
- 6.1 Pricing Structure and Measurement
- 6.2 Historical Pricing Trends, 2018-2025
- 6.3 Pricing Outlook, 2025-2035
- 6.4 Average Selling Price and Unit Economics
- 6.5 Pricing by Product and Market Segment
- 6.6 Geographic Pricing Differences
- 6.7 Key Input, Energy, Labor and Logistics Costs
- 6.8 Contract Pricing and Purchasing Models
- 6.9 Pricing Sensitivity and Competitive Positioning
- 6.10 Price, Margin and Profitability Implications
Chapter 7 Australia Biotechnology and Genomics Market Dynamics
- 7.1 Market Growth Drivers
- 7.1.1 Demand-Side Drivers
- 7.1.2 Technology and Innovation Drivers
- 7.1.3 Infrastructure and Investment Drivers
- 7.1.4 Regulatory and Policy Drivers
- 7.2 Market Restraints
- 7.2.1 Cost and Affordability Constraints
- 7.2.2 Technology and Adoption Barriers
- 7.2.3 Supply Chain and Operational Constraints
- 7.3 Market Challenges
- 7.3.1 Competitive Pressure and Margin Erosion
- 7.3.2 Skills, Infrastructure and Implementation Gaps
- 7.4 Emerging Market Opportunities
- 7.5 Market Dynamics Impact and Time-Horizon Assessment
Chapter 8 Australia Biotechnology and Genomics Value Chain Analysis
- 8.1 Industry Value Chain Overview
- 8.2 Upstream Suppliers and Critical Inputs
- 8.3 Technology and Component Providers
- 8.4 Manufacturing or Service Delivery
- 8.5 Distribution, Channel Partners and Integrators
- 8.6 Downstream Applications and End Users
- 8.7 Value Addition and Profit Pools
- 8.8 Vertical Integration and Outsourcing
- 8.9 Supplier Concentration and Risk
- 8.10 Supply Chain Localization and Resilience
Chapter 9 Australia Biotechnology and Genomics Market Regulations and Policies
- 9.1 Relevant Laws, Standards and Compliance Frameworks
- 9.2 Product, Service, Safety and Quality Requirements
- 9.3 Government Policies, Incentives and Subsidies
- 9.4 Imports, Exports and Trade Barriers
- 9.5 Public Procurement and Local Content Requirements
- 9.6 Environmental and Sustainability Compliance
- 9.7 Upcoming Policy Changes and Market Implications
Chapter 10 Australia Biotechnology and Genomics Market Hotspots and Opportunities
- 10.1 Market Opportunity Mapping and Growth Hotspots
- 10.2 High-Growth Applications and Customer Groups
- 10.3 Underserved Markets and White-Space Opportunities
- 10.4 Emerging Technology and Product Opportunities
- 10.5 New Capacity and Investment Hotspots
- 10.6 Market Entry and Expansion Opportunities
- 10.7 Distribution and Partnership Opportunities
- 10.8 Near-Term and Long-Term Commercial Potential
- 10.9 Opportunity Attractiveness and Execution Risks
Chapter 11 Australia Biotechnology and Genomics Market Outlook, 2025-2035
- 11.1 Market Size and Analysis
- 11.1.1 Revenue (Market Measurement: 2025: USD 7.94 billion → 2035: USD 17.14 billion)
- 11.1.2 Market Volume and Quantity Sold
- 11.1.3 Historical Market Size, 2018-2025
- 11.1.4 Base-Year Market Size, 2025
- 11.2 Market Forecast, 2025-2035
- 11.2.1 Revenue Forecast to 2035
- 11.2.2 Volume Forecast to 2035
- 11.2.3 CAGR and Year-on-Year Growth
- 11.2.4 Incremental Revenue Opportunity
- 11.3 Forecast Assumptions and Scenario Analysis
- 11.3.1 Base-Case Forecast
- 11.3.2 Optimistic and Conservative Scenarios
- 11.3.3 Technology, Pricing and Policy Sensitivities
- 11.4 Market Attractiveness and Growth Outlook
Chapter 12 Australia Biotechnology and Genomics Market Segmentation and Outlook
- 12.1 Segmentation Summary and Market Shares, 2025
- 12.2 Largest and Fastest-Growing Segments
- 12.3 By Product Type - Market Size and Forecast, 2025-2035
- 12.3.1 Segment Definition and Scope
- 12.3.2 Historical Market Size, 2018-2025
- 12.3.3 Revenue Forecast, 2025-2035
- 12.3.4 Volume Forecast, 2025-2035
- 12.3.5 Base-Year Market Share, 2025
- 12.3.6 Segment CAGR and Growth Drivers
- 12.3.7 Subsegment Market Size and Forecast
- 12.3.7.1 Human Health Biotechnology
- 12.3.7.2 Agricultural Biotechnology
- 12.3.7.3 Industrial Biotechnology
- 12.3.7.4 Genomics Services
- 12.3.8 Subsegment Pricing and Adoption Trends
- 12.3.9 Leading Suppliers and Competition
- 12.3.10 Regional Demand and Opportunities
- 12.4 By Customer Type - Market Size and Forecast, 2025-2035
- 12.4.1 Segment Definition and Scope
- 12.4.2 Historical Market Size, 2018-2025
- 12.4.3 Revenue Forecast, 2025-2035
- 12.4.4 Volume Forecast, 2025-2035
- 12.4.5 Base-Year Market Share, 2025
- 12.4.6 Segment CAGR and Growth Drivers
- 12.4.7 Subsegment Market Size and Forecast
- 12.4.7.1 Public Health Purchasers
- 12.4.7.2 Private Healthcare Providers
- 12.4.7.3 Biopharmaceutical Companies
- 12.4.7.4 Research and Bioeconomy Customers
- 12.4.8 Subsegment Pricing and Adoption Trends
- 12.4.9 Leading Suppliers and Competition
- 12.4.10 Regional Demand and Opportunities
- 12.5 By Application - Market Size and Forecast, 2025-2035
- 12.5.1 Segment Definition and Scope
- 12.5.2 Historical Market Size, 2018-2025
- 12.5.3 Revenue Forecast, 2025-2035
- 12.5.4 Volume Forecast, 2025-2035
- 12.5.5 Base-Year Market Share, 2025
- 12.5.6 Segment CAGR and Growth Drivers
- 12.5.7 Subsegment Market Size and Forecast
- 12.5.7.1 Disease Diagnosis and Treatment
- 12.5.7.2 Drug Discovery and Clinical Development
- 12.5.7.3 Crop and Animal Improvement
- 12.5.7.4 Bioprocess and Material Optimization
- 12.5.8 Subsegment Pricing and Adoption Trends
- 12.5.9 Leading Suppliers and Competition
- 12.5.10 Regional Demand and Opportunities
- 12.6 By Technology - Market Size and Forecast, 2025-2035
- 12.6.1 Segment Definition and Scope
- 12.6.2 Historical Market Size, 2018-2025
- 12.6.3 Revenue Forecast, 2025-2035
- 12.6.4 Volume Forecast, 2025-2035
- 12.6.5 Base-Year Market Share, 2025
- 12.6.6 Segment CAGR and Growth Drivers
- 12.6.7 Subsegment Market Size and Forecast
- 12.6.7.1 Cell-Based Biomanufacturing
- 12.6.7.2 Molecular Assay Platforms
- 12.6.7.3 Genomic Sequencing
- 12.6.7.4 Computational Biology
- 12.6.8 Subsegment Pricing and Adoption Trends
- 12.6.9 Leading Suppliers and Competition
- 12.6.10 Regional Demand and Opportunities
- 12.7 Segment Growth Comparison
- 12.8 Segment Attractiveness and Priority Matrix
Chapter 13 Australia Biotechnology and Genomics End-Use and Application Market Outlook
- 13.1 End-Use Industry and Customer Demand Structure
- 13.2 Leading Applications and Customer Groups
- 13.3 End-Use Market Size, Share and Forecast
- 13.4 Major End-Use Industry Deep Dives
- 13.4.1 Customer Requirements and Use Cases
- 13.4.2 Demand and Replacement Cycles
- 13.4.3 Technical and Regulatory Considerations
- 13.4.4 Purchasing and Procurement Models
- 13.4.5 Leading Vendors and Distribution Channels
- 13.4.6 Forecast and Commercial Opportunities
- 13.5 Emerging Applications and Cross-Segment Demand
- 13.6 End-Use Industry Investment Priorities
Chapter 14 Australia Biotechnology and Genomics Geographic Market Outlook, 2025-2035
- 14.1 Domestic Market Distribution and Demand Clusters
- 14.2 State- or Province-Wise Market Size and Forecast, 2025-2035
- 14.3 City and Metropolitan Market Outlook
- 14.4 Industrial, Manufacturing and Commercial Clusters
- 14.5 Geographic Concentration of Key End Users
- 14.6 Local Pricing and Purchasing Differences
- 14.7 Domestic Production Facilities and Capacity Map
- 14.8 Local Infrastructure and Project Pipeline
- 14.9 State-Level Policy and Incentive Differences
- 14.10 Subnational Investment Hotspots and Opportunities
- 14.11 Distribution and Logistics Networks
- 14.12 Domestic Competitive Footprint
Chapter 15 Australia Biotechnology and Genomics Technology, Innovation and Sustainability Outlook
- 15.1 Technology Landscape and Maturity
- 15.2 Product, Process and Service Innovation
- 15.3 AI, Automation and Digital Tools in the Industry
- 15.4 Technology Adoption and Performance Benchmarking
- 15.5 Innovation Pipeline and R&D Investment
- 15.6 Patent and Intellectual Property Trends
- 15.7 Energy Efficiency and Resource Management
- 15.8 Sustainability, Recycling and Circularity
- 15.9 Technology Roadmap, 2025-2035
- 15.10 Risks of Obsolescence and Technology Substitution
Chapter 16 Australia Biotechnology and Genomics Market Key Strategic Imperatives
- 16.1 Growth and Market Entry Priorities
- 16.2 High-Return Products and Segments
- 16.3 Pricing, Profitability and Cost Optimization
- 16.4 Technology Investment and Product Differentiation
- 16.5 Supply Chain Localization and Resilience
- 16.6 Distribution and Customer Acquisition
- 16.7 Partnership, Acquisition and Capacity Strategy
- 16.8 Regional Expansion Priorities
- 16.9 Short-, Medium- and Long-Term Actions
Chapter 17 Competition Outlook
- 17.1 Industry Competition Characteristics
- 17.2 Market Structure and Concentration
- 17.3 Market Share and Competitive Positioning, 2025
- 17.4 Company-Wise Revenue and Product Benchmarking
- 17.5 Production and Service Capacity Benchmarking
- 17.6 Technology, Pricing and Differentiation
- 17.7 Regional Footprint and Distribution Strength
- 17.8 Mergers, Acquisitions and Strategic Alliances
- 17.9 New Entrants and Competitive Threats
- 17.10 Porter's Five Forces and Industry Attractiveness
- 17.11 Competitive Outlook, 2025-2035
Chapter 18 Company Profiles
- 18.1 Company Coverage and Selection Criteria
- 18.2 CSL Limited
- 18.2.1 Business Description
- 18.2.2 Company Ownership and Geographic Presence
- 18.2.3 Product and Service Portfolio
- 18.2.4 Manufacturing and Operating Footprint
- 18.2.5 Production Capacity and Expansion Plans
- 18.2.6 Financial Performance and Investment
- 18.2.7 Market Share and Competitive Position
- 18.2.8 Technology and Innovation Capabilities
- 18.2.9 Strategic Alliances or Partnerships
- 18.2.10 Recent Developments
- 18.2.11 Growth Strategy and Outlook
- 18.3 Sonic Healthcare
- 18.4 Telix Pharmaceuticals
- 18.5 Healius
- 18.6 Mesoblast
- 18.7 Clinuvel Pharmaceuticals
- 18.8 Nucleus Network
- 18.9 Genetic Signatures
- 18.10 Microba
- 18.11 Imugene
- 18.12 Other Relevant Market Participants
Note: Every listed company is profiled on the structure shown under the first company. The company list is preliminary and may change based on research findings, market developments, data availability and client requirements.
Chapter 19 Disclaimer
- 19.1 Research and Forecast Disclaimer
- 19.2 Data Source and Estimation Limitations
Note: The depth of individual sections depends on data availability for this market. Volume, capacity, trade and other unit-based metrics are included where applicable.