Asia-Pacific spatial proteomics moves toward cohort scale
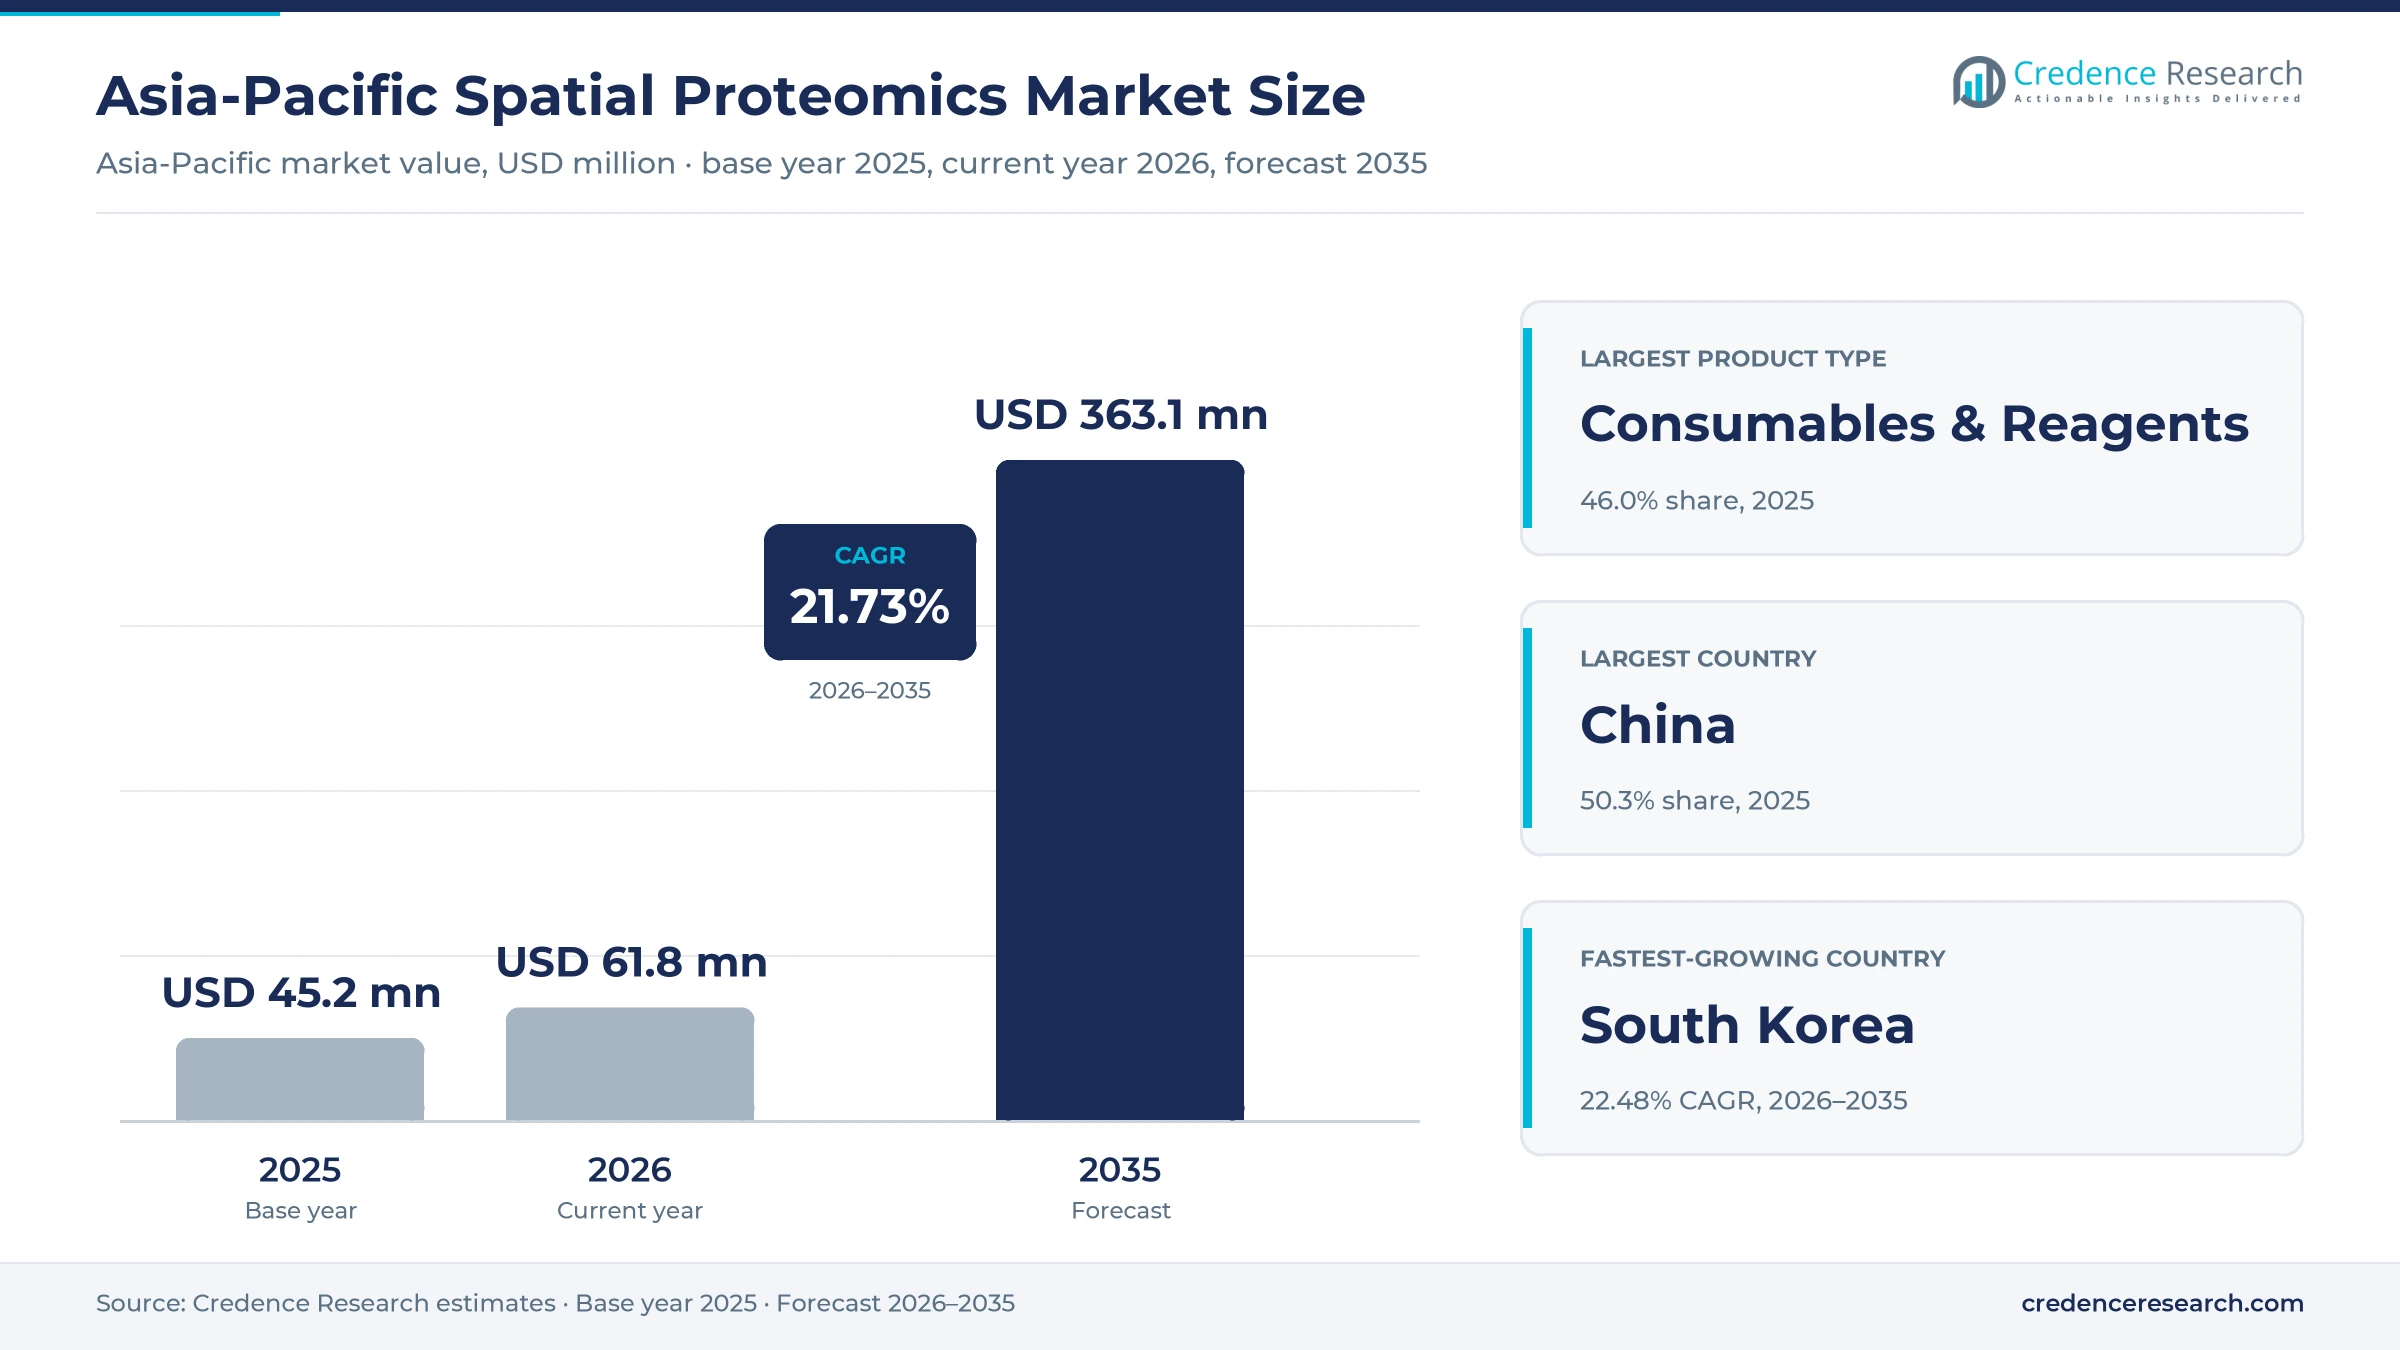
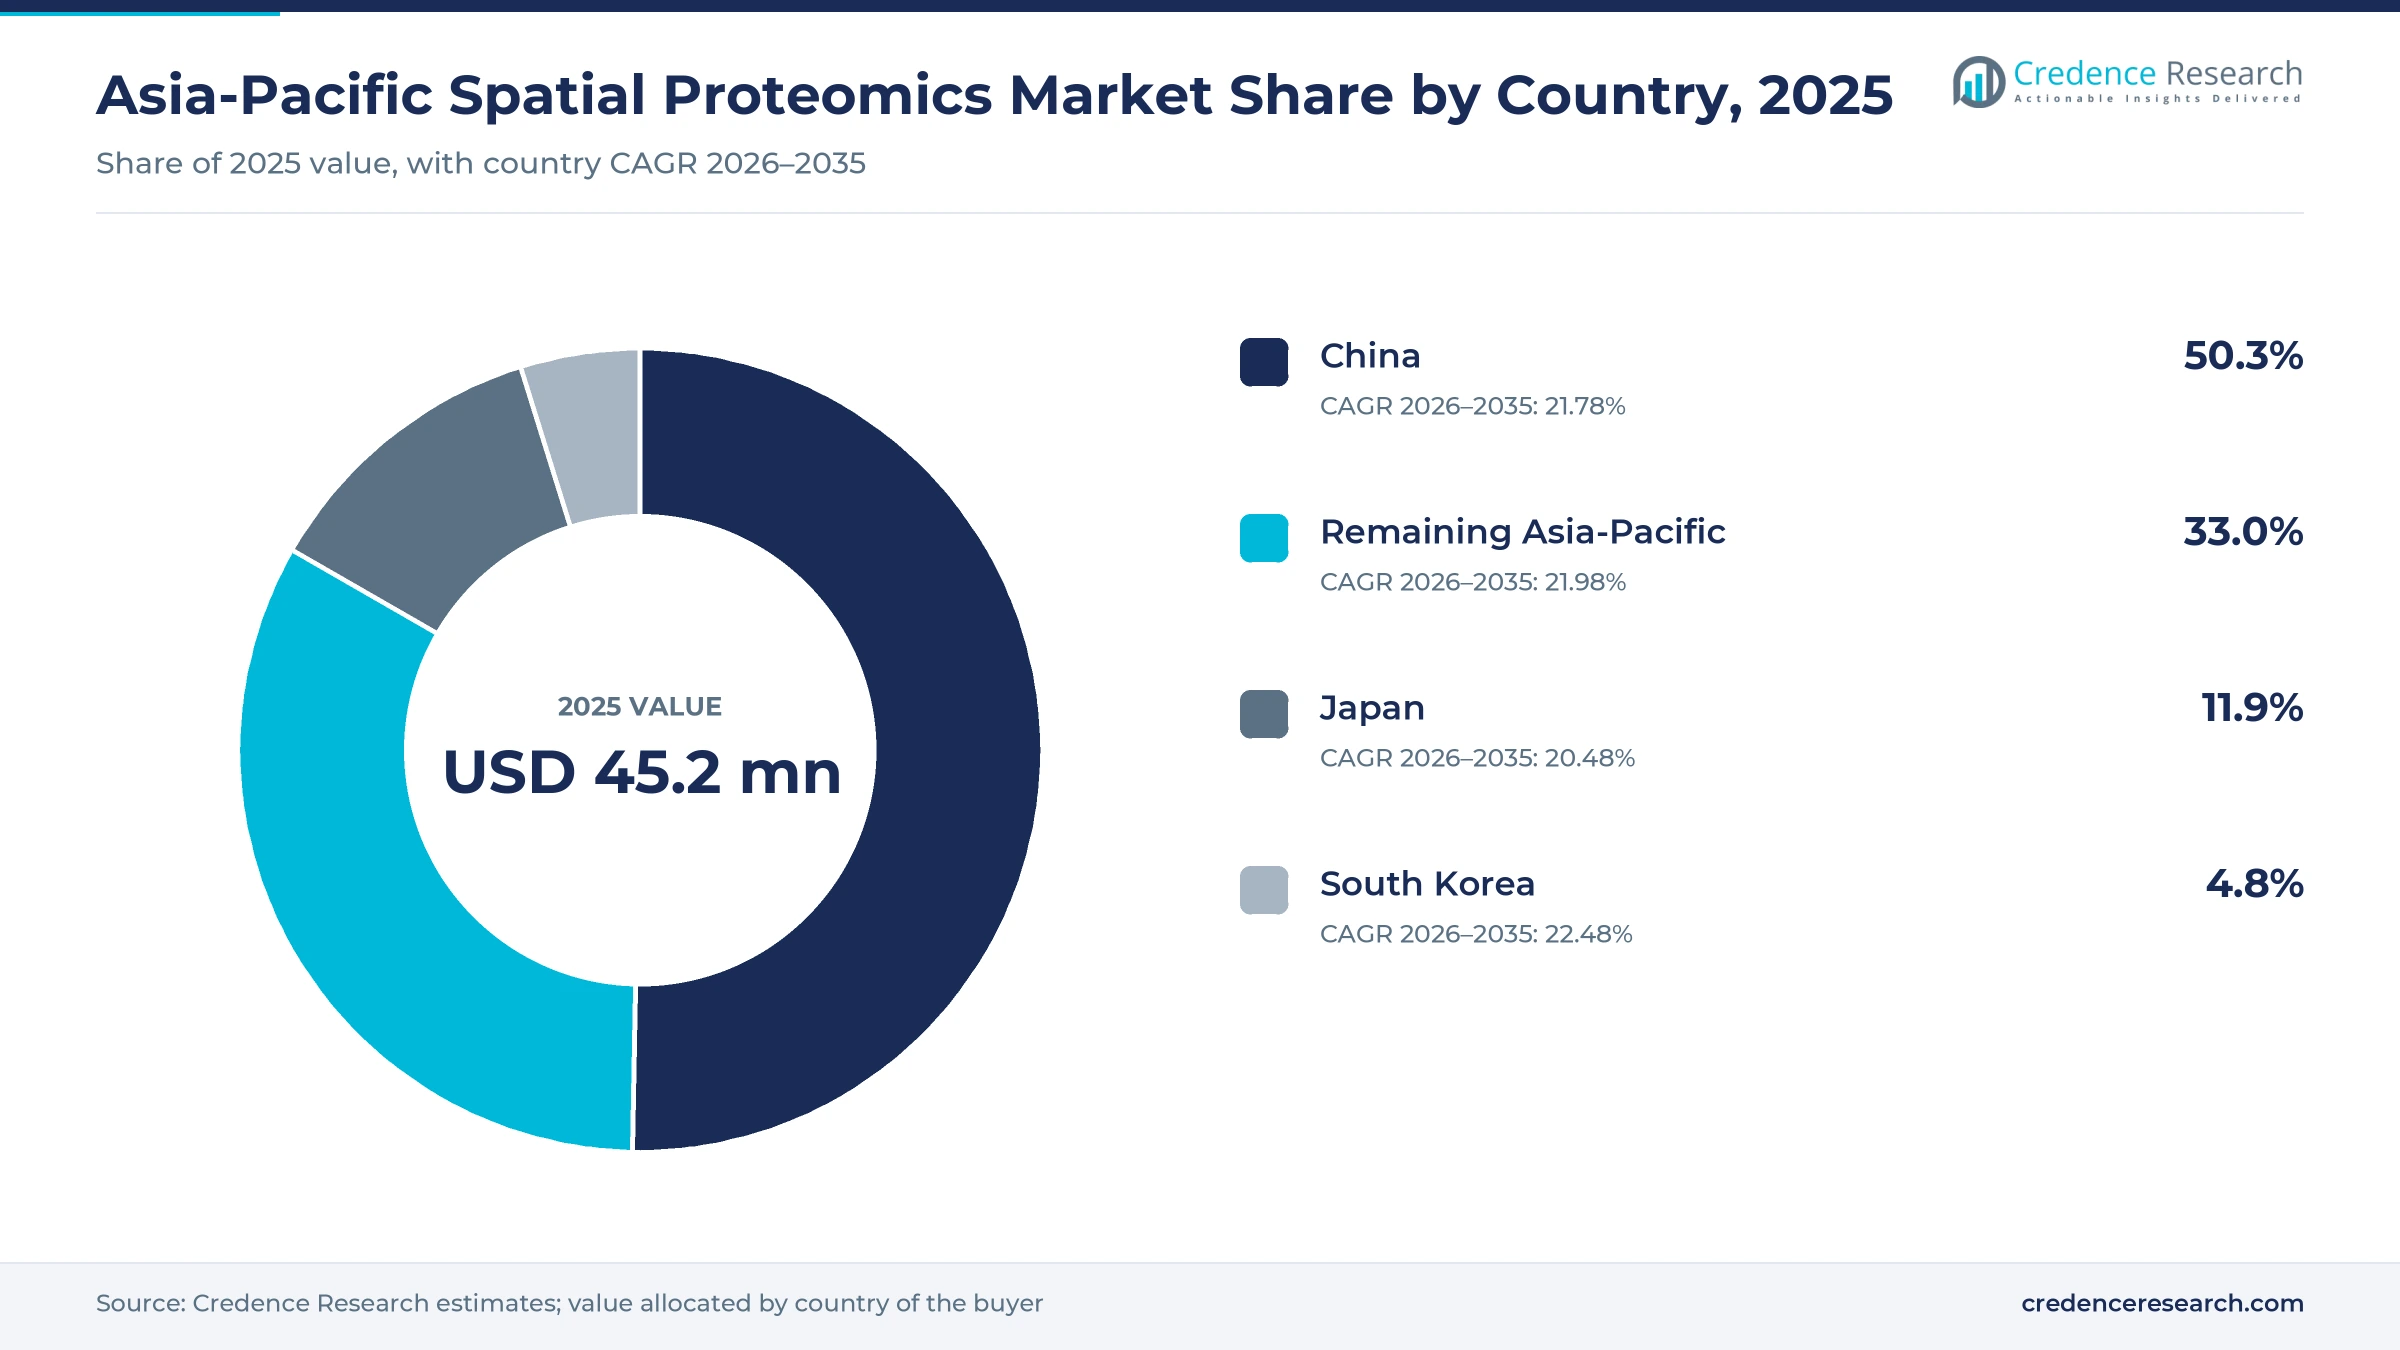
The Asia-Pacific spatial proteomics market was valued at USD 45.2 million in 2025 and is projected to increase from USD 61.8 million in 2026 to USD 363.1 million by 2035, registering a CAGR of 21.73% during 2026–2035. Demand comes from university core facilities, drug developers and contract laboratories that map proteins inside intact tissue, chiefly for tumor biology. China held the largest country share, 50.3% in 2025, supported by 283.46 billion yuan of national basic research spending that year. South Korea is the fastest-growing country at 22.48% a year, helped by a record 2026 government research budget. Supply also changed quickly, because Quanterix completed its purchase of Akoya Biosciences in July 2025 and Bruker introduced CellScape XR in February 2026 with a stated aim of more than doubling throughput. In China, a 20% price preference for domestic products in government procurement took effect on Jan. 1, 2026, which raises the stakes for imported platforms at public buyers across that market.
What does the Asia-Pacific spatial proteomics market measure?
The market counts instruments, antibody panels and reagents, analysis software and paid laboratory services used to locate and measure proteins within intact tissue sections. Buyers purchase through vendors or distributors, through leases and reagent commitments, or through fee-for-service studies at contract laboratories.
The estimate excludes bulk proteomics performed on homogenized samples, routine diagnostic immunohistochemistry and transcript-only spatial assays. The value chain runs from antibody and tag suppliers through platform makers and regional distributors to core facilities, which then return data to research teams and drug sponsors.
Asia-Pacific Spatial Proteomics Market Insights
- The market grows from USD 45.2 million in 2025 to USD 363.1 million by 2035, a 21.73% CAGR over 2026–2035, from a small research-tool base in the region.
- China held 50.3% of 2025 value, as national basic research spending rose 13.3% that year to 283.46 billion yuan, according to the National Bureau of Statistics.
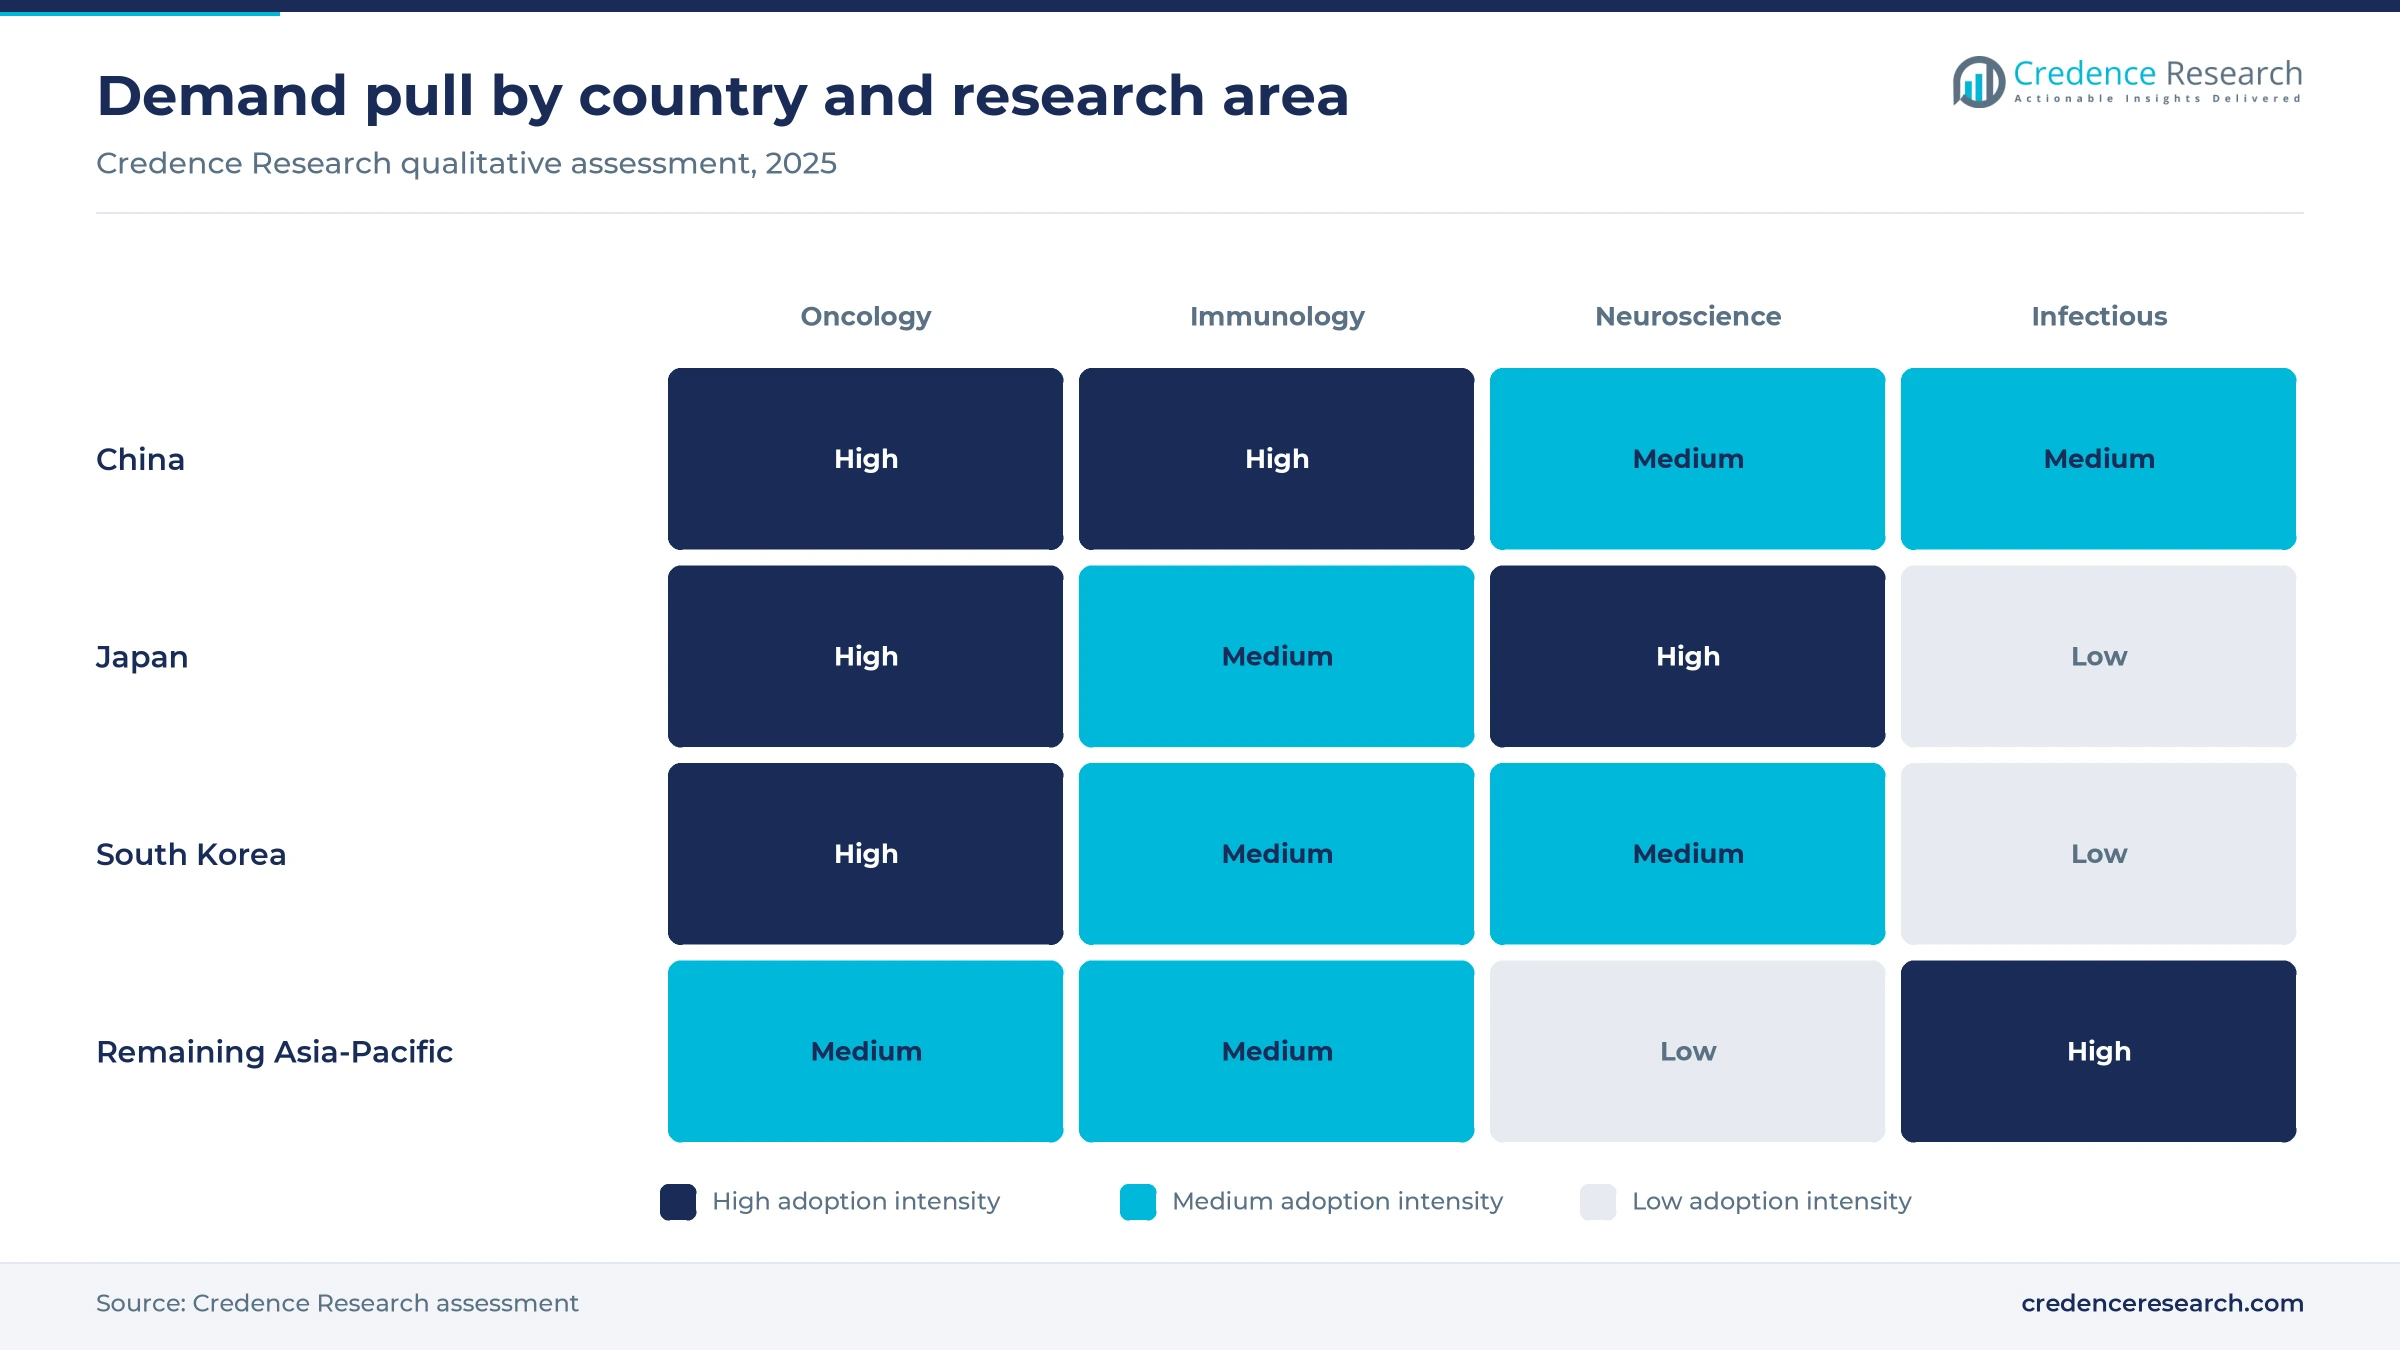
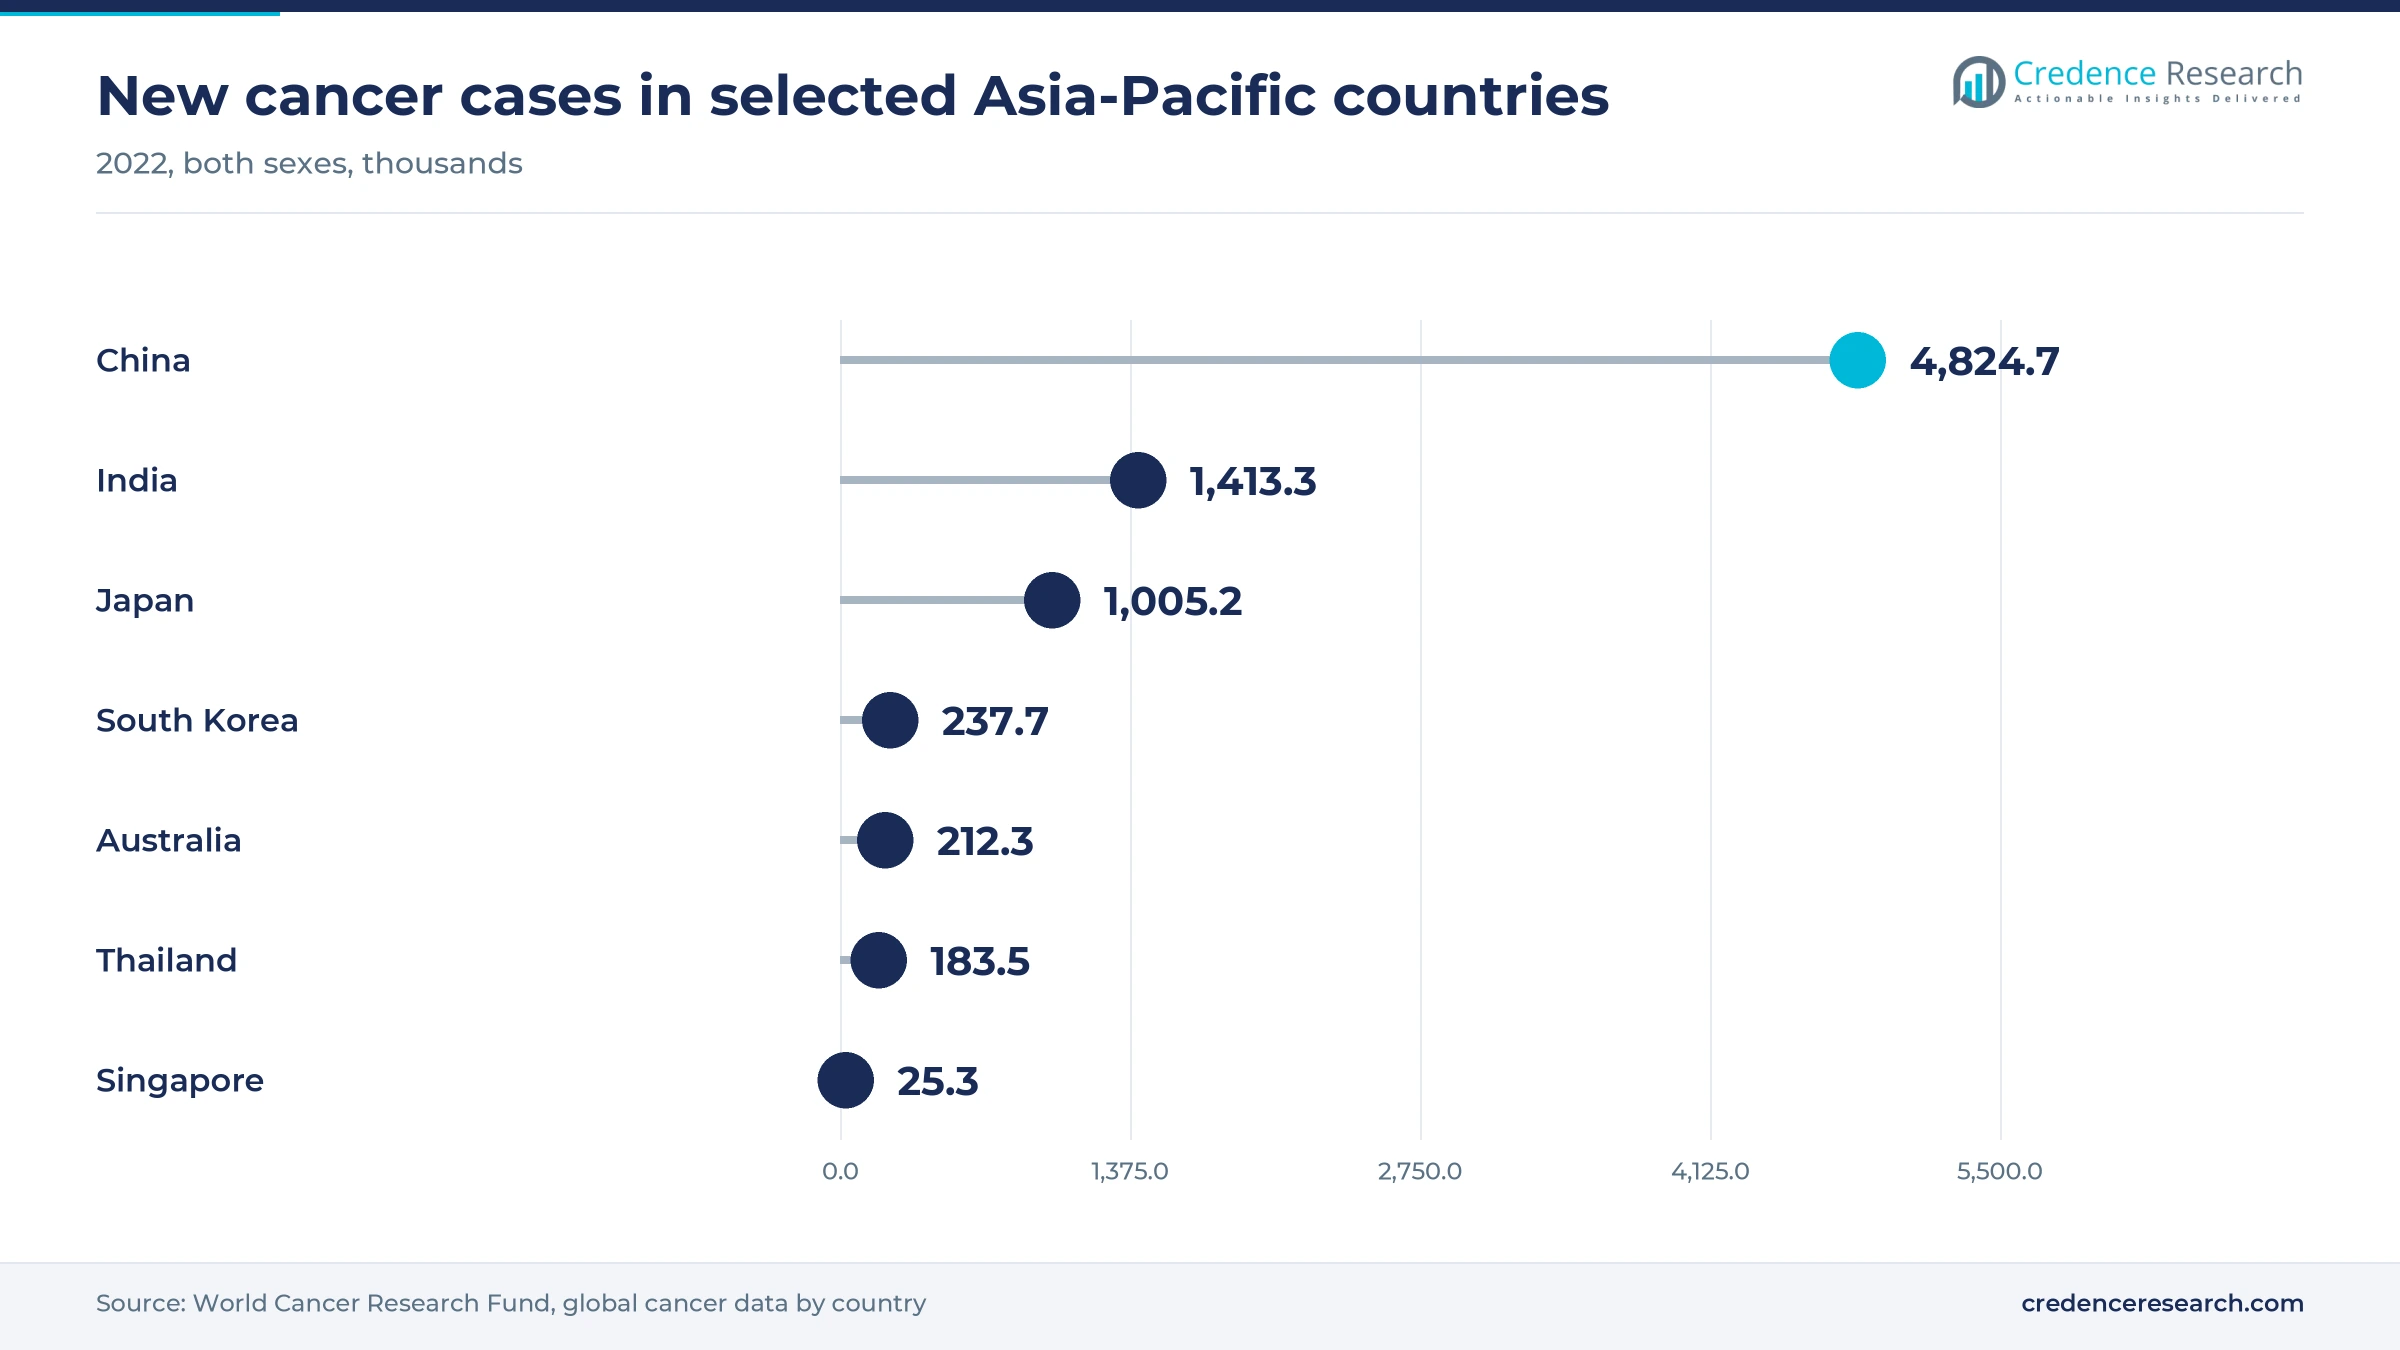
- Oncology & Tumour Microenvironment led applications with 58.0% in 2025, reflecting an estimated 4,824,700 new cancer cases in China during 2022 and heavy tumor biology study.
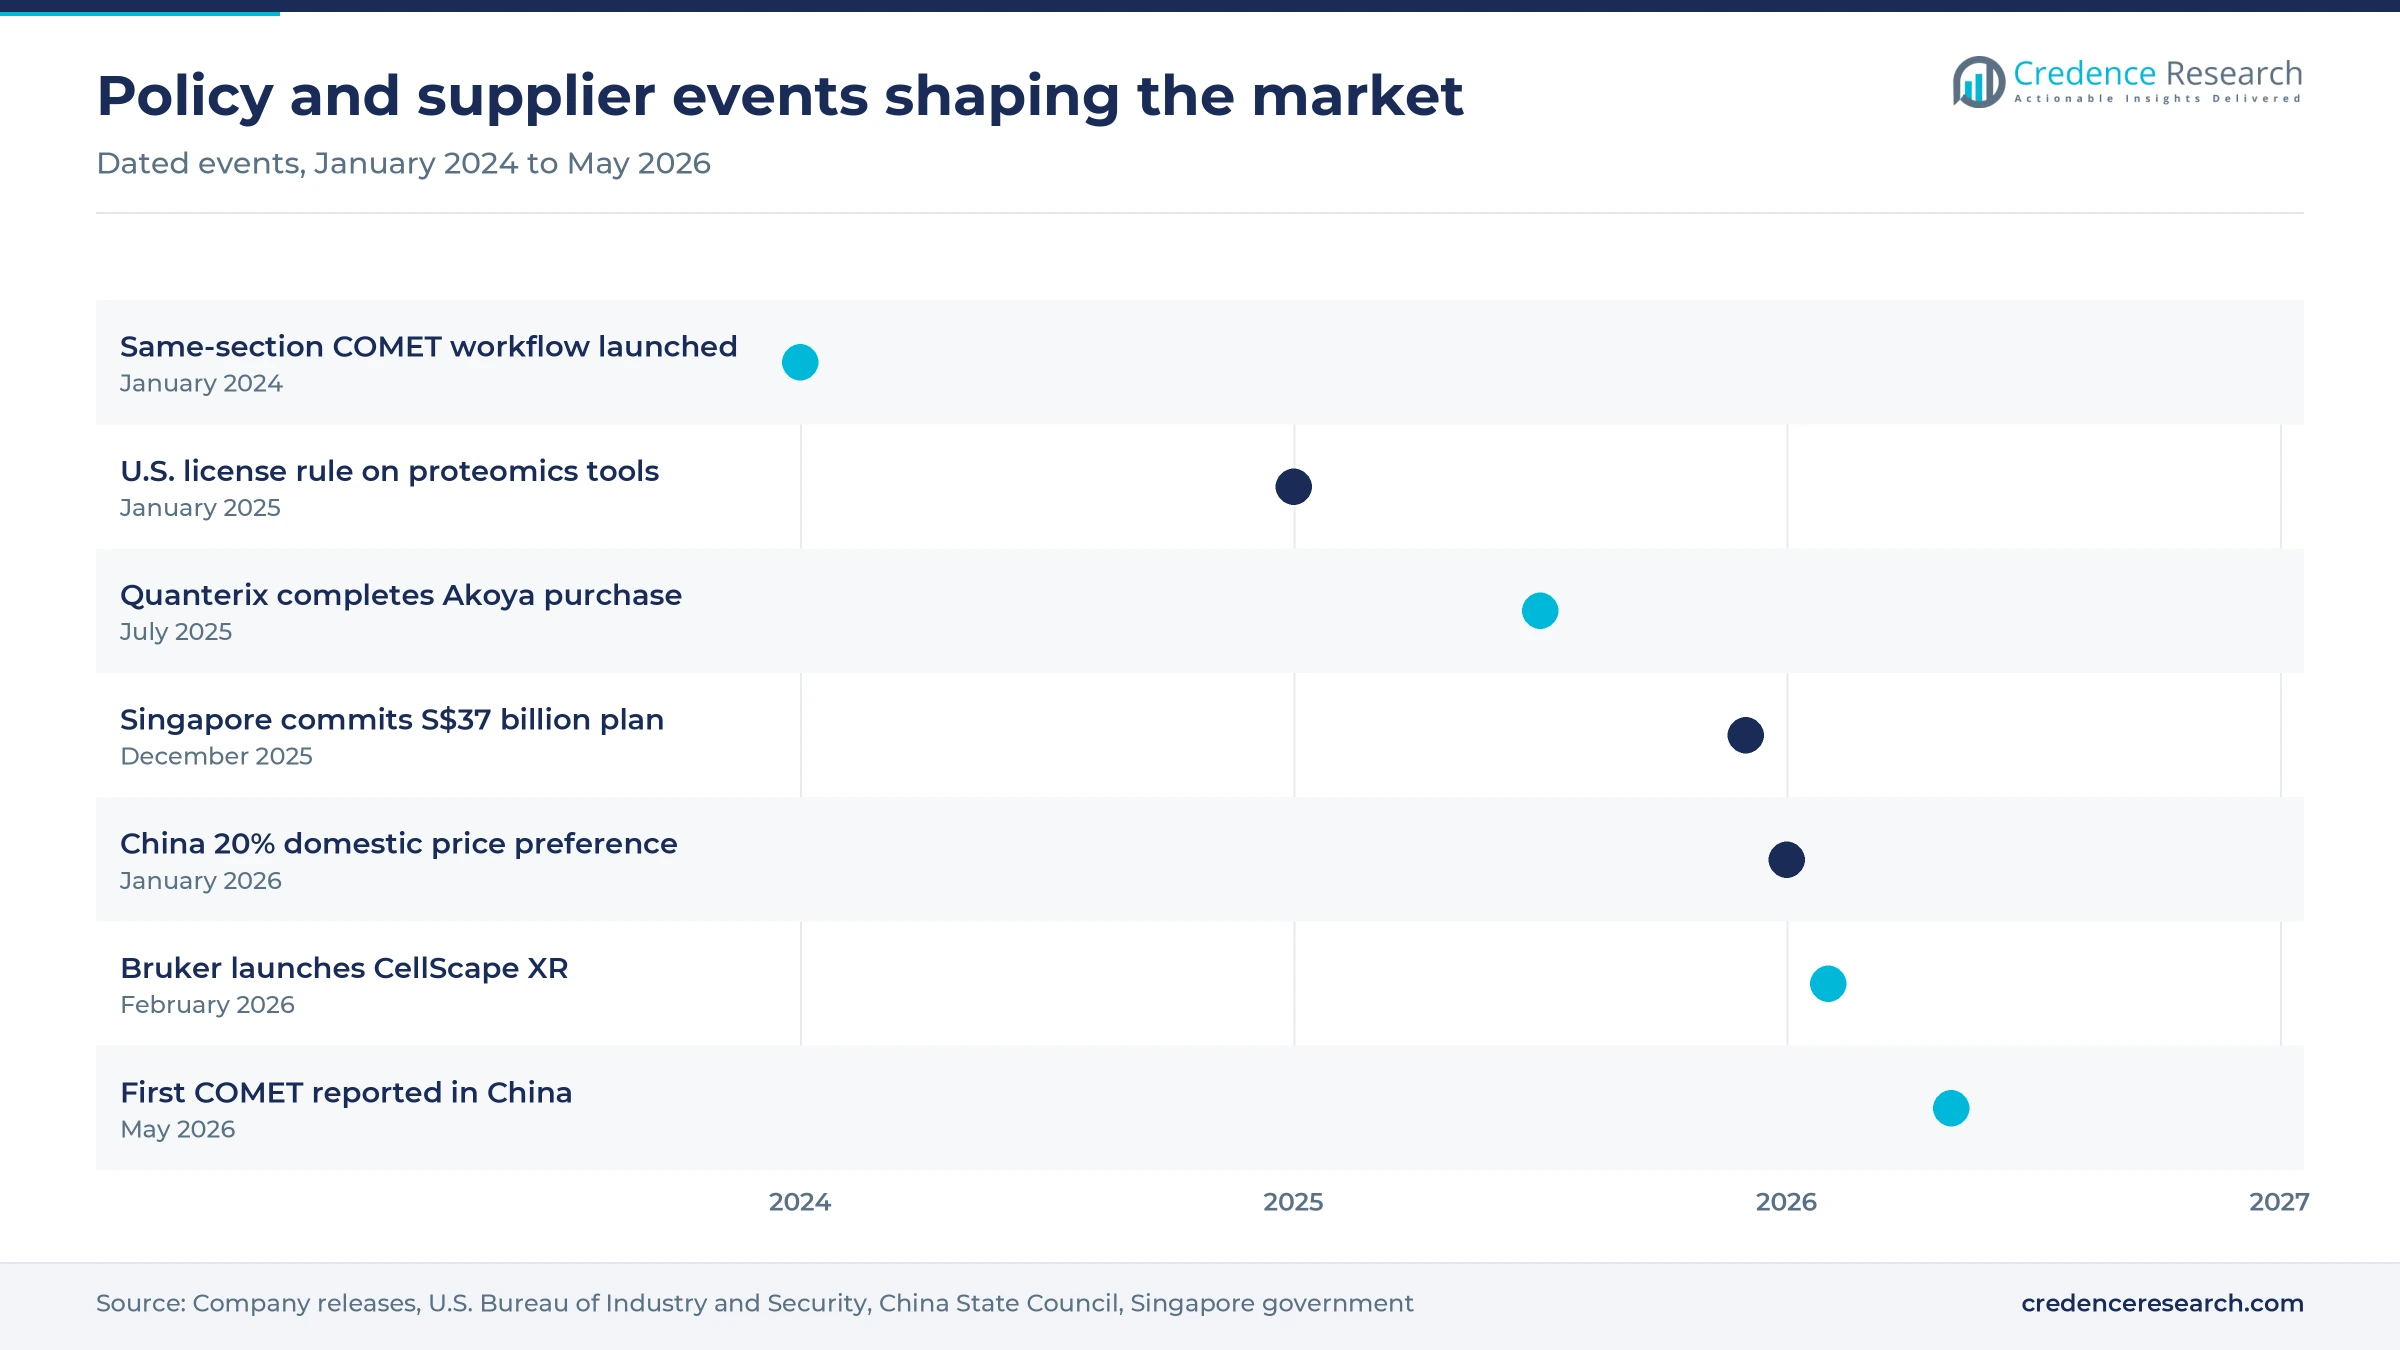
- Same-section RNA and protein workflows moved into commercial use after Bio-Techne brands launched one on COMET in January 2024, and Bruker later extended CosMx multiomic imaging.
- Quanterix bought Akoya in July 2025 and Standard BioTools sold SomaLogic in January 2026, so regional buyers now face a reshaped and more concentrated supplier list.
Consumables and Optical imaging hold the value core
Why do consumables out-earn the instruments that use them?
Based on product type, the market is categorized into Instruments, Consumables & Reagents, and Software & Services. Consumables & Reagents led with 46.0% of 2025 value because every imaging run draws on panels and kits, a recurring stream that Akoya tied to 1,330 installed instruments at Dec. 31, 2024, in its annual filing. Software & Services grows fastest at 23.27% a year as data handling becomes the bottleneck. Genetic Engineering & Biotechnology News reported in October 2025 that Nucleai launched a model that April to normalize high-plex imaging data, while Bruker added its PowerOMX analysis engine for CellScape.
Which readout suits which study in regional laboratories?
Based on technology, the market is categorized into Optical Multiplex Imaging, Mass-Based Spatial Analysis and Digital Spatial Protein Profiling. Optical Multiplex Imaging led with 57.0% of 2025 value because fluorescence platforms keep adding markers on standard tissue slides, with Leica Microsystems listing Cell DIVE at more than 60 biomarkers in June 2025 and Bio-Techne listing COMET at 40 markers per automated run. Digital Spatial Protein Profiling grows fastest at 22.75% a year as discovery panels widen, since Bruker said in February 2026 that its GeoMx Discovery Proteome Atlas covers more than 1,200 protein targets. Those platforms also overlap with multiplex biomarker imaging tools used in translational work.
Who pays for tissue studies, and who runs them?
Based on end user, the market is categorized into Academic & Research Institutes, Pharma & Biotech, CROs & Service Labs, and Hospitals & Clinical Pathology. Academic & Research Institutes led with 56.0% of 2025 value because public budgets pay for many core facilities, and China's National Bureau of Statistics counted 340.73 billion yuan of higher education R&D in 2025, up 11.1%. CROs & Service Labs grows fastest at 23.37% a year as sponsors outsource tissue work. Bio-Techne said on its May 2026 earnings call that Chinese biopharma and CRO customers were lifting demand around antibody drug conjugates, cell therapy and autoimmune disorders.
Why does tumor work outweigh other disease research?
Based on application, the market is categorized into Oncology & Tumour Microenvironment, Immunology & Inflammatory Disease, Neuroscience and Infectious & Other Disease Research. Oncology & Tumour Microenvironment led with 58.0% of 2025 value because case volume supplies the tissue, and the Journal of the National Cancer Center estimated 4,824,700 new cancer cases in China during 2022. Neuroscience grows fastest at 22.82% a year as aging raises research priority. A research team at Japan's health ministry projected dementia cases rising from 4.71 million in 2025 to 5.23 million in 2030, which supports brain tissue studies across Japanese institutes.
| Segment Group | Leading Sub-segment | Share, 2025 | Fastest-growing Sub-segment | CAGR, 2026–2035 |
|---|---|---|---|---|
| By Product Type | Consumables & Reagents | 46.0% | Software & Services | 23.27% |
| By Technology | Optical Multiplex Imaging | 57.0% | Digital Spatial Protein Profiling | 22.75% |
| By End User | Academic & Research Institutes | 56.0% | CROs & Service Labs | 23.37% |
| By Application | Oncology & Tumour Microenvironment | 58.0% | Neuroscience | 22.82% |
Request a Free Sample
Fill in your details and we'll send you a free sample report.
- Sample data tables & charts
- Research methodology
Cancer burden and research budgets set the demand base
Oncology research intensity keeps tissue studies funded
Cancer burden sets the size of the sample pool and the urgency of tumor microenvironment work across the region. The Journal of the National Cancer Center estimated 4,824,700 new cases and 2,574,200 deaths in China during 2022, with lung, colorectal, thyroid, liver and stomach cancers making up 57.42% of new cases. World Cancer Research Fund data for the same year show 1,005,157 new cases in Japan, while South Korea's national registry counted 288,613 in 2023. Drug pipelines add paying demand, because DIA Global Forum counted 120 new drugs cleared by China's regulator in 2025, with oncology the most active area. In turn, Oncology & Tumour Microenvironment held 58.0% of 2025 value.
Higher usable imaging throughput makes cohort studies practical
Usable throughput now matters more than peak marker count, because core laboratories need large patient cohorts to finish on schedule. Standard BioTools said on April 8, 2024, that Hyperion XTi loads up to 40 slides per automated run, and its chief executive cited more than 40 protein markers on 40 slides in 24 hours. Bruker said in its AGBT release of Feb. 23, 2026 that CellScape XR will more than double throughput on its proteomics line. Bio-Techne describes COMET as reading 40 markers per run with walk-away automation, and Astellas has placed Orion and CosMx systems in its TME iLab in Kashiwa, Japan. These are vendor claims rather than independent benchmarks, yet they shape shortlists among cohort-scale buyers.
Spatial RNA and protein workflow integration saves scarce tissue
Buyers increasingly want protein and transcript readouts from one section, since scarce tumor tissue cannot be spent on separate assays. Lunaphore and Advanced Cell Diagnostics, both Bio-Techne brands, launched a fully automated same-section RNA and protein workflow on COMET on Jan. 25, 2024. Bruker said in February 2026 that CosMx reads the whole transcriptome plus 64 or more proteins from a single section, and Genetic Engineering & Biotechnology News reported that 10x Genomics launched Xenium Protein in August 2025. Bio-Techne and Leica Biosystems also expanded their collaboration on April 2, 2025, to automate the RNAscope Multiomic LS assay on BOND RX stainers. This matters to hospital-linked biobanks such as the Queensland Spatial Biology Centre in Brisbane.
Public basic research budgets widen the academic buyer base
Public research spending gives the region a buyer base that is less tied to drug-development cycles. China's National Bureau of Statistics reported 2025 R&D spending of 3,928.82 billion yuan, up 8.2%, with basic research at 283.46 billion yuan, up 13.3%, and a 7.21% share of the total. South Korea's science ministry set a record 35.3 trillion won research budget for 2026, up 19.3%, according to Asia Business Daily. Singapore committed S$37 billion over five years in December 2025, 32% more than its previous plan, with precision health among its funded domains. Together these programs underpin demand from university core facilities and public institutes, which remain the largest buyer group in the region.
Consolidation and AI reshape where buyers spend
Vendor consolidation shifts buying toward broader protein portfolios
Supplier consolidation is shifting the market from single-platform vendors to broader portfolios, which changes who regional buyers negotiate with. Quanterix completed its purchase of Akoya Biosciences on July 8, 2025, paying about 7.8 million shares and about $20 million in cash to join blood and tissue biomarker tools. Standard BioTools closed the sale of SomaLogic to Illumina on Jan. 30, 2026, and said it would use its cash of about $550 million for disciplined acquisitions. In May 2025, Bruker agreed to pay 10x Genomics $68 million plus royalties to settle a patent suit, according to Genetic Engineering & Biotechnology News. Distributors and core laboratories should therefore expect more bundled offers and fewer independent platform makers.
Rise of AI analysis moves value into data pipelines
Analysis software is rising in importance because high-plex images now outrun the staff available to interpret them. Genetic Engineering & Biotechnology News reported that Nucleai launched a deep learning model in April 2025 to automate normalization of high-plex imaging data. Leica Microsystems described its Aivia software in June 2025 as handling cell segmentation, phenotype identification and spatial relationship analysis in 2D and 3D. Bruker's February 2026 release added AI-ready exports and 3D cell segmentation to AtoMx. The π-HuB consortium, funded in part by China's science ministry, published its plan to pair proteomics with AI in Nature in December 2024. As a result, Software & Services reach 23.27% a year over the forecast.
Fee-for-service access opens a route to smaller hospitals
Fee-for-service access offers an opening for hospitals and young biotechs that cannot justify owning a platform or staffing it. JMIR Medical Informatics reported in 2026 that 46.3% of China's secondary hospitals have just one pathologist, so dedicated in-house spatial teams are unrealistic at that level. Macrogen in South Korea added GeoMx and CosMx to its contract menu through a NanoString partnership announced on Sept. 7, 2023. Syncell, based in Taipei, named service partner OMAPiX on April 24, 2025, along with distributors for Japan, South Korea and China. Laboratories that package panels, scanning and digital pathology reporting into one price can reach these buyers, and CROs & Service Labs already show the fastest growth at 23.37% a year.
Australia and Southeast Asia offer an opening beyond North Asia
Markets outside North Asia offer an opening that is less exposed to trade friction between Washington and Beijing. Remaining Asia-Pacific held 33.0% of 2025 value and grows at 21.98% a year. Akoya said on Jan. 18, 2024, that the new Queensland Spatial Biology Centre in Brisbane, led by the Wesley Research Institute, uses PhenoCycler-Fusion with access to a curated tissue biobank. World Cancer Research Fund data put Australia's 2022 age-standardized cancer rate at 462.5 per 100,000, above Japan at 267.1 and China at 201.6. Singapore's Economic Development Board also listed precision health and translational research under its S$37 billion plan, which gives vendors a funded regional reference site.
Export rules and pathology gaps slow regional adoption
Export licensing adds risk to proteomics instrument sales
U.S. export rules add licensing risk to proteomics instruments sold into parts of the region. The Bureau of Industry and Security imposed new license requirements on Jan. 15, 2025, covering high-parameter flow cytometers and certain mass spectrometry systems designed for proteomics. The U.S.-China Business Council warned that such rules could speed domestic substitution, and 43% of its surveyed members reported effects from export controls. Suppliers of mass-based workflows therefore need early classification reviews and local service stock.
Procurement preference and tariffs squeeze imported platforms
China's procurement and trade measures raise the effective price of imported systems at public buyers. The State Council's General Office said on Sept. 30, 2025, that a 20% price preference for domestic products would apply from Jan. 1, 2026. The South China Morning Post reported on April 14, 2025, that Beijing had raised additional tariffs on U.S. goods to 125%, with laboratory supplies among the goods affected. Foreign vendors therefore weigh local assembly, while universities may delay replacement purchases.
Scarce pathologists limit hospital use of high-plex data
Hospital adoption depends on staff who can read complex tissue data, and that staff is thinly spread. JMIR Medical Informatics cited a national density of only 0.55 pathologists per 100 hospital beds in China, based on the 2019 China Pathology Quality Report. The same paper said 82% of senior pathologists work in tertiary hospitals, which leaves smaller sites without expertise. Vendors can respond with remote review and automated scoring, although validation work will take several years to complete.
Research-use labeling delays any clinical payoff
Most platforms remain research tools, which limits hospital budgets and defers reimbursement discussions in every country here. Bruker's CellScape XR release of Feb. 25, 2026, carries a statement that the system is for research use only and not for diagnostic procedures. That same release cites University Hospital Schleswig-Holstein analyzing more than 1,000 clinically annotated samples, with about 3,000 planned, which shows the scale evidence requires. Regional hospitals will likely wait for comparable local cohorts before committing routine budgets.
China anchors demand while South Korea moves fastest
| Country | Value, 2025 (USD million) | Share, 2025 | CAGR, 2026–2035 |
|---|---|---|---|
| China | 22.7 | 50.3% | 21.78% |
| Remaining Asia-Pacific | 14.9 | 33.0% | 21.98% |
| Japan | 5.4 | 11.9% | 20.48% |
| South Korea | 2.2 | 4.8% | 22.48% |
China combines the largest budgets with new supplier barriers
China held 50.3% of 2025 value and grows at 21.78% a year, because basic research and drug development expanded together. The National Bureau of Statistics named Guangdong, Jiangsu, Beijing, Zhejiang, Shandong and Shanghai as provinces above 200 billion yuan of R&D in 2025, which shows where large academic buyers cluster. Syncell said in April 2025 that a distributor had installed its instrument at the National Center for Protein Sciences in Beijing, and Bio-Techne reported its first COMET in China in May 2026.
Japan pairs drug discovery sites with a slower expansion
Japan held 11.9% of 2025 value and grows at 20.48% a year, the slowest pace here, because its academic base is already established. World Cancer Research Fund data show 1,005,157 new cancer cases there in 2022, which keeps tumor studies active. Astellas runs its TME iLab in a 334.18 square meter space at Kashiwa-no-ha, equipped with CosMx, Xenium and Orion systems. Syncell also appointed SCRUM as a Japanese distributor in April 2025, while Leica Microsystems markets Cell DIVE through a Japanese-language product site.
South Korea grows fastest from a small base
South Korea held 4.8% of 2025 value and grows at 22.48% a year, the fastest pace among these markets. The Ministry of Science and ICT raised the 2026 research budget 19.3% to a record 35.3 trillion won, according to Asia Business Daily. The national registry counted 288,613 new cancer cases in 2023, up 2.5% from the prior year. Macrogen supplies contract access to GeoMx and CosMx, while Syncell appointed DaonBS as its Korean distributor in April 2025.
Remaining Asia-Pacific spreads demand across research hubs
Remaining Asia-Pacific held 33.0% of 2025 value and grows at 21.98% a year, drawing on Australia, Singapore, India and Southeast Asia. Children's Medical Research Institute in Sydney takes part in the π-HuB consortium, and Brisbane hosts the Queensland Spatial Biology Centre. Business Standard reported that the World Health Organization placed 34% of 2024 tuberculosis cases in South-East Asia and 27% in the Western Pacific, which frames infectious disease research. India alone carried 25% of those global cases, according to that same report.
Dated vendor moves changed the regional supply picture
| Development | Status and market relevance |
|---|---|
| In January 2024, the Queensland Spatial Biology Centre in Brisbane adopted PhenoCycler-Fusion as its core platform, according to Akoya Biosciences. | Operating; a hospital-linked reference site for Australia |
| In April 2025, Syncell named distributors for Japan, South Korea and China along with service partner OMAPiX. | Active; widens subcellular proteomics access in North Asia |
| In July 2025, Quanterix completed its purchase of Akoya Biosciences for shares and about $20 million in cash. | Closed; PhenoImager and PhenoCycler lines now sit with Quanterix |
| In February 2026, Bruker launched CellScape XR with a stated aim of more than doubling throughput. | Launched; research use only |
| In May 2026, Bio-Techne reported the first COMET installation in China on its earnings call. | Installed; opens a new reference point for the platform in China |
Throughput and same-section workflows define platforms
- Cyclic immunofluorescence images tissue over iterative rounds, and Cell DIVE and COMET illustrate this approach with stated capacities of more than 60 and 40 markers.
- Imaging mass cytometry captures all markers in a single scan, and Standard BioTools sells this method on Hyperion XTi with a 40-slide loader.
- Digital profiling profiles a very wide protein panel from tissue sections, and GeoMx Discovery Proteome Atlas covers more than 1,200 targets according to Bruker.
- Same-section multiomics combines RNA and protein readouts on one slide, which conserves scarce samples and links transcript signals to protein location on COMET and CosMx.
Need a Custom Version of This Report?
Tailor the scope, geography, or segments to your exact requirements.
- Custom geography or segment scope
- Direct access to our analyst team
Platform breadth and service reach decide competition
Competition turns on three things, namely marker breadth, slide throughput and the local service that keeps a core facility running. Bruker holds the widest proteomics line in this review, spanning GeoMx, CellScape and CosMx, and its systems appear at Astellas in Japan and at Macrogen in South Korea. Quanterix inherited an installed base through Akoya that its annual filing placed across Asia-Pacific among 1,330 instruments worldwide, along with the Brisbane reference site. Bio-Techne is earlier in the region, having reported its first COMET in China only in May 2026, although it says Chinese biopharma and contract customers are active. Leica Microsystems sells Cell DIVE through Japanese and Korean product sites, and its laser microdissection line adds a route into omics data collection. Standard BioTools narrowed its portfolio after selling SomaLogic to Illumina in January 2026. Smaller entrants such as Syncell rely on distributors, and domestic substitution pressure in China remains the main competitive unknown.
Companies profiled and their roles in this market
| Company | Type | Role in the market |
|---|---|---|
| Bruker | Platform maker | GeoMx, CellScape XR and CosMx; systems at Astellas in Japan and Macrogen in South Korea |
| Quanterix | Platform maker | Owner of Akoya PhenoCycler and PhenoImager lines; Brisbane reference site |
| Bio-Techne | Platform and reagent supplier | COMET and RNAscope; first COMET in China reported May 2026 |
| Leica Microsystems | Imaging system maker | Cell DIVE and Aivia software, marketed through Japanese and Korean sites |
| Syncell | Subcellular proteomics entrant | Taipei-based; distributors in Japan, South Korea and China |
Service access looks like the clearest regional bet
Credence Research's view is that the regional market is moving from pilot studies toward cohort work, and access will matter as much as instrument specification. China's budgets are large, yet the domestic procurement preference and tariffs make the imported route harder at public buyers. Vendors should therefore treat contract laboratories as a channel rather than a rival, since Macrogen and similar providers reach clients that will never buy a system. South Korea and Australia look attractive as reference sites for regional vendors. The most assumption-heavy estimate here is the end-user split, because no public source reports it.
How the Credence Research model frames this estimate
The report uses 2025 as the base year and forecasts to 2035 through the Credence Research market model. Segment and country splits are Credence Research estimates, informed by national statistics, company filings and releases, regulatory notices, peer-reviewed papers and named trade publications opened during preparation. No interviews or surveys were conducted for this edition of the report. Vendor throughput and marker figures are stated as vendor claims. Company figures exclude revenue because few suppliers disclose spatial proteomics sales separately for this region.
Cohort-scale studies should carry growth through 2035
The market is projected to reach USD 363.1 million by 2035, growing at 21.73% from 2026, and the path depends on studies getting larger rather than laboratories simply getting more instruments. Reagent demand should follow cohort size, while analysis software gains from the staffing limits already visible in hospital pathology. Export licensing and domestic preference will decide how much of China's spending reaches imported platforms, and local suppliers could take a larger part over time. Clinical use remains the main upside beyond this forecast, because current leading platforms still carry research-use-only labels.
Frequently Asked Questions
How big is the Asia-Pacific spatial proteomics market?
Which country leads the regional market?
Which country grows fastest through 2035?
Which product type holds the largest share?
Why does oncology dominate applications?
What changed among suppliers in the last two years?
What is the main risk for imported platforms in China?
Are these platforms used for clinical diagnosis?
Table of Content
Chapter 1 Market Segmentation
- 1.1 Segmentation Framework
- 1.1.1 Product and Service Classification
- 1.1.2 Application and End-Use Classification
- 1.1.3 Technology and Solution Classification
- 1.1.4 Customer and Distribution Channel Classification
- 1.1.5 Geographic Segmentation
- 1.1.6 Market Segment Definitions and Boundaries
- 1.2 By Product Type
- 1.2.1 Instruments
- 1.2.2 Consumables & Reagents
- 1.2.3 Software & Services
- 1.3 By Technology
- 1.3.1 Optical Multiplex Imaging
- 1.3.2 Mass-Based Spatial Analysis
- 1.3.3 Digital Spatial Protein Profiling
- 1.4 By End User
- 1.4.1 Academic & Research Institutes
- 1.4.2 Pharma & Biotech
- 1.4.3 CROs & Service Labs
- 1.4.4 Hospitals & Clinical Pathology
- 1.5 By Application
- 1.5.1 Oncology & Tumour Microenvironment
- 1.5.2 Immunology & Inflammatory Disease
- 1.5.3 Neuroscience
- 1.5.4 Infectious & Other Disease Research
- 1.6 By Country
- 1.6.1 China
- 1.6.2 Japan
- 1.6.3 South Korea
- 1.6.4 Remaining Asia-Pacific
Chapter 2 Introduction
- 2.1 Report Objectives and Scope
- 2.2 Product Definition and Industry Terminology
- 2.3 Market Inclusions and Exclusions
- 2.4 Research Process
- 2.4.1 Primary Research and Expert Interviews
- 2.4.2 Secondary Research and Source Review
- 2.4.3 Top-Down and Bottom-Up Estimation
- 2.4.4 Data Triangulation and Verification
- 2.5 Market Size Measurement Basis
- 2.5.1 2025: USD 45.2 million → 2035: USD 363.1 million
- 2.6 Historical and Forecast Reference Periods
- 2.6.1 Historical Period: 2018-2025
- 2.6.2 Base Year: 2025
- 2.6.3 Forecast Period: 2025-2035
- 2.7 Research Assumptions and Limitations
Chapter 3 Executive Summary
- 3.1 Market Snapshot and Key Findings
- 3.2 Base-Year Market Size, 2025
- 3.3 Forecast Market Size, 2035
- 3.4 Revenue and Volume Growth Outlook
- 3.5 Key Demand and Supply Indicators
- 3.6 Leading Market Segments
- 3.7 Fastest-Growing Market Opportunities
- 3.8 Regional Performance Highlights
- 3.9 Technology and Industry Transformation
- 3.10 Competitive Landscape Summary
- 3.11 Analyst View and Strategic Implications
Chapter 4 Asia-Pacific Spatial Proteomics Market Trends and Developments
- 4.1 Historical Industry Development, 2018-2025
- 4.2 Recent Market Trends and Developments
- 4.3 Demand and Customer Behavior Trends
- 4.4 Technology and Product Innovation
- 4.5 Artificial Intelligence, Automation and Digitalization
- 4.6 Local Manufacturing and Supply Chain Realignment
- 4.7 Industry Partnerships, Mergers and Acquisitions
- 4.8 Sustainability and Circular Economy Developments
- 4.9 Government and Private Sector Investment Trends
- 4.10 Emerging Business Models and Commercialization
- 4.11 Industry Developments and Announcements
Chapter 5 Asia-Pacific Spatial Proteomics Market Production, Supply and Demand Analysis
- 5.1 Demand Trend and Consumption Analysis, 2018-2025
- 5.2 Demand Forecast, 2025-2035
- 5.3 Production and Output Trend, 2018-2025
- 5.4 Production and Output Forecast, 2025-2035
- 5.5 Installed Capacity and Capacity Utilization
- 5.6 Company-Wise Production Plants and Statistics
- 5.6.1 Installed Production Capacity
- 5.6.2 Actual Production
- 5.6.3 Planned Capacity and Expansion Targets
- 5.7 Supply Chain Structure and Procurement Trends
- 5.8 Supply-Demand Gap and Bottlenecks
- 5.9 Import Dependence and Sourcing Structure
- 5.10 Contract Manufacturing and Outsourcing
- 5.11 Regional Supply and Demand Concentration
Chapter 6 Asia-Pacific Spatial Proteomics Market Pricing Analysis
- 6.1 Pricing Structure and Measurement
- 6.2 Historical Pricing Trends, 2018-2025
- 6.3 Pricing Outlook, 2025-2035
- 6.4 Average Selling Price and Unit Economics
- 6.5 Pricing by Product and Market Segment
- 6.6 Geographic Pricing Differences
- 6.7 Key Input, Energy, Labor and Logistics Costs
- 6.8 Contract Pricing and Purchasing Models
- 6.9 Pricing Sensitivity and Competitive Positioning
- 6.10 Price, Margin and Profitability Implications
Chapter 7 Asia-Pacific Spatial Proteomics Market Dynamics
- 7.1 Market Growth Drivers
- 7.1.1 Demand-Side Drivers
- 7.1.2 Technology and Innovation Drivers
- 7.1.3 Infrastructure and Investment Drivers
- 7.1.4 Regulatory and Policy Drivers
- 7.2 Market Restraints
- 7.2.1 Cost and Affordability Constraints
- 7.2.2 Technology and Adoption Barriers
- 7.2.3 Supply Chain and Operational Constraints
- 7.3 Market Challenges
- 7.3.1 Competitive Pressure and Margin Erosion
- 7.3.2 Skills, Infrastructure and Implementation Gaps
- 7.4 Emerging Market Opportunities
- 7.5 Market Dynamics Impact and Time-Horizon Assessment
Chapter 8 Asia-Pacific Spatial Proteomics Value Chain Analysis
- 8.1 Industry Value Chain Overview
- 8.2 Upstream Suppliers and Critical Inputs
- 8.3 Technology and Component Providers
- 8.4 Manufacturing or Service Delivery
- 8.5 Distribution, Channel Partners and Integrators
- 8.6 Downstream Applications and End Users
- 8.7 Value Addition and Profit Pools
- 8.8 Vertical Integration and Outsourcing
- 8.9 Supplier Concentration and Risk
- 8.10 Supply Chain Localization and Resilience
Chapter 9 Asia-Pacific Spatial Proteomics Market Regulations and Policies
- 9.1 Relevant Laws, Standards and Compliance Frameworks
- 9.2 Product, Service, Safety and Quality Requirements
- 9.3 Government Policies, Incentives and Subsidies
- 9.4 Imports, Exports and Trade Barriers
- 9.5 Public Procurement and Local Content Requirements
- 9.6 Environmental and Sustainability Compliance
- 9.7 Upcoming Policy Changes and Market Implications
Chapter 10 Asia-Pacific Spatial Proteomics Market Hotspots and Opportunities
- 10.1 Market Opportunity Mapping and Growth Hotspots
- 10.2 High-Growth Applications and Customer Groups
- 10.3 Underserved Markets and White-Space Opportunities
- 10.4 Emerging Technology and Product Opportunities
- 10.5 New Capacity and Investment Hotspots
- 10.6 Market Entry and Expansion Opportunities
- 10.7 Distribution and Partnership Opportunities
- 10.8 Near-Term and Long-Term Commercial Potential
- 10.9 Opportunity Attractiveness and Execution Risks
Chapter 11 Asia-Pacific Spatial Proteomics Market Outlook, 2025-2035
- 11.1 Market Size and Analysis
- 11.1.1 Revenue (Market Measurement: 2025: USD 45.2 million → 2035: USD 363.1 million)
- 11.1.2 Market Volume and Quantity Sold
- 11.1.3 Historical Market Size, 2018-2025
- 11.1.4 Base-Year Market Size, 2025
- 11.2 Market Forecast, 2025-2035
- 11.2.1 Revenue Forecast to 2035
- 11.2.2 Volume Forecast to 2035
- 11.2.3 CAGR and Year-on-Year Growth
- 11.2.4 Incremental Revenue Opportunity
- 11.3 Forecast Assumptions and Scenario Analysis
- 11.3.1 Base-Case Forecast
- 11.3.2 Optimistic and Conservative Scenarios
- 11.3.3 Technology, Pricing and Policy Sensitivities
- 11.4 Market Attractiveness and Growth Outlook
Chapter 12 Asia-Pacific Spatial Proteomics Market Segmentation and Outlook
- 12.1 Segmentation Summary and Market Shares, 2025
- 12.2 Largest and Fastest-Growing Segments
- 12.3 By Product Type - Market Size and Forecast, 2025-2035
- 12.3.1 Segment Definition and Scope
- 12.3.2 Historical Market Size, 2018-2025
- 12.3.3 Revenue Forecast, 2025-2035
- 12.3.4 Volume Forecast, 2025-2035
- 12.3.5 Base-Year Market Share, 2025
- 12.3.6 Segment CAGR and Growth Drivers
- 12.3.7 Subsegment Market Size and Forecast
- 12.3.7.1 Instruments
- 12.3.7.2 Consumables & Reagents
- 12.3.7.3 Software & Services
- 12.3.8 Subsegment Pricing and Adoption Trends
- 12.3.9 Leading Suppliers and Competition
- 12.3.10 Regional Demand and Opportunities
- 12.4 By Technology - Market Size and Forecast, 2025-2035
- 12.4.1 Segment Definition and Scope
- 12.4.2 Historical Market Size, 2018-2025
- 12.4.3 Revenue Forecast, 2025-2035
- 12.4.4 Volume Forecast, 2025-2035
- 12.4.5 Base-Year Market Share, 2025
- 12.4.6 Segment CAGR and Growth Drivers
- 12.4.7 Subsegment Market Size and Forecast
- 12.4.7.1 Optical Multiplex Imaging
- 12.4.7.2 Mass-Based Spatial Analysis
- 12.4.7.3 Digital Spatial Protein Profiling
- 12.4.8 Subsegment Pricing and Adoption Trends
- 12.4.9 Leading Suppliers and Competition
- 12.4.10 Regional Demand and Opportunities
- 12.5 By End User - Market Size and Forecast, 2025-2035
- 12.5.1 Segment Definition and Scope
- 12.5.2 Historical Market Size, 2018-2025
- 12.5.3 Revenue Forecast, 2025-2035
- 12.5.4 Volume Forecast, 2025-2035
- 12.5.5 Base-Year Market Share, 2025
- 12.5.6 Segment CAGR and Growth Drivers
- 12.5.7 Subsegment Market Size and Forecast
- 12.5.7.1 Academic & Research Institutes
- 12.5.7.2 Pharma & Biotech
- 12.5.7.3 CROs & Service Labs
- 12.5.7.4 Hospitals & Clinical Pathology
- 12.5.8 Subsegment Pricing and Adoption Trends
- 12.5.9 Leading Suppliers and Competition
- 12.5.10 Regional Demand and Opportunities
- 12.6 By Application - Market Size and Forecast, 2025-2035
- 12.6.1 Segment Definition and Scope
- 12.6.2 Historical Market Size, 2018-2025
- 12.6.3 Revenue Forecast, 2025-2035
- 12.6.4 Volume Forecast, 2025-2035
- 12.6.5 Base-Year Market Share, 2025
- 12.6.6 Segment CAGR and Growth Drivers
- 12.6.7 Subsegment Market Size and Forecast
- 12.6.7.1 Oncology & Tumour Microenvironment
- 12.6.7.2 Immunology & Inflammatory Disease
- 12.6.7.3 Neuroscience
- 12.6.7.4 Infectious & Other Disease Research
- 12.6.8 Subsegment Pricing and Adoption Trends
- 12.6.9 Leading Suppliers and Competition
- 12.6.10 Regional Demand and Opportunities
- 12.7 By Country - Market Size and Forecast, 2025-2035
- 12.7.1 Segment Definition and Scope
- 12.7.2 Historical Market Size, 2018-2025
- 12.7.3 Revenue Forecast, 2025-2035
- 12.7.4 Volume Forecast, 2025-2035
- 12.7.5 Base-Year Market Share, 2025
- 12.7.6 Segment CAGR and Growth Drivers
- 12.7.7 Subsegment Market Size and Forecast
- 12.7.7.1 China
- 12.7.7.2 Japan
- 12.7.7.3 South Korea
- 12.7.7.4 Remaining Asia-Pacific
- 12.7.8 Subsegment Pricing and Adoption Trends
- 12.7.9 Leading Suppliers and Competition
- 12.7.10 Regional Demand and Opportunities
- 12.8 Segment Growth Comparison
- 12.9 Segment Attractiveness and Priority Matrix
Chapter 13 Asia-Pacific Spatial Proteomics End-Use and Application Market Outlook
- 13.1 End-Use Industry and Customer Demand Structure
- 13.2 Leading Applications and Customer Groups
- 13.3 End-Use Market Size, Share and Forecast
- 13.4 Major End-Use Industry Deep Dives
- 13.4.1 Customer Requirements and Use Cases
- 13.4.2 Demand and Replacement Cycles
- 13.4.3 Technical and Regulatory Considerations
- 13.4.4 Purchasing and Procurement Models
- 13.4.5 Leading Vendors and Distribution Channels
- 13.4.6 Forecast and Commercial Opportunities
- 13.5 Emerging Applications and Cross-Segment Demand
- 13.6 End-Use Industry Investment Priorities
Chapter 14 Asia-Pacific Spatial Proteomics Geographic Market Outlook, 2025-2035
- 14.1 Regional Market Size and Country-Level Shares, 2025
- 14.2 Country Market Size Comparison, 2025
- 14.3 Country Market Forecasts, 2025-2035
- 14.4 Subregional Industrial and Demand Clusters
- 14.5 Intra-Regional Pricing and Cost Differences
- 14.6 Cross-Border Trade and Supply Networks
- 14.7 Regional Supply and Demand Balances
- 14.8 Country Opportunity Comparison and Prioritization
Note: Every listed country is covered on the structure shown under the first country.
Chapter 15 Asia-Pacific Spatial Proteomics Technology, Innovation and Sustainability Outlook
- 15.1 Technology Landscape and Maturity
- 15.2 Product, Process and Service Innovation
- 15.3 AI, Automation and Digital Tools in the Industry
- 15.4 Technology Adoption and Performance Benchmarking
- 15.5 Innovation Pipeline and R&D Investment
- 15.6 Patent and Intellectual Property Trends
- 15.7 Energy Efficiency and Resource Management
- 15.8 Sustainability, Recycling and Circularity
- 15.9 Technology Roadmap, 2025-2035
- 15.10 Risks of Obsolescence and Technology Substitution
Chapter 16 Asia-Pacific Spatial Proteomics Market Key Strategic Imperatives
- 16.1 Growth and Market Entry Priorities
- 16.2 High-Return Products and Segments
- 16.3 Pricing, Profitability and Cost Optimization
- 16.4 Technology Investment and Product Differentiation
- 16.5 Supply Chain Localization and Resilience
- 16.6 Distribution and Customer Acquisition
- 16.7 Partnership, Acquisition and Capacity Strategy
- 16.8 Regional Expansion Priorities
- 16.9 Short-, Medium- and Long-Term Actions
Chapter 17 Competition Outlook
- 17.1 Industry Competition Characteristics
- 17.2 Market Structure and Concentration
- 17.3 Market Share and Competitive Positioning, 2025
- 17.4 Company-Wise Revenue and Product Benchmarking
- 17.5 Production and Service Capacity Benchmarking
- 17.6 Technology, Pricing and Differentiation
- 17.7 Regional Footprint and Distribution Strength
- 17.8 Mergers, Acquisitions and Strategic Alliances
- 17.9 New Entrants and Competitive Threats
- 17.10 Porter's Five Forces and Industry Attractiveness
- 17.11 Competitive Outlook, 2025-2035
Chapter 18 Company Profiles
- 18.1 Company Coverage and Selection Criteria
- 18.2 Quanterix
- 18.2.1 Business Description
- 18.2.2 Company Ownership and Geographic Presence
- 18.2.3 Product and Service Portfolio
- 18.2.4 Manufacturing and Operating Footprint
- 18.2.5 Production Capacity and Expansion Plans
- 18.2.6 Financial Performance and Investment
- 18.2.7 Market Share and Competitive Position
- 18.2.8 Technology and Innovation Capabilities
- 18.2.9 Strategic Alliances or Partnerships
- 18.2.10 Recent Developments
- 18.2.11 Growth Strategy and Outlook
- 18.3 Bruker
- 18.4 Standard BioTools
- 18.5 Leica Microsystems
- 18.6 Bio-Techne
- 18.7 Other Relevant Market Participants
Note: Every listed company is profiled on the structure shown under the first company. The company list is preliminary and may change based on research findings, market developments, data availability and client requirements.
Chapter 19 Disclaimer
- 19.1 Research and Forecast Disclaimer
- 19.2 Data Source and Estimation Limitations
Note: The depth of individual sections depends on data availability for this market. Volume, capacity, trade and other unit-based metrics are included where applicable.