
Film steps per wafer, not fab count, now set CVD demand
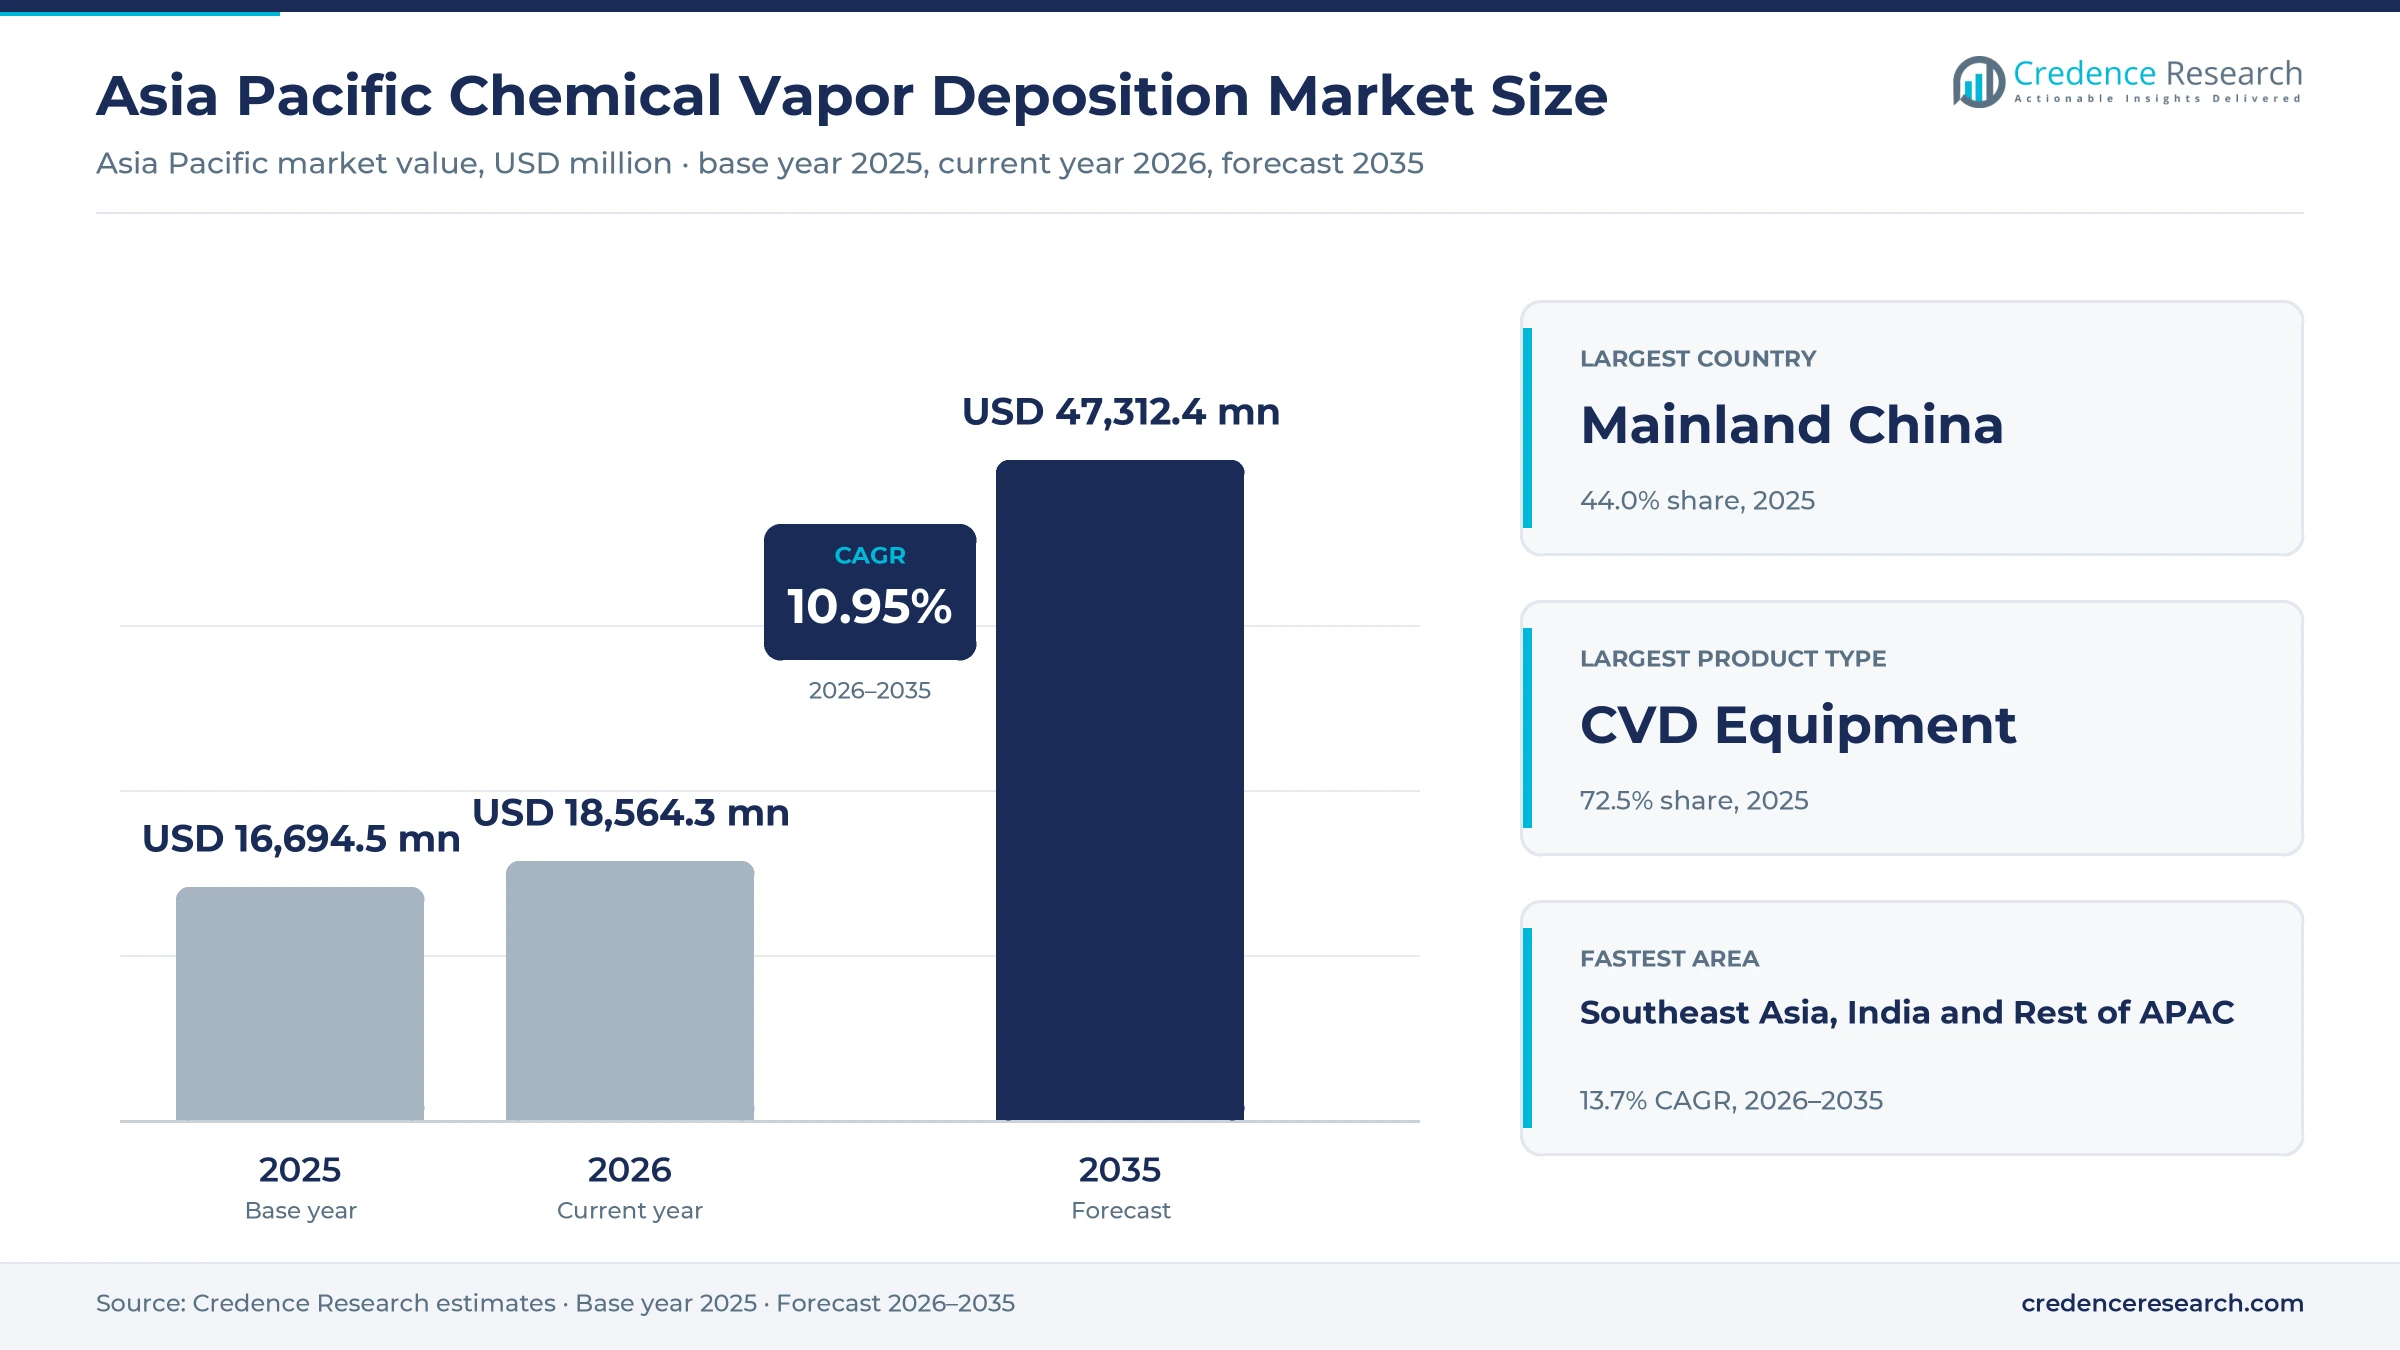
The Asia Pacific chemical vapor deposition market was valued at USD 16.69 billion in 2025 and is projected to increase from USD 18.56 billion in 2026 to USD 47.31 billion by 2035, registering a CAGR of 10.95% during 2026–2035. Demand comes from chipmakers adding gate-all-around logic and high-bandwidth memory capacity, from solar cell producers that deposit passivation and polysilicon layers, and from shops that coat cutting tools and components. Mainland China held the largest share, 44.0% in 2025, because it runs the largest wafer, solar and coating base in the region, while Southeast Asia, India and Rest of Asia Pacific is the fastest-growing area at 13.7% a year as India builds its first commercial fab and Singapore adds memory packaging plants. Leading-edge logic is also changing how tools are bought, since each new transistor generation adds selective, epitaxial and low-temperature film steps that need new chamber types. Suppliers now compete on process qualification at a handful of large fabs rather than on tool price alone.
Tools, precursors and services sold to film-making plants
The market counts the value of chemical vapor deposition equipment, the precursor chemicals consumed in CVD chambers, and the installation, upgrade and refurbishment services sold to producers across Asia Pacific. Buyers include foundries, memory and logic manufacturers, solar cell makers, coating shops and research lines, which usually buy tools directly from equipment makers under process qualification agreements.
Physical vapor deposition tools, etch and lithography systems, bulk industrial gases and finished chips or modules made with CVD films are excluded from the count. The value chain runs from precursor and component makers through tool assembly in Japan, South Korea, China and Singapore to fab installation, spare parts and field service over the long working life of each tool.
Asia Pacific Chemical Vapor Deposition Market Insights
- Asia Pacific CVD value rises from USD 16.69 billion in 2025 to USD 47.31 billion by 2035, a 10.95% CAGR over 2026–2035, as 2nm logic, high-bandwidth memory and compound-semiconductor lines add film steps.
- Mainland China held 44.0% of 2025 value, while Southeast Asia, India and Rest of Asia Pacific grows fastest at 13.7% a year on new Indian fabs and Singapore memory packaging.
- CVD Equipment led with 72.5% of 2025 value, while CVD Precursor Materials grow fastest at 11.9% a year as each wafer carries more film layers.
- TSMC began volume production of 2nm nanosheet chips in the fourth quarter of 2025, and Applied Materials says leading logic makers are adopting its newest gate-metal and selective nitride systems at 2nm.
- Chinese fabs raised domestic equipment use to 35% in 2025 from 25% in 2024, according to China Semiconductor Industry Association data, which squeezes imported CVD tools in the largest market.
Tools lead value while precursors and epitaxy grow fastest
The chemical vapor deposition segment estimates below split 2025 value by what is sold, who buys it, which film it makes and which reactor makes it. Chip fab spending sets equipment value, while wafer starts and layer counts set precursor and service value.
Why do CVD tools hold most of the value?
Based on product type, the market is categorized into CVD equipment, CVD precursor materials and CVD services. CVD Equipment led with 72.5% of 2025 value because single-wafer and batch reactors carry the largest ticket, and SEMI estimated in December 2025 that wafer fab equipment spending would reach USD 115.7 billion worldwide in 2025 and rise a further 9.0% in 2026. CVD Precursor Materials grow fastest at 11.9% a year as consumption scales with every wafer and layer processed, and SEMI expects NAND equipment spending to rise from USD 14.0 billion in 2025 to USD 16.9 billion in 2027 as stacks grow taller. Precursor sales therefore follow fab utilization more closely than capital budgets.
How much of CVD demand comes from chip fabs?
Based on end-use industry, the market is categorized into semiconductor manufacturing, photovoltaic manufacturing and industrial coating production. Semiconductor Manufacturing led with 76.0% of 2025 value because chip fabs buy the most expensive reactors, and SEMI puts foundry and logic equipment spending at USD 66.6 billion in 2025, up 9.8%. Semiconductor Manufacturing also grows fastest at 11.3% a year as SEMI expects that foundry and logic spending to climb to USD 75.2 billion in 2027, while solar cell makers in China are cutting capacity. Coating demand follows tooling and automotive parts output, so it grows more slowly than either.
Which films account for most CVD spending?
Based on application, the market is categorized into dielectric film deposition, conductive film deposition, epitaxial film growth and protective film deposition. Dielectric Film Deposition led with 43.5% of 2025 value because oxide, nitride and low-k layers are deposited many times on every chip, and Applied Materials said on April 8, 2026, that leading logic makers are adopting its Producer Precision Selective Nitride PECVD system for 2nm isolation. Epitaxial Film Growth grows fastest at 12.3% a year as gate-all-around transistors need source and drain epitaxy in deep trenches, which Applied's Centura Xtera system, launched on Oct. 7, 2025, fills with 50% less gas than conventional epitaxy.
Which reactor types do buyers choose most often?
Based on technology, the market is categorized into PECVD, LPCVD, MOCVD and thermal and specialized CVD. PECVD led with 40.0% of 2025 value because plasma deposition makes most low-temperature dielectric and hardmask films, and Chinese supplier Piotech doubled its PECVD share at YMTC's 3D NAND lines from 15% to 30%, according to Taiwan's Commercial Times in January 2026. MOCVD grows fastest at 12.2% a year as compound-semiconductor lines expand, and AIXTRON reported significant large-volume orders for its G10-SiC system in China in the first half of 2025.
| Segment Group | Leading Sub-segment | Share, 2025 | Fastest-growing Sub-segment | CAGR, 2026–2035 |
|---|---|---|---|---|
| By Product Type | CVD Equipment | 72.5% | CVD Precursor Materials | 11.9% |
| By End-Use Industry | Semiconductor Manufacturing | 76.0% | Semiconductor Manufacturing | 11.3% |
| By Application | Dielectric Film Deposition | 43.5% | Epitaxial Film Growth | 12.3% |
| By Technology | PECVD | 40.0% | MOCVD | 12.2% |
Tool prices span a tenfold range by node and reactor
CVD is priced per chamber or tool, with process kits, recipes and service contracts sold on top. Leading-edge single-wafer platforms cost the most because each chamber is qualified for one film at one fab, and switching means requalifying the module. Batch furnaces and solar LPCVD tubes cost less per tool but sell in large lots, so volume discounts matter more. Precursor prices depend on purity and molecule complexity rather than tonnage. Suppliers earn the best margins on new-node chambers and long service contracts, while refurbished tools give smaller fabs and research lines a cheaper entry. Toolmakers do not publish list prices, so the ranges below are Credence Research estimates derived from equipment billings and tool counts, not quoted prices.
| Offer or segment | Typical price or fee | Basis |
|---|---|---|
| Leading-edge single-wafer PECVD or epitaxy platform | About USD 4 million to USD 8 million per tool | Credence Research estimate; suppliers do not publish list prices |
| 300 mm batch LPCVD or ALD furnace | About USD 2 million to USD 4 million per tool | Credence Research estimate; suppliers do not publish list prices |
| Multi-wafer MOCVD reactor for GaN or SiC | About USD 2 million to USD 5 million per system | Credence Research estimate; suppliers do not publish list prices |
| Refurbished 200 mm CVD system | About USD 0.3 million to USD 1 million per tool | Credence Research estimate; suppliers do not publish list prices |
| Specialty CVD and ALD precursors | About USD 500 to USD 10,000 per kilogram by molecule and purity | Credence Research estimate; suppliers do not publish list prices |
Request a Free Sample
Fill in your details and we'll send you a free sample report.
- Sample data tables & charts
- Research methodology
2nm logic, HBM and compound chips multiply film layers
Gate-all-around logic multiplies film steps
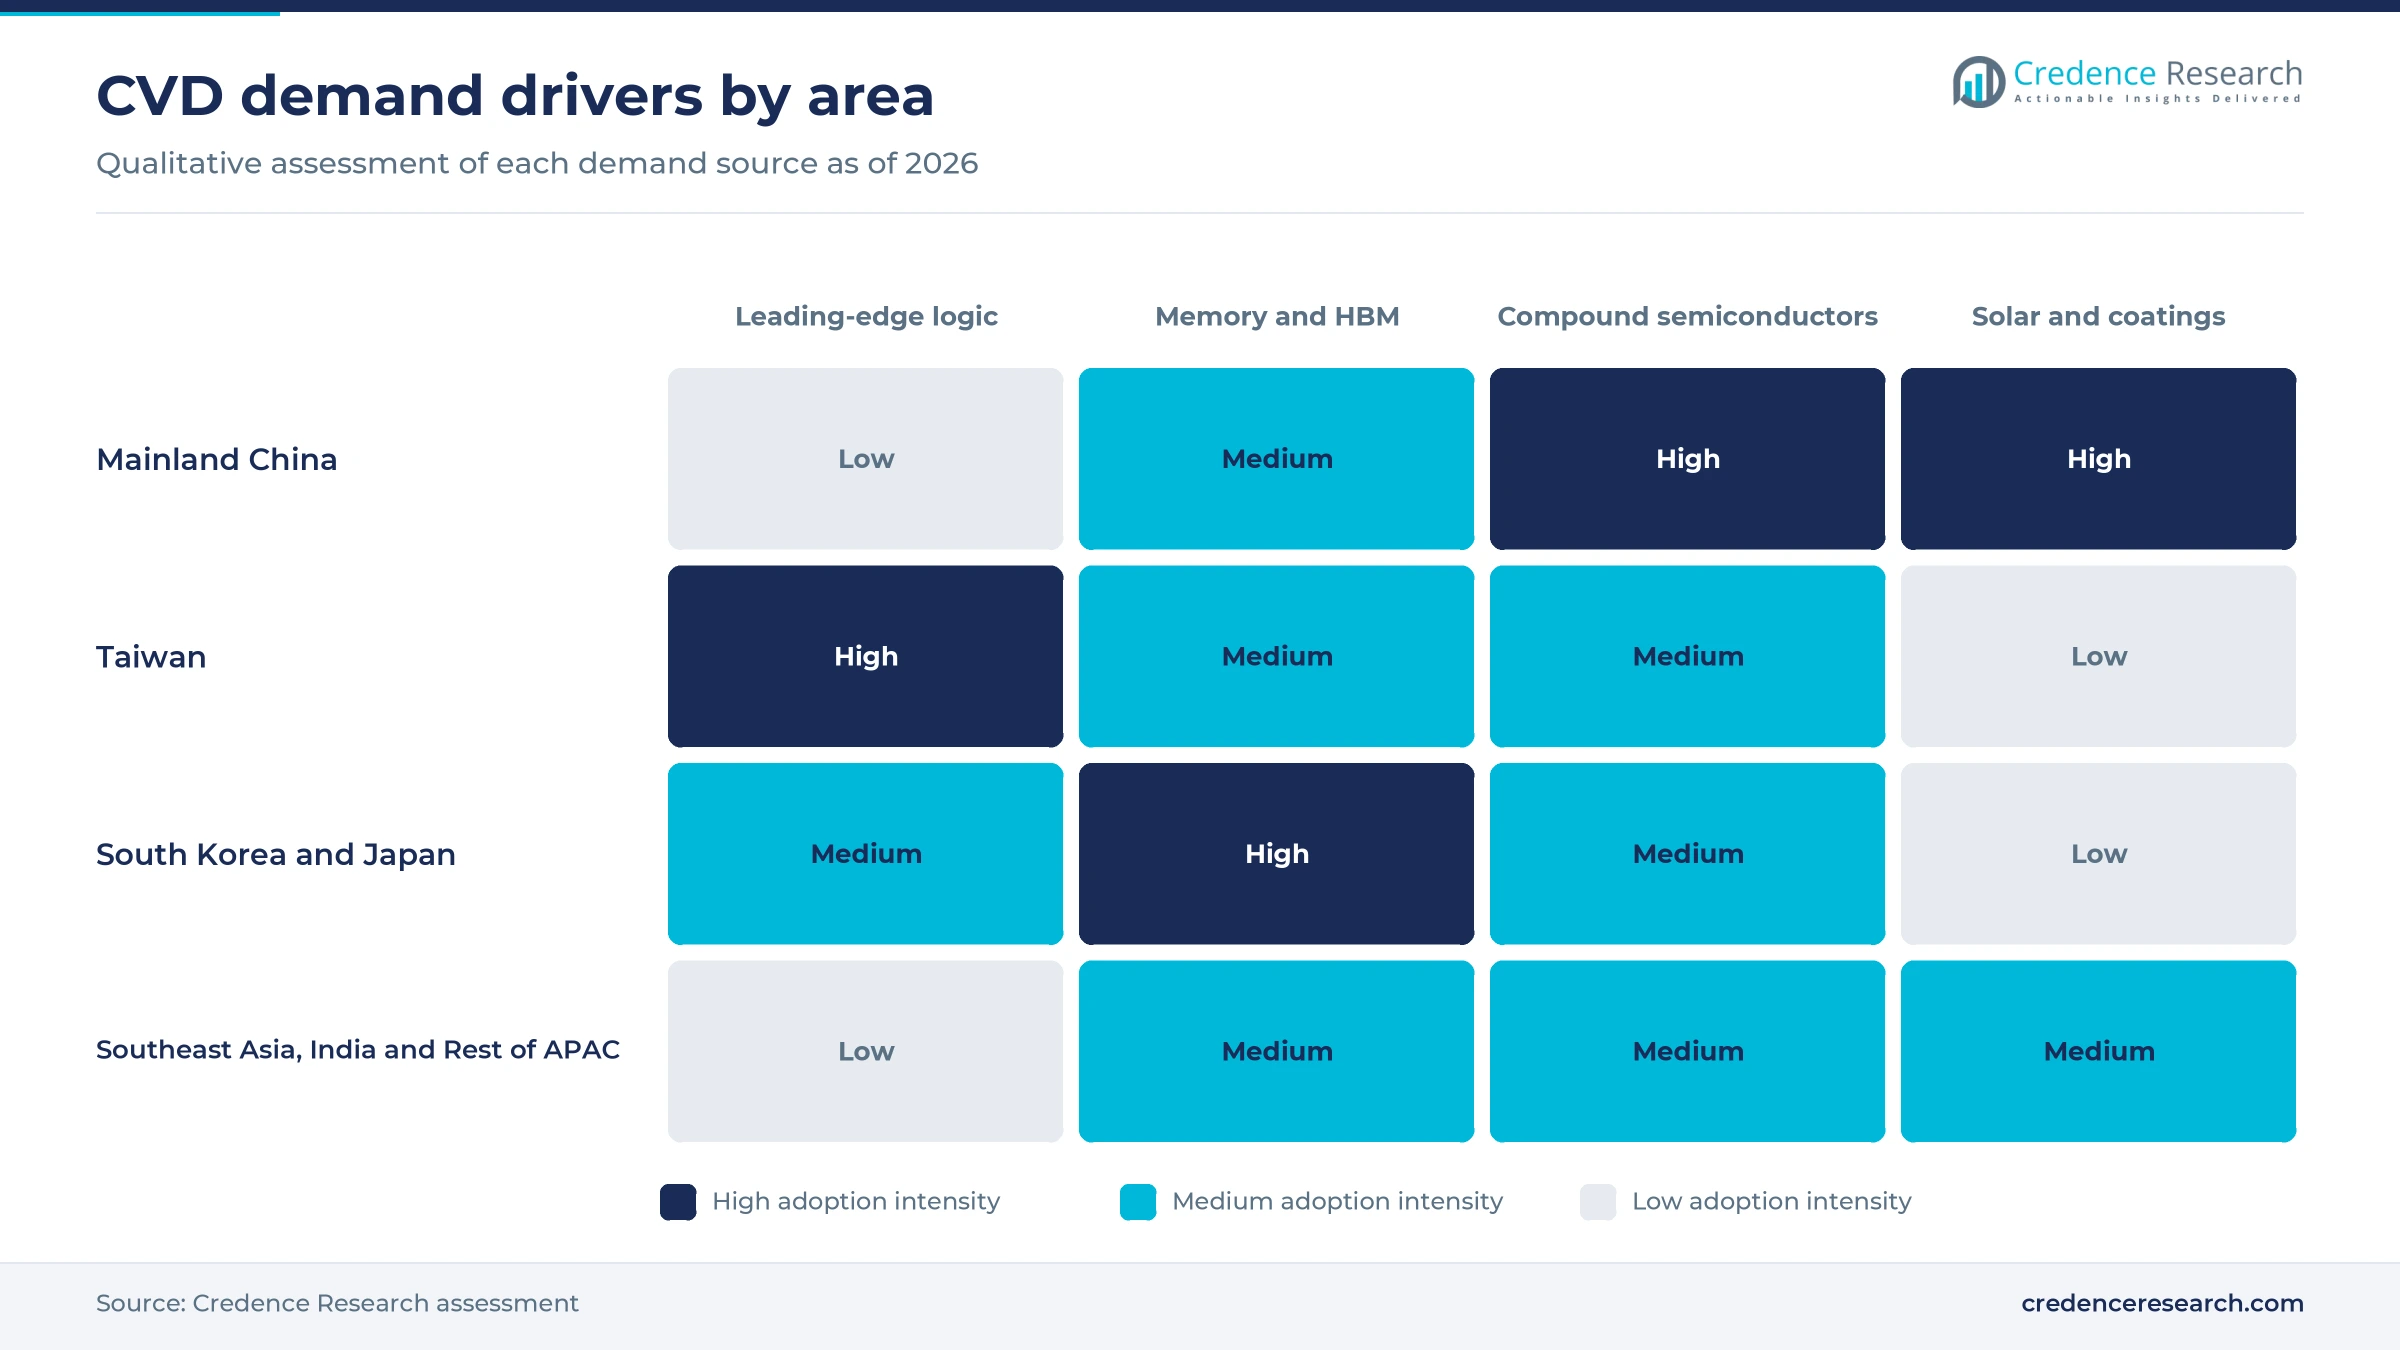
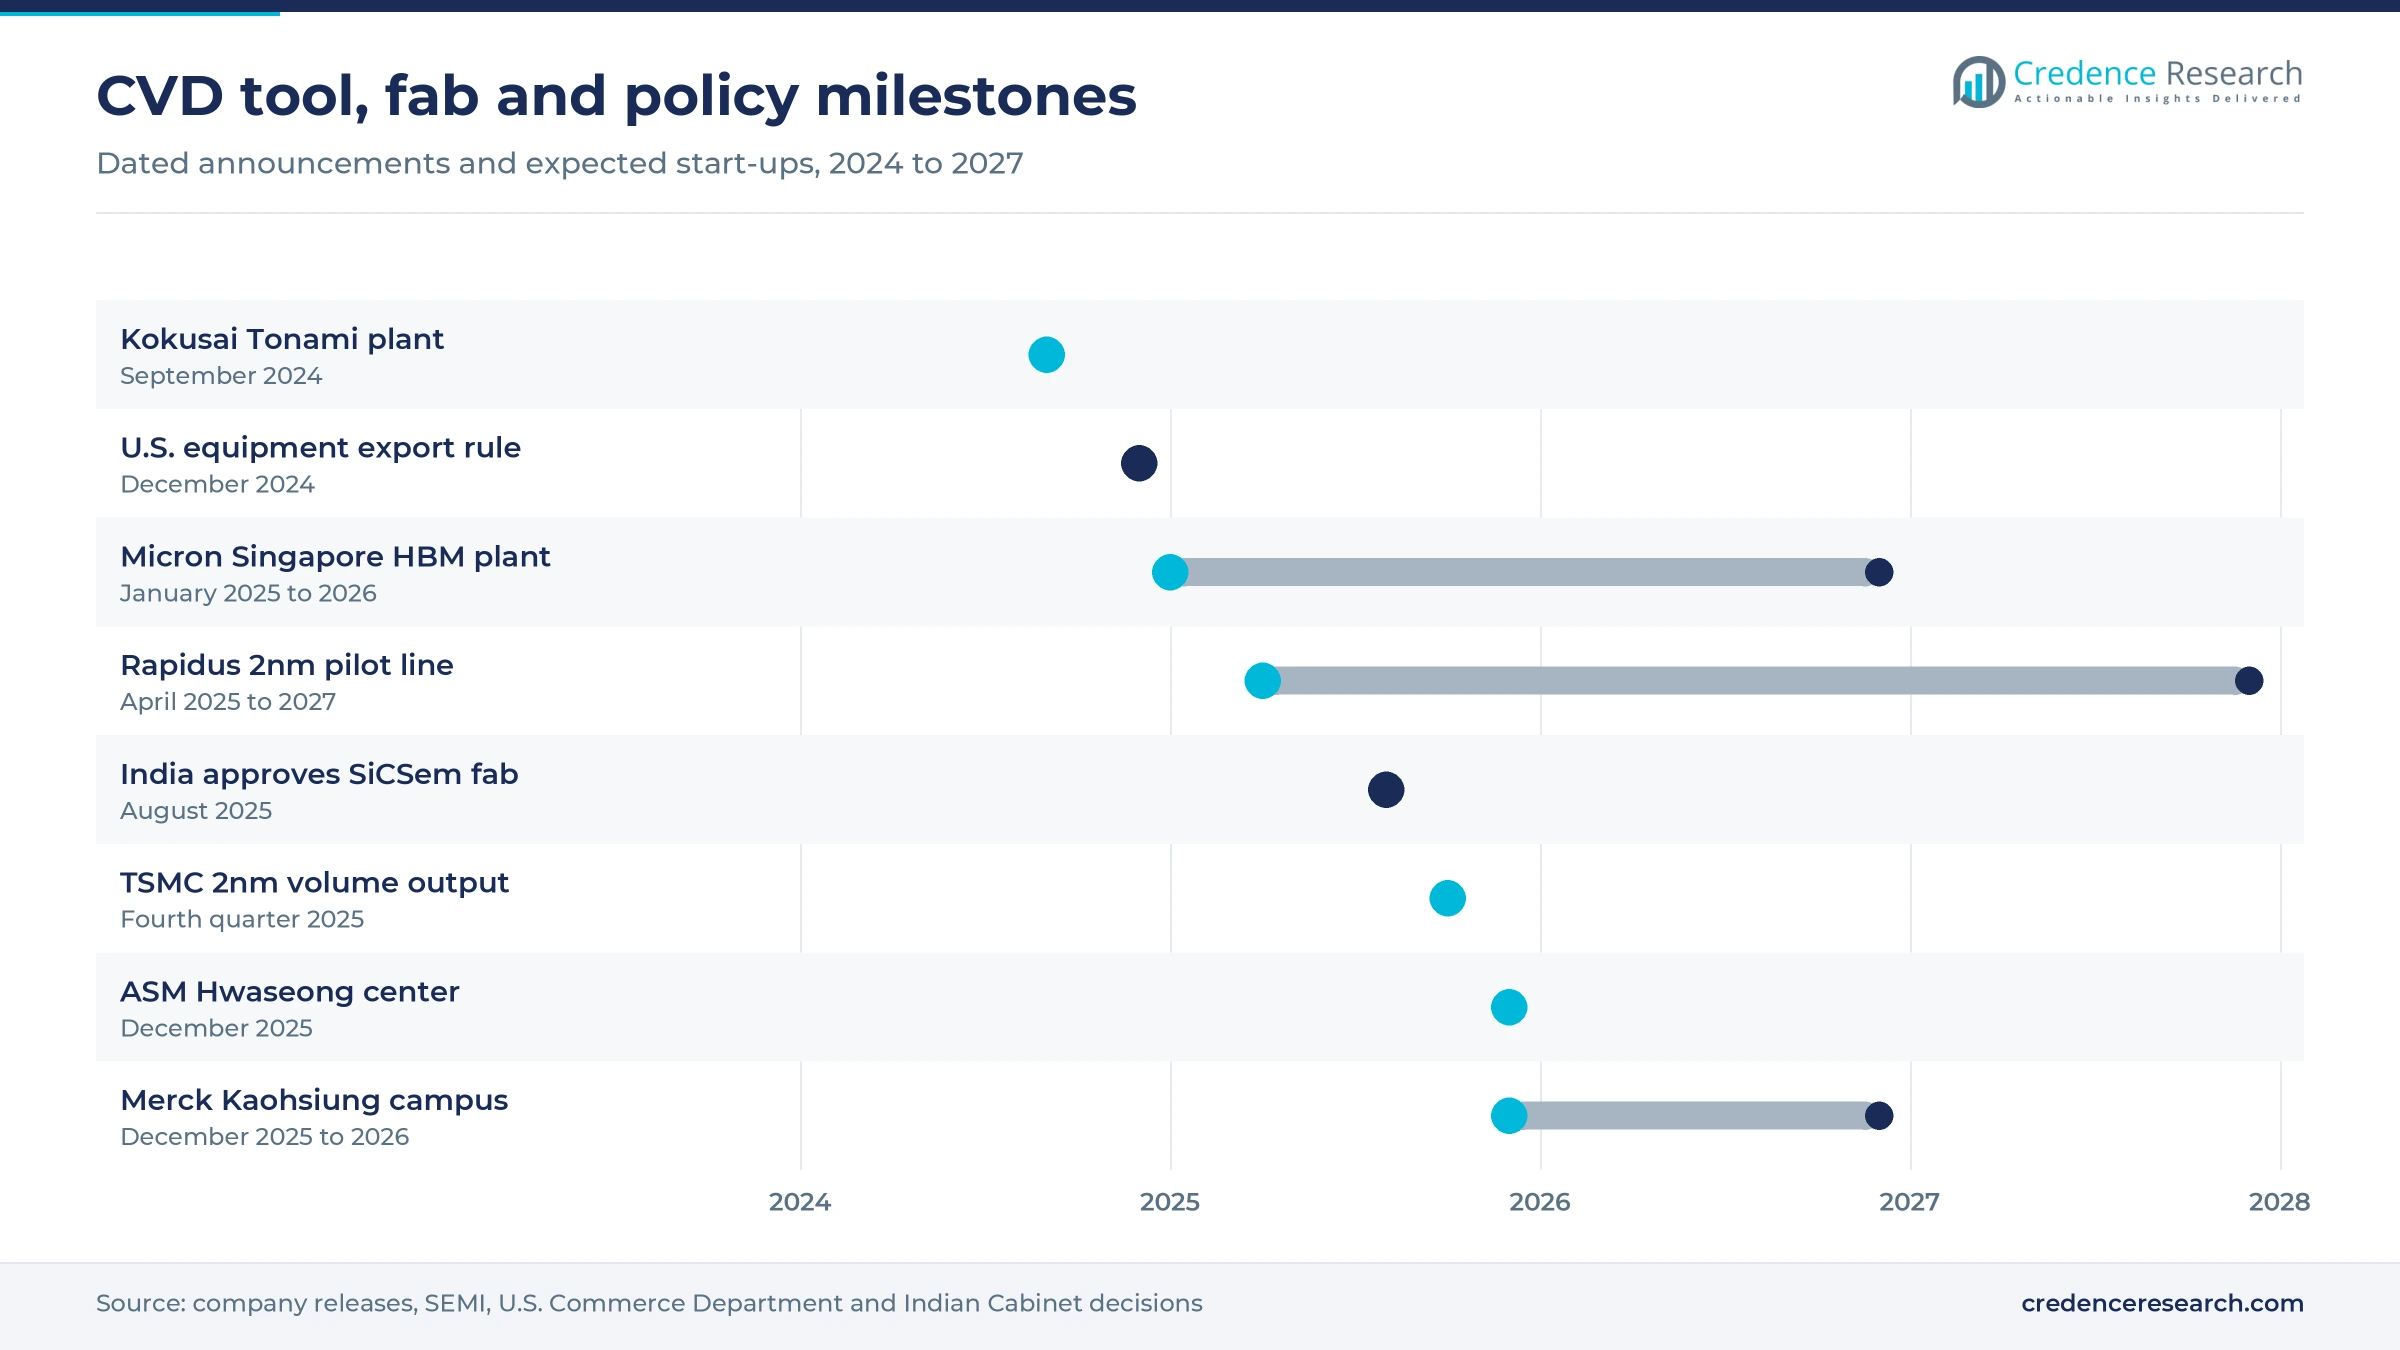
Advanced logic and new transistor architecture are the strongest source of CVD value, because nanosheet transistors need more selective, epitaxial and atomic-scale films per wafer than FinFETs. TSMC began volume production of its 2nm chips in the fourth quarter of 2025, according to Focus Taiwan, moving the largest foundry in the region onto gate-all-around transistors. Applied Materials said in April 2026 that leading chipmakers are adopting its Endura Trillium ALD system to build gate metal stacks around stacked nanosheets at 2nm and below. Japan joined the node race when Rapidus started a 2nm pilot line in Chitose, Hokkaido, in April 2025, targeting mass production in 2027. Each node move therefore raises deposition spending per wafer, which favors suppliers with qualified chambers at these fabs.
HBM and DRAM expansion lifts memory deposition
Memory complexity and HBM production lift deposition demand because high-bandwidth memory uses more wafer capacity per bit than standard DRAM. SK hynix said in April 2024 that HBM needs at least twice the capacity of general DRAM for the same output, and it set about 5.3 trillion won for its M15X fab in Cheongju. SEMI expects DRAM equipment spending of USD 22.5 billion in 2025, up 15.4%, with a further 15.1% rise in 2026. Micron broke ground on Jan. 8, 2025, on a USD 7 billion HBM advanced packaging plant in Singapore, with operations from 2026. These projects add capacitor, hardmask and through-silicon via films, so memory makers in South Korea, Japan and Singapore order more batch and single-wafer CVD tools.
Compound semiconductors and photonics need epitaxy
Compound-semiconductor and photonics investment adds demand for MOCVD and epitaxial reactors that silicon fabs do not use. AIXTRON said in February 2026 that optoelectronics orders recovered significantly on laser and photonics demand for AI data transmission, with repeat orders for its G10-AsP platform from several customers. The same release named optical data communication and GaN power as its main revenue sources for 2026, and said AI data centers could become the largest single use for GaN power chips. India's Cabinet approved SiCSem's plant in Odisha on Aug. 12, 2025, as the country's first commercial compound semiconductor fab for silicon carbide devices. MOCVD, which grows at 12.2% a year, gains most from this shift toward gallium nitride, silicon carbide and indium phosphide layers.
AI-led capital budgets keep tool orders rising
AI-related capital budgets keep tool orders high even as consumer electronics demand stays uneven. SEMI forecast in December 2025 that total equipment sales would reach USD 145 billion in 2026 and a record USD 156 billion in 2027, driven by AI-related investment. TSMC spent USD 40.9 billion of capital in 2025 and guided USD 52 billion to USD 56 billion for 2026, with 70% to 80% aimed at advanced process technologies. Because deposition is one of the largest tool groups in every new fab, these budgets flow directly into semiconductor equipment orders for CVD makers. Taiwan, growing at 11.7% a year, captures the largest share of this leading-edge spending.
Chinese tool makers and Asian tool plants reshape supply
Shift toward domestic CVD suppliers in China
Chinese fabs are shifting orders to domestic deposition suppliers, which narrows the largest market in the region for imported tools. China Semiconductor Industry Association data show domestic equipment adoption at Chinese fabs reached 35% in 2025, up from 25% in 2024 and above the 30% target for the year. Commercial Times reported that combined localization of deposition and etch tools had passed 40%, well ahead of lithography and metrology. SEMI expects China to remain the largest equipment region through 2027, although its sales decline gradually from 2026. Global suppliers keep the leading-edge and memory recipes, but mature-node CVD orders in Mainland China increasingly go to NAURA, Piotech and other local makers.
Rise of tool production and development inside Asia
Toolmakers are moving more production and development close to their largest customers in Japan and South Korea. ASM opened an expanded Innovation Manufacturing Center in Hwaseong on Dec. 8, 2025, investing 136.2 billion won and expecting to triple manufacturing capacity for ALD and plasma-enhanced ALD equipment, according to Asia Economy. Kokusai Electric completed a deposition and treatment equipment plant in Tonami, Toyama Prefecture, in September 2024, as part of a plan to double production capacity by the fiscal year ending March 2026. Tokyo Electron announced in February 2025 a JPY 104 billion production building in Miyagi, due by summer 2027. Local plants shorten lead times and spare-parts delivery for fabs in the region.
Opening in India's first fab and assembly wave
India offers the largest new opening for CVD suppliers, because its first commercial fab must equip every deposition step from scratch. The Tata Electronics and PSMC fab at Dholera, approved under the India Semiconductor Mission with an investment of Rs 91,000 crore, is planned for 50,000 wafer starts a month at 28 nm and power nodes. The August 2025 approvals took the number of approved projects under the mission to 10, according to Business Today. Lam Research committed more than Rs 10,000 crore to Karnataka at Invest Karnataka in February 2025. Suppliers that build local service teams before tool installation should win the first and longest qualification cycles.
Opening for precursor supply close to new fabs
Precursor and specialty materials supply is opening up as fabs ask for local sources of the chemicals consumed in each CVD chamber. Merck inaugurated a 500 million euro campus in Kaohsiung on Dec. 1, 2025, covering 150,000 square meters for thin films, formulation materials and specialty gases, with production from 2026. ASM Korea sources most domestic production materials and components from small and midsize suppliers in Gyeonggi Province, according to Asia Economy. Because precursor materials grow faster than tools, suppliers of high-k and metal precursors near Taiwanese and Korean fabs gain the most. Shorter supply routes also cut the qualification risk that fabs face whenever a precursor source changes.
Export rules, solar overcapacity and subsidy risk weigh
Export controls cut leading-edge sales to China
Export controls limit what global CVD suppliers can sell in their largest regional market. The U.S. Commerce Department said on Dec. 2, 2024 that it was restricting 24 types of semiconductor manufacturing equipment, including deposition tools and adding 140 entities to the Entity List. Chinese fabs respond by qualifying domestic tools, so lost orders may not return when rules ease. Suppliers outside China offset this with service contracts and mature-node sales where licenses allow.
Solar overcapacity freezes photovoltaic tool orders
Solar cell makers have little reason to buy new deposition tools while factories run below capacity. The China Photovoltaic Industry Association reported that China's module output fell 8.4% to 574.5 GW in 2025, while domestic module capacity fell 5.8% to 1,089.4 GW. That gap leaves LPCVD and PECVD lines idle and pushes tool prices down for Chinese solar equipment makers. Orders should return mainly through upgrades to back-contact and higher-efficiency cell lines.
Silicon carbide overcapacity slows MOCVD orders
Silicon carbide epitaxy demand has turned weaker after a period of rapid capacity building. AIXTRON said in its February 2026 results that SiC demand was subdued in Western markets and that its 2026 outlook for the segment is weak because of market overcapacity. Device makers with spare reactors delay new purchases, which hits MOCVD and epitaxy suppliers first. Suppliers shift sales effort toward GaN power and photonics customers, whose orders are steadier.
New fab projects depend on public subsidies
Several new fab projects in the region depend on government money, so tool orders can slip when budgets change. Japan's industry ministry set up to 802.5 billion yen of additional subsidies for Rapidus in fiscal 2025, according to Jiji Press. India's fab program rests on central and state incentives in the same way. Suppliers face delayed orders if subsidies are cut or milestones are missed, so they tend to stage deliveries against project funding.
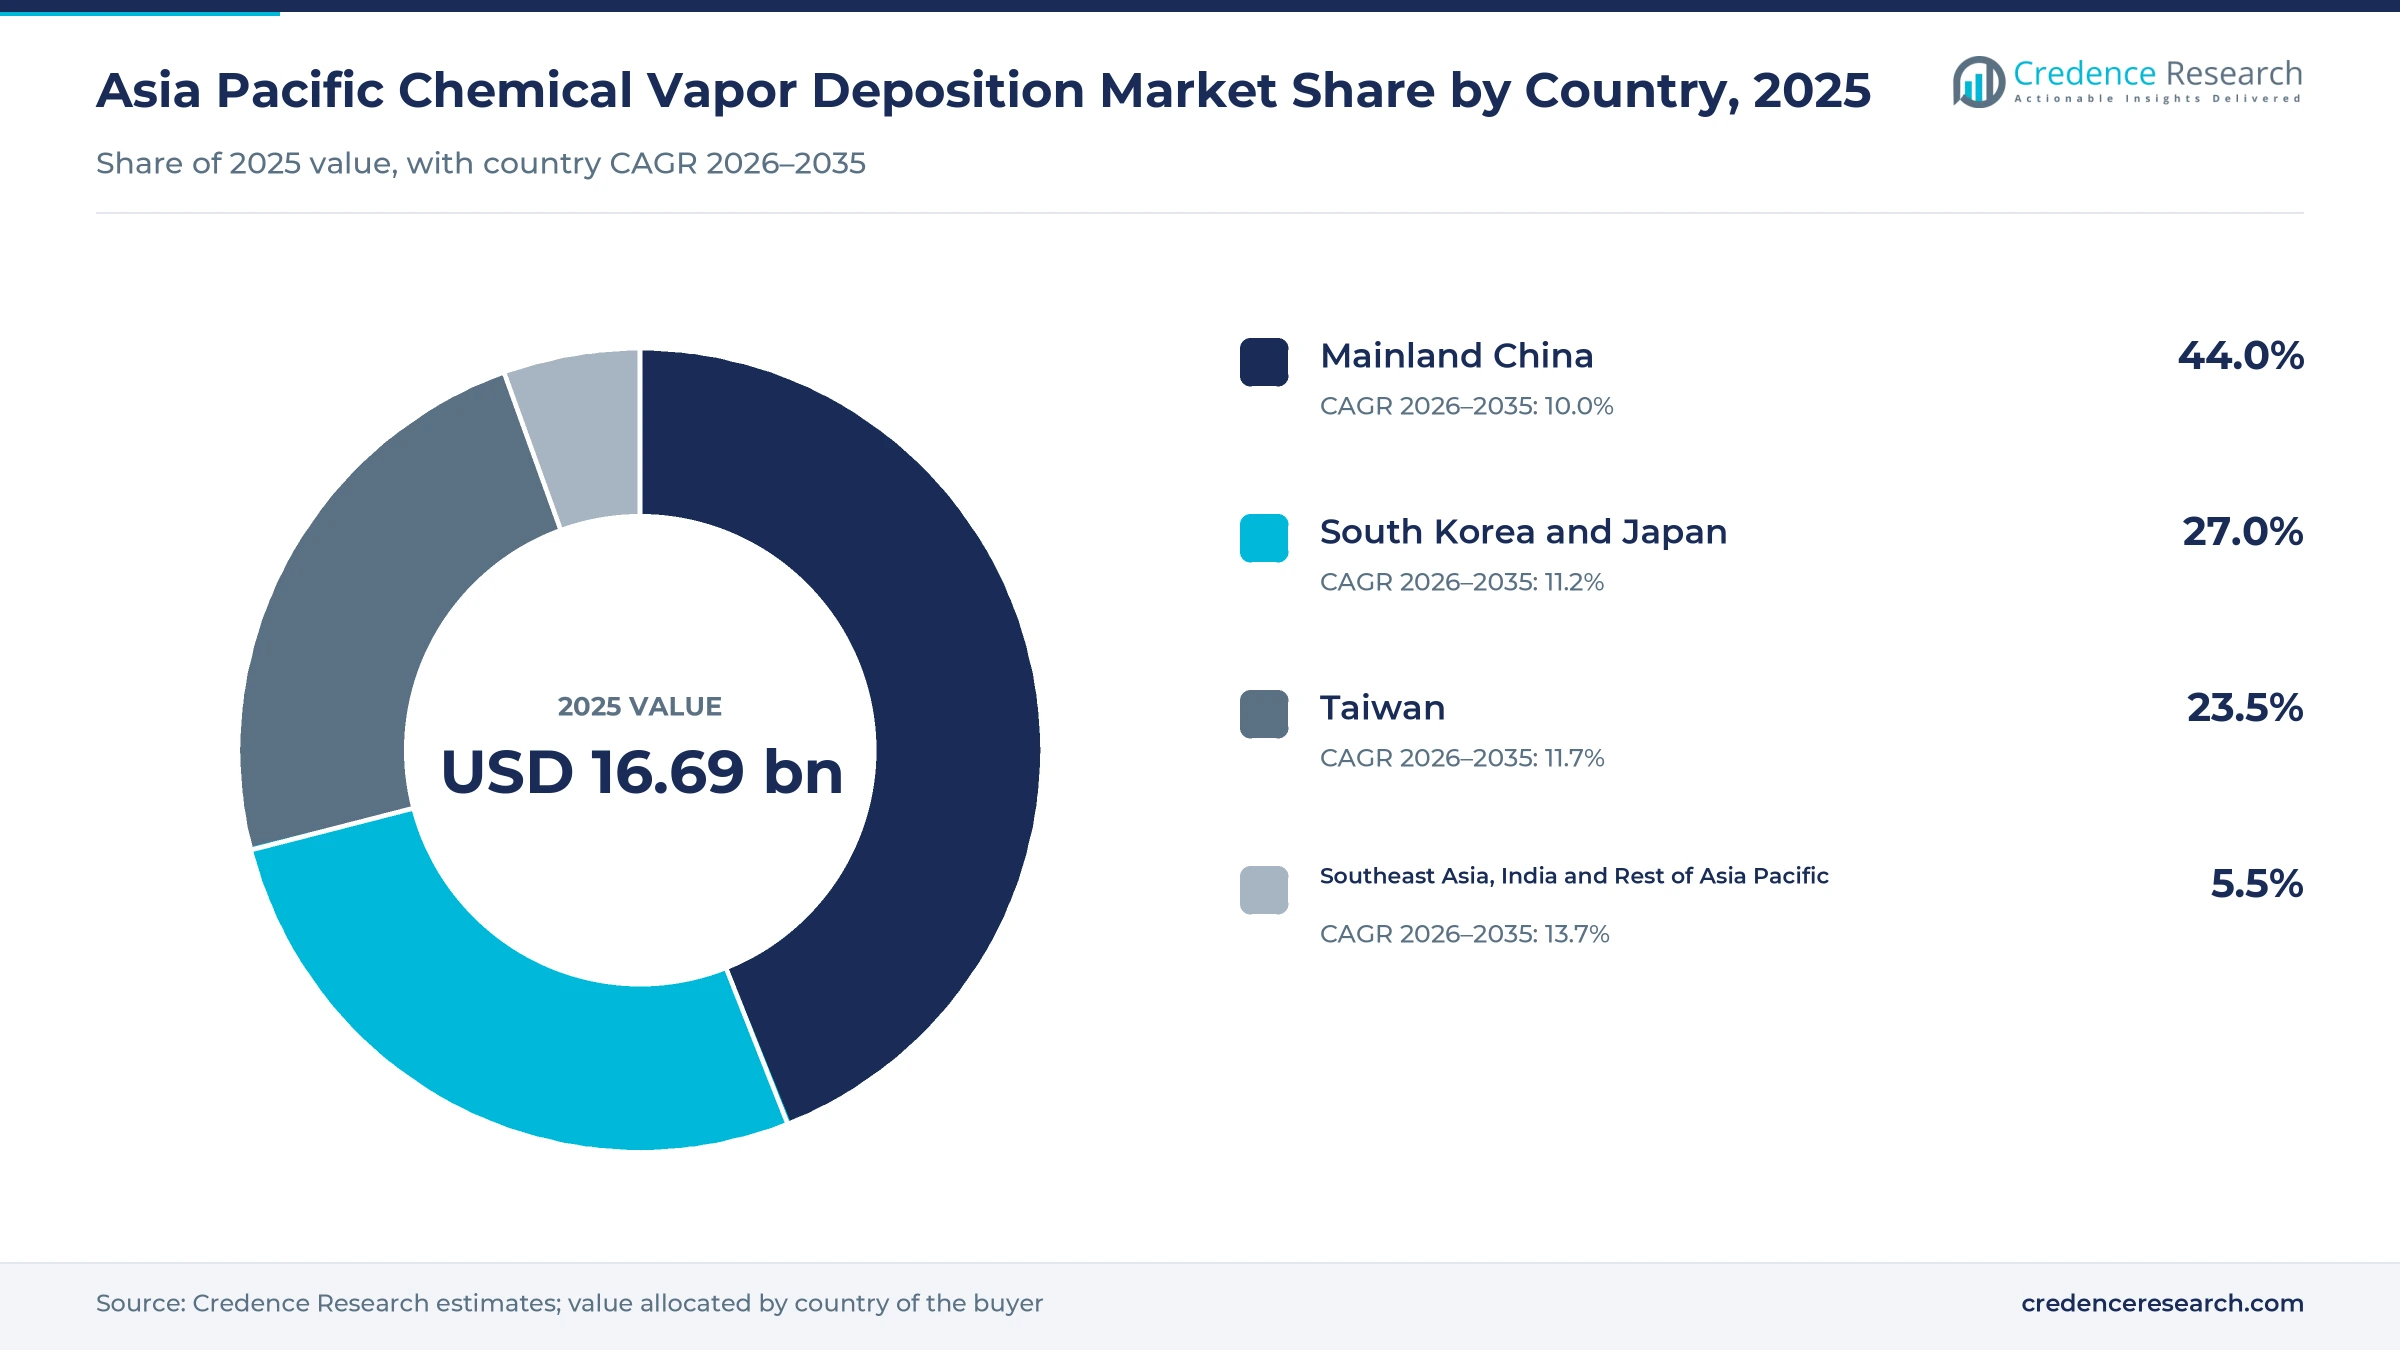
Mainland China leads while India and Singapore grow fastest
| Country | Value, 2025 (USD billion) | Share, 2025 | CAGR, 2026–2035 |
|---|---|---|---|
| Mainland China | 7.35 | 44.0% | 10.0% |
| South Korea and Japan | 4.51 | 27.0% | 11.2% |
| Taiwan | 3.92 | 23.5% | 11.7% |
| Southeast Asia, India and Rest of Asia Pacific | 0.92 | 5.5% | 13.7% |
Mainland China leads on fab, solar and coating volume
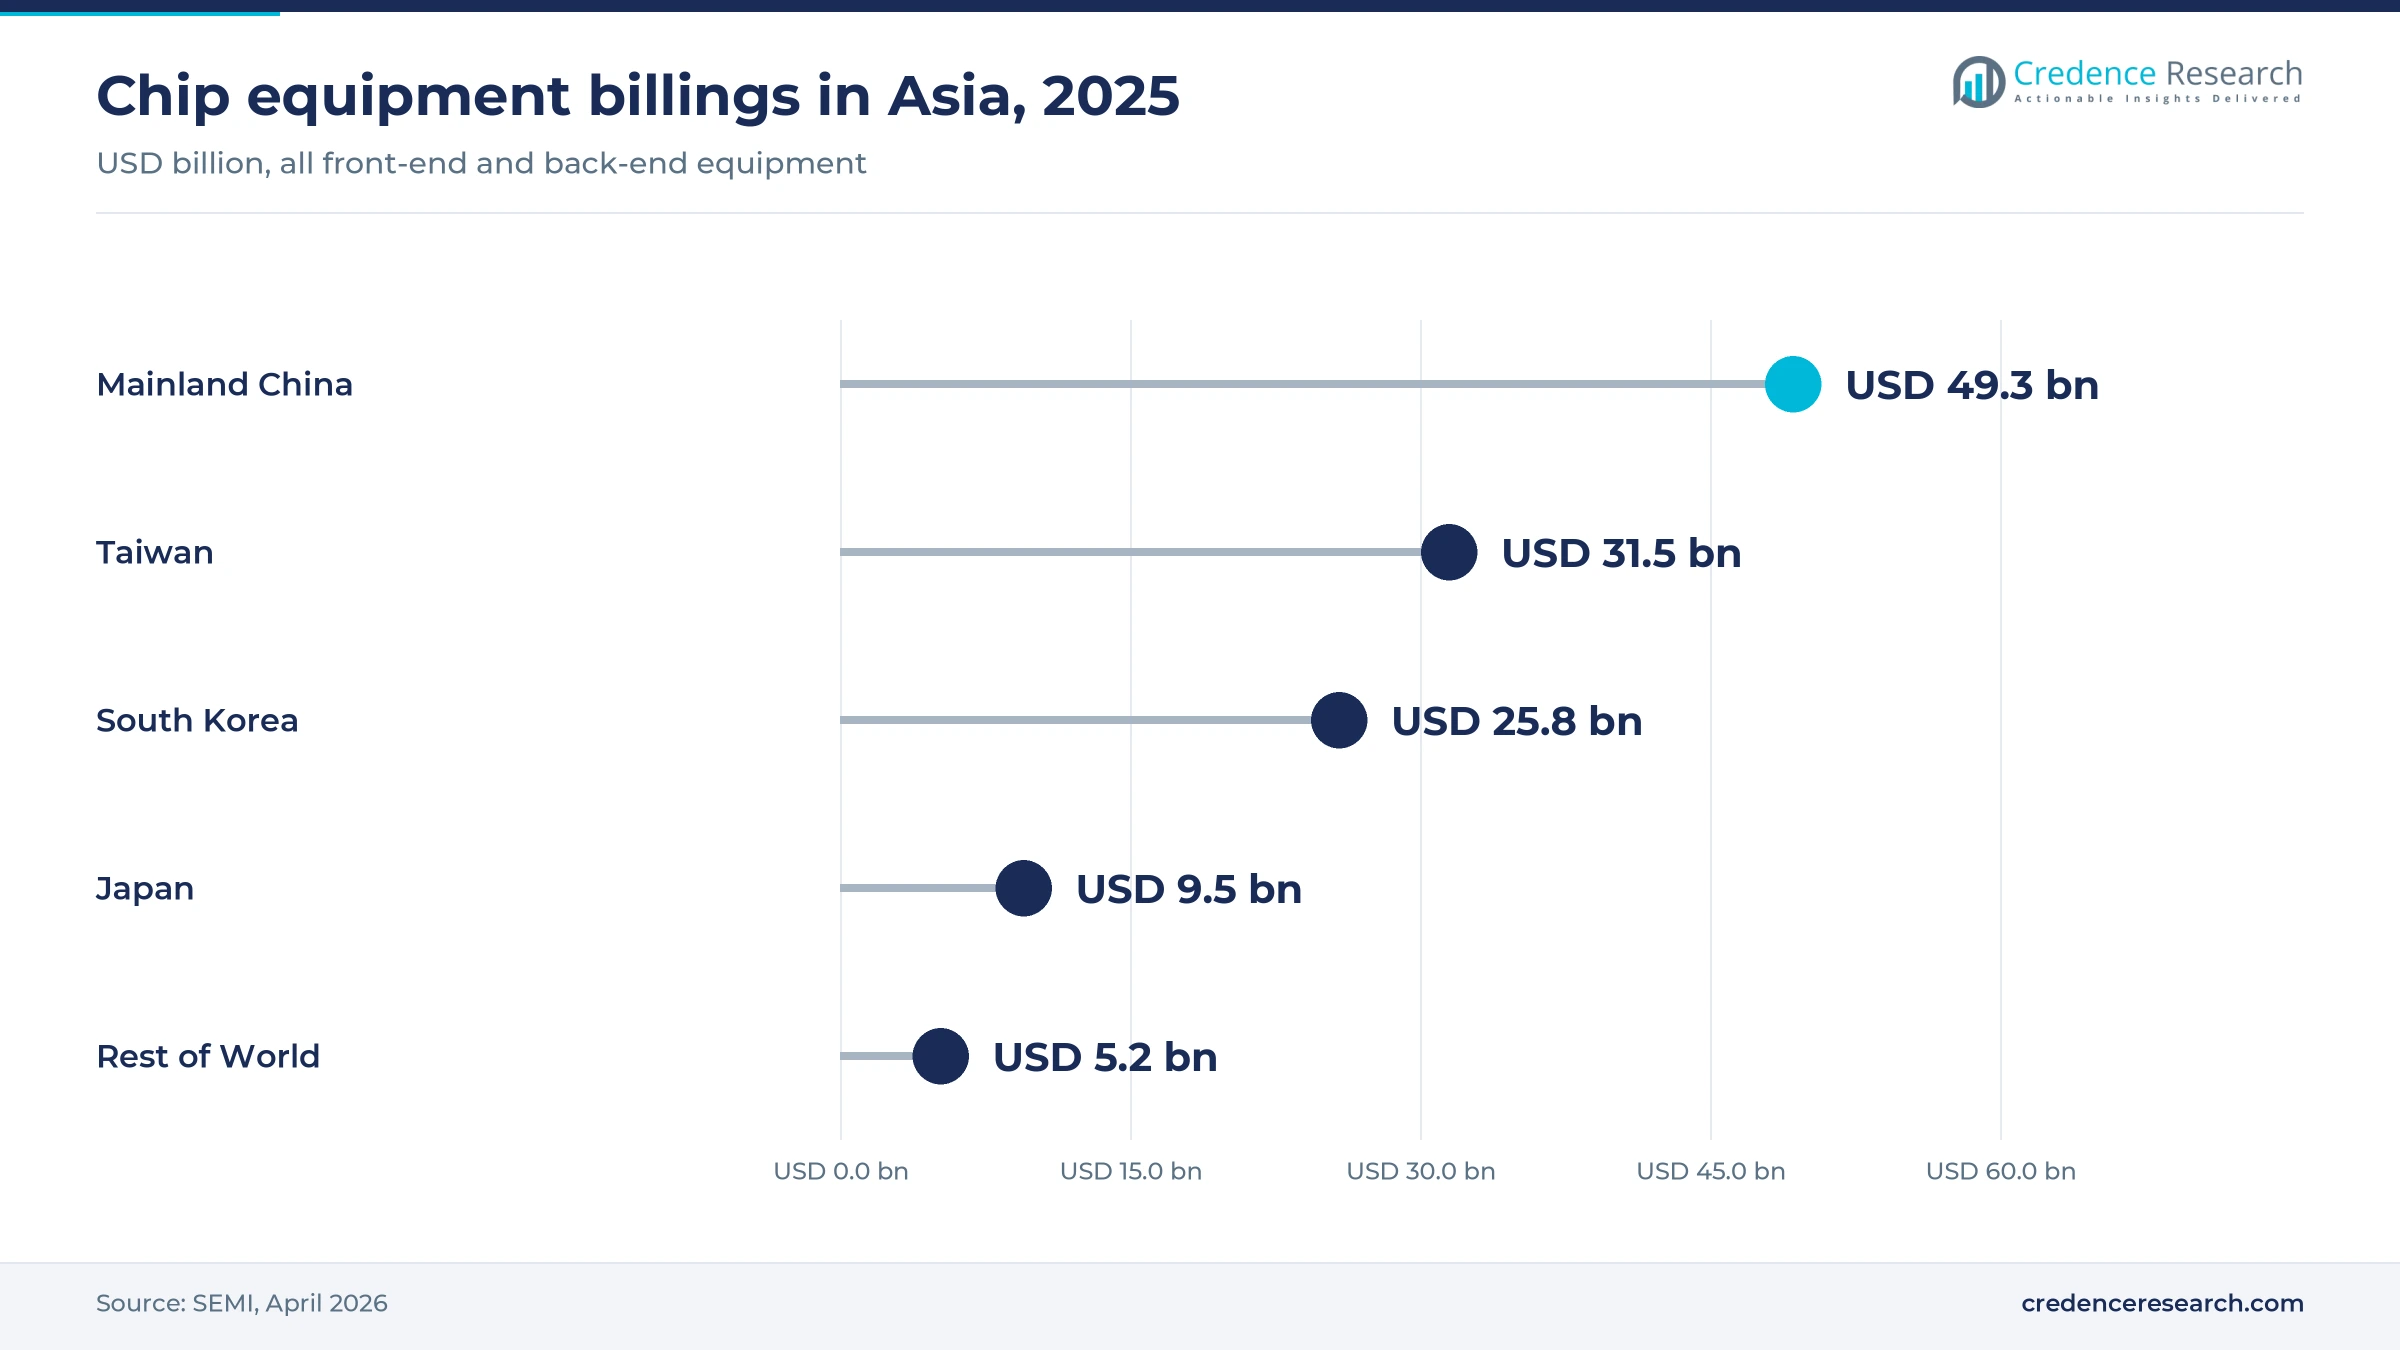
Mainland China held 44.0% of 2025 value and grows at 10.0% a year, the slowest pace in the region. SEMI reports that chip equipment billings in China were USD 49.3 billion in 2025, down 0.5%, still the largest of any region. China also hosts nearly all of the region's solar cell deposition lines, which keeps its share high. Growth now depends on mature-node fabs and memory makers, which increasingly buy local tools.
South Korea and Japan buy for memory and new logic
South Korea and Japan held 27.0% of 2025 value and grow at 11.2% a year. Chip equipment billings rose 26% to USD 25.8 billion in South Korea and 22% to USD 9.5 billion in Japan in 2025. Korean demand rests on DRAM and HBM capacity, while Japan adds new logic through Rapidus and hosts the batch and plasma toolmaking bases of Tokyo Electron and Kokusai Electric. Both countries buy a high share of the region's leading-edge chambers.
Taiwan buys the most advanced logic chambers
Taiwan held 23.5% of 2025 value and grows at 11.7% a year, the second-fastest pace in the region. Its chip equipment billings rose 90% to USD 31.5 billion in 2025 as foundries built large leading-edge capacity for AI and high-performance computing. Taiwan buys mostly single-wafer epitaxy, PECVD and atomic-scale tools for 2nm and advanced packaging rather than solar or coating systems. As a result, value per wafer is the highest in the region.
India and Southeast Asia grow fastest from a small base
Southeast Asia, India and the rest of Asia Pacific held 5.5% of 2025 value and grow at 13.7% a year, the fastest pace in the region. Chip equipment billings for the rest of the world, mainly Southeast Asia, rose 25% to USD 5.2 billion in 2025. The Dholera fab and the Singapore memory packaging projects noted above should multiply tool demand after 2026, while Malaysia adds power and packaging lines.
Tool plants and 2nm launches marked 2024 to 2026
| Development | Status and market relevance |
|---|---|
| In September 2024, Kokusai Electric completed a deposition and treatment equipment plant in Tonami, Toyama Prefecture. | In operation; part of a plan to double capacity |
| In February 2025, Lam Research committed more than Rs 10,000 crore of investment in Karnataka, India. | MoU signed with the state government |
| In April 2025, Rapidus started a 2nm pilot line in Chitose, Hokkaido. | Mass production targeted for 2027 |
| In December 2025, ASM opened an expanded Innovation Manufacturing Center in Hwaseong, South Korea, for ALD and PEALD tools. | In operation; manufacturing capacity expected to triple |
| In April 2026, Applied Materials introduced a selective nitride PECVD system and a gate-metal ALD system for 2nm transistors. | Being adopted by leading logic chipmakers |
Selective, atomic-scale and batch films define tool choice
- Selective and area-selective deposition places nitride or metal only where the device needs it, which cuts later etch and polish steps at 2nm.
- Plasma-enhanced and thermal ALD builds gate stacks and liners one atomic layer at a time, and ASM, Kokusai Electric and Tokyo Electron make these tools in Japan and South Korea.
- High-capacity LPCVD tubes for solar load wafers back to back, and Laplace's fifth-generation platform holds 2,880 wafers per tube with 88.5 GW of installed capacity, according to TaiyangNews.
- Multi-wafer MOCVD and epitaxy grows gallium nitride, silicon carbide and indium phosphide layers for power devices, lasers and ultrathin film stacks in photonics.
Need a Custom Version of This Report?
Tailor the scope, geography, or segments to your exact requirements.
- Custom geography or segment scope
- Direct access to our analyst team
Five global toolmakers face fast-rising Chinese rivals
Competition in chemical vapor deposition turns on process qualification, chamber productivity and service reach at a small number of very large fabs. Applied Materials, Lam Research and Tokyo Electron offer the broadest deposition lines and win most leading-edge logic and memory positions because their chambers are already qualified in production. ASM International leads in atomic-scale and epitaxial films, while Kokusai Electric leads in batch furnaces for memory makers. AIXTRON competes in compound-semiconductor reactors, where Chinese silicon carbide buyers placed large orders in 2025. NAURA and Piotech gain share inside Mainland China as fabs follow domestic purchasing goals, and Wonik IPS serves Korean memory makers. Merck supplies precursor chemicals and specialty gases across Taiwan, South Korea and Japan. Because a chamber that wins one film step usually keeps it for the life of the node, suppliers spend heavily on joint development with chipmakers.
How concentrated is CVD tool supply in the region?
CVD tool supply is concentrated at the leading edge and more crowded at mature nodes. Applied Materials, Lam Research, Tokyo Electron, ASM International and Kokusai Electric hold most qualified positions at 2nm logic, HBM and 3D NAND fabs, where process recipes and installed bases act as the main barrier to entry. Chinese makers such as NAURA and Piotech compete hard at mature nodes and memory lines inside China, helped by domestic purchasing goals. Korean specialists such as Wonik IPS supply Samsung Electronics and SK hynix. Margins sit mainly in new-node chambers, spare parts and service, while solar CVD tools earn the least.
Companies active in Asia Pacific CVD supply
| Company | Type | Role in the market |
|---|---|---|
| Applied Materials | Full-line equipment maker | PECVD, epitaxy and ALD platforms for 2nm logic and memory fabs across Asia |
| Lam Research | Full-line equipment maker | Deposition and etch tools for memory and logic; investing in Karnataka, India |
| Tokyo Electron | Full-line equipment maker | Batch thermal and single-wafer deposition systems built in Japan |
| ASM International | Deposition specialist | ALD, PEALD and epitaxy tools made at its Hwaseong center in South Korea |
| Kokusai Electric | Batch deposition specialist | Batch LPCVD and ALD furnaces made in Toyama for memory and logic fabs |
| NAURA Technology Group | Chinese equipment maker | Furnaces, CVD and other film tools for Chinese mature-node and memory fabs |
| Piotech | Chinese deposition specialist | PECVD and other thin-film tools; doubled its share at YMTC NAND lines |
| AIXTRON | MOCVD specialist | G10-SiC and G10-AsP reactors for silicon carbide and photonics makers |
| Wonik IPS | Korean equipment maker | Deposition tools for Samsung Electronics and SK hynix memory lines |
| Merck KGaA (EMD Electronics) | Precursor and materials supplier | Thin-film precursors and specialty gases from its Kaohsiung campus and Asian sites |
Qualification at a few fabs decides supplier returns
Credence Research's view is that this market is decided by film steps per wafer far more than by the number of new fabs. Nanosheet logic and HBM add selective, epitaxial and atomic-scale layers, so spending per wafer keeps rising even when wafer output grows slowly. Epitaxial film growth, rising at 12.3% a year, shows where that value goes. Suppliers already qualified at TSMC, Samsung Electronics and SK hynix should capture most of the gain, while Chinese makers take mature-node share at home. The most assumption-heavy estimate in this report is the regional split, because public billings data do not separate CVD from other tools.
Equipment billings and fab plans anchor the estimates
The report uses 2025 as the base year and 2026 to 2035 as the forecast period. Market values come from the Credence Research model, while regional, product type, end-use, application and technology splits are Credence Research estimates informed by public data. Sources include SEMI equipment billings and forecasts, China Semiconductor Industry Association and China Photovoltaic Industry Association data, U.S. Commerce Department rules, Indian Cabinet approvals and company releases on tools, plants and fab projects. No interviews or surveys were conducted for this edition of the report.
Leading-edge logic and memory carry growth to 2035
Through 2035, the market should reach USD 47.31 billion as 2nm and later logic nodes, HBM generations and new compound-semiconductor lines raise deposition spending per wafer. Mainland China will remain the largest market, but its share should slip as domestic tools cut prices and export rules limit leading-edge sales. Taiwan and South Korea should gain share through foundry and memory capacity, while India and Southeast Asia grow fastest from a small base. Precursors and services should rise faster than chemical vapor deposition tools, so suppliers with strong consumables and service businesses will hold the most stable earnings.
Leading-edge timing and China orders set the range
The range of outcomes depends mainly on how quickly 2nm and HBM capacity ramps in Taiwan, South Korea and Japan, and how far Chinese fabs cut imported tool orders. If AI budgets hold and India's first fab equips on schedule, deposition steps per wafer keep rising and equipment value compounds. A deeper memory downturn or tighter export rules would delay orders and shift Chinese spending to local suppliers. Solar tool demand matters less because its share of value is small and already shrinking.
| Scenario | CAGR, 2026–2035 | Value, 2035 | What has to hold |
|---|---|---|---|
| Downside | 8.9% | USD 40.15 billion | AI capex slows, memory prices fall and export rules tighten further on Chinese fabs |
| Base | 10.95% | USD 47.31 billion | 2nm and HBM capacity ramp near plan and India's first fab equips on schedule |
| Upside | 12.4% | USD 53.37 billion | AI demand stays strong, India and Southeast Asia add fabs and compound lines recover early |
Frequently Asked Questions
How big is the Asia Pacific chemical vapor deposition market?
Which country leads CVD demand in Asia Pacific?
Which area grows fastest in this market?
Which product type holds the largest share?
Why do 2nm chips raise CVD spending?
How do export controls affect CVD suppliers?
What are the main challenges in this market?
Which companies are active in this market?
Table of Content
Chapter 1 Market Segmentation
- 1.1 Segmentation Framework
- 1.1.1 Product and Service Classification
- 1.1.2 Application and End-Use Classification
- 1.1.3 Technology and Solution Classification
- 1.1.4 Customer and Distribution Channel Classification
- 1.1.5 Geographic Segmentation
- 1.1.6 Market Segment Definitions and Boundaries
- 1.2 By Product Type
- 1.2.1 CVD Equipment
- 1.2.2 CVD Precursor Materials
- 1.2.3 CVD Services
- 1.3 By End-Use Industry
- 1.3.1 Semiconductor Manufacturing
- 1.3.2 Photovoltaic Manufacturing
- 1.3.3 Industrial Coating Production
- 1.4 By Application
- 1.4.1 Dielectric Film Deposition
- 1.4.2 Conductive Film Deposition
- 1.4.3 Epitaxial Film Growth
- 1.4.4 Protective Film Deposition
- 1.5 By Technology
- 1.5.1 PECVD
- 1.5.2 LPCVD
- 1.5.3 MOCVD
- 1.5.4 Thermal and Specialized CVD
- 1.6 By Country
- 1.6.1 Mainland China
- 1.6.2 Taiwan
- 1.6.3 South Korea and Japan
- 1.6.4 Southeast Asia, India and Rest of Asia Pacific
Chapter 2 Introduction
- 2.1 Report Objectives and Scope
- 2.2 Product Definition and Industry Terminology
- 2.3 Market Inclusions and Exclusions
- 2.4 Research Process
- 2.4.1 Primary Research and Expert Interviews
- 2.4.2 Secondary Research and Source Review
- 2.4.3 Top-Down and Bottom-Up Estimation
- 2.4.4 Data Triangulation and Verification
- 2.5 Market Size Measurement Basis
- 2.5.1 2025: USD 16.69 billion → 2035: USD 47.31 billion
- 2.6 Historical and Forecast Reference Periods
- 2.6.1 Historical Period: 2018-2025
- 2.6.2 Base Year: 2025
- 2.6.3 Forecast Period: 2025-2035
- 2.7 Research Assumptions and Limitations
Chapter 3 Executive Summary
- 3.1 Market Snapshot and Key Findings
- 3.2 Base-Year Market Size, 2025
- 3.3 Forecast Market Size, 2035
- 3.4 Revenue and Volume Growth Outlook
- 3.5 Key Demand and Supply Indicators
- 3.6 Leading Market Segments
- 3.7 Fastest-Growing Market Opportunities
- 3.8 Regional Performance Highlights
- 3.9 Technology and Industry Transformation
- 3.10 Competitive Landscape Summary
- 3.11 Analyst View and Strategic Implications
Chapter 4 Asia Pacific Chemical Vapor Deposition Market Trends and Developments
- 4.1 Historical Industry Development, 2018-2025
- 4.2 Recent Market Trends and Developments
- 4.3 Demand and Customer Behavior Trends
- 4.4 Technology and Product Innovation
- 4.5 Artificial Intelligence, Automation and Digitalization
- 4.6 Local Manufacturing and Supply Chain Realignment
- 4.7 Industry Partnerships, Mergers and Acquisitions
- 4.8 Sustainability and Circular Economy Developments
- 4.9 Government and Private Sector Investment Trends
- 4.10 Emerging Business Models and Commercialization
- 4.11 Industry Developments and Announcements
Chapter 5 Asia Pacific Chemical Vapor Deposition Market Production, Supply and Demand Analysis
- 5.1 Demand Trend and Consumption Analysis, 2018-2025
- 5.2 Demand Forecast, 2025-2035
- 5.3 Production and Output Trend, 2018-2025
- 5.4 Production and Output Forecast, 2025-2035
- 5.5 Installed Capacity and Capacity Utilization
- 5.6 Company-Wise Production Plants and Statistics
- 5.6.1 Installed Production Capacity
- 5.6.2 Actual Production
- 5.6.3 Planned Capacity and Expansion Targets
- 5.7 Supply Chain Structure and Procurement Trends
- 5.8 Supply-Demand Gap and Bottlenecks
- 5.9 Import Dependence and Sourcing Structure
- 5.10 Contract Manufacturing and Outsourcing
- 5.11 Regional Supply and Demand Concentration
Chapter 6 Asia Pacific Chemical Vapor Deposition Market Pricing Analysis
- 6.1 Pricing Structure and Measurement
- 6.2 Historical Pricing Trends, 2018-2025
- 6.3 Pricing Outlook, 2025-2035
- 6.4 Average Selling Price and Unit Economics
- 6.5 Pricing by Product and Market Segment
- 6.6 Geographic Pricing Differences
- 6.7 Key Input, Energy, Labor and Logistics Costs
- 6.8 Contract Pricing and Purchasing Models
- 6.9 Pricing Sensitivity and Competitive Positioning
- 6.10 Price, Margin and Profitability Implications
Chapter 7 Asia Pacific Chemical Vapor Deposition Market Dynamics
- 7.1 Market Growth Drivers
- 7.1.1 Demand-Side Drivers
- 7.1.2 Technology and Innovation Drivers
- 7.1.3 Infrastructure and Investment Drivers
- 7.1.4 Regulatory and Policy Drivers
- 7.2 Market Restraints
- 7.2.1 Cost and Affordability Constraints
- 7.2.2 Technology and Adoption Barriers
- 7.2.3 Supply Chain and Operational Constraints
- 7.3 Market Challenges
- 7.3.1 Competitive Pressure and Margin Erosion
- 7.3.2 Skills, Infrastructure and Implementation Gaps
- 7.4 Emerging Market Opportunities
- 7.5 Market Dynamics Impact and Time-Horizon Assessment
Chapter 8 Asia Pacific Chemical Vapor Deposition Value Chain Analysis
- 8.1 Industry Value Chain Overview
- 8.2 Upstream Suppliers and Critical Inputs
- 8.3 Technology and Component Providers
- 8.4 Manufacturing or Service Delivery
- 8.5 Distribution, Channel Partners and Integrators
- 8.6 Downstream Applications and End Users
- 8.7 Value Addition and Profit Pools
- 8.8 Vertical Integration and Outsourcing
- 8.9 Supplier Concentration and Risk
- 8.10 Supply Chain Localization and Resilience
Chapter 9 Asia Pacific Chemical Vapor Deposition Market Regulations and Policies
- 9.1 Relevant Laws, Standards and Compliance Frameworks
- 9.2 Product, Service, Safety and Quality Requirements
- 9.3 Government Policies, Incentives and Subsidies
- 9.4 Imports, Exports and Trade Barriers
- 9.5 Public Procurement and Local Content Requirements
- 9.6 Environmental and Sustainability Compliance
- 9.7 Upcoming Policy Changes and Market Implications
Chapter 10 Asia Pacific Chemical Vapor Deposition Market Hotspots and Opportunities
- 10.1 Market Opportunity Mapping and Growth Hotspots
- 10.2 High-Growth Applications and Customer Groups
- 10.3 Underserved Markets and White-Space Opportunities
- 10.4 Emerging Technology and Product Opportunities
- 10.5 New Capacity and Investment Hotspots
- 10.6 Market Entry and Expansion Opportunities
- 10.7 Distribution and Partnership Opportunities
- 10.8 Near-Term and Long-Term Commercial Potential
- 10.9 Opportunity Attractiveness and Execution Risks
Chapter 11 Asia Pacific Chemical Vapor Deposition Market Outlook, 2025-2035
- 11.1 Market Size and Analysis
- 11.1.1 Revenue (Market Measurement: 2025: USD 16.69 billion → 2035: USD 47.31 billion)
- 11.1.2 Market Volume and Quantity Sold
- 11.1.3 Historical Market Size, 2018-2025
- 11.1.4 Base-Year Market Size, 2025
- 11.2 Market Forecast, 2025-2035
- 11.2.1 Revenue Forecast to 2035
- 11.2.2 Volume Forecast to 2035
- 11.2.3 CAGR and Year-on-Year Growth
- 11.2.4 Incremental Revenue Opportunity
- 11.3 Forecast Assumptions and Scenario Analysis
- 11.3.1 Base-Case Forecast
- 11.3.2 Optimistic and Conservative Scenarios
- 11.3.3 Technology, Pricing and Policy Sensitivities
- 11.4 Market Attractiveness and Growth Outlook
Chapter 12 Asia Pacific Chemical Vapor Deposition Market Segmentation and Outlook
- 12.1 Segmentation Summary and Market Shares, 2025
- 12.2 Largest and Fastest-Growing Segments
- 12.3 By Product Type - Market Size and Forecast, 2025-2035
- 12.3.1 Segment Definition and Scope
- 12.3.2 Historical Market Size, 2018-2025
- 12.3.3 Revenue Forecast, 2025-2035
- 12.3.4 Volume Forecast, 2025-2035
- 12.3.5 Base-Year Market Share, 2025
- 12.3.6 Segment CAGR and Growth Drivers
- 12.3.7 Subsegment Market Size and Forecast
- 12.3.7.1 CVD Equipment
- 12.3.7.2 CVD Precursor Materials
- 12.3.7.3 CVD Services
- 12.3.8 Subsegment Pricing and Adoption Trends
- 12.3.9 Leading Suppliers and Competition
- 12.3.10 Regional Demand and Opportunities
- 12.4 By End-Use Industry - Market Size and Forecast, 2025-2035
- 12.4.1 Segment Definition and Scope
- 12.4.2 Historical Market Size, 2018-2025
- 12.4.3 Revenue Forecast, 2025-2035
- 12.4.4 Volume Forecast, 2025-2035
- 12.4.5 Base-Year Market Share, 2025
- 12.4.6 Segment CAGR and Growth Drivers
- 12.4.7 Subsegment Market Size and Forecast
- 12.4.7.1 Semiconductor Manufacturing
- 12.4.7.2 Photovoltaic Manufacturing
- 12.4.7.3 Industrial Coating Production
- 12.4.8 Subsegment Pricing and Adoption Trends
- 12.4.9 Leading Suppliers and Competition
- 12.4.10 Regional Demand and Opportunities
- 12.5 By Application - Market Size and Forecast, 2025-2035
- 12.5.1 Segment Definition and Scope
- 12.5.2 Historical Market Size, 2018-2025
- 12.5.3 Revenue Forecast, 2025-2035
- 12.5.4 Volume Forecast, 2025-2035
- 12.5.5 Base-Year Market Share, 2025
- 12.5.6 Segment CAGR and Growth Drivers
- 12.5.7 Subsegment Market Size and Forecast
- 12.5.7.1 Dielectric Film Deposition
- 12.5.7.2 Conductive Film Deposition
- 12.5.7.3 Epitaxial Film Growth
- 12.5.7.4 Protective Film Deposition
- 12.5.8 Subsegment Pricing and Adoption Trends
- 12.5.9 Leading Suppliers and Competition
- 12.5.10 Regional Demand and Opportunities
- 12.6 By Technology - Market Size and Forecast, 2025-2035
- 12.6.1 Segment Definition and Scope
- 12.6.2 Historical Market Size, 2018-2025
- 12.6.3 Revenue Forecast, 2025-2035
- 12.6.4 Volume Forecast, 2025-2035
- 12.6.5 Base-Year Market Share, 2025
- 12.6.6 Segment CAGR and Growth Drivers
- 12.6.7 Subsegment Market Size and Forecast
- 12.6.7.1 PECVD
- 12.6.7.2 LPCVD
- 12.6.7.3 MOCVD
- 12.6.7.4 Thermal and Specialized CVD
- 12.6.8 Subsegment Pricing and Adoption Trends
- 12.6.9 Leading Suppliers and Competition
- 12.6.10 Regional Demand and Opportunities
- 12.7 By Country - Market Size and Forecast, 2025-2035
- 12.7.1 Segment Definition and Scope
- 12.7.2 Historical Market Size, 2018-2025
- 12.7.3 Revenue Forecast, 2025-2035
- 12.7.4 Volume Forecast, 2025-2035
- 12.7.5 Base-Year Market Share, 2025
- 12.7.6 Segment CAGR and Growth Drivers
- 12.7.7 Subsegment Market Size and Forecast
- 12.7.7.1 Mainland China
- 12.7.7.2 Taiwan
- 12.7.7.3 South Korea and Japan
- 12.7.7.4 Southeast Asia, India and Rest of Asia Pacific
- 12.7.8 Subsegment Pricing and Adoption Trends
- 12.7.9 Leading Suppliers and Competition
- 12.7.10 Regional Demand and Opportunities
- 12.8 Segment Growth Comparison
- 12.9 Segment Attractiveness and Priority Matrix
Chapter 13 Asia Pacific Chemical Vapor Deposition End-Use and Application Market Outlook
- 13.1 End-Use Industry and Customer Demand Structure
- 13.2 Leading Applications and Customer Groups
- 13.3 End-Use Market Size, Share and Forecast
- 13.4 Major End-Use Industry Deep Dives
- 13.4.1 Customer Requirements and Use Cases
- 13.4.2 Demand and Replacement Cycles
- 13.4.3 Technical and Regulatory Considerations
- 13.4.4 Purchasing and Procurement Models
- 13.4.5 Leading Vendors and Distribution Channels
- 13.4.6 Forecast and Commercial Opportunities
- 13.5 Emerging Applications and Cross-Segment Demand
- 13.6 End-Use Industry Investment Priorities
Chapter 14 Asia Pacific Chemical Vapor Deposition Geographic Market Outlook, 2025-2035
- 14.1 Regional Market Size and Country-Level Shares, 2025
- 14.2 Country Market Size Comparison, 2025
- 14.3 Country Market Forecasts, 2025-2035
- 14.4 Subregional Industrial and Demand Clusters
- 14.5 Intra-Regional Pricing and Cost Differences
- 14.6 Cross-Border Trade and Supply Networks
- 14.7 Regional Supply and Demand Balances
- 14.8 Country Opportunity Comparison and Prioritization
Note: Every listed country is covered on the structure shown under the first country.
Chapter 15 Asia Pacific Chemical Vapor Deposition Technology, Innovation and Sustainability Outlook
- 15.1 Technology Landscape and Maturity
- 15.2 Product, Process and Service Innovation
- 15.3 AI, Automation and Digital Tools in the Industry
- 15.4 Technology Adoption and Performance Benchmarking
- 15.5 Innovation Pipeline and R&D Investment
- 15.6 Patent and Intellectual Property Trends
- 15.7 Energy Efficiency and Resource Management
- 15.8 Sustainability, Recycling and Circularity
- 15.9 Technology Roadmap, 2025-2035
- 15.10 Risks of Obsolescence and Technology Substitution
Chapter 16 Asia Pacific Chemical Vapor Deposition Market Key Strategic Imperatives
- 16.1 Growth and Market Entry Priorities
- 16.2 High-Return Products and Segments
- 16.3 Pricing, Profitability and Cost Optimization
- 16.4 Technology Investment and Product Differentiation
- 16.5 Supply Chain Localization and Resilience
- 16.6 Distribution and Customer Acquisition
- 16.7 Partnership, Acquisition and Capacity Strategy
- 16.8 Regional Expansion Priorities
- 16.9 Short-, Medium- and Long-Term Actions
Chapter 17 Competition Outlook
- 17.1 Industry Competition Characteristics
- 17.2 Market Structure and Concentration
- 17.3 Market Share and Competitive Positioning, 2025
- 17.4 Company-Wise Revenue and Product Benchmarking
- 17.5 Production and Service Capacity Benchmarking
- 17.6 Technology, Pricing and Differentiation
- 17.7 Regional Footprint and Distribution Strength
- 17.8 Mergers, Acquisitions and Strategic Alliances
- 17.9 New Entrants and Competitive Threats
- 17.10 Porter's Five Forces and Industry Attractiveness
- 17.11 Competitive Outlook, 2025-2035
Chapter 18 Company Profiles
- 18.1 Company Coverage and Selection Criteria
- 18.2 Applied Materials
- 18.2.1 Business Description
- 18.2.2 Company Ownership and Geographic Presence
- 18.2.3 Product and Service Portfolio
- 18.2.4 Manufacturing and Operating Footprint
- 18.2.5 Production Capacity and Expansion Plans
- 18.2.6 Financial Performance and Investment
- 18.2.7 Market Share and Competitive Position
- 18.2.8 Technology and Innovation Capabilities
- 18.2.9 Strategic Alliances or Partnerships
- 18.2.10 Recent Developments
- 18.2.11 Growth Strategy and Outlook
- 18.3 Lam Research
- 18.4 Tokyo Electron
- 18.5 ASM International
- 18.6 Kokusai Electric
- 18.7 NAURA Technology Group
- 18.8 Piotech
- 18.9 AIXTRON
- 18.10 Wonik IPS
- 18.11 Merck KGaA (EMD Electronics)
- 18.12 Other Relevant Market Participants
Note: Every listed company is profiled on the structure shown under the first company. The company list is preliminary and may change based on research findings, market developments, data availability and client requirements.
Chapter 19 Disclaimer
- 19.1 Research and Forecast Disclaimer
- 19.2 Data Source and Estimation Limitations
Note: The depth of individual sections depends on data availability for this market. Volume, capacity, trade and other unit-based metrics are included where applicable.

