
Assistants and meeting rooms now anchor screen demand
The North America smart displays market was valued at USD 3.09 billion in 2025 and is projected to increase from USD 3.65 billion in 2026 to USD 15.96 billion by 2035, registering a CAGR of 17.82% during 2026–2035. Demand comes from households replacing older screens to reach generative assistants and from offices, schools, stores and hospitals installing managed interactive panels. The United States held the largest share, 87.5% in 2025, because Alexa+ and Gemini for Home both reached U.S. homes before other countries. Mexico is the fastest-growing country at 18.91% a year, helped by rapid smart TV ownership among connected households. The commercial side changed sharply after Microsoft ended Teams Rooms support on Windows 10 in October 2025, which required rooms to move to Windows 11 and some certified devices to be replaced. Connectivity standards are also easing installation, as Matter 1.5 arrived in November 2025 with camera and closure support that a wall or countertop screen can control.
What counts as a smart display in North America?
The market counts connected screens that run an assistant, managed applications or an embedded experience, sold to households, retailers, hospitality operators, offices, schools, hospitals and public agencies. Smart displays range from the $179.99 Echo Show 8 on a retail shelf to an interactive panel ordered through an integrator, so demand spans two very different purchase paths.
The market excludes ordinary televisions, monitors without an assistant or managed software, phones and tablets, and paid assistant subscriptions. Value is counted at the point of sale to the end buyer across brand-direct, consumer retail and commercial integration channels.
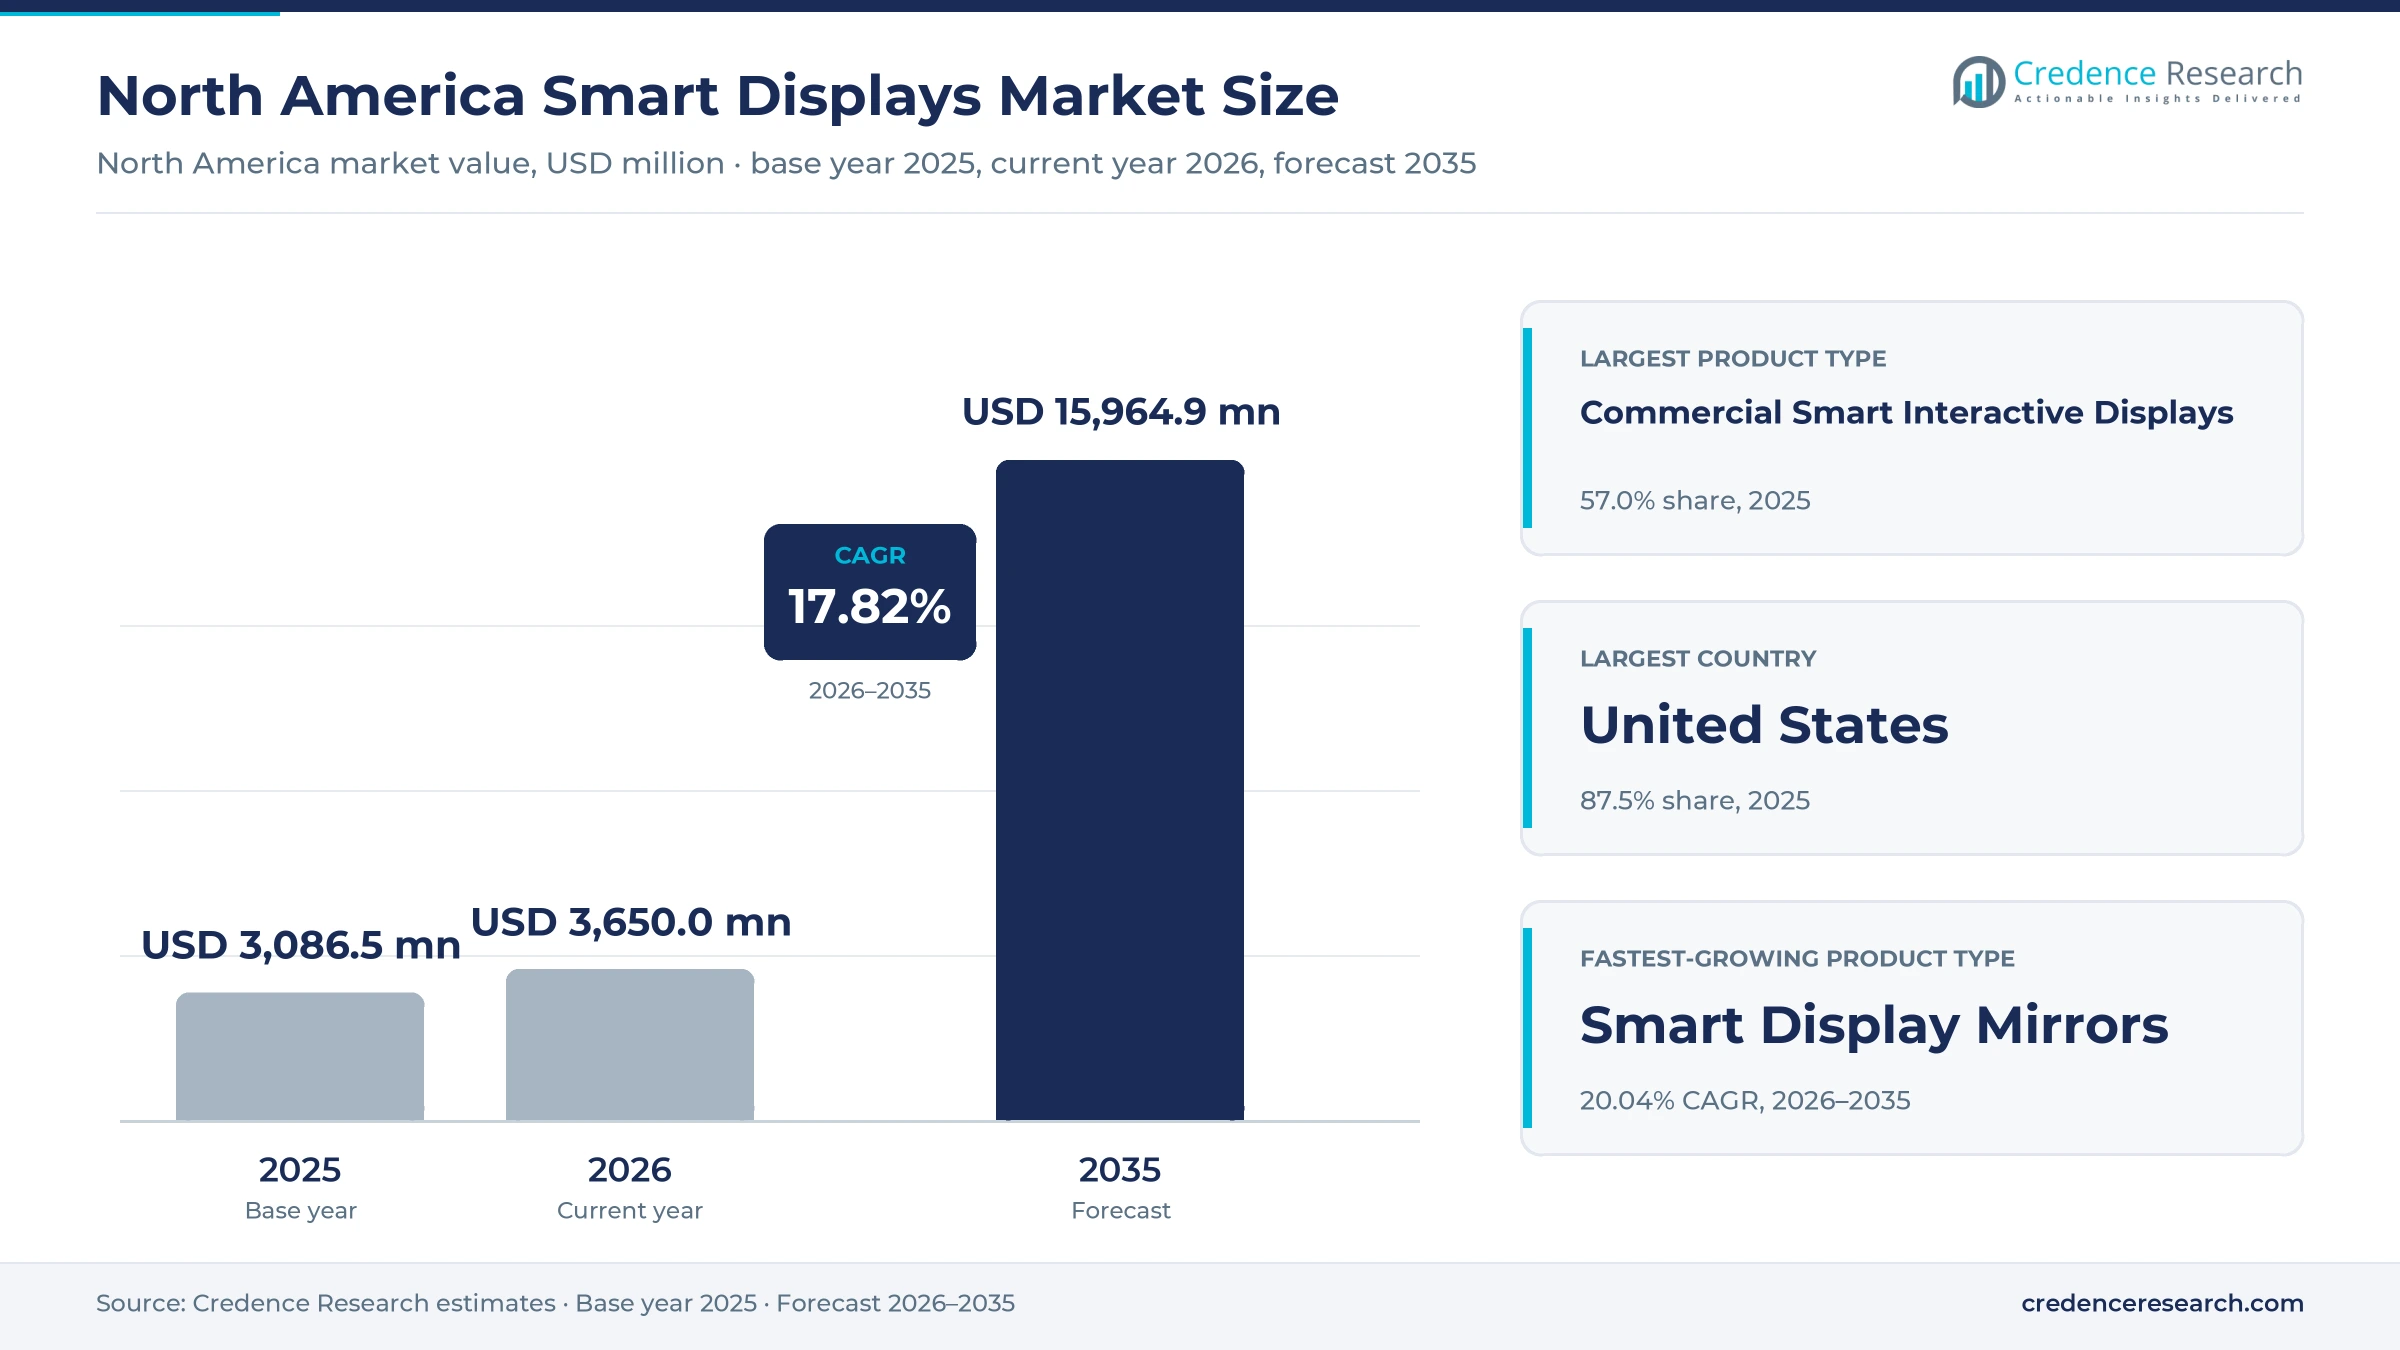
North America Smart Displays Market Insights
- The market grows from USD 3.09 billion in 2025 to USD 15.96 billion by 2035, a 17.82% CAGR over 2026–2035, as assistants and managed software widen what screens do.
- The United States led with 87.5% of 2025 value because Alexa+ reached all U.S. users in February 2026 and Gemini for Home started with U.S. homes.
- Commercial smart interactive displays held 57.0% of 2025 value, supported by meeting room replacement after Windows 10 support ended on Oct. 14, 2025.
- Matter 1.5, released Nov. 20, 2025, added cameras and closures, which gives a screen more devices to control without brand-specific installation work.
- Microsoft stopped Surface Hub 3 production, according to Windows Central in April 2026, which opens room budgets to Samsung, LG and other Teams Rooms panel suppliers.
Commercial panels lead while households remain top buyers
Why do commercial panels outsell countertop screens?
Based on product type, the market is categorized into consumer smart home displays, commercial smart interactive displays and smart display mirrors. Commercial Smart Interactive Displays led with 57.0% of 2025 value because unit prices are far higher, with the Surface Hub 3 listed at $9,499.99 for 50 inches, according to Windows Central, against $179.99 for an Echo Show 8. Smart Display Mirrors grow fastest at 20.04% a year as new entrants return to a category Lululemon left in December 2023. Athletech News reported in September 2026 that Magic AI raised $11 million to expand its U.S. mirror business.
Which uses pay for the most screens?
Based on application, the market is categorized into home management, customer transactions, collaboration and learning, and fitness and virtual try-on. Home Management led with 36.0% of 2025 value because every new assistant release targets the kitchen and living room first, as Amazon did by shipping its November 2025 Echo Show models with Alexa+ Early Access, according to iClarified. Collaboration and Learning grows fastest at 18.87% a year as replacement is compulsory for rooms whose certified devices cannot upgrade. Microsoft stated that Teams Rooms devices unable to move from Windows 10 to Windows 11 after Oct. 14, 2025, must be replaced.
Who signs the largest purchase orders?
Based on customer type, the market is categorized into household buyers, retail and hospitality operators, corporate and education buyers, and healthcare and public-service buyers. Household Buyers led with 38.0% of 2025 value because Prime membership now removes the assistant fee, with Alexa+ free for members and $19.99 a month otherwise, according to Neowin. Healthcare and Public-Service Buyers grow fastest at 19.41% a year as hospitals link screens to patient care. Aceso and Samsung Electronics America said in November 2025 that one seven-hospital Northeast system runs more than 1,000 connected displays.
Where does value sit across price points?
Based on price tier, the market is categorized into below USD 250, USD 250 to below USD 2,500, and USD 2,500 and above. USD 2,500 and Above led with 40.0% of 2025 value because room panels carry high list prices, including $22,999.99 for the 85-inch Surface Hub 3, according to Windows Central. USD 250 to Below USD 2,500 grows fastest at 18.96% a year as lower-cost specialty hardware finds buyers between countertop and room systems. Athletech News reported that the Magic AI mirror sells for $1,499 in the U.S., marked down from $1,999, with no required subscription.
| Segment Group | Leading Sub-segment | Share, 2025 | Fastest-growing Sub-segment | CAGR, 2026–2035 |
|---|---|---|---|---|
| By Product Type | Commercial Smart Interactive Displays | 57.0% | Smart Display Mirrors | 20.04% |
| By Application | Home Management | 36.0% | Collaboration and Learning | 18.87% |
| By Customer Type | Household Buyers | 38.0% | Healthcare and Public-Service Buyers | 19.41% |
| By Price Tier | USD 2,500 and Above | 40.0% | USD 250 to Below USD 2,500 | 18.96% |
Request a Free Sample
Fill in your details and we'll send you a free sample report.
- Sample data tables & charts
- Research methodology
AI refresh and room system retirement drive purchases
Generative AI hardware refresh pulls households to new screens
Generative assistants give households a reason to replace older screens, because the newest features arrive on newer hardware first. Amazon priced the Echo Show 8 at $179.99 and the Echo Show 11 at $219.99 for their Nov. 12, 2025, release, according to iClarified. Every new Echo device also shipped with Alexa+ Early Access. TechCrunch reported that Alexa+ opened to all U.S. users in February 2026, after reaching more than a million people by June 2025. Google began its Gemini for Home rollout on Oct. 28, 2025, with U.S. homes first, according to Android Authority. As a result, smart displays priced below USD 250 carry most household replacement demand, since the United States received both assistants ahead of its neighbors.
Commercial workflow automation raises the value of each panel
Commercial buyers now pay for displays that remove manual work, which raises spending per room beyond the cost of the glass. Samsung Newsroom reported in February 2025 that the company's 2025 Interactive Display runs Android 15 and generates AI Summary recaps of lectures and meetings. The same release said SmartThings Pro adjusts power, volume and brightness according to occupancy and operating hours, which suits commercial signage networks spread across many sites. Aceso and Samsung Electronics America also described demand from a seven-hospital system using more than 1,000 displays for patient education and staff messaging. In turn, commercial smart interactive displays held 57.0% of 2025 value, because software handles scheduling and messaging across entire estates.
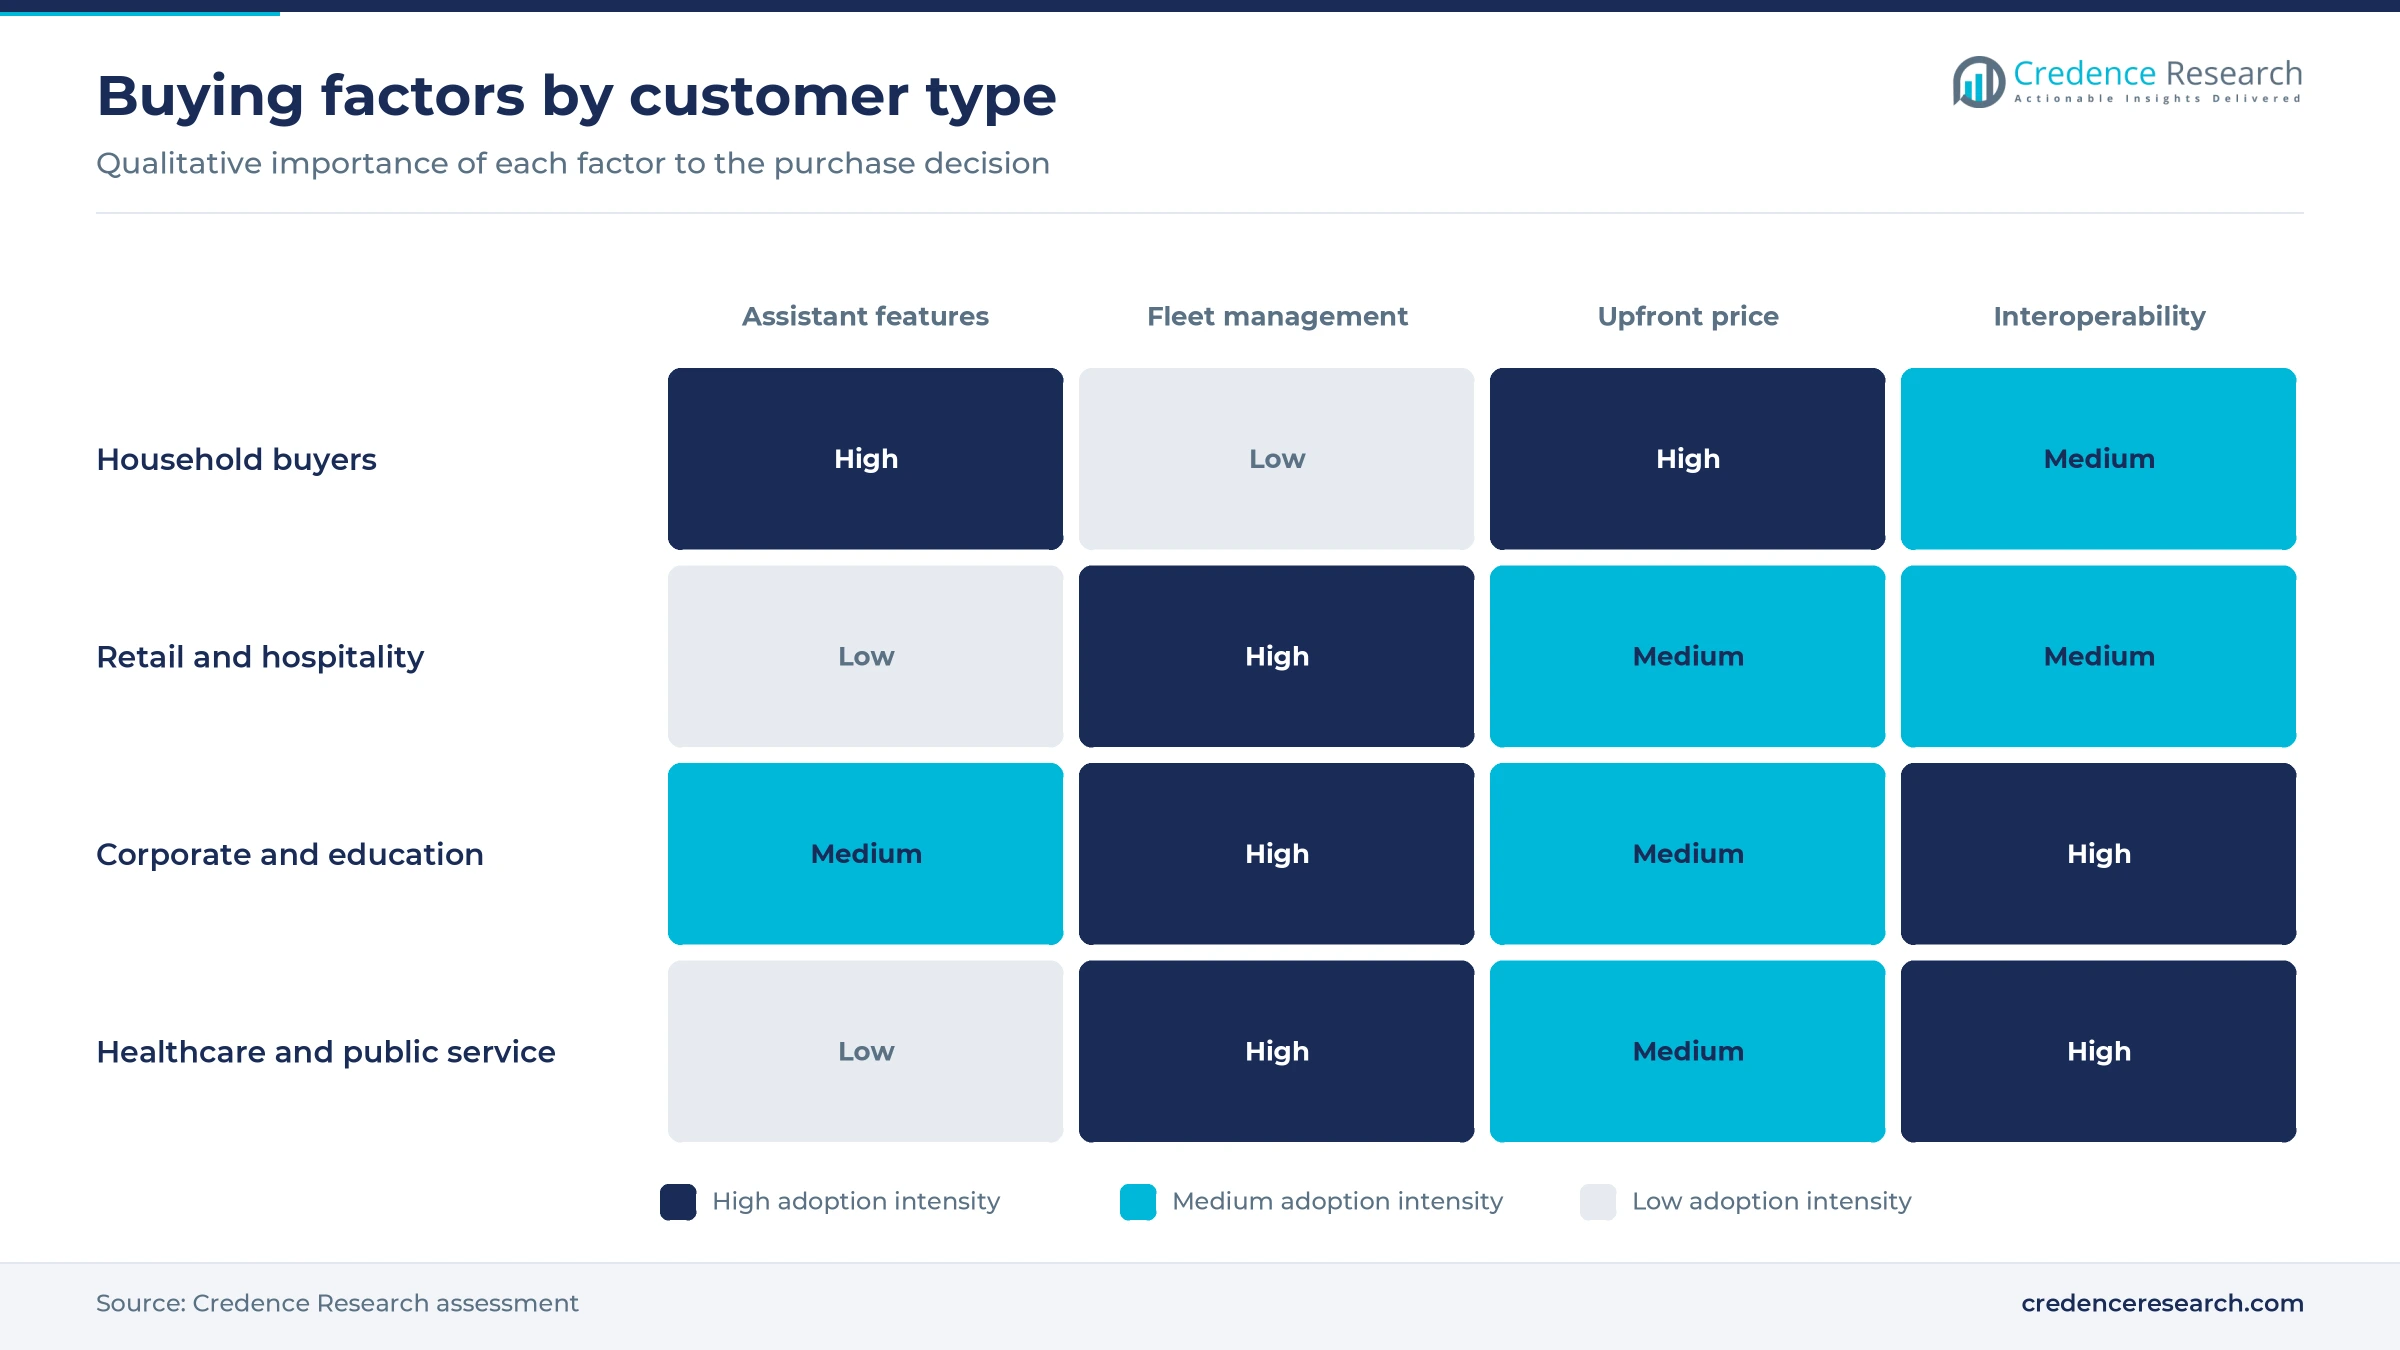
Interoperable commissioning cuts installation effort for screens
Simpler setup widens the audience for a screen, because a display is most useful when it can reach devices from several brands. The Connectivity Standards Alliance released Matter 1.5 on Nov. 20, 2025, adding cameras, closures, soil sensors and energy tariff data to the common language. The trade site Matter-Smarthome counted over 750 Matter products in January 2026, excluding color and size variants. MatterAlpha reported that SmartThings earned Matter 1.4 certification in March 2025 and can now join existing Thread networks rather than run an isolated one. This is important for countertop screens, which increasingly compete with home automation hubs as the household control point. Consequently, installers and households spend less time pairing devices, which supports Home Management as the largest use at 36.0%.
Windows 10 retirement forces some meeting room replacement
Room system lifecycles now create purchases that do not depend on discretionary budgets. Microsoft ended Teams Rooms support on Windows 10 on Oct. 14, 2025, and devices on extended security updates are not covered, so ineligible hardware must be replaced. Microsoft's Surface Hub guidance also said Windows 10 Team edition received no extended support after that date, and it pointed owners of the first model to a hardware refresh. Owners of the Surface Hub 2S had to move to a Windows 11 platform, with one migration app available only until Dec. 14, 2025. Consequently, Collaboration and Learning grows fastest at 18.87% a year, because organizations are buying replacements while also rethinking which rooms need interactive screens.
Paid assistant tiers and open classroom software advance
Shift from one-time hardware sales to paid assistant tiers
Vendors increasingly treat the screen as an entry point to recurring assistant revenue, which changes how buyers compare total cost. Google Home Premium costs $10 a month for Gemini Live and $20 a month for video history search and Daily Summaries, according to Droid Life. The same report priced the Google Home Speaker at $99, which positions voice-first speakers as a low-cost path into the paid tier. Amazon takes a different route, bundling Alexa+ with Prime and charging others $19.99 a month. In Mexico, IT Sitio reported a 399-peso monthly price for non-Prime users. As a result, subscription income sits outside the hardware value counted here, while entry models below USD 250 work as the way in.
Rise of open Google and Android software on classroom panels
School technology teams increasingly want panels that fit the accounts and management tools they already run. LG said in June 2024 that its CreateBoard TR3DK Gen 2 ships with Google Play on Android 13, while its OPS-C001 module adds ChromeOS Flex to new and existing boards. That design gives classroom whiteboards a software upgrade path without replacing the screen. Samsung's 2025 Interactive Display moved to Android 15 with Circle to Search, according to its February 2025 release. LG then returned to ISTE Live in Orlando from June 29 to July 1, 2026, promoting CreateBoard with a five-year limited warranty for education buyers. In turn, corporate and education buyers now compare suppliers on software rather than panel specifications alone.
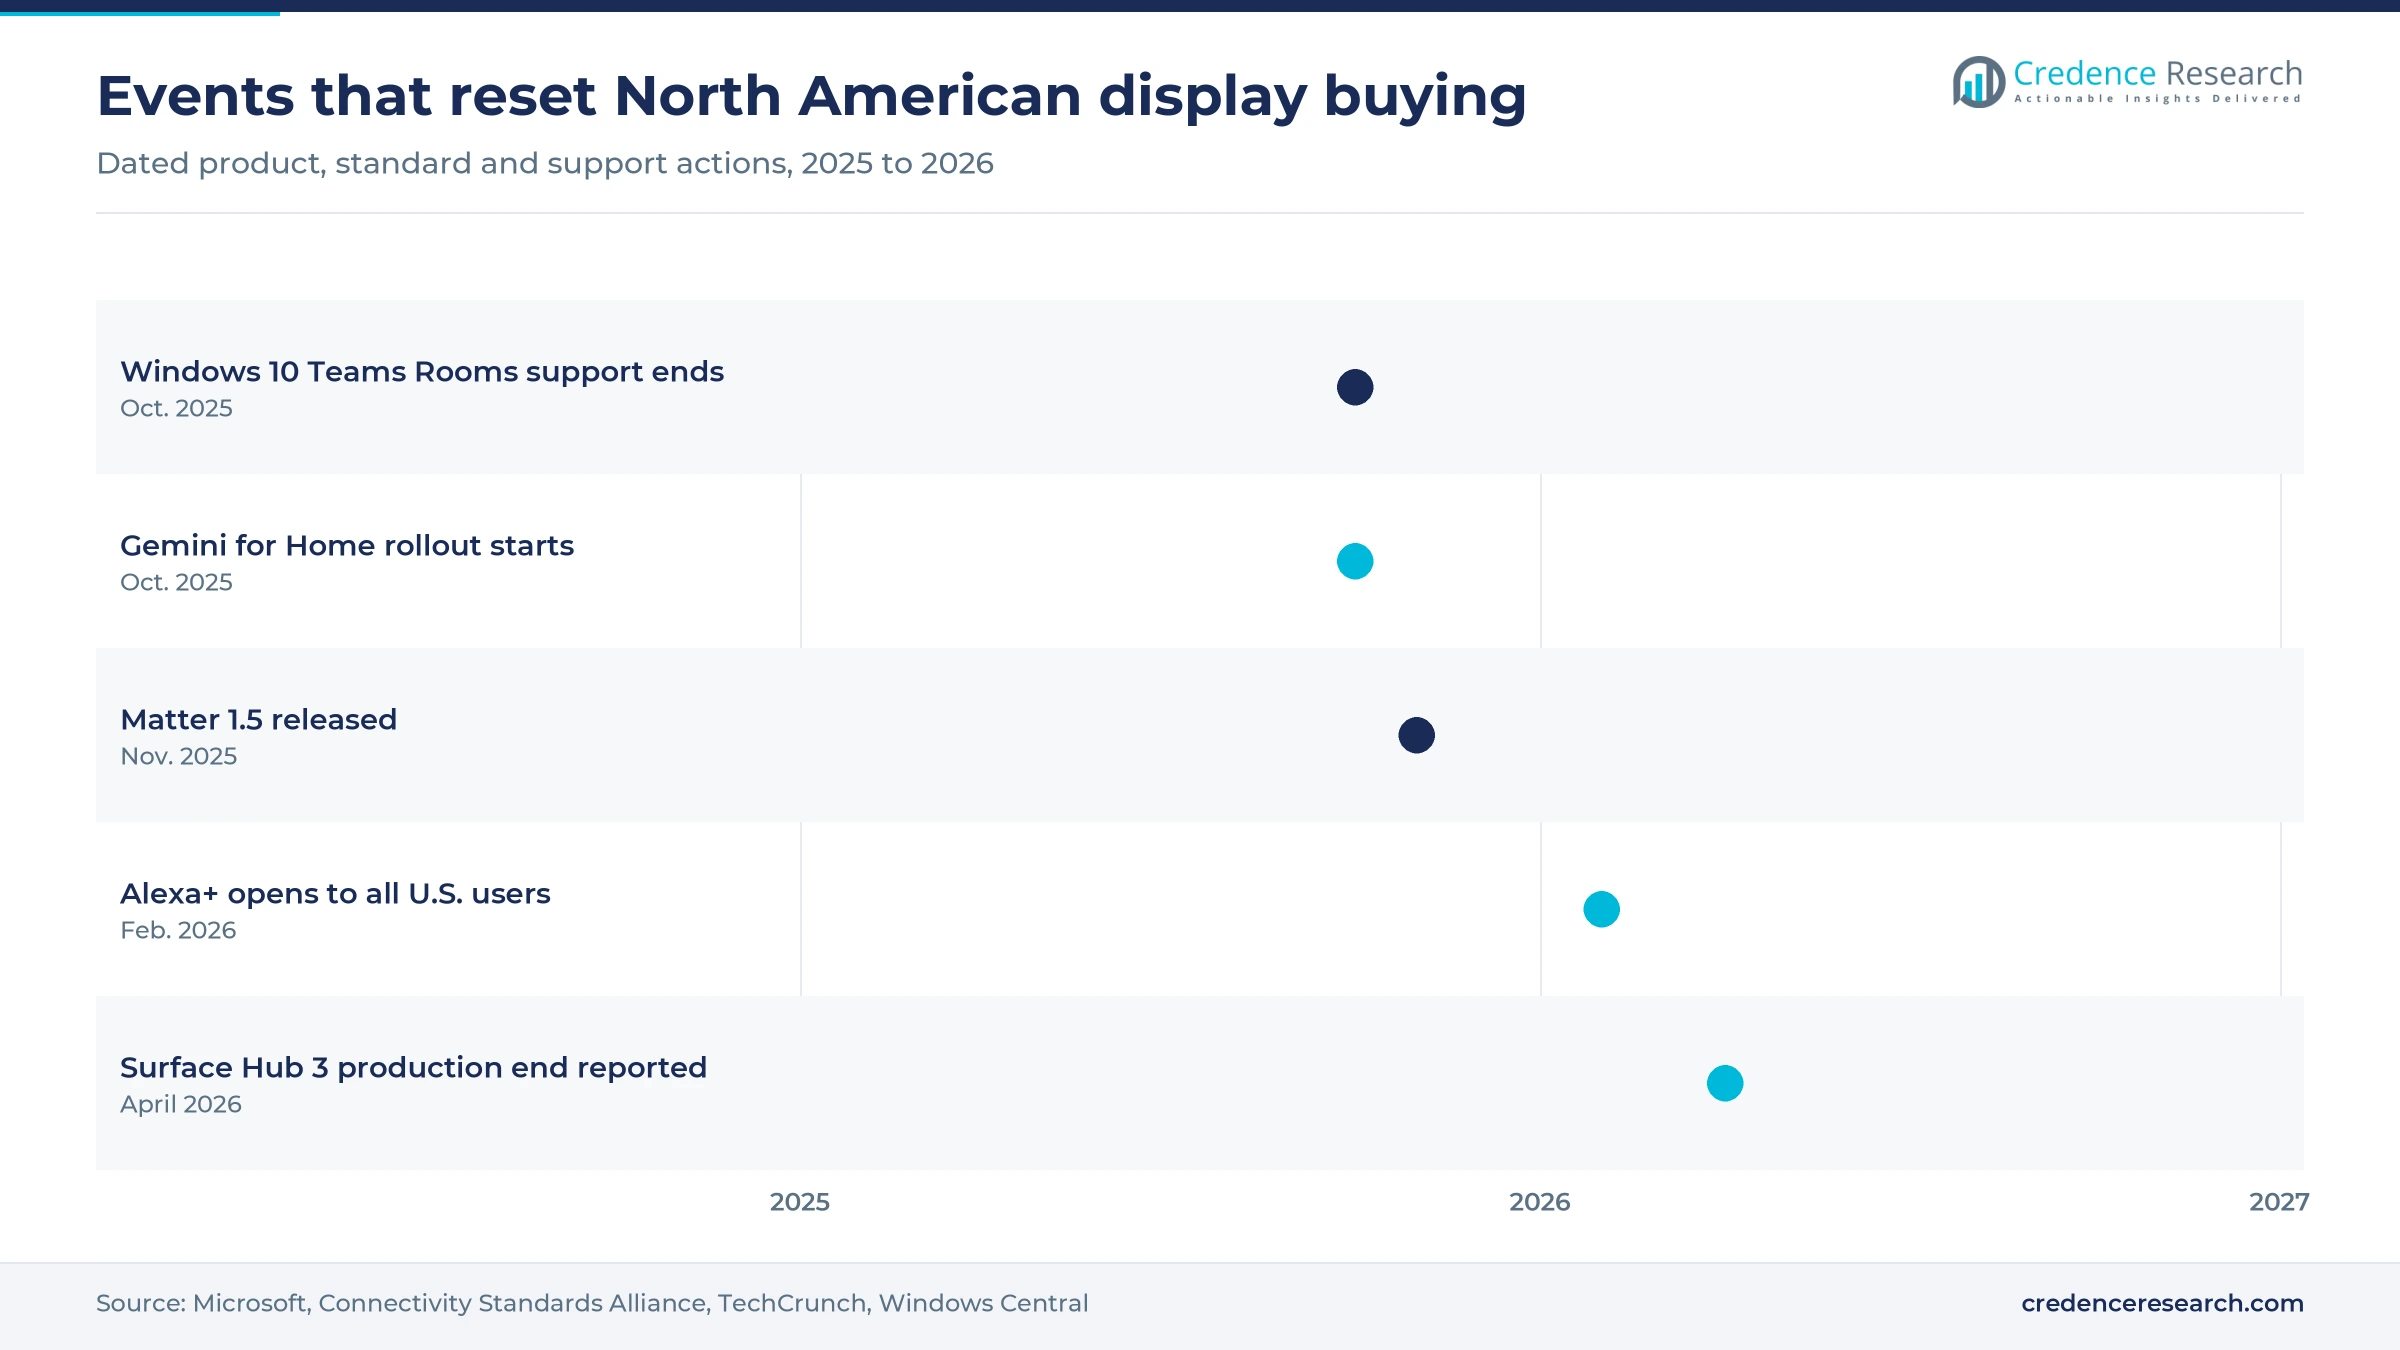
Opening in Mexico as smart TV households meet new assistants
Mexico offers an opening because connected households are already comfortable with an app-driven screen in the home. INEGI reported that 75.6% of Mexican households with a television owned a smart TV in 2025, up 6.6 percentage points in one year, and that 78.3% of households had internet access, compared with 39.1% in 2015. IT Sitio reported that Amazon scheduled the Alexa+ launch in Mexico for Jan. 22, 2026, with Prime at 99 pesos a month and priority for new Echo buyers. Prices still decide the pace, since World Bank data put Mexico's 2025 GDP per person at $13,889 against $90,027 in the United States. Consequently, suppliers with entry-priced models and Prime bundles stand to gain most as Mexican households upgrade.
Opening for fitness mirrors after a major brand left the field
Home fitness mirrors present an opening because a large brand exit left owners without a clear successor. Retail Dive reported that Lululemon, which bought Mirror for $500 million in 2020, said in September 2023 it would stop selling the product by the end of that year. Tonal responded with $250 off refurbished trainers and free device removal for former owners. Athletech News reported in September 2026 that Magic AI raised an $11 million Series B to grow in the U.S., where it sells a $1,499 mirror with an optional plan of about $22 a month. The company reports over 20,000 members across all 50 states. Smart Display Mirrors therefore grow at 20.04% a year from a small base.
Memory costs, tariffs and uneven Matter support slow buyers
Memory costs push entry prices upward
Component costs threaten the low-priced models that bring first-time buyers into the category. BGR reported on Aug. 25, 2026, that Amazon raised the Echo Dot from $49.99 to $79.99 and the Fire TV Stick 4K Max from $59.99 to $84.99, citing memory and storage costs. Display models use similar parts, so households comparing prices near the USD 250 boundary may delay replacement. Vendors can respond by trimming storage, using promotions tied to Prime or shifting margin toward subscriptions.
Tariff rules add paperwork for importers
Trade policy adds cost and administrative risk for suppliers that import panels and processors. According to a January 2026 CH Robinson advisory, a 25% Section 232 tariff on certain semiconductors and derivative parts took effect on Jan. 15, 2026, while exclusions for consumer and public-sector uses may require end-use certifications. Importers selling across retail and government channels therefore need careful classification records. Larger suppliers can absorb that compliance work more easily than small integrators, and many will build the cost into commercial quotes.
Uneven Matter support frustrates installers
Standards progress does not reach every platform at once, which leaves buyers with inconsistent results across brands. The trade site Matter-Smarthome reported in January 2026 that many ecosystems still supported only Matter 1.2 or 1.3, and that Alexa lacked leak sensor support, so an Ikea water detector could not integrate. Parallel Thread networks also caused connection problems for households running several platforms at once. Households may blame the screen for these failures, which raises support costs, so vendors must publish clear compatibility lists and ship Thread 1.4 credential sharing.
School budgets exclude most display spending
Education demand depends on local budgets because the largest federal connectivity program does not fund the screens themselves. A December 2025 policy brief from the National Association of Elementary School Principals said E-Rate offered more than $5 billion in fiscal 2025 but cannot pay for devices. It also noted that the FCC reversed Wi-Fi and hotspot eligibility in September 2025. Districts must therefore fund panels from their own capital plans, which lengthens sales cycles and favors suppliers offering long warranties.
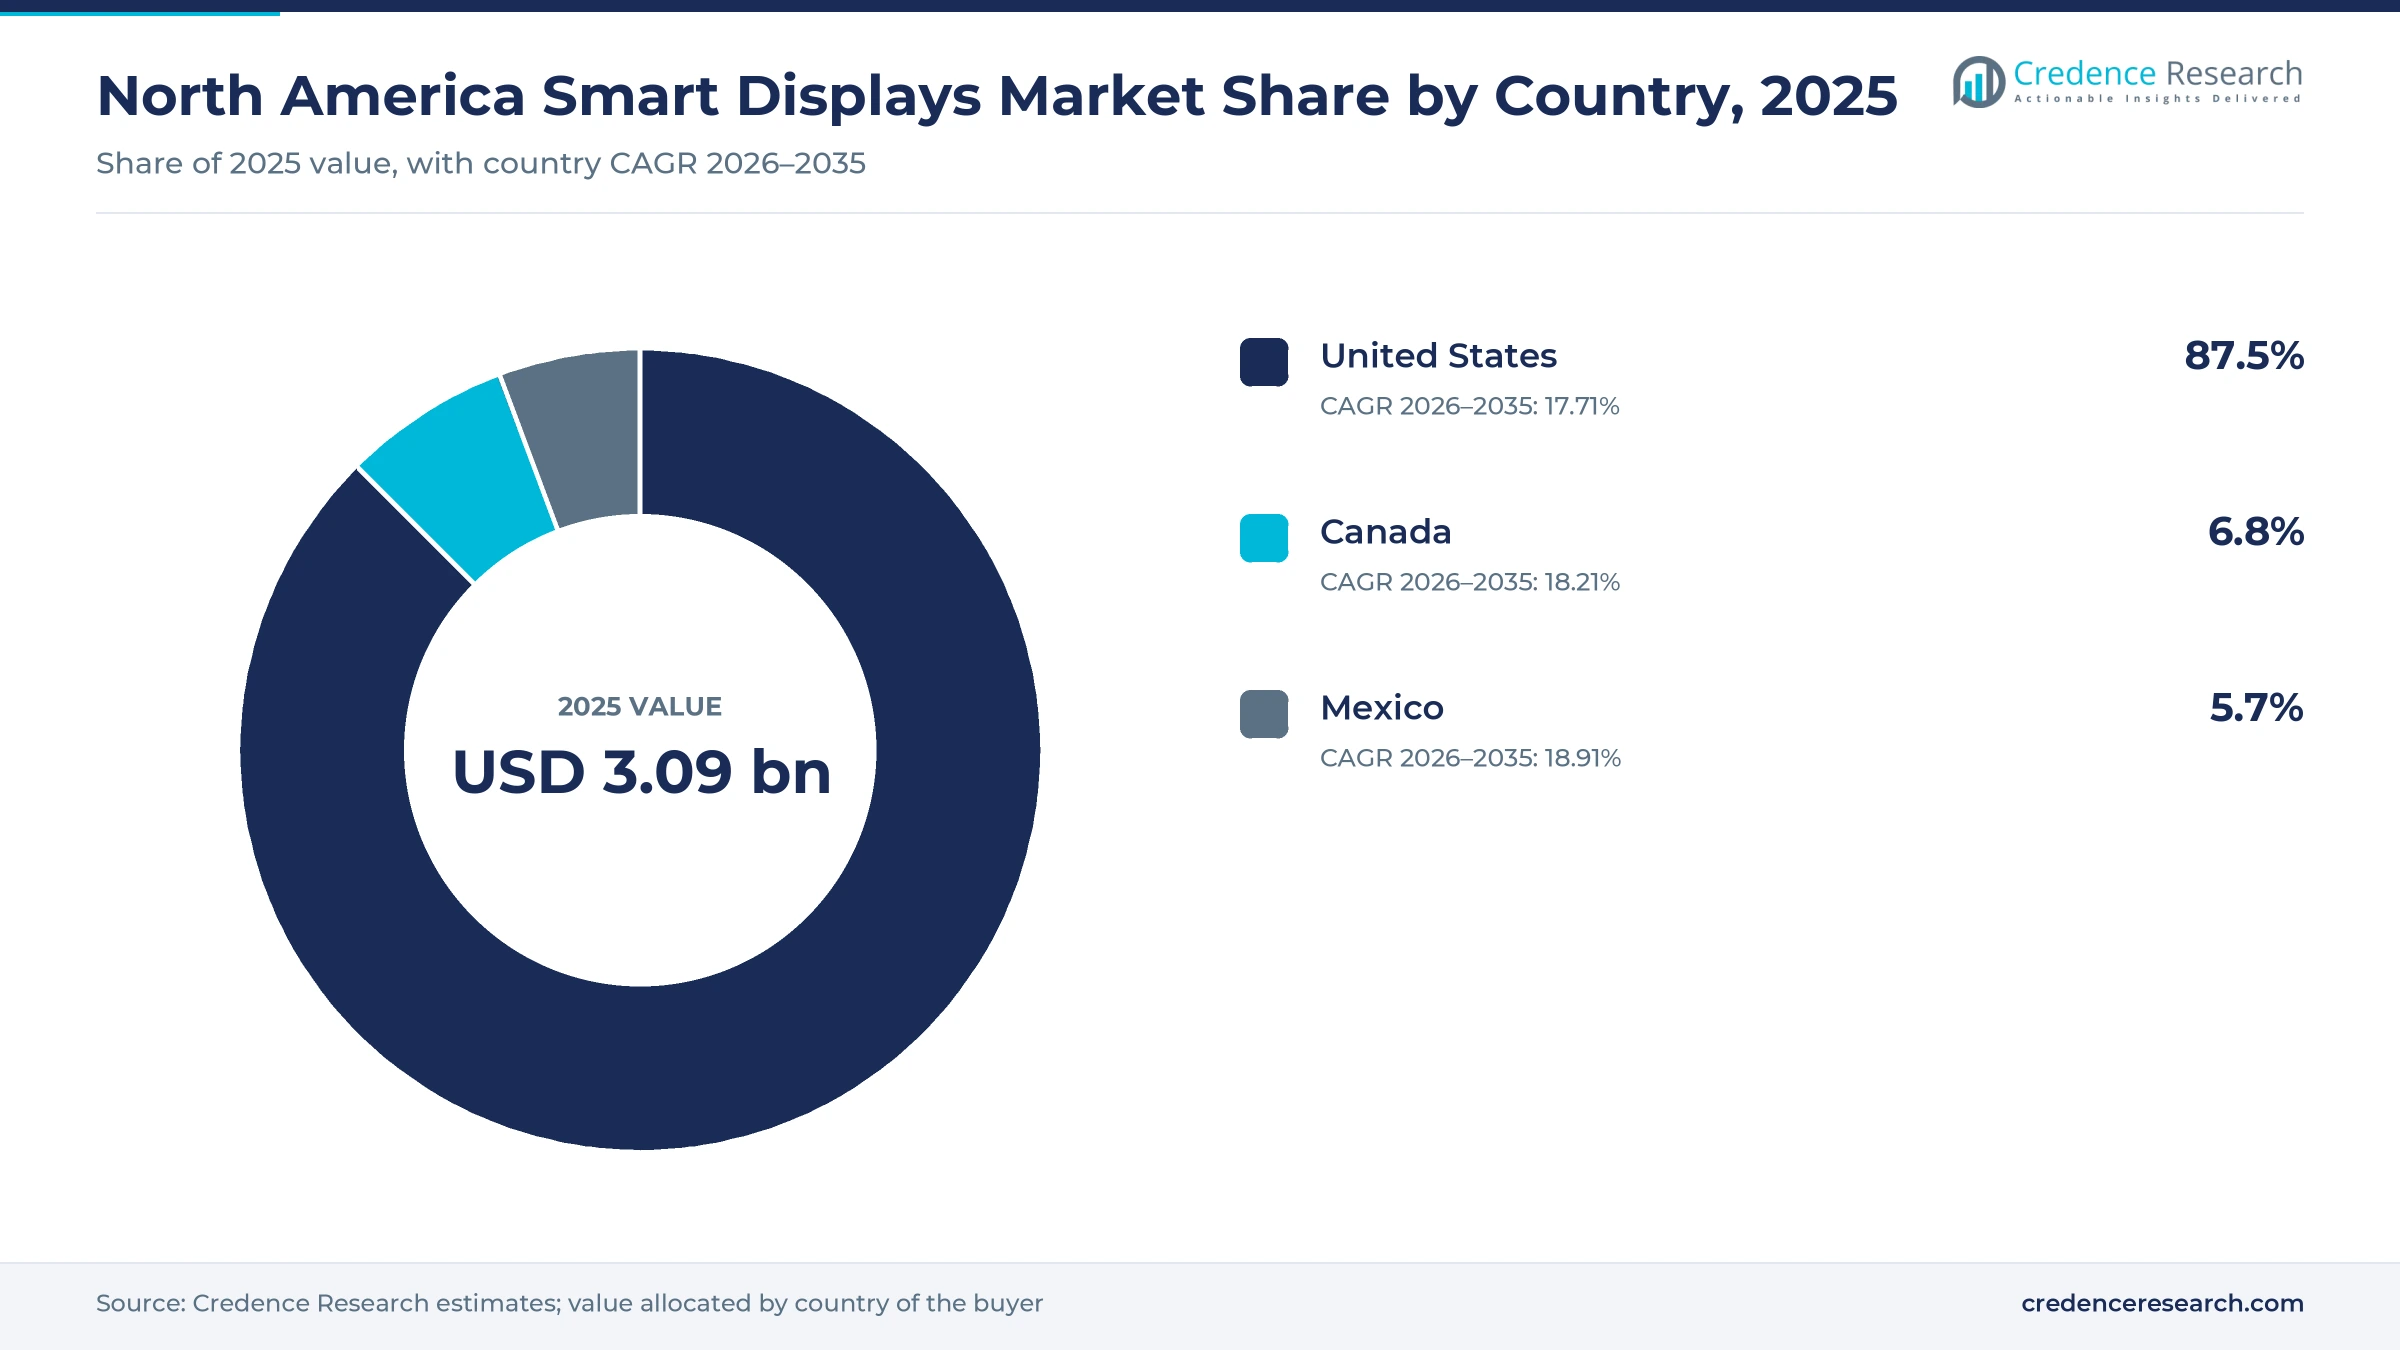
The United States dominates as Mexico grows fastest
| Country | Value, 2025 (USD billion) | Share, 2025 | CAGR, 2026–2035 |
|---|---|---|---|
| United States | 2.70 | 87.5% | 17.71% |
| Canada | 0.21 | 6.8% | 18.21% |
| Mexico | 0.18 | 5.7% | 18.91% |
The United States leads on assistant access and room budgets
The United States held 87.5% of 2025 value and grows at 17.71% a year, because new assistants and commercial programs start there. World Bank data put 2025 GDP per person at $90,027, the highest of the three countries. Physical retail also remains a large setting for customer-facing screens, since U.S. Census Bureau data released Aug. 18, 2026 showed e-commerce at 17.1% of the $1,986.5 billion in second-quarter 2026 retail sales. That leaves 82.9% of those sales outside e-commerce channels, where customer-facing screens can be installed.
Canada follows quickly on Alexa+ and voice assistants
Canada held 6.8% of 2025 value and grows at 18.21% a year, helped by early assistant access and rising device ownership. Thurrott reported in November 2025 that Canada became the first international Alexa+ market, in early access on devices including the Echo Show 8 and Echo Show 11. Among internet users connecting through more than one device, the 2026 CIRA Internet Trends survey found 28% owned a voice-activated assistant, up from 21% in 2024. Across all respondents, the same survey found 46% had used generative AI in the past year, which supports demand for assistant-led screens.
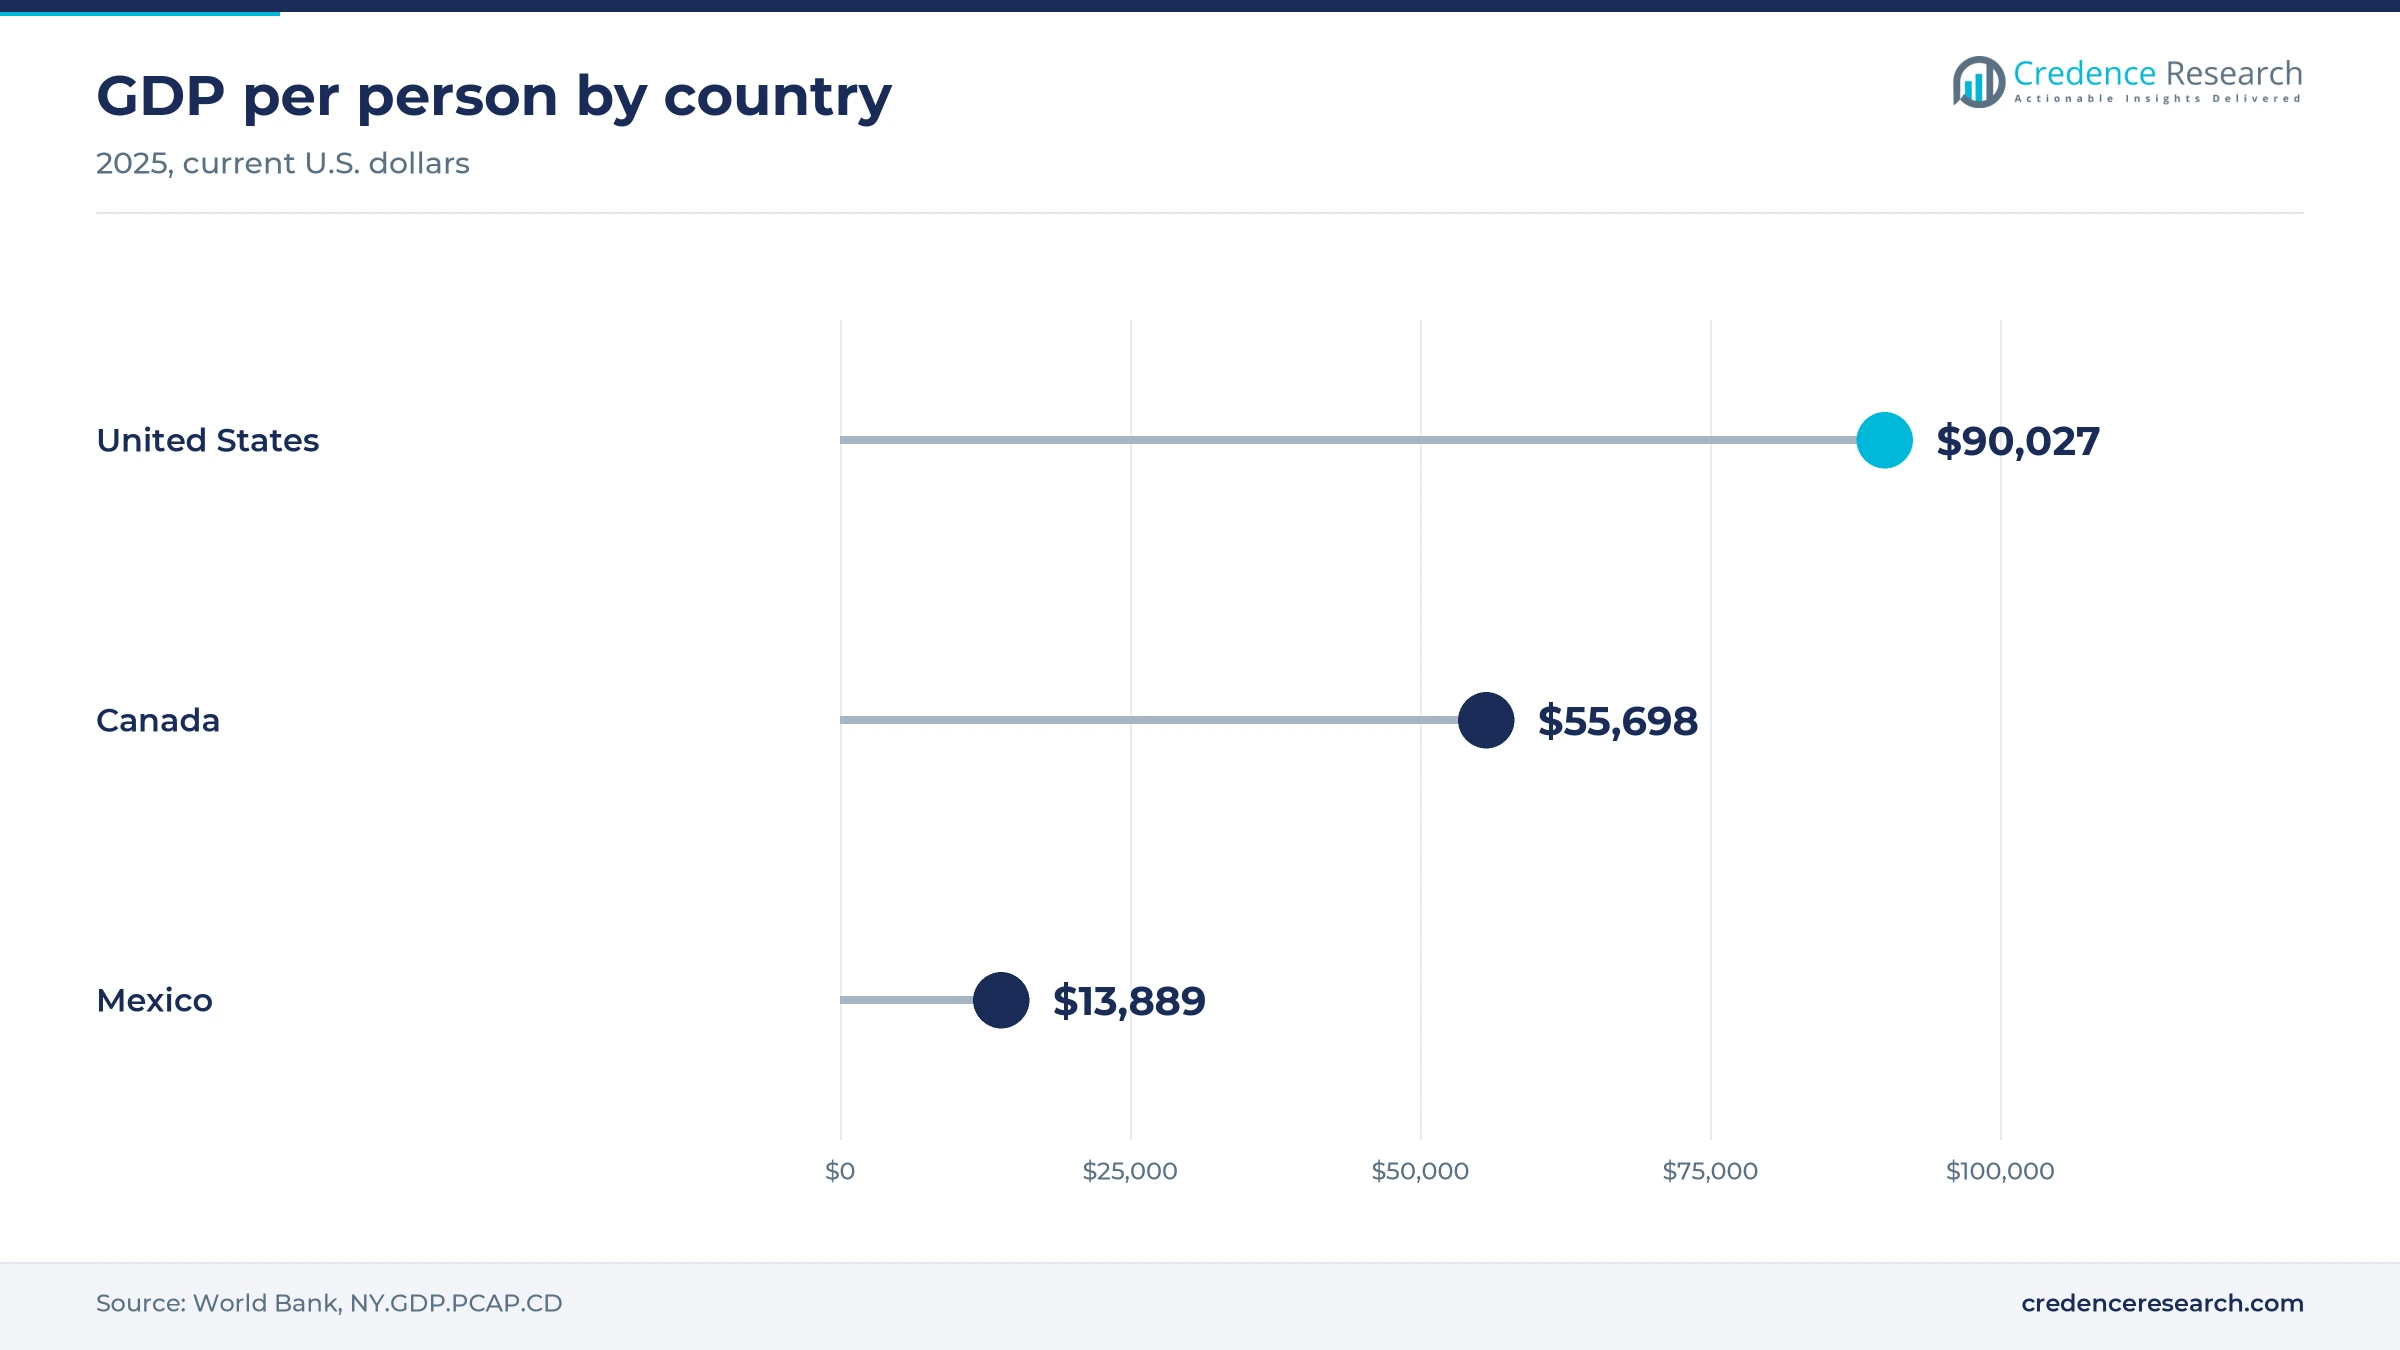
Mexico grows fastest from a smaller installed base
Mexico held 5.7% of 2025 value and grows at 18.91% a year, the fastest pace among the three countries. INEGI counted about 104.9 million internet users in 2025, or 86.1% of people aged 6 and older, which gives vendors a large connected audience. However, demand for smart displays concentrates in lower price tiers, because a 2025 GDP per person of $13,889, according to World Bank data, limits premium purchases.
Launches and exits that reset the buying cycle since 2025
| Development | Status and market relevance |
|---|---|
| In October 2025, Google began rolling out Gemini for Home to U.S. homes first on speakers and displays made after 2016. | Rollout started Oct. 28, 2025, with Gemini Live tied to Google Home Premium |
| In November 2025, the Connectivity Standards Alliance released Matter 1.5 with camera, closure and energy tariff support. | Released Nov. 20, 2025, adding device categories that screens can control |
| In November 2025, Amazon brought Alexa+ early access to Canada on devices including the Echo Show 8 and Echo Show 11. | First international expansion, free during early access |
| In February 2026, Amazon opened Alexa+ to all U.S. users after an extended early access program. | Free with Prime, $19.99 a month otherwise |
| In April 2026, Windows Central reported that Microsoft had ended Surface Hub 3 production with no successor planned. | Updates continue until the end of 2030, and stock sells until exhausted |
Three software platforms decide what each screen can do
- Voice assistant platforms such as Alexa+ and Gemini for Home run conversations and home control, and they drive most consumer replacement decisions.
- Managed application platforms such as Samsung SmartThings Pro and LG ConnectedCare let IT teams update, schedule and monitor large screen fleets remotely.
- Embedded experience platforms such as Tizen deployments with Aceso software lock a screen to a purpose, including patient education or a store kiosk.
- Matter and Thread connectivity gives each platform a common way to add devices, although support for the latest versions differs by ecosystem.
Need a Custom Version of This Report?
Tailor the scope, geography, or segments to your exact requirements.
- Custom geography or segment scope
- Direct access to our analyst team
Platform owners compete with panel makers for the same rooms
Competition divides between assistant owners and commercial panel makers, and the boundary is moving. Amazon and Google control the household assistant and use bundles, with Prime covering Alexa+ and Google Home Premium priced from $10 a month, to retain users. Samsung and LG compete across retail and commercial channels, combining panels with management software such as SmartThings Pro and ConnectedCare and with vertical partners in education and healthcare. Microsoft holds a distinct position because it sets the rules for Teams Rooms even after ending Surface Hub 3 production, which leaves meeting room hardware to other suppliers. Brand-direct sales count most for Amazon, consumer retail carries most countertop units, and integrators shape large commercial orders. Specialists such as Magic AI and Tonal compete at the edge in home fitness. Buyers increasingly judge vendors on software lifecycle commitments and on compatibility with existing accounts, not only on price.
Companies profiled and their roles in this market
| Company | Type | Role in the market |
|---|---|---|
| Amazon | Assistant owner and device maker | Sells Echo Show 8 and Echo Show 11 with Alexa+, available across the U.S., Canada and Mexico |
| Assistant owner | Offers Gemini for Home on displays made after 2016, with Google Home Premium tiers | |
| Samsung | Panel maker and platform owner | Supplies interactive displays, SmartThings Pro and hospital screens through the Aceso partnership |
| LG | Panel maker | Sells CreateBoard panels to U.S. schools with Google Play and ChromeOS Flex options |
| Microsoft | Room software owner | Sets Teams Rooms device rules and supports Surface Hub 3 updates until the end of 2030 |
Software control will outweigh screen size
Credence Research's view is that control of software will decide margins in smart displays more than panel size or resolution. The assistant race favors companies with existing household accounts, while the commercial race favors vendors able to promise long update periods after the Windows 10 and Surface Hub disruptions. The forecast's high growth depends on commercial estates expanding beyond replacement. Suppliers should therefore plan for memory cost pressure at entry prices, while enterprise buyers should demand written lifecycle terms before committing to any fleet of interactive screens.
How Credence Research built these estimates
The report uses 2025 as the base year and forecasts to 2035, with market values drawn from the Credence Research market model. Segment and country splits are Credence Research estimates informed by list prices, public statistics and dated company actions. Sources used include government statistics, international organizations, standards bodies, company releases and named trade publications. No interviews or surveys were conducted for this particular report edition.
Commercial estates and AI households carry growth to 2035
Through 2035, the market moves from USD 3.65 billion in 2026 to USD 15.96 billion, with commercial estates and AI households providing most of the added value. Consumer screens should see repeated upgrade cycles as assistants demand more memory and processing power. Commercial buyers are likely to treat displays as managed endpoints, which favors suppliers with strong device management and clear support periods. Mexico should keep gaining share as connected households expand beyond the 78.3% recorded by INEGI in 2025. However, component prices and tariff rules will continue to influence how quickly unit volumes grow across each price tier.
Frequently Asked Questions
How big is the North America smart displays market?
Which country leads the market?
Which country grows fastest?
Which product type leads?
How does generative AI affect demand?
What did the Windows 10 deadline change?
What are the main challenges?
Who are the leading companies?
Table of Content
Chapter 1 Market Segmentation
- 1.1 Segmentation Framework
- 1.1.1 Product and Service Classification
- 1.1.2 Application and End-Use Classification
- 1.1.3 Technology and Solution Classification
- 1.1.4 Customer and Distribution Channel Classification
- 1.1.5 Geographic Segmentation
- 1.1.6 Market Segment Definitions and Boundaries
- 1.2 By Product Type
- 1.2.1 Consumer Smart Home Displays
- 1.2.2 Commercial Smart Interactive Displays
- 1.2.3 Smart Display Mirrors
- 1.3 By Application
- 1.3.1 Home Management
- 1.3.2 Customer Transactions
- 1.3.3 Collaboration and Learning
- 1.3.4 Fitness and Virtual Try-On
- 1.4 By Customer Type
- 1.4.1 Household Buyers
- 1.4.2 Retail and Hospitality Operators
- 1.4.3 Corporate and Education Buyers
- 1.4.4 Healthcare and Public-Service Buyers
- 1.5 By Price Tier
- 1.5.1 Below USD 250
- 1.5.2 USD 250 to Below USD 2,500
- 1.5.3 USD 2,500 and Above
- 1.6 By Country
- 1.6.1 United States
- 1.6.2 Canada
- 1.6.3 Mexico
Chapter 2 Introduction
- 2.1 Report Objectives and Scope
- 2.2 Product Definition and Industry Terminology
- 2.3 Market Inclusions and Exclusions
- 2.4 Research Process
- 2.4.1 Primary Research and Expert Interviews
- 2.4.2 Secondary Research and Source Review
- 2.4.3 Top-Down and Bottom-Up Estimation
- 2.4.4 Data Triangulation and Verification
- 2.5 Market Size Measurement Basis
- 2.5.1 2025: USD 3.09 billion → 2035: USD 15.96 billion
- 2.6 Historical and Forecast Reference Periods
- 2.6.1 Historical Period: 2018-2025
- 2.6.2 Base Year: 2025
- 2.6.3 Forecast Period: 2025-2035
- 2.7 Research Assumptions and Limitations
Chapter 3 Executive Summary
- 3.1 Market Snapshot and Key Findings
- 3.2 Base-Year Market Size, 2025
- 3.3 Forecast Market Size, 2035
- 3.4 Revenue and Volume Growth Outlook
- 3.5 Key Demand and Supply Indicators
- 3.6 Leading Market Segments
- 3.7 Fastest-Growing Market Opportunities
- 3.8 Regional Performance Highlights
- 3.9 Technology and Industry Transformation
- 3.10 Competitive Landscape Summary
- 3.11 Analyst View and Strategic Implications
Chapter 4 North America Smart Displays Market Trends and Developments
- 4.1 Historical Industry Development, 2018-2025
- 4.2 Recent Market Trends and Developments
- 4.3 Demand and Customer Behavior Trends
- 4.4 Technology and Product Innovation
- 4.5 Artificial Intelligence, Automation and Digitalization
- 4.6 Local Manufacturing and Supply Chain Realignment
- 4.7 Industry Partnerships, Mergers and Acquisitions
- 4.8 Sustainability and Circular Economy Developments
- 4.9 Government and Private Sector Investment Trends
- 4.10 Emerging Business Models and Commercialization
- 4.11 Industry Developments and Announcements
Chapter 5 North America Smart Displays Market Production, Supply and Demand Analysis
- 5.1 Demand Trend and Consumption Analysis, 2018-2025
- 5.2 Demand Forecast, 2025-2035
- 5.3 Production and Output Trend, 2018-2025
- 5.4 Production and Output Forecast, 2025-2035
- 5.5 Installed Capacity and Capacity Utilization
- 5.6 Company-Wise Production Plants and Statistics
- 5.6.1 Installed Production Capacity
- 5.6.2 Actual Production
- 5.6.3 Planned Capacity and Expansion Targets
- 5.7 Supply Chain Structure and Procurement Trends
- 5.8 Supply-Demand Gap and Bottlenecks
- 5.9 Import Dependence and Sourcing Structure
- 5.10 Contract Manufacturing and Outsourcing
- 5.11 Regional Supply and Demand Concentration
Chapter 6 North America Smart Displays Market Pricing Analysis
- 6.1 Pricing Structure and Measurement
- 6.2 Historical Pricing Trends, 2018-2025
- 6.3 Pricing Outlook, 2025-2035
- 6.4 Average Selling Price and Unit Economics
- 6.5 Pricing by Product and Market Segment
- 6.6 Geographic Pricing Differences
- 6.7 Key Input, Energy, Labor and Logistics Costs
- 6.8 Contract Pricing and Purchasing Models
- 6.9 Pricing Sensitivity and Competitive Positioning
- 6.10 Price, Margin and Profitability Implications
Chapter 7 North America Smart Displays Market Dynamics
- 7.1 Market Growth Drivers
- 7.1.1 Demand-Side Drivers
- 7.1.2 Technology and Innovation Drivers
- 7.1.3 Infrastructure and Investment Drivers
- 7.1.4 Regulatory and Policy Drivers
- 7.2 Market Restraints
- 7.2.1 Cost and Affordability Constraints
- 7.2.2 Technology and Adoption Barriers
- 7.2.3 Supply Chain and Operational Constraints
- 7.3 Market Challenges
- 7.3.1 Competitive Pressure and Margin Erosion
- 7.3.2 Skills, Infrastructure and Implementation Gaps
- 7.4 Emerging Market Opportunities
- 7.5 Market Dynamics Impact and Time-Horizon Assessment
Chapter 8 North America Smart Displays Value Chain Analysis
- 8.1 Industry Value Chain Overview
- 8.2 Upstream Suppliers and Critical Inputs
- 8.3 Technology and Component Providers
- 8.4 Manufacturing or Service Delivery
- 8.5 Distribution, Channel Partners and Integrators
- 8.6 Downstream Applications and End Users
- 8.7 Value Addition and Profit Pools
- 8.8 Vertical Integration and Outsourcing
- 8.9 Supplier Concentration and Risk
- 8.10 Supply Chain Localization and Resilience
Chapter 9 North America Smart Displays Market Regulations and Policies
- 9.1 Relevant Laws, Standards and Compliance Frameworks
- 9.2 Product, Service, Safety and Quality Requirements
- 9.3 Government Policies, Incentives and Subsidies
- 9.4 Imports, Exports and Trade Barriers
- 9.5 Public Procurement and Local Content Requirements
- 9.6 Environmental and Sustainability Compliance
- 9.7 Upcoming Policy Changes and Market Implications
Chapter 10 North America Smart Displays Market Hotspots and Opportunities
- 10.1 Market Opportunity Mapping and Growth Hotspots
- 10.2 High-Growth Applications and Customer Groups
- 10.3 Underserved Markets and White-Space Opportunities
- 10.4 Emerging Technology and Product Opportunities
- 10.5 New Capacity and Investment Hotspots
- 10.6 Market Entry and Expansion Opportunities
- 10.7 Distribution and Partnership Opportunities
- 10.8 Near-Term and Long-Term Commercial Potential
- 10.9 Opportunity Attractiveness and Execution Risks
Chapter 11 North America Smart Displays Market Outlook, 2025-2035
- 11.1 Market Size and Analysis
- 11.1.1 Revenue (Market Measurement: 2025: USD 3.09 billion → 2035: USD 15.96 billion)
- 11.1.2 Market Volume and Quantity Sold
- 11.1.3 Historical Market Size, 2018-2025
- 11.1.4 Base-Year Market Size, 2025
- 11.2 Market Forecast, 2025-2035
- 11.2.1 Revenue Forecast to 2035
- 11.2.2 Volume Forecast to 2035
- 11.2.3 CAGR and Year-on-Year Growth
- 11.2.4 Incremental Revenue Opportunity
- 11.3 Forecast Assumptions and Scenario Analysis
- 11.3.1 Base-Case Forecast
- 11.3.2 Optimistic and Conservative Scenarios
- 11.3.3 Technology, Pricing and Policy Sensitivities
- 11.4 Market Attractiveness and Growth Outlook
Chapter 12 North America Smart Displays Market Segmentation and Outlook
- 12.1 Segmentation Summary and Market Shares, 2025
- 12.2 Largest and Fastest-Growing Segments
- 12.3 By Product Type - Market Size and Forecast, 2025-2035
- 12.3.1 Segment Definition and Scope
- 12.3.2 Historical Market Size, 2018-2025
- 12.3.3 Revenue Forecast, 2025-2035
- 12.3.4 Volume Forecast, 2025-2035
- 12.3.5 Base-Year Market Share, 2025
- 12.3.6 Segment CAGR and Growth Drivers
- 12.3.7 Subsegment Market Size and Forecast
- 12.3.7.1 Consumer Smart Home Displays
- 12.3.7.2 Commercial Smart Interactive Displays
- 12.3.7.3 Smart Display Mirrors
- 12.3.8 Subsegment Pricing and Adoption Trends
- 12.3.9 Leading Suppliers and Competition
- 12.3.10 Regional Demand and Opportunities
- 12.4 By Application - Market Size and Forecast, 2025-2035
- 12.4.1 Segment Definition and Scope
- 12.4.2 Historical Market Size, 2018-2025
- 12.4.3 Revenue Forecast, 2025-2035
- 12.4.4 Volume Forecast, 2025-2035
- 12.4.5 Base-Year Market Share, 2025
- 12.4.6 Segment CAGR and Growth Drivers
- 12.4.7 Subsegment Market Size and Forecast
- 12.4.7.1 Home Management
- 12.4.7.2 Customer Transactions
- 12.4.7.3 Collaboration and Learning
- 12.4.7.4 Fitness and Virtual Try-On
- 12.4.8 Subsegment Pricing and Adoption Trends
- 12.4.9 Leading Suppliers and Competition
- 12.4.10 Regional Demand and Opportunities
- 12.5 By Customer Type - Market Size and Forecast, 2025-2035
- 12.5.1 Segment Definition and Scope
- 12.5.2 Historical Market Size, 2018-2025
- 12.5.3 Revenue Forecast, 2025-2035
- 12.5.4 Volume Forecast, 2025-2035
- 12.5.5 Base-Year Market Share, 2025
- 12.5.6 Segment CAGR and Growth Drivers
- 12.5.7 Subsegment Market Size and Forecast
- 12.5.7.1 Household Buyers
- 12.5.7.2 Retail and Hospitality Operators
- 12.5.7.3 Corporate and Education Buyers
- 12.5.7.4 Healthcare and Public-Service Buyers
- 12.5.8 Subsegment Pricing and Adoption Trends
- 12.5.9 Leading Suppliers and Competition
- 12.5.10 Regional Demand and Opportunities
- 12.6 By Price Tier - Market Size and Forecast, 2025-2035
- 12.6.1 Segment Definition and Scope
- 12.6.2 Historical Market Size, 2018-2025
- 12.6.3 Revenue Forecast, 2025-2035
- 12.6.4 Volume Forecast, 2025-2035
- 12.6.5 Base-Year Market Share, 2025
- 12.6.6 Segment CAGR and Growth Drivers
- 12.6.7 Subsegment Market Size and Forecast
- 12.6.7.1 Below USD 250
- 12.6.7.2 USD 250 to Below USD 2,500
- 12.6.7.3 USD 2,500 and Above
- 12.6.8 Subsegment Pricing and Adoption Trends
- 12.6.9 Leading Suppliers and Competition
- 12.6.10 Regional Demand and Opportunities
- 12.7 By Country - Market Size and Forecast, 2025-2035
- 12.7.1 Segment Definition and Scope
- 12.7.2 Historical Market Size, 2018-2025
- 12.7.3 Revenue Forecast, 2025-2035
- 12.7.4 Volume Forecast, 2025-2035
- 12.7.5 Base-Year Market Share, 2025
- 12.7.6 Segment CAGR and Growth Drivers
- 12.7.7 Subsegment Market Size and Forecast
- 12.7.7.1 United States
- 12.7.7.2 Canada
- 12.7.7.3 Mexico
- 12.7.8 Subsegment Pricing and Adoption Trends
- 12.7.9 Leading Suppliers and Competition
- 12.7.10 Regional Demand and Opportunities
- 12.8 Segment Growth Comparison
- 12.9 Segment Attractiveness and Priority Matrix
Chapter 13 North America Smart Displays End-Use and Application Market Outlook
- 13.1 End-Use Industry and Customer Demand Structure
- 13.2 Leading Applications and Customer Groups
- 13.3 End-Use Market Size, Share and Forecast
- 13.4 Major End-Use Industry Deep Dives
- 13.4.1 Customer Requirements and Use Cases
- 13.4.2 Demand and Replacement Cycles
- 13.4.3 Technical and Regulatory Considerations
- 13.4.4 Purchasing and Procurement Models
- 13.4.5 Leading Vendors and Distribution Channels
- 13.4.6 Forecast and Commercial Opportunities
- 13.5 Emerging Applications and Cross-Segment Demand
- 13.6 End-Use Industry Investment Priorities
Chapter 14 North America Smart Displays Geographic Market Outlook, 2025-2035
- 14.1 Regional Market Size and Country-Level Shares, 2025
- 14.2 Country Market Size Comparison, 2025
- 14.3 Country Market Forecasts, 2025-2035
- 14.4 Subregional Industrial and Demand Clusters
- 14.5 Intra-Regional Pricing and Cost Differences
- 14.6 Cross-Border Trade and Supply Networks
- 14.7 Regional Supply and Demand Balances
- 14.8 Country Opportunity Comparison and Prioritization
Note: Every listed country is covered on the structure shown under the first country.
Chapter 15 North America Smart Displays Technology, Innovation and Sustainability Outlook
- 15.1 Technology Landscape and Maturity
- 15.2 Product, Process and Service Innovation
- 15.3 AI, Automation and Digital Tools in the Industry
- 15.4 Technology Adoption and Performance Benchmarking
- 15.5 Innovation Pipeline and R&D Investment
- 15.6 Patent and Intellectual Property Trends
- 15.7 Energy Efficiency and Resource Management
- 15.8 Sustainability, Recycling and Circularity
- 15.9 Technology Roadmap, 2025-2035
- 15.10 Risks of Obsolescence and Technology Substitution
Chapter 16 North America Smart Displays Market Key Strategic Imperatives
- 16.1 Growth and Market Entry Priorities
- 16.2 High-Return Products and Segments
- 16.3 Pricing, Profitability and Cost Optimization
- 16.4 Technology Investment and Product Differentiation
- 16.5 Supply Chain Localization and Resilience
- 16.6 Distribution and Customer Acquisition
- 16.7 Partnership, Acquisition and Capacity Strategy
- 16.8 Regional Expansion Priorities
- 16.9 Short-, Medium- and Long-Term Actions
Chapter 17 Competition Outlook
- 17.1 Industry Competition Characteristics
- 17.2 Market Structure and Concentration
- 17.3 Market Share and Competitive Positioning, 2025
- 17.4 Company-Wise Revenue and Product Benchmarking
- 17.5 Production and Service Capacity Benchmarking
- 17.6 Technology, Pricing and Differentiation
- 17.7 Regional Footprint and Distribution Strength
- 17.8 Mergers, Acquisitions and Strategic Alliances
- 17.9 New Entrants and Competitive Threats
- 17.10 Porter's Five Forces and Industry Attractiveness
- 17.11 Competitive Outlook, 2025-2035
Chapter 18 Company Profiles
- 18.1 Company Coverage and Selection Criteria
- 18.2 Amazon
- 18.2.1 Business Description
- 18.2.2 Company Ownership and Geographic Presence
- 18.2.3 Product and Service Portfolio
- 18.2.4 Manufacturing and Operating Footprint
- 18.2.5 Production Capacity and Expansion Plans
- 18.2.6 Financial Performance and Investment
- 18.2.7 Market Share and Competitive Position
- 18.2.8 Technology and Innovation Capabilities
- 18.2.9 Strategic Alliances or Partnerships
- 18.2.10 Recent Developments
- 18.2.11 Growth Strategy and Outlook
- 18.3 Google
- 18.4 Samsung
- 18.5 LG
- 18.6 Microsoft
- 18.7 Other Relevant Market Participants
Note: Every listed company is profiled on the structure shown under the first company. The company list is preliminary and may change based on research findings, market developments, data availability and client requirements.
Chapter 19 Disclaimer
- 19.1 Research and Forecast Disclaimer
- 19.2 Data Source and Estimation Limitations
Note: The depth of individual sections depends on data availability for this market. Volume, capacity, trade and other unit-based metrics are included where applicable.

