
Phones and screens dominate a largely connected market
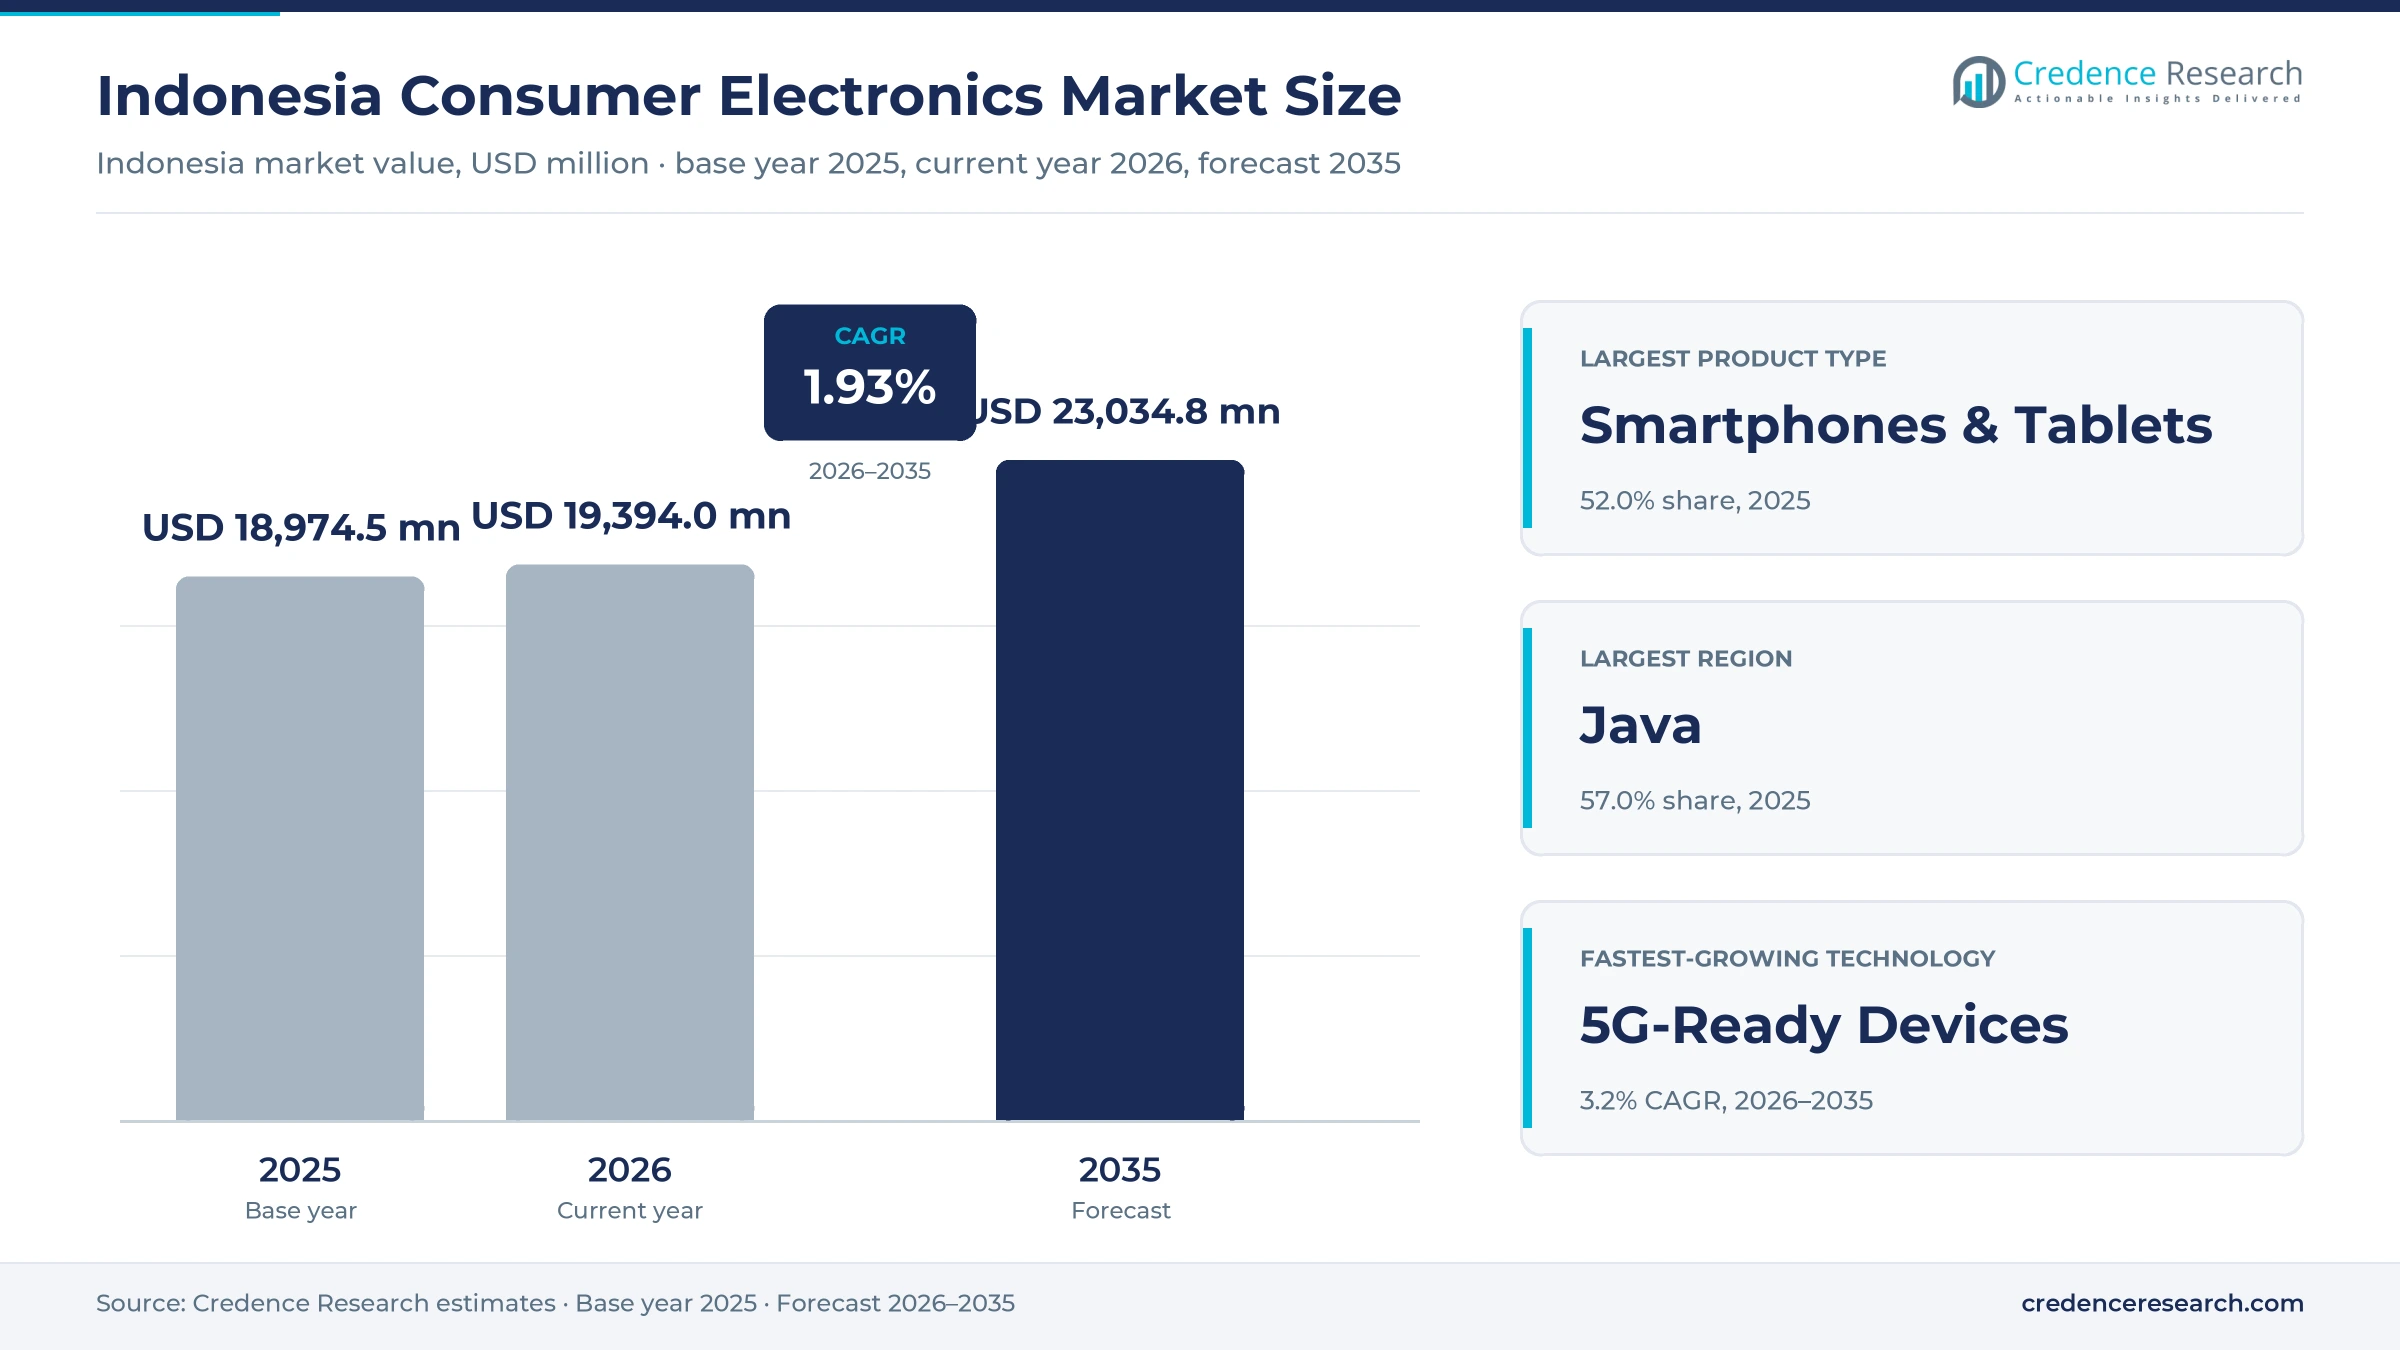
The Indonesia consumer electronics market was valued at USD 18.97 billion in 2025 and is projected to increase from USD 19.39 billion in 2026 to USD 23.03 billion by 2035, registering a CAGR of 1.93% during 2026–2035. Demand comes from a population that is now largely online, from smartphone owners replacing aging 4G handsets, and from households buying larger televisions and laptops for work and study. Java held the largest regional share, 57.0% in 2025, because it concentrates internet users, modern retail and incomes, while Sulawesi & Eastern Indonesia is the fastest-growing region at 2.5% a year as retail networks and mobile coverage reach Sulawesi, Maluku and Papua. Smartphones and tablets carry about half of all spending, and mid-range devices form the largest price tier. The most important commercial change is the 2026 award of 700 MHz and 2.6 GHz spectrum, which obliges operators to extend 5G coverage and should pull handset upgrades forward.
Phones carry half of spending as homes add bigger screens
The market counts smartphones and tablets, laptops and other computing devices, televisions and home entertainment systems, wearables and audio and smart home products bought in Indonesia, valued at the prices buyers pay. It covers purchases by individual consumers, family households, professionals and creators, and small business buyers, whether the device replaces an older model, gives a first-time user digital access, supports work and study or serves entertainment.
The count excludes household appliances such as air conditioners and washing machines, telecom and internet subscriptions, separately sold repair services, and devices bought through public tenders such as school display panels. Value sits with the brands that design and assemble devices, the contract makers in Batam and West Java that meet local content rules, and the retailers, marketplaces and financing partners that reach buyers.
Indonesia Consumer Electronics Market Insights
- The Indonesia consumer electronics market rises from USD 18.97 billion in 2025 to USD 23.03 billion by 2035, growing at 1.93% a year as a mostly connected population upgrades devices.
- Java held 57.0% of 2025 value, while Sulawesi & Eastern Indonesia grows fastest at 2.5% a year as stores and mobile coverage spread east.
- Smartphones & Tablets held 52.0% of 2025 value, supported by Samsung's Cikarang plant, which built about 14 million units in 2023.
- Komdigi named Telkomsel, Indosat and XLSMART winners of the 700 MHz and 2.6 GHz bands on July 21, 2026, tying the spectrum to 5G coverage of 51% of the population.
- Memory cost increases in 2026 have pushed phone prices up and made new models below Rp2 million rare, so value is shifting toward the mid-range tier.
Phones lead as 5G-ready and wearable devices grow fastest
Phones lead on local assembly as wearables grow fastest
Based on product type, the market is categorized into smartphones & tablets, computing devices, TV & home entertainment, wearables and audio & smart home. Smartphones & Tablets led with 52.0% of 2025 value because the phone is most households' main screen and is built locally. Bisnis Indonesia reported in January 2025 that Samsung's Cikarang plant produced about 14 million units in 2023, roughly 28% of national handheld output. Wearables grow fastest at 3.5% a year, as Huawei's Watch GT 7 smartwatch launched on Oct. 7, 2026, at Rp3.999 million to Rp4.999 million. Because wearables sell to people who already own a phone, every smartwatch launch near Rp4 million widens spend per user rather than the number of buyers.
Mid-range devices hold the center as entry models thin out
Based on price tier, the market is categorized into entry/budget, mid-range, premium and ultra-premium devices. Mid-Range led with 40.0% of 2025 value because buyers squeezed by price increases are trading up a step rather than down. Jakarta store staff told Bisnis Indonesia in August 2026 that phones below Rp2 million have become rare and that demand has moved to models priced Rp3 million to Rp7 million. Ultra-Premium grows fastest at 3.2% a year as flagship ranges widen, with the Galaxy S25 Ultra 1 TB launched on Jan. 23, 2025, at Rp24.999 million. These buyers are less price sensitive, so the tier protects brand margins when costs rise.
Store chains lead while financing partners grow fastest
Based on distribution channel, the market is categorized into multi-brand electronics retailers, e-commerce marketplaces, brand-owned channels and telecom & financing partners. Multi-Brand Electronics Retailers led with 39.0% of 2025 value because most buyers still want to handle a device and arrange payment in person, and Erajaya alone ran 2,229 stores in October 2025, according to Fortune Indonesia. Telecom & Financing Partners grow fastest at 2.7% a year as installment buying spreads. The Financial Services Authority (OJK) reported buy now, pay later financing by finance companies of Rp10.85 trillion in October 2025, up 69.71% from a year earlier. Credit turns a phone into a monthly payment, which widens the market.
Connected devices dominate as 5G-ready models gain fastest
Based on technology, the market is categorized into connected & IoT-enabled, AI-enabled devices, 5G-ready devices, and conventional standalone devices. Connected & IoT-Enabled led with 36.0% of 2025 value, because Credence Research assigns each device to its single most advanced feature, which leaves 4G phones, smart TVs and app-linked wearables in this group. 5G-Ready Devices grow fastest at 3.2% a year, as an official of the Ministry of Communication and Digital Affairs (Komdigi) put national 5G network coverage at below 10% in July 2026 against a target of up to 80% by 2030, so many 5G phones already sold will only now gain a usable signal.
| Segment Group | Leading Sub-segment | Share, 2025 | Fastest-growing Sub-segment | CAGR, 2026–2035 |
|---|---|---|---|---|
| By Product Type | Smartphones & Tablets | 52.0% | Wearables | 3.5% |
| By Price Tier | Mid-Range | 40.0% | Ultra-Premium | 3.2% |
| By Distribution Channel | Multi-Brand Electronics Retailers | 39.0% | Telecom & Financing Partners | 2.7% |
| By Technology | Connected & IoT-Enabled | 36.0% | 5G-Ready Devices | 3.2% |
Phone prices rise as memory and rupiah costs pass through
Pricing works on fixed retail price points that brands set for each memory configuration, with promotions and installment offers layered on top. Most models are repriced upward a few months after launch rather than discounted, because component and currency costs feed through each quarter. The memory and rupiah pressures described in the challenges explain why few new phones now sell below about Rp2.3 million. Brands defend share with fewer memory variants and longer financing terms, while retailers earn more from accessories, protection plans and trade-ins than from the device margin itself.
| Device or tier | Typical price or fee | Basis |
|---|---|---|
| Entry smartphone, 4 GB/64 GB | Rp2.299 million | Samsung Galaxy A07 and OPPO A6x, Bisnis Indonesia store check, July 2026 |
| Entry smartphone, 4 GB/128 GB | Rp2.799 million | vivo Y11d, Bisnis Indonesia store check, July 2026 |
| Mid-range smartphone | Rp4.49 million | HONOR X7d, HONOR Indonesia, August 2026 |
| Upper mid-range smartphone, 12/256 GB | Rp7.499 million | Xiaomi 15T after repricing, Selular, March 2026 |
| Flagship smartphone | Rp14.999 million to Rp24.999 million | Galaxy S25 to S25 Ultra 1 TB launch prices, January 2025 |
Request a Free Sample
Fill in your details and we'll send you a free sample report.
- Sample data tables & charts
- Research methodology
Connected buyers, 5G licenses and local assembly lift sales
Expansion of the connected consumer base keeps volume steady
The connected consumer base is now wide enough that most demand comes from people who already own a device, which keeps volume steady even in weak years. Household spending remains the backbone of the market, and Statistics Indonesia (BPS) reported in February 2026 that household consumption grew 4.98% in 2025 and made up 53.88% of GDP. Retail traffic held up as well, with Erajaya reporting same-store sales growth of 30.5% for October 2025, according to Fortune Indonesia. Java, with the deepest base of users and stores, leads this demand by a wide margin. For suppliers, growth now depends on raising spend per user through upgrades and accessories, since the Indonesian Internet Service Providers Association (APJII) counted 229 million internet users in 2025.
Smartphone refresh and network upgrade cycle pulls demand forward
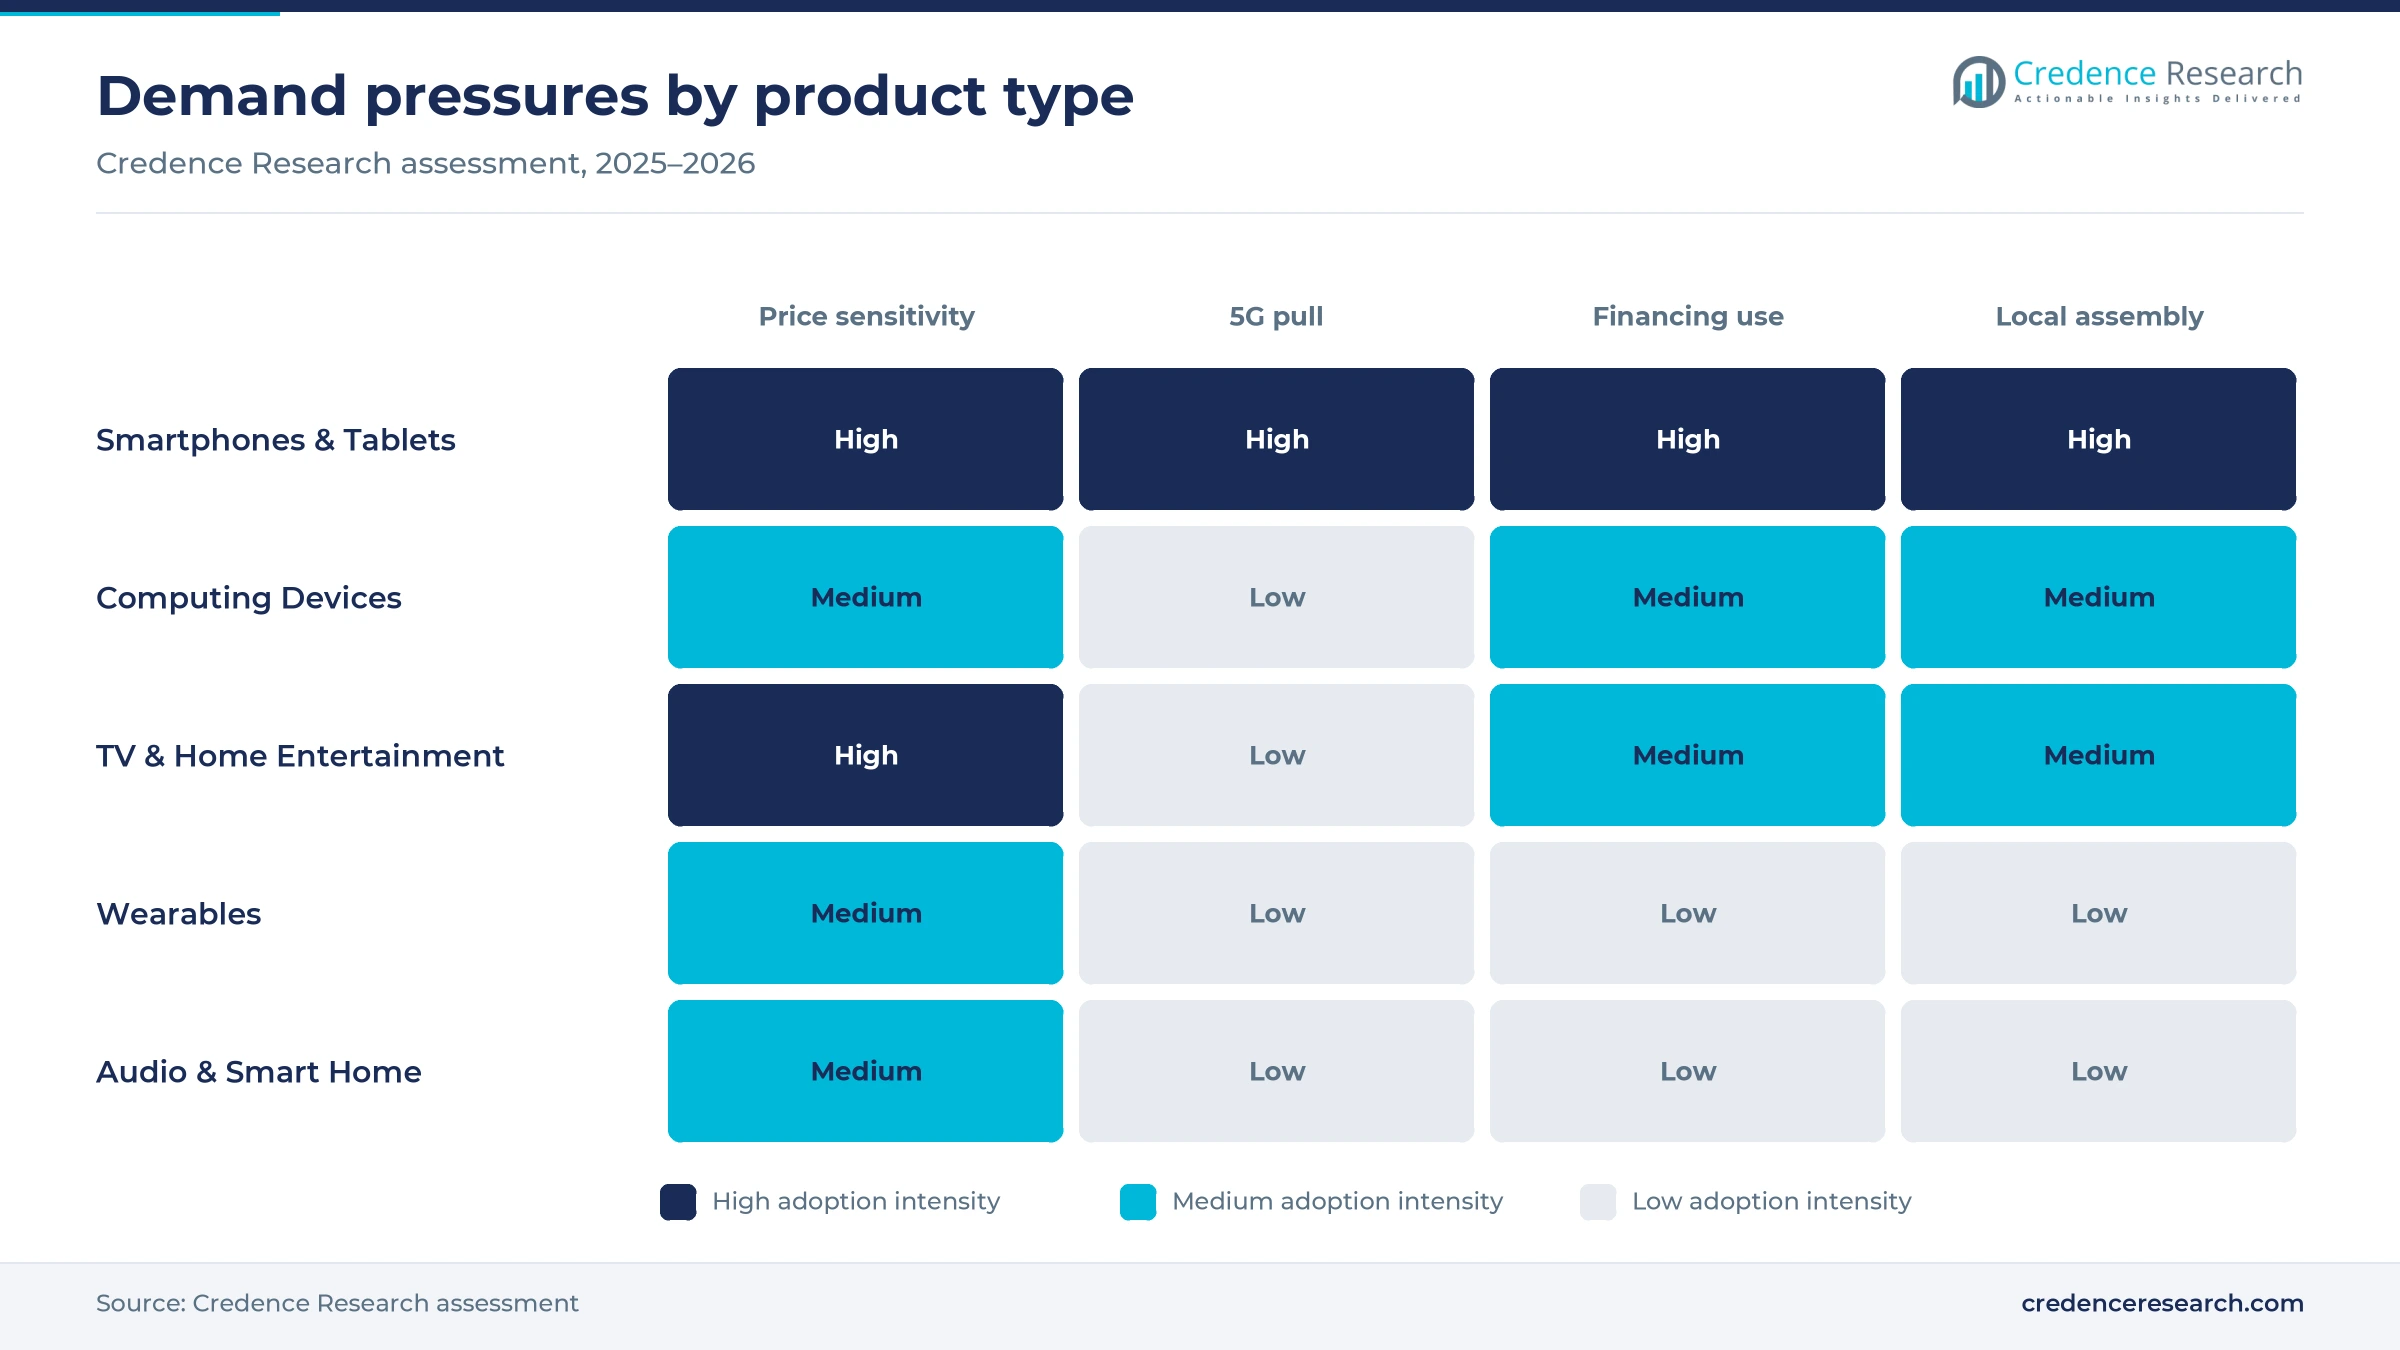
Smartphone replacement is the largest repeat purchase in the market, and the network upgrade now under way gives owners a reason to replace devices earlier. Katadata reported that on July 21, 2026, Komdigi named Telkomsel, Indosat and XLSMART winners of the 700 MHz and 2.6 GHz bands. The licenses require 5G coverage of at least 51% of the population by the fifth year and 4G service in 538 underserved villages from Sumatra to Papua. The ministry also targets average mobile speeds of 100 Mbps by 2029. In the Credence Research model, 5G-ready devices are the fastest-growing technology segment through 2035. Brands that keep 5G models near Rp3 million will capture most of this refresh, because buyers will not pay flagship prices for coverage alone.
Localization and domestic electronics investment shape supply
Localization decides which devices reach Indonesian shelves and at what cost, because phones and tablets must meet local content (TKDN) rules before sale. Bisnis Indonesia reported in January 2025 that the Ministry of Industry planned to lift the threshold from 35% to 40%, and that Samsung's local content already averaged about 37%, with its highest model at 40.3%. Apple shows the stakes, since it agreed a USD 320 million package in February 2025, including an AirTag plant in Batam, before its iPhone 16 could be sold. Imports still matter, and BPS data cited by Databoks put smartphone imports at USD 1.57 billion in the first half of 2025, up 31%. For brands, local assembly is now the price of access, which gives contract makers in Batam more bargaining power.
Installment credit widens access to mid-range devices
Consumer credit has become a demand driver in its own right, because it lets buyers on modest wages spread the cost of a device over months. Income growth alone would not support upgrades, since the World Bank noted in December 2025 that real wages fell 1.1% a year between 2018 and 2024 and that many new jobs do not pay middle-class wages. Pay-later lending by finance companies grew by more than two thirds in the year to October 2025, as the OJK figures noted above show, and telecom and financing partners are the fastest-growing sales channel in 2026 to 2035 as a result. Brands and retailers that bundle zero-interest installments with mid-range phones and laptops convert this credit into sales, while those without financing tie-ups lose price-sensitive buyers to rivals.
Rising prices shift buyers to mid-range and used phones
Shift toward mid-range and used phones as prices climb
Rising component costs are pushing new smartphone prices up, and buyers are responding by trading up a tier or turning to used devices. Selular reported in March 2026 that the Xiaomi 15T 12/256 GB rose from Rp6.499 million at launch to Rp7.499 million, while the base vivo Y21D moved from about Rp2 million to nearly Rp2.5 million. A Ministry of Industry official told Bisnis Indonesia in August 2026 that memory shortages would cut smartphone production capacity in 2026 and that the used-phone market is growing quickly. HONOR is holding its X5c Plus at Rp2.29 million to defend the entry tier. The Mid-Range tier absorbs most of these buyers, so brands without credible models between Rp3 million and Rp5 million lose share.
Rise of on-device AI features in the local language
AI features are moving from flagship phones into mid-priced phones and wearables, and local-language support is what makes them useful to Indonesian buyers. Samsung says its R&D Institute Indonesia team played a key role in bringing Bahasa Indonesia support to Galaxy AI. The company also positions the Galaxy S25 FE as carrying flagship AI tools such as Generative Edit and Audio Eraser to a wider range of buyers. Huawei's Watch GT 7 series, launched in October 2026, adds an AI-based Physical Readiness Score and AI workout analysis across more than 100 sport modes to a watch priced below Rp5 million. These moves mean AI is becoming a standard feature rather than a premium badge, so the value of AI-enabled devices will rise mainly through mix rather than through higher prices.
Opportunity in certified trade-in and refurbished phones
Higher new-device prices open a commercial opening for brands and retailers that can run trusted trade-in and refurbished programs. Selular found at Jakarta's Roxy market in early 2026 that used phones priced Rp1 million to Rp3 million make up most second-hand sales, with supply coming mainly from trade-ins and individual sellers while the fastest-moving units sell near Rp500,000. Every phone in this flow must carry a registered IMEI under the CEIR system set by communications ministry regulation No. 1 of 2020, which gives retailers a way to verify devices. Retailers already have the reach to run such programs, since Erajaya alone operated 2,229 stores in October 2025, as noted in the channel analysis. Retailers that grade, warranty and finance used phones can keep price-sensitive buyers inside the formal market and win their next upgrade.
Opportunity in larger TVs for a daily-viewing audience
Television remains a daily habit, which creates room for screen-size upgrades even as phones take more viewing time. Xiaomi Indonesia, citing BPS 2025 data, said in August 2026 that about 70% of Indonesians still watch TV daily, and that 32-inch sets remain the most popular size because many households have lower-middle incomes. The company is expanding into 43-inch, 55-inch and premium sets above 80 inches. Because a 32-inch set is often the only screen a family shares, the step to 43 inches is the most likely upgrade, and it raises the value of each TV sold without needing any new buyers. Brands that price 43-inch smart TV models close to 32-inch sets can lift spend per household.
Memory costs, a weak rupiah and policy shifts curb volume
Memory chip costs push device prices higher
The sharpest pressure on volume comes from memory chip costs, which brands cannot absorb on thin entry-tier margins. Katadata reported in September 2026 that DRAM prices rose more than 50% and NAND flash more than 90% in the first quarter of 2026 as chipmakers shifted output to AI data centers. Indonesian phone prices rose by roughly 7% to 45% as these costs passed through. Entry-tier buyers are hit hardest, so suppliers are cutting low-memory models and steering buyers toward financing.
Soft consumer confidence limits upgrades
Weak household confidence limits how far suppliers can push prices without losing volume. Bank Indonesia's consumer confidence index fell to 115 in September 2025, the lowest reading since April 2022, as job worries grew, The Jakarta Post reported. Plans to buy durable goods weakened in the same survey, though they stayed slightly in optimistic territory. This caps upgrades among lower-income households, so brands rely on promotions, financing and smaller memory configurations to hold volume.
Shifting local content policy raises planning risk
Changes to local content policy can reorder competition at short notice, which complicates product planning for every brand. The industry ministry said on April 1, 2025, that the iPhone 16 could not be sold legally until Apple met its certification and investment obligations. In February 2026, Bisnis Indonesia reported on a plan to exempt U.S. products from local content rules, and ICT Institute analyst Heru Sutadi warned that this could give U.S. makers a cost edge over brands with local plants. Suppliers therefore keep flexible sourcing plans for both locally assembled and imported models.
Weak rupiah lifts dollar-priced component costs
Currency weakness adds a second layer of cost, because most device components are bought in U.S. dollars. Bisnis Indonesia reported on May 15, 2026, that the rupiah touched Rp17,500 per dollar, against the roughly Rp15,000 that phone makers had used in earlier cost planning. Heru Sutadi said price adjustments were hard to avoid as a result. Importers of laptops and TVs face the same squeeze, which favors brands with local assembly and supply contracts priced in rupiah.
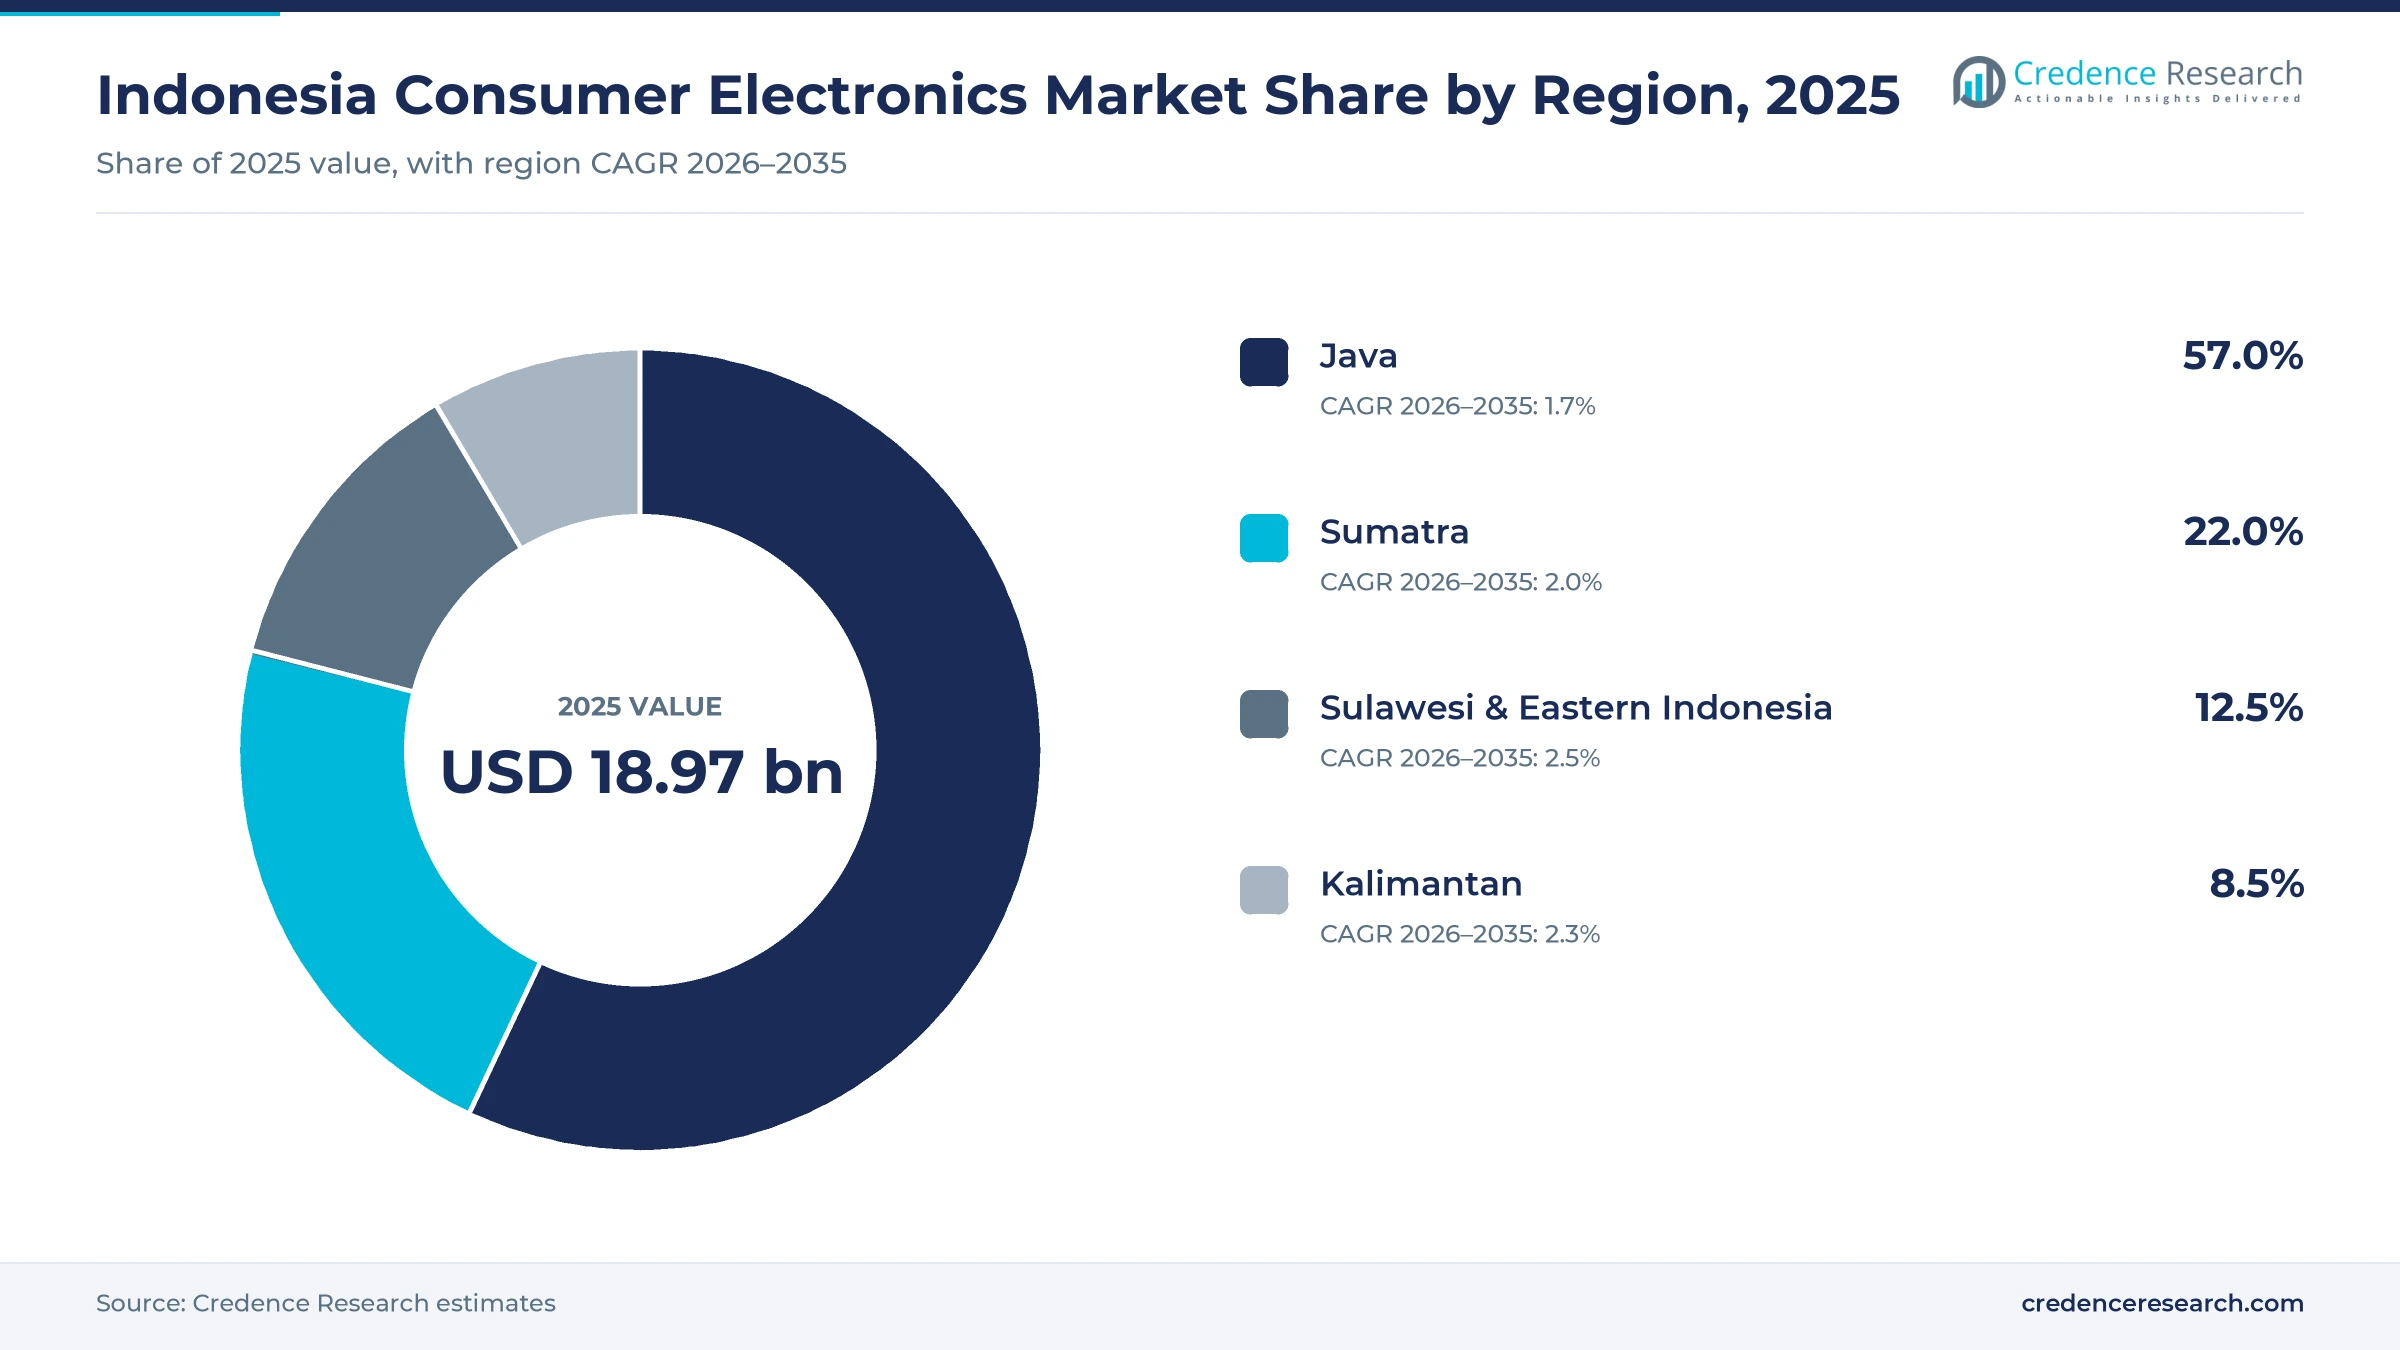
Java leads as Sulawesi and the eastern islands grow fastest
| Region | Value, 2025 (USD billion) | Share, 2025 | CAGR, 2026–2035 |
|---|---|---|---|
| Java | 10.82 | 57.0% | 1.7% |
| Sumatra | 4.17 | 22.0% | 2.0% |
| Sulawesi & Eastern Indonesia | 2.37 | 12.5% | 2.5% |
| Kalimantan | 1.61 | 8.5% | 2.3% |
Java leads on internet reach and dense retail
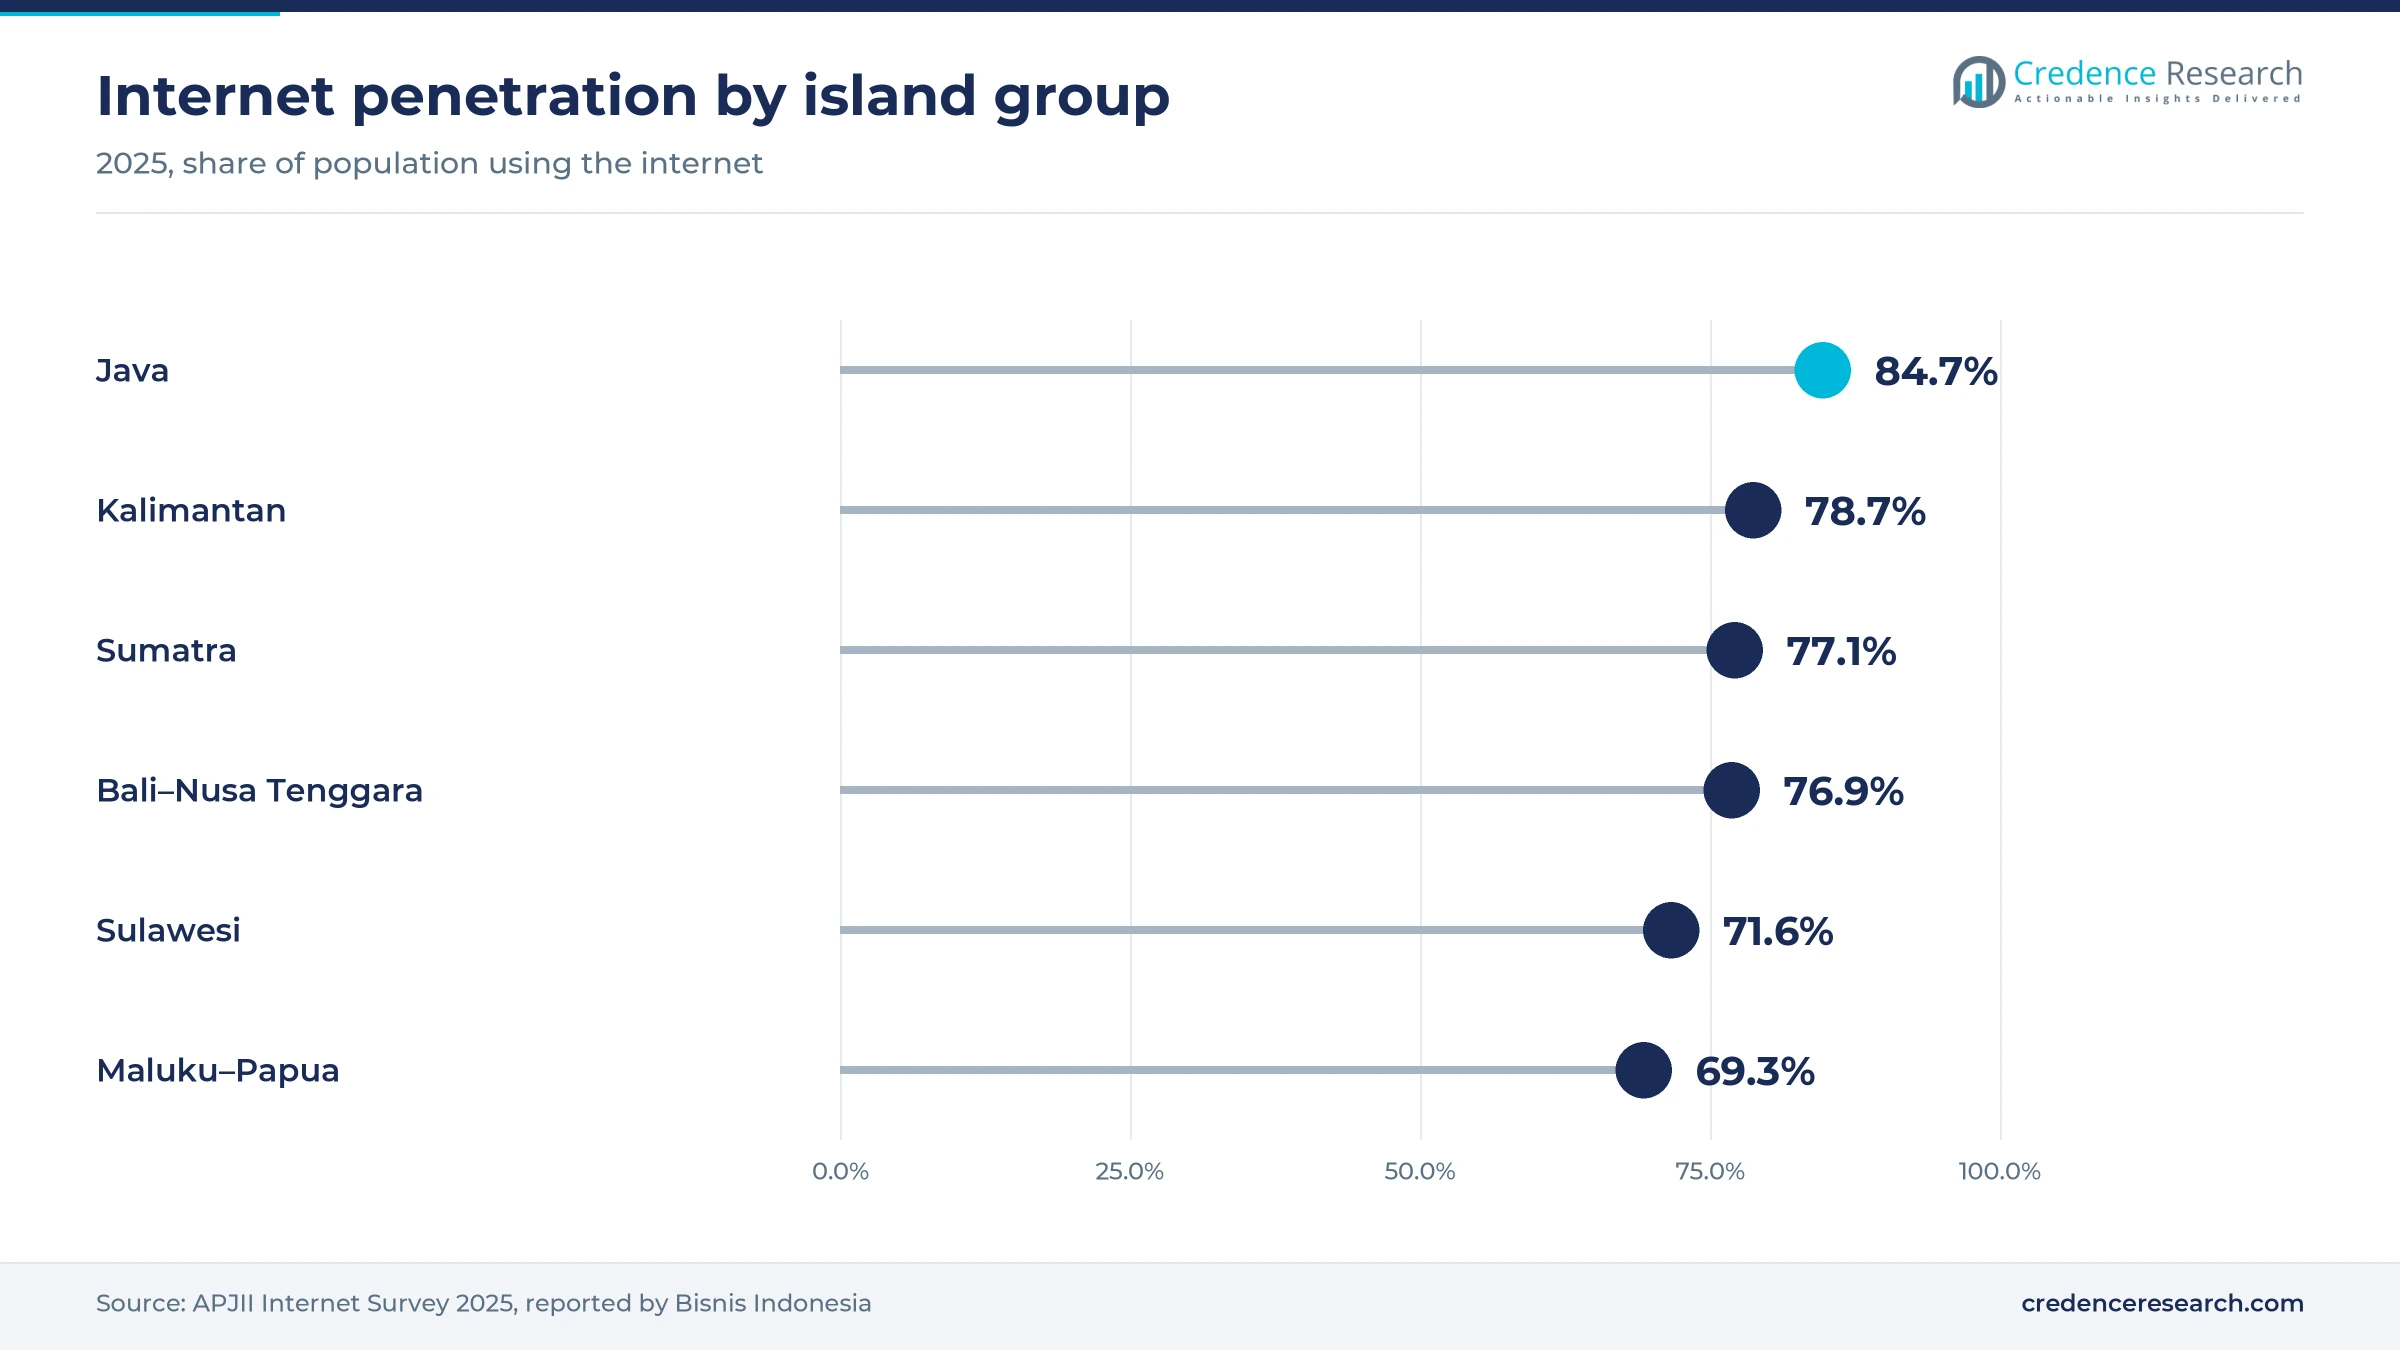
Java held 57.0% of 2025 value and grows at 1.7% a year, which reflects its role as the country's main buying center. APJII's 2025 survey found that Java accounts for 58% of national internet users, with penetration of 84.69%, the highest of any island group. Jakarta, Surabaya and Bandung also host the flagship stores of brands and retail chains. Growth is slower than elsewhere because most households already own several devices, so suppliers compete in Java on upgrades, trade-ins and premium models.
Sumatra adds stores in secondary cities
Sumatra held 22.0% of 2025 value and grows at 2.0% a year, which keeps it the second-largest buying region by a wide margin. APJII counts Sumatra at 20.5% of national internet users, with penetration of 77.12%. Retailers are moving into secondary cities, and Erajaya said it opened 18 stores in late November 2025, including outlets in Padang, Palembang, Lampung and Bangkinang in Riau. Store reach beyond the provincial capitals is the main lever for growth on the island.
Kalimantan grows from a well-connected population
Kalimantan held 8.5% of 2025 value and grows at 2.3% a year. APJII puts Kalimantan at 6.05% of national internet users but with penetration of 78.72%, above Sumatra, which describes a smaller but well-connected population. Buyers rely more on marketplaces and regional chains, and delivery to inland towns takes longer than in Java. Wider 4G and 5G coverage under the 2026 spectrum licenses should narrow that gap and support upgrades over the forecast period.
Sulawesi and the eastern islands grow fastest from a low base
Sulawesi & Eastern Indonesia held 12.5% of 2025 value and grows fastest at 2.5% a year. Internet penetration is lowest here, at 71.64% in Sulawesi and 69.26% in Maluku and Papua, according to APJII, so first-time digital access still adds buyers. Retail chains are following demand east, with new Erajaya stores in Manado and Ternate in November 2025. The licenses' 4G obligation for underserved villages, noted in the drivers, will widen this pool further.
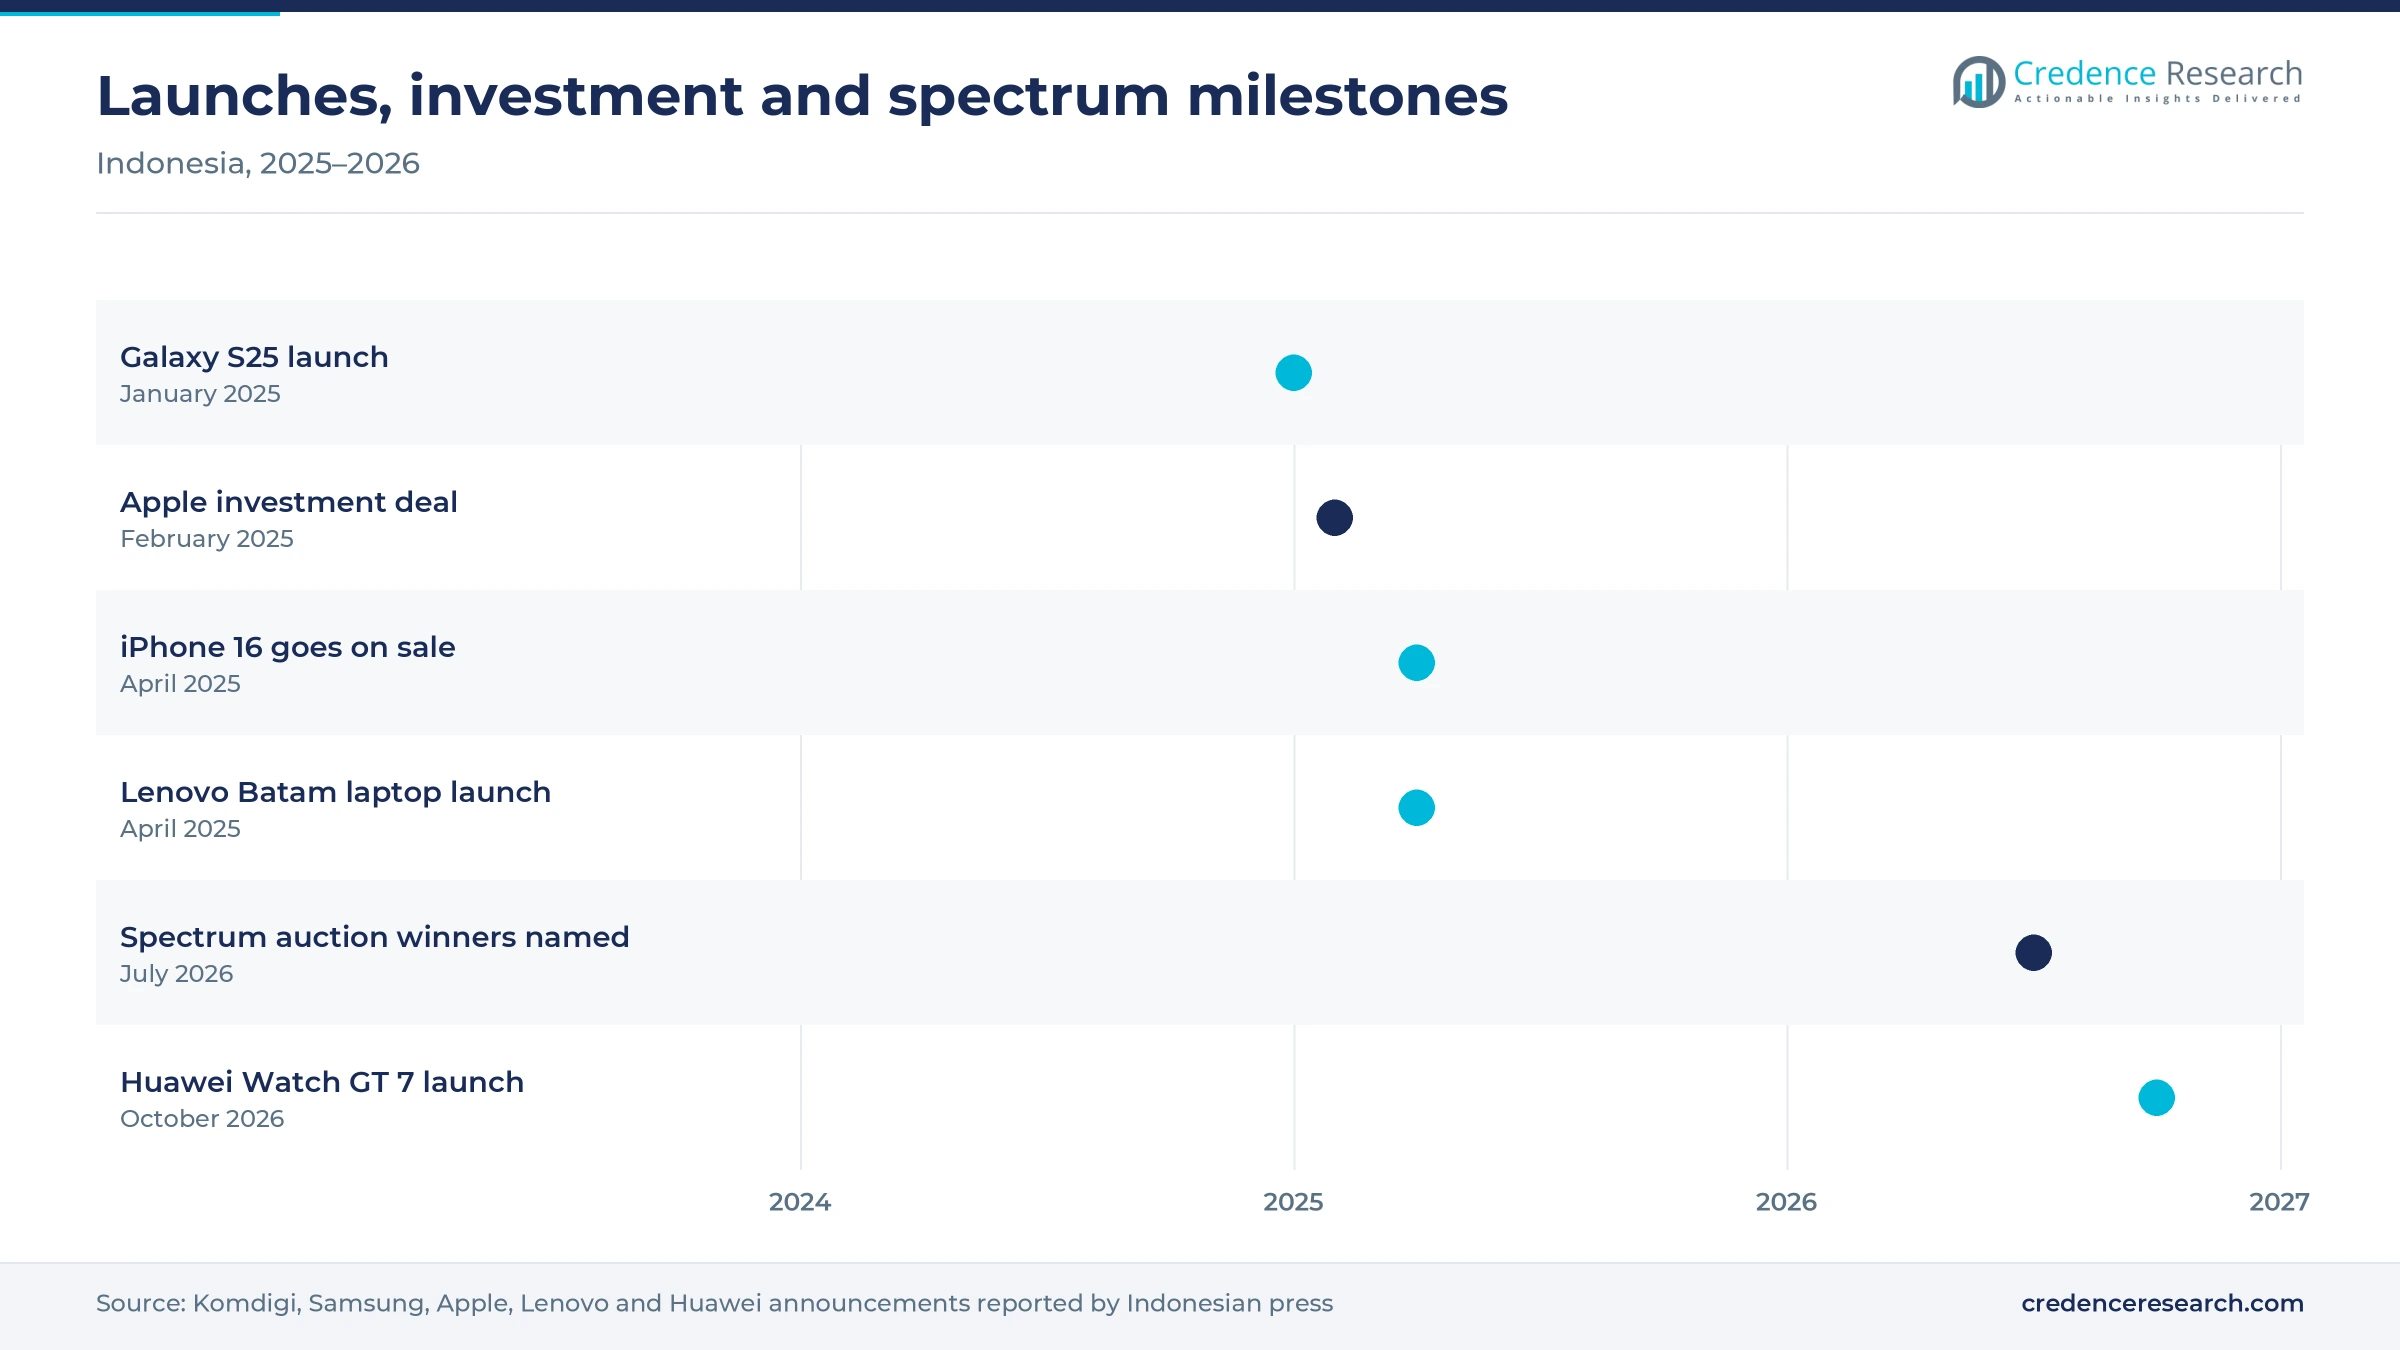
Investment deals, local launches and spectrum awards
| Development | Status and market relevance |
|---|---|
| In February 2025, Apple agreed a USD 320 million investment package with the Indonesian government, including an AirTag plant in Batam, to clear iPhone 16 sales. | Completed; the iPhone 16 went on sale on April 11, 2025 |
| In April 2025, Lenovo launched the K14 Gen 3 laptop and a ThinkCentre all-in-one built by PT Sat Nusapersada in Batam with local content above 40%. | In production for public-sector buyers |
| In May 2025, ASUS Indonesia launched its Expert Series laptops and desktops, made in Batam with local content above 40%. | On sale to government and business buyers |
| In July 2026, Komdigi named Telkomsel, Indosat and XLSMART winners of the 700 MHz and 2.6 GHz spectrum selection. | Licenses awarded; 5G coverage obligations run five years |
| In October 2026, Huawei launched the Watch GT 7 series in Indonesia with prices from Rp3.999 million. | On sale through stores and online |
Spectrum, AI and larger screens reshape the device mix
- 5G modems are moving into phones near Rp3 million, so coverage gains under the 2026 licenses translate into upgrades among owners of older 4G handsets.
- On-device AI adds translation, photo editing and health scoring, and its value to Indonesian buyers depends on Bahasa Indonesia support and on running well on mid-range chips.
- Larger displays lift TV spending as households step up from 32-inch sets toward 43-inch and 55-inch models with built-in streaming apps.
- Connected home devices link speakers, cameras and TVs to phone apps, which raises accessory spending per household and ties buyers to one brand ecosystem.
Need a Custom Version of This Report?
Tailor the scope, geography, or segments to your exact requirements.
- Custom geography or segment scope
- Direct access to our analyst team
Global brands compete on local assembly and retail credit
Competition in Indonesian consumer electronics centers on smartphones, where Chinese and Korean brands fight over price points between Rp2 million and Rp5 million. Samsung combines a local plant with a broad A-series range, while Xiaomi, OPPO and vivo compete through dense offline retail, promotional pricing and installment offers. In laptops, ASUS and Lenovo use certified local production to win public and business buyers, which also supports their consumer ranges. In televisions, Xiaomi is pushing larger screens against established Japanese and Korean brands. Retail partners matter as much as products, because chains such as Erajaya control shelf space, financing tie-ups and trade-in programs. Companies that secure local content certification early, keep entry prices stable through cost spikes and offer credit at the point of sale are best placed to gain share, and the 2025 local launches by Lenovo and ASUS show that certification is now a commercial tool rather than only a compliance step.
How supply is organized from Batam plants to store chains
Supply is concentrated among a handful of global brands that design devices abroad and assemble them locally through contract makers to meet local content rules. PT Sat Nusapersada in Batam builds laptop and desktop lines for several brands, including Lenovo and ASUS, and also makes Motorola phones. Samsung runs its own Cikarang plant, and LG Electronics Indonesia committed Rp374 billion to a Cibitung factory for air conditioners. Entry barriers are high because certification, distribution and after-sales networks take years to build. Margins sit with brands in premium tiers and with retailers in services and financing, while entry-tier margins are thin.
Companies profiled and their roles in this market
| Company | Type | Role in the market |
|---|---|---|
| Samsung Electronics Indonesia | Brand and manufacturer | Builds phones at its Cikarang plant and sells across all price tiers |
| Xiaomi Indonesia | Brand | Sells phones and smart TVs and is expanding into larger TV sizes |
| OPPO Indonesia | Brand | Competes in entry and mid-range phones such as the A6x through retail chains |
| vivo Indonesia | Brand | Sells entry and mid-range phones such as the Y11d and Y21D |
| ASUS Indonesia | Brand | Sells laptops and desktops, with Expert Series models assembled in Batam |
| Lenovo Indonesia | Brand | Sells laptops and PCs, with locally assembled models for public buyers |
| LG Electronics Indonesia | Brand and manufacturer | Operates a production base in Cibitung, Bekasi |
Upgrades and financing, not first purchases, drive value
Credence Research's view is that Indonesian consumer electronics has moved from a volume story to a value story. Most Indonesians are already online, so growth now comes from upgrades, larger screens and financing rather than first purchases. The 2026 spectrum licenses give the clearest catalyst, but the memory-driven price increases of 2026 will slow unit sales before 5G coverage is wide enough to lift them. Brands that hold a credible model near Rp3 million, certify locally and partner with retail chains on credit are best placed. The eastern islands offer the fastest growth, though from a small base.
Values built from device volumes, tier prices and spending
The report uses 2025 as the base year and forecasts to 2035. Market values come from the Credence Research model, built from device volumes, typical retail prices by tier and public data on household spending and imports. Regional, segment and price tier splits for 2025 are Credence Research estimates built from public data. Sources used include Statistics Indonesia, the World Bank, the communications and industry ministries, the Financial Services Authority, the internet providers association, company announcements and Indonesian business press. No interviews or surveys were conducted by Credence Research for this report.
Value shifts toward 5G, AI and wearables through 2035
By 2035 the market reaches USD 23.03 billion, growing at 1.93% a year from USD 19.39 billion in 2026. Growth stays modest because device ownership is already high and real incomes rise slowly, but the mix shifts toward value. 5G-ready phones, AI-enabled devices and wearables gain share, while conventional standalone devices decline. Java remains the largest region, yet Sulawesi & Eastern Indonesia and Kalimantan grow faster as coverage and retail spread. Prices rather than units carry most of the value gain, so suppliers that manage component and currency costs while keeping financing accessible will outperform.
Outcomes hinge on memory prices and the pace of 5G rollout
The range of outcomes depends mainly on how long memory prices stay high and how quickly operators build 5G under their new licenses. A fast easing of chip costs would restore entry-tier volume, while a prolonged shortage combined with a weak rupiah would keep buyers in used phones and delay upgrades. Consumer credit growth decides how much mid-range interest converts into actual sales.
| Scenario | CAGR, 2026–2035 | Value, 2035 | What has to hold |
|---|---|---|---|
| Downside | 0.7% | USD 20.71 billion | Memory shortage lasts into 2028 and the rupiah stays weaker than Rp17,000 per dollar |
| Base | 1.93% | USD 23.03 billion | 5G coverage expands on the license schedule and component costs ease gradually from 2027 |
| Upside | 2.9% | USD 25.15 billion | Chip prices normalize by 2027 and installment credit keeps growing at double-digit rates |
Frequently Asked Questions
How big is the Indonesia consumer electronics market?
Which product type leads the market?
Which region holds the largest share?
How will 5G affect device demand?
Why are phone prices rising in Indonesia?
What do local content rules require?
Which sales channel grows fastest?
Who are the key companies in the market?
Table of Content
Chapter 1 Market Segmentation
- 1.1 Segmentation Framework
- 1.1.1 Product and Service Classification
- 1.1.2 Application and End-Use Classification
- 1.1.3 Technology and Solution Classification
- 1.1.4 Customer and Distribution Channel Classification
- 1.1.5 Geographic Segmentation
- 1.1.6 Market Segment Definitions and Boundaries
- 1.2 By Product Type
- 1.2.1 Smartphones & Tablets
- 1.2.2 Computing Devices
- 1.2.3 TV & Home Entertainment
- 1.2.4 Wearables
- 1.2.5 Audio & Smart Home
- 1.3 By Price Tier
- 1.3.1 Entry/Budget
- 1.3.2 Mid-Range
- 1.3.3 Premium
- 1.3.4 Ultra-Premium
- 1.4 By Technology
- 1.4.1 Connected & IoT-Enabled
- 1.4.2 AI-Enabled Devices
- 1.4.3 5G-Ready Devices
- 1.4.4 Conventional Standalone Devices
Chapter 2 Introduction
- 2.1 Report Objectives and Scope
- 2.2 Product Definition and Industry Terminology
- 2.3 Market Inclusions and Exclusions
- 2.4 Research Process
- 2.4.1 Primary Research and Expert Interviews
- 2.4.2 Secondary Research and Source Review
- 2.4.3 Top-Down and Bottom-Up Estimation
- 2.4.4 Data Triangulation and Verification
- 2.5 Market Size Measurement Basis
- 2.5.1 2025: USD 18.97 billion → 2035: USD 23.03 billion
- 2.6 Historical and Forecast Reference Periods
- 2.6.1 Historical Period: 2018-2025
- 2.6.2 Base Year: 2025
- 2.6.3 Forecast Period: 2025-2035
- 2.7 Research Assumptions and Limitations
Chapter 3 Executive Summary
- 3.1 Market Snapshot and Key Findings
- 3.2 Base-Year Market Size, 2025
- 3.3 Forecast Market Size, 2035
- 3.4 Revenue and Volume Growth Outlook
- 3.5 Key Demand and Supply Indicators
- 3.6 Leading Market Segments
- 3.7 Fastest-Growing Market Opportunities
- 3.8 Regional Performance Highlights
- 3.9 Technology and Industry Transformation
- 3.10 Competitive Landscape Summary
- 3.11 Analyst View and Strategic Implications
Chapter 4 Indonesia Consumer Electronics Market Trends and Developments
- 4.1 Historical Industry Development, 2018-2025
- 4.2 Recent Market Trends and Developments
- 4.3 Demand and Customer Behavior Trends
- 4.4 Technology and Product Innovation
- 4.5 Artificial Intelligence, Automation and Digitalization
- 4.6 Local Manufacturing and Supply Chain Realignment
- 4.7 Industry Partnerships, Mergers and Acquisitions
- 4.8 Sustainability and Circular Economy Developments
- 4.9 Government and Private Sector Investment Trends
- 4.10 Emerging Business Models and Commercialization
- 4.11 Industry Developments and Announcements
Chapter 5 Indonesia Consumer Electronics Market Production, Supply and Demand Analysis
- 5.1 Demand Trend and Consumption Analysis, 2018-2025
- 5.2 Demand Forecast, 2025-2035
- 5.3 Production and Output Trend, 2018-2025
- 5.4 Production and Output Forecast, 2025-2035
- 5.5 Installed Capacity and Capacity Utilization
- 5.6 Company-Wise Production Plants and Statistics
- 5.6.1 Installed Production Capacity
- 5.6.2 Actual Production
- 5.6.3 Planned Capacity and Expansion Targets
- 5.7 Supply Chain Structure and Procurement Trends
- 5.8 Supply-Demand Gap and Bottlenecks
- 5.9 Import Dependence and Sourcing Structure
- 5.10 Contract Manufacturing and Outsourcing
- 5.11 Regional Supply and Demand Concentration
Chapter 6 Indonesia Consumer Electronics Market Pricing Analysis
- 6.1 Pricing Structure and Measurement
- 6.2 Historical Pricing Trends, 2018-2025
- 6.3 Pricing Outlook, 2025-2035
- 6.4 Average Selling Price and Unit Economics
- 6.5 Pricing by Product and Market Segment
- 6.6 Geographic Pricing Differences
- 6.7 Key Input, Energy, Labor and Logistics Costs
- 6.8 Contract Pricing and Purchasing Models
- 6.9 Pricing Sensitivity and Competitive Positioning
- 6.10 Price, Margin and Profitability Implications
Chapter 7 Indonesia Consumer Electronics Market Dynamics
- 7.1 Market Growth Drivers
- 7.1.1 Demand-Side Drivers
- 7.1.2 Technology and Innovation Drivers
- 7.1.3 Infrastructure and Investment Drivers
- 7.1.4 Regulatory and Policy Drivers
- 7.2 Market Restraints
- 7.2.1 Cost and Affordability Constraints
- 7.2.2 Technology and Adoption Barriers
- 7.2.3 Supply Chain and Operational Constraints
- 7.3 Market Challenges
- 7.3.1 Competitive Pressure and Margin Erosion
- 7.3.2 Skills, Infrastructure and Implementation Gaps
- 7.4 Emerging Market Opportunities
- 7.5 Market Dynamics Impact and Time-Horizon Assessment
Chapter 8 Indonesia Consumer Electronics Value Chain Analysis
- 8.1 Industry Value Chain Overview
- 8.2 Upstream Suppliers and Critical Inputs
- 8.3 Technology and Component Providers
- 8.4 Manufacturing or Service Delivery
- 8.5 Distribution, Channel Partners and Integrators
- 8.6 Downstream Applications and End Users
- 8.7 Value Addition and Profit Pools
- 8.8 Vertical Integration and Outsourcing
- 8.9 Supplier Concentration and Risk
- 8.10 Supply Chain Localization and Resilience
Chapter 9 Indonesia Consumer Electronics Market Regulations and Policies
- 9.1 Relevant Laws, Standards and Compliance Frameworks
- 9.2 Product, Service, Safety and Quality Requirements
- 9.3 Government Policies, Incentives and Subsidies
- 9.4 Imports, Exports and Trade Barriers
- 9.5 Public Procurement and Local Content Requirements
- 9.6 Environmental and Sustainability Compliance
- 9.7 Upcoming Policy Changes and Market Implications
Chapter 10 Indonesia Consumer Electronics Market Hotspots and Opportunities
- 10.1 Market Opportunity Mapping and Growth Hotspots
- 10.2 High-Growth Applications and Customer Groups
- 10.3 Underserved Markets and White-Space Opportunities
- 10.4 Emerging Technology and Product Opportunities
- 10.5 New Capacity and Investment Hotspots
- 10.6 Market Entry and Expansion Opportunities
- 10.7 Distribution and Partnership Opportunities
- 10.8 Near-Term and Long-Term Commercial Potential
- 10.9 Opportunity Attractiveness and Execution Risks
Chapter 11 Indonesia Consumer Electronics Market Outlook, 2025-2035
- 11.1 Market Size and Analysis
- 11.1.1 Revenue (Market Measurement: 2025: USD 18.97 billion → 2035: USD 23.03 billion)
- 11.1.2 Market Volume and Quantity Sold
- 11.1.3 Historical Market Size, 2018-2025
- 11.1.4 Base-Year Market Size, 2025
- 11.2 Market Forecast, 2025-2035
- 11.2.1 Revenue Forecast to 2035
- 11.2.2 Volume Forecast to 2035
- 11.2.3 CAGR and Year-on-Year Growth
- 11.2.4 Incremental Revenue Opportunity
- 11.3 Forecast Assumptions and Scenario Analysis
- 11.3.1 Base-Case Forecast
- 11.3.2 Optimistic and Conservative Scenarios
- 11.3.3 Technology, Pricing and Policy Sensitivities
- 11.4 Market Attractiveness and Growth Outlook
Chapter 12 Indonesia Consumer Electronics Market Segmentation and Outlook
- 12.1 Segmentation Summary and Market Shares, 2025
- 12.2 Largest and Fastest-Growing Segments
- 12.3 By Product Type - Market Size and Forecast, 2025-2035
- 12.3.1 Segment Definition and Scope
- 12.3.2 Historical Market Size, 2018-2025
- 12.3.3 Revenue Forecast, 2025-2035
- 12.3.4 Volume Forecast, 2025-2035
- 12.3.5 Base-Year Market Share, 2025
- 12.3.6 Segment CAGR and Growth Drivers
- 12.3.7 Subsegment Market Size and Forecast
- 12.3.7.1 Smartphones & Tablets
- 12.3.7.2 Computing Devices
- 12.3.7.3 TV & Home Entertainment
- 12.3.7.4 Wearables
- 12.3.7.5 Audio & Smart Home
- 12.3.8 Subsegment Pricing and Adoption Trends
- 12.3.9 Leading Suppliers and Competition
- 12.3.10 Regional Demand and Opportunities
- 12.4 By Price Tier - Market Size and Forecast, 2025-2035
- 12.4.1 Segment Definition and Scope
- 12.4.2 Historical Market Size, 2018-2025
- 12.4.3 Revenue Forecast, 2025-2035
- 12.4.4 Volume Forecast, 2025-2035
- 12.4.5 Base-Year Market Share, 2025
- 12.4.6 Segment CAGR and Growth Drivers
- 12.4.7 Subsegment Market Size and Forecast
- 12.4.7.1 Entry/Budget
- 12.4.7.2 Mid-Range
- 12.4.7.3 Premium
- 12.4.7.4 Ultra-Premium
- 12.4.8 Subsegment Pricing and Adoption Trends
- 12.4.9 Leading Suppliers and Competition
- 12.4.10 Regional Demand and Opportunities
- 12.5 By Technology - Market Size and Forecast, 2025-2035
- 12.5.1 Segment Definition and Scope
- 12.5.2 Historical Market Size, 2018-2025
- 12.5.3 Revenue Forecast, 2025-2035
- 12.5.4 Volume Forecast, 2025-2035
- 12.5.5 Base-Year Market Share, 2025
- 12.5.6 Segment CAGR and Growth Drivers
- 12.5.7 Subsegment Market Size and Forecast
- 12.5.7.1 Connected & IoT-Enabled
- 12.5.7.2 AI-Enabled Devices
- 12.5.7.3 5G-Ready Devices
- 12.5.7.4 Conventional Standalone Devices
- 12.5.8 Subsegment Pricing and Adoption Trends
- 12.5.9 Leading Suppliers and Competition
- 12.5.10 Regional Demand and Opportunities
- 12.6 Segment Growth Comparison
- 12.7 Segment Attractiveness and Priority Matrix
Chapter 13 Indonesia Consumer Electronics Geographic Market Outlook, 2025-2035
- 13.1 Domestic Market Distribution and Demand Clusters
- 13.2 State- or Province-Wise Market Size and Forecast, 2025-2035
- 13.3 City and Metropolitan Market Outlook
- 13.4 Industrial, Manufacturing and Commercial Clusters
- 13.5 Geographic Concentration of Key End Users
- 13.6 Local Pricing and Purchasing Differences
- 13.7 Domestic Production Facilities and Capacity Map
- 13.8 Local Infrastructure and Project Pipeline
- 13.9 State-Level Policy and Incentive Differences
- 13.10 Subnational Investment Hotspots and Opportunities
- 13.11 Distribution and Logistics Networks
- 13.12 Domestic Competitive Footprint
Chapter 14 Indonesia Consumer Electronics Technology, Innovation and Sustainability Outlook
- 14.1 Technology Landscape and Maturity
- 14.2 Product, Process and Service Innovation
- 14.3 AI, Automation and Digital Tools in the Industry
- 14.4 Technology Adoption and Performance Benchmarking
- 14.5 Innovation Pipeline and R&D Investment
- 14.6 Patent and Intellectual Property Trends
- 14.7 Energy Efficiency and Resource Management
- 14.8 Sustainability, Recycling and Circularity
- 14.9 Technology Roadmap, 2025-2035
- 14.10 Risks of Obsolescence and Technology Substitution
Chapter 15 Indonesia Consumer Electronics Market Key Strategic Imperatives
- 15.1 Growth and Market Entry Priorities
- 15.2 High-Return Products and Segments
- 15.3 Pricing, Profitability and Cost Optimization
- 15.4 Technology Investment and Product Differentiation
- 15.5 Supply Chain Localization and Resilience
- 15.6 Distribution and Customer Acquisition
- 15.7 Partnership, Acquisition and Capacity Strategy
- 15.8 Regional Expansion Priorities
- 15.9 Short-, Medium- and Long-Term Actions
Chapter 16 Competition Outlook
- 16.1 Industry Competition Characteristics
- 16.2 Market Structure and Concentration
- 16.3 Market Share and Competitive Positioning, 2025
- 16.4 Company-Wise Revenue and Product Benchmarking
- 16.5 Production and Service Capacity Benchmarking
- 16.6 Technology, Pricing and Differentiation
- 16.7 Regional Footprint and Distribution Strength
- 16.8 Mergers, Acquisitions and Strategic Alliances
- 16.9 New Entrants and Competitive Threats
- 16.10 Porter's Five Forces and Industry Attractiveness
- 16.11 Competitive Outlook, 2025-2035
Chapter 17 Company Profiles
- 17.1 Company Coverage and Selection Criteria
- 17.2 Samsung Electronics Indonesia
- 17.2.1 Business Description
- 17.2.2 Company Ownership and Geographic Presence
- 17.2.3 Product and Service Portfolio
- 17.2.4 Manufacturing and Operating Footprint
- 17.2.5 Production Capacity and Expansion Plans
- 17.2.6 Financial Performance and Investment
- 17.2.7 Market Share and Competitive Position
- 17.2.8 Technology and Innovation Capabilities
- 17.2.9 Strategic Alliances or Partnerships
- 17.2.10 Recent Developments
- 17.2.11 Growth Strategy and Outlook
- 17.3 LG Electronics Indonesia
- 17.4 Sony Indonesia
- 17.5 Xiaomi Indonesia
- 17.6 OPPO Indonesia
- 17.7 vivo Indonesia
- 17.8 ASUS Indonesia
- 17.9 Lenovo Indonesia
- 17.10 Panasonic Gobel Indonesia
- 17.11 Sharp Electronics Indonesia
- 17.12 Other Relevant Market Participants
Note: Every listed company is profiled on the structure shown under the first company. The company list is preliminary and may change based on research findings, market developments, data availability and client requirements.
Chapter 18 Disclaimer
- 18.1 Research and Forecast Disclaimer
- 18.2 Data Source and Estimation Limitations
Note: The depth of individual sections depends on data availability for this market. Volume, capacity, trade and other unit-based metrics are included where applicable.

