
IP clients and app bundles reshape the living room box
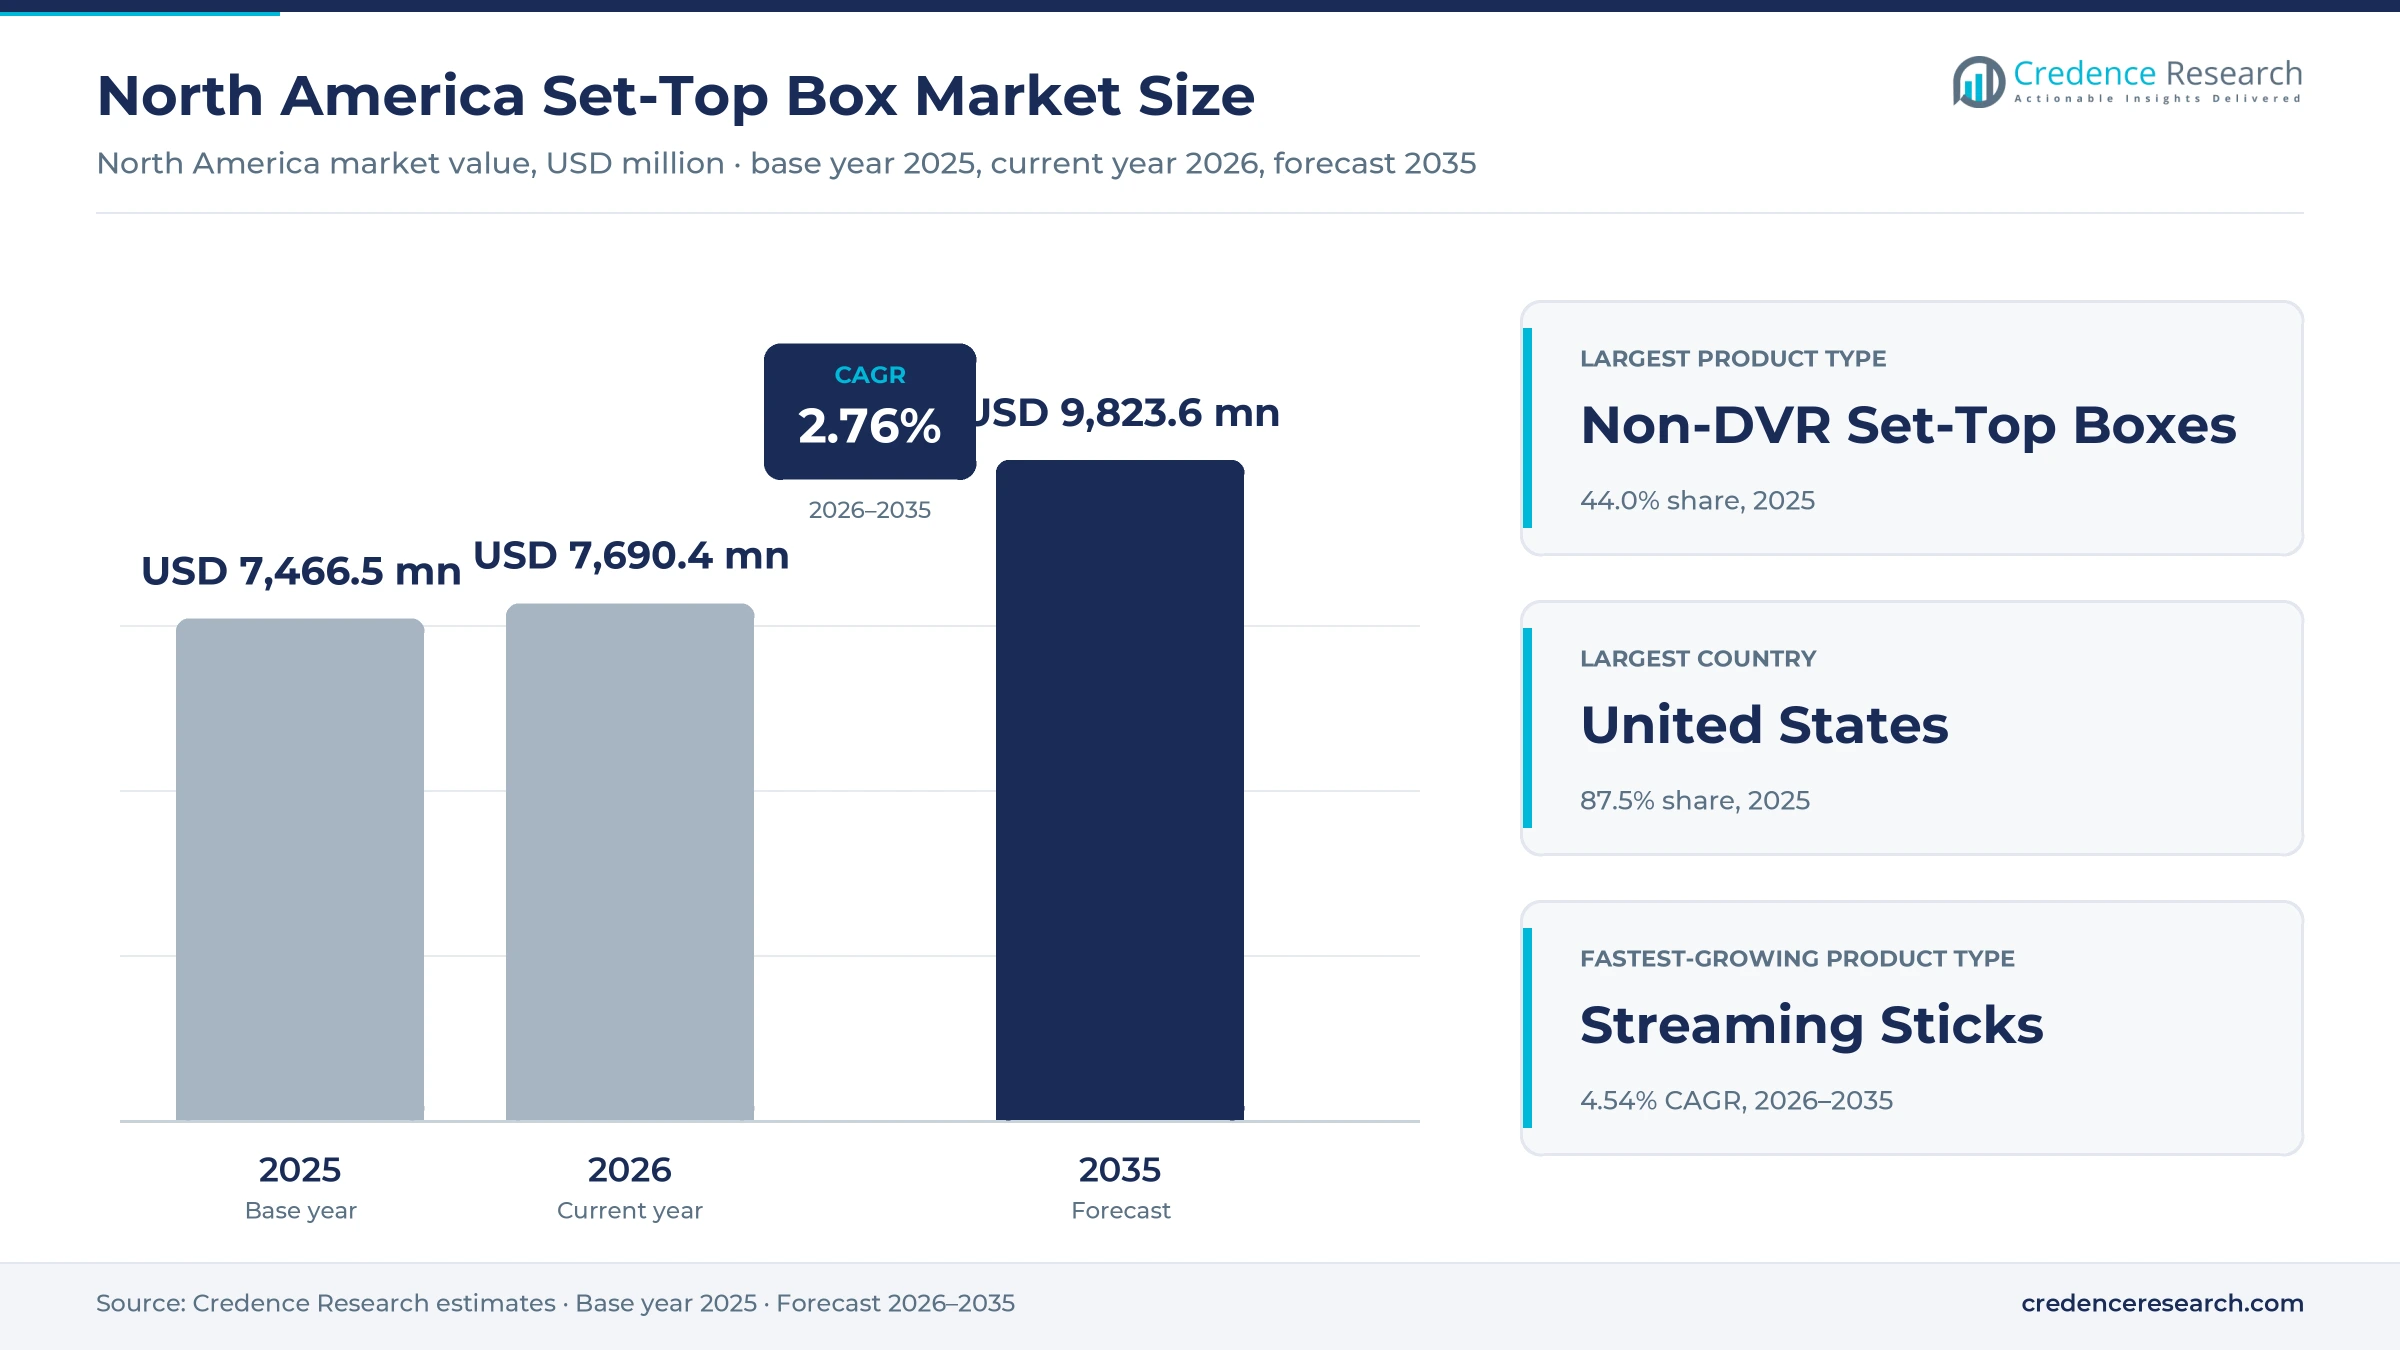
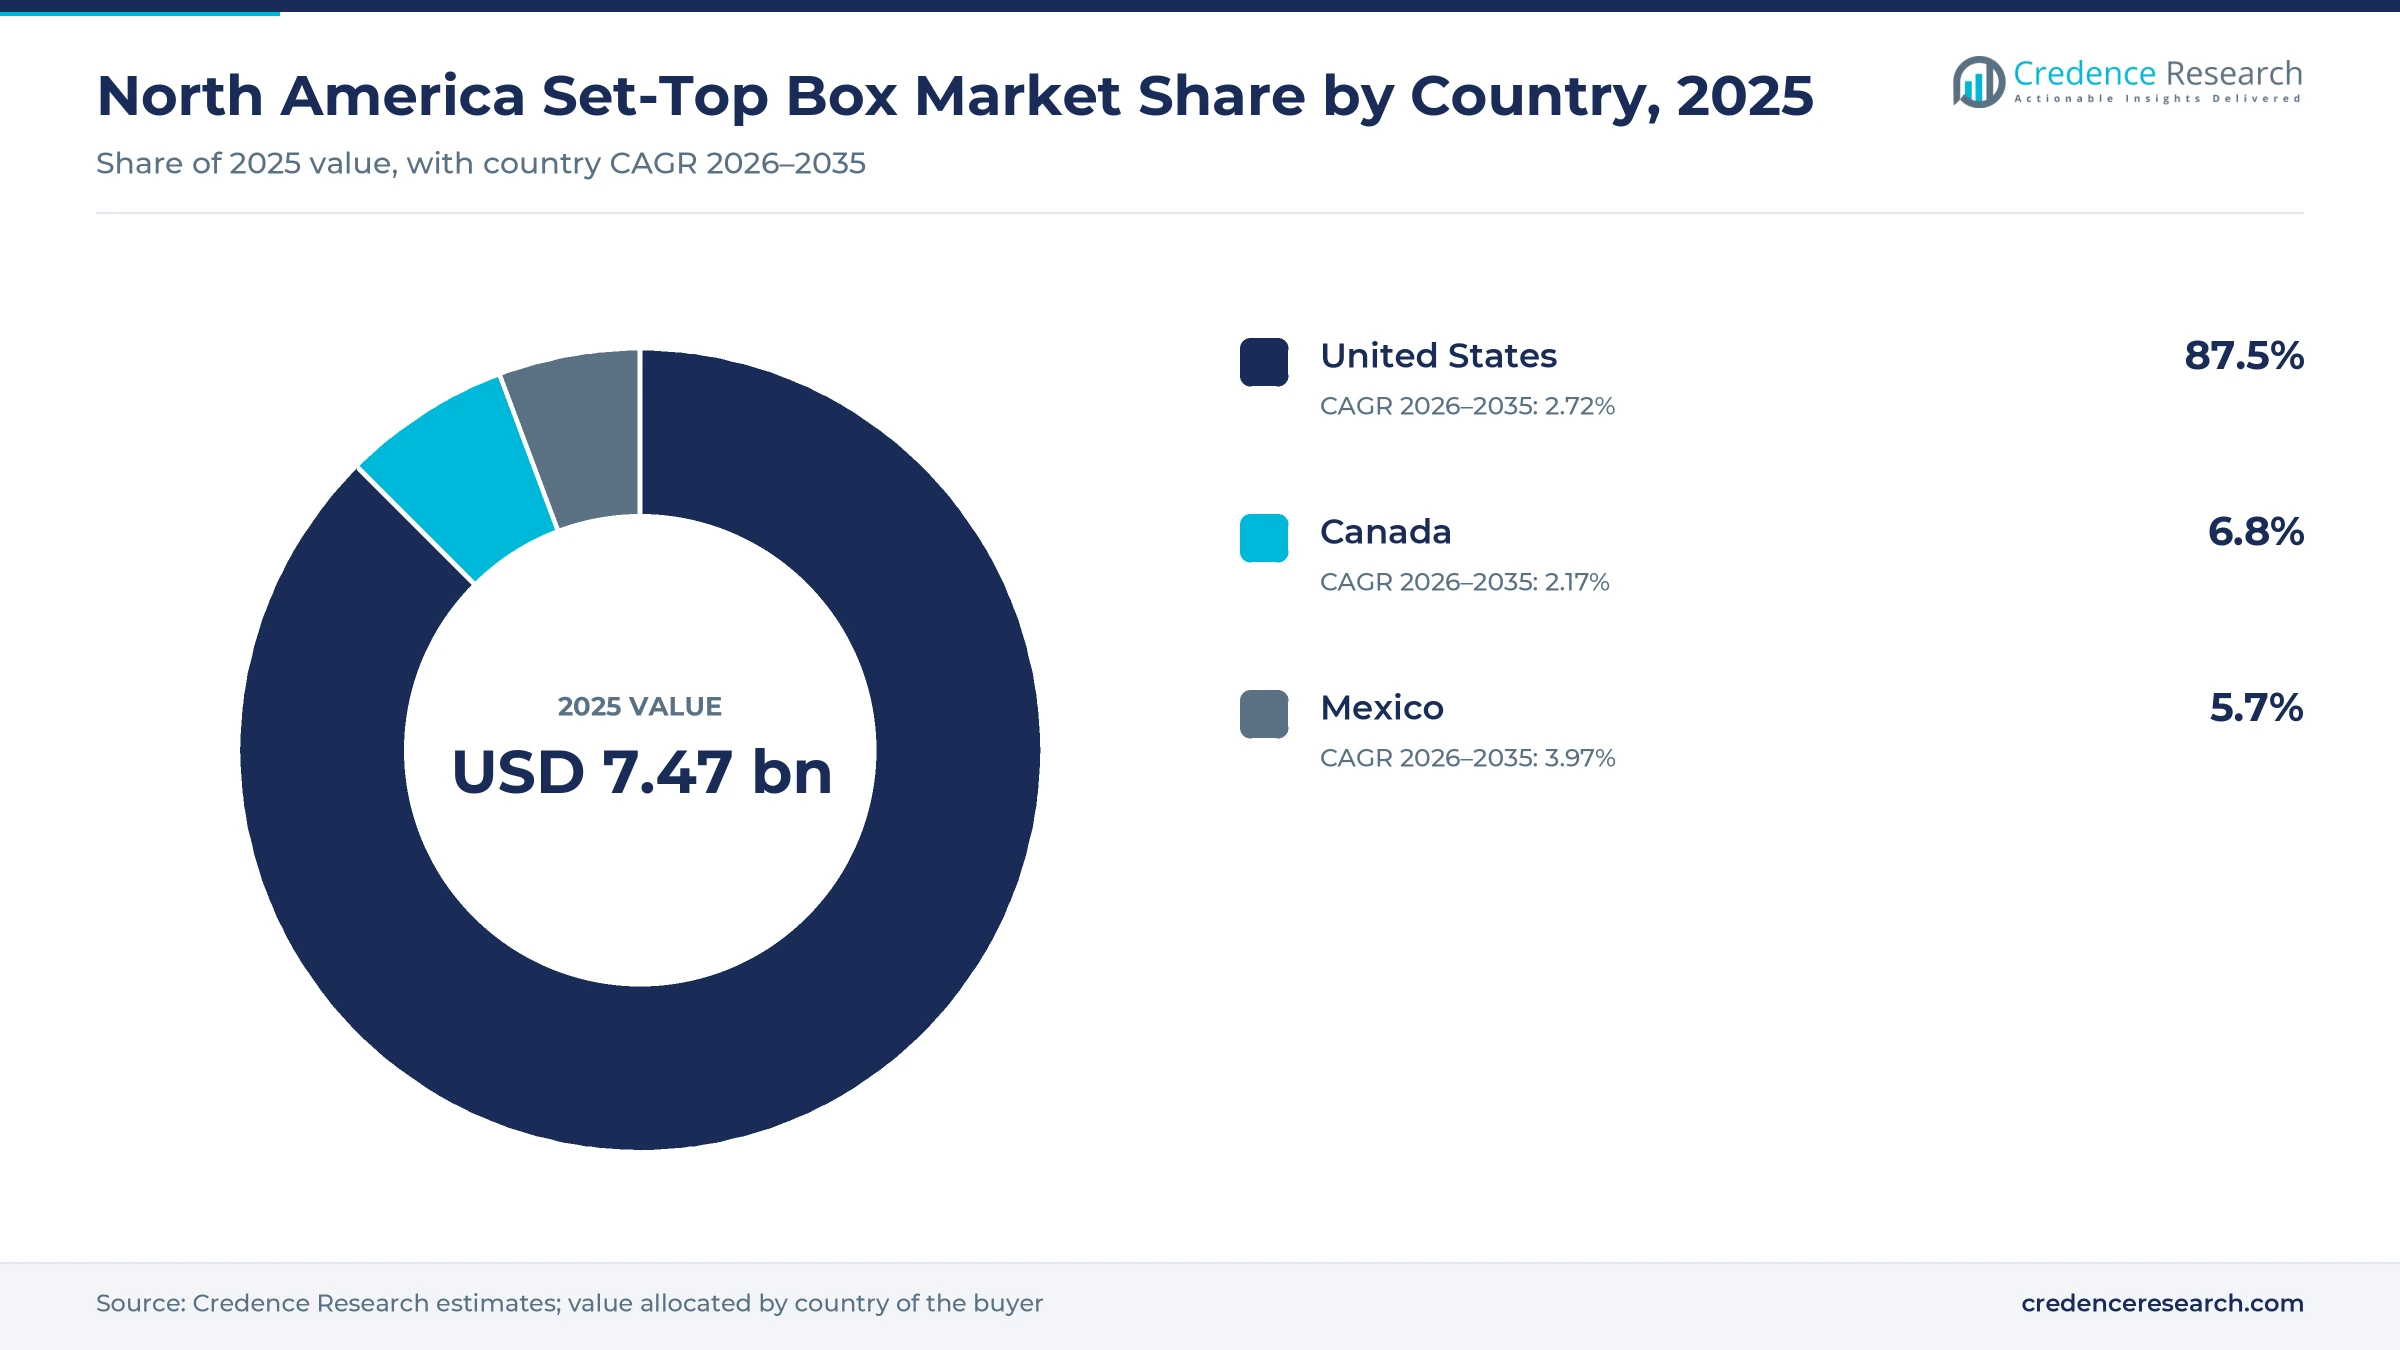
The North America set-top box market was valued at USD 7.47 billion in 2025 and is projected to increase from USD 7.69 billion in 2026 to USD 9.82 billion by 2035, registering a CAGR of 2.76% during 2026–2035. Demand comes from cable and satellite operators replacing legacy receivers with smaller IP clients, and from broadband households buying streaming sticks and premium boxes for app viewing. The United States held the largest share, 87.5% in 2025, because the region's largest video bases at Comcast, Charter, DIRECTV and DISH sit there. Mexico is the fastest-growing country at 3.97% a year, as fiber operators such as Megacable and Totalplay add video customers while legacy pay-TV shrinks. The commercial model also changed after Charter completed its Cox transactions in August 2026, combining two large RDK-based cable footprints. Streaming now takes close to half of U.S. television viewing time, so operators increasingly use their boxes to sell third-party apps rather than only linear channels.
What counts as a set-top box in North America?
The market counts devices that connect a television to cable, satellite, IPTV or internet video, including DVR receivers, non-DVR clients and HDMI streaming sticks. Buyers obtain them through operator leases and installs, consumer electronics stores and brand websites, while hotels buy managed systems through hospitality integrators.
The market excludes smart televisions with built-in operating systems, broadband modems without video functions and the subscription fees for programming or apps. Value covers device sales, equipment leasing charges and software licenses paid for the device platform.
North America Set-Top Box Market Insights
- The market grows from USD 7.47 billion in 2025 to USD 9.82 billion by 2035, a 2.76% CAGR over 2026–2035, as IP clients and sticks replace older satellite and cable receivers.
- The United States led with 87.5% of 2025 value because Charter, Comcast, DIRECTV and DISH serve most of the region's leased receivers.
- Non-DVR set-top boxes held 44.0% of 2025 value, supported by operator IP clients such as the Xumo Stream Box offered to Xfinity Internet customers.
- RDK software passed 200 million devices in September 2025, with Comcast, Charter, Rogers and Megacable among deployers, which lowers platform costs for operators across the region.
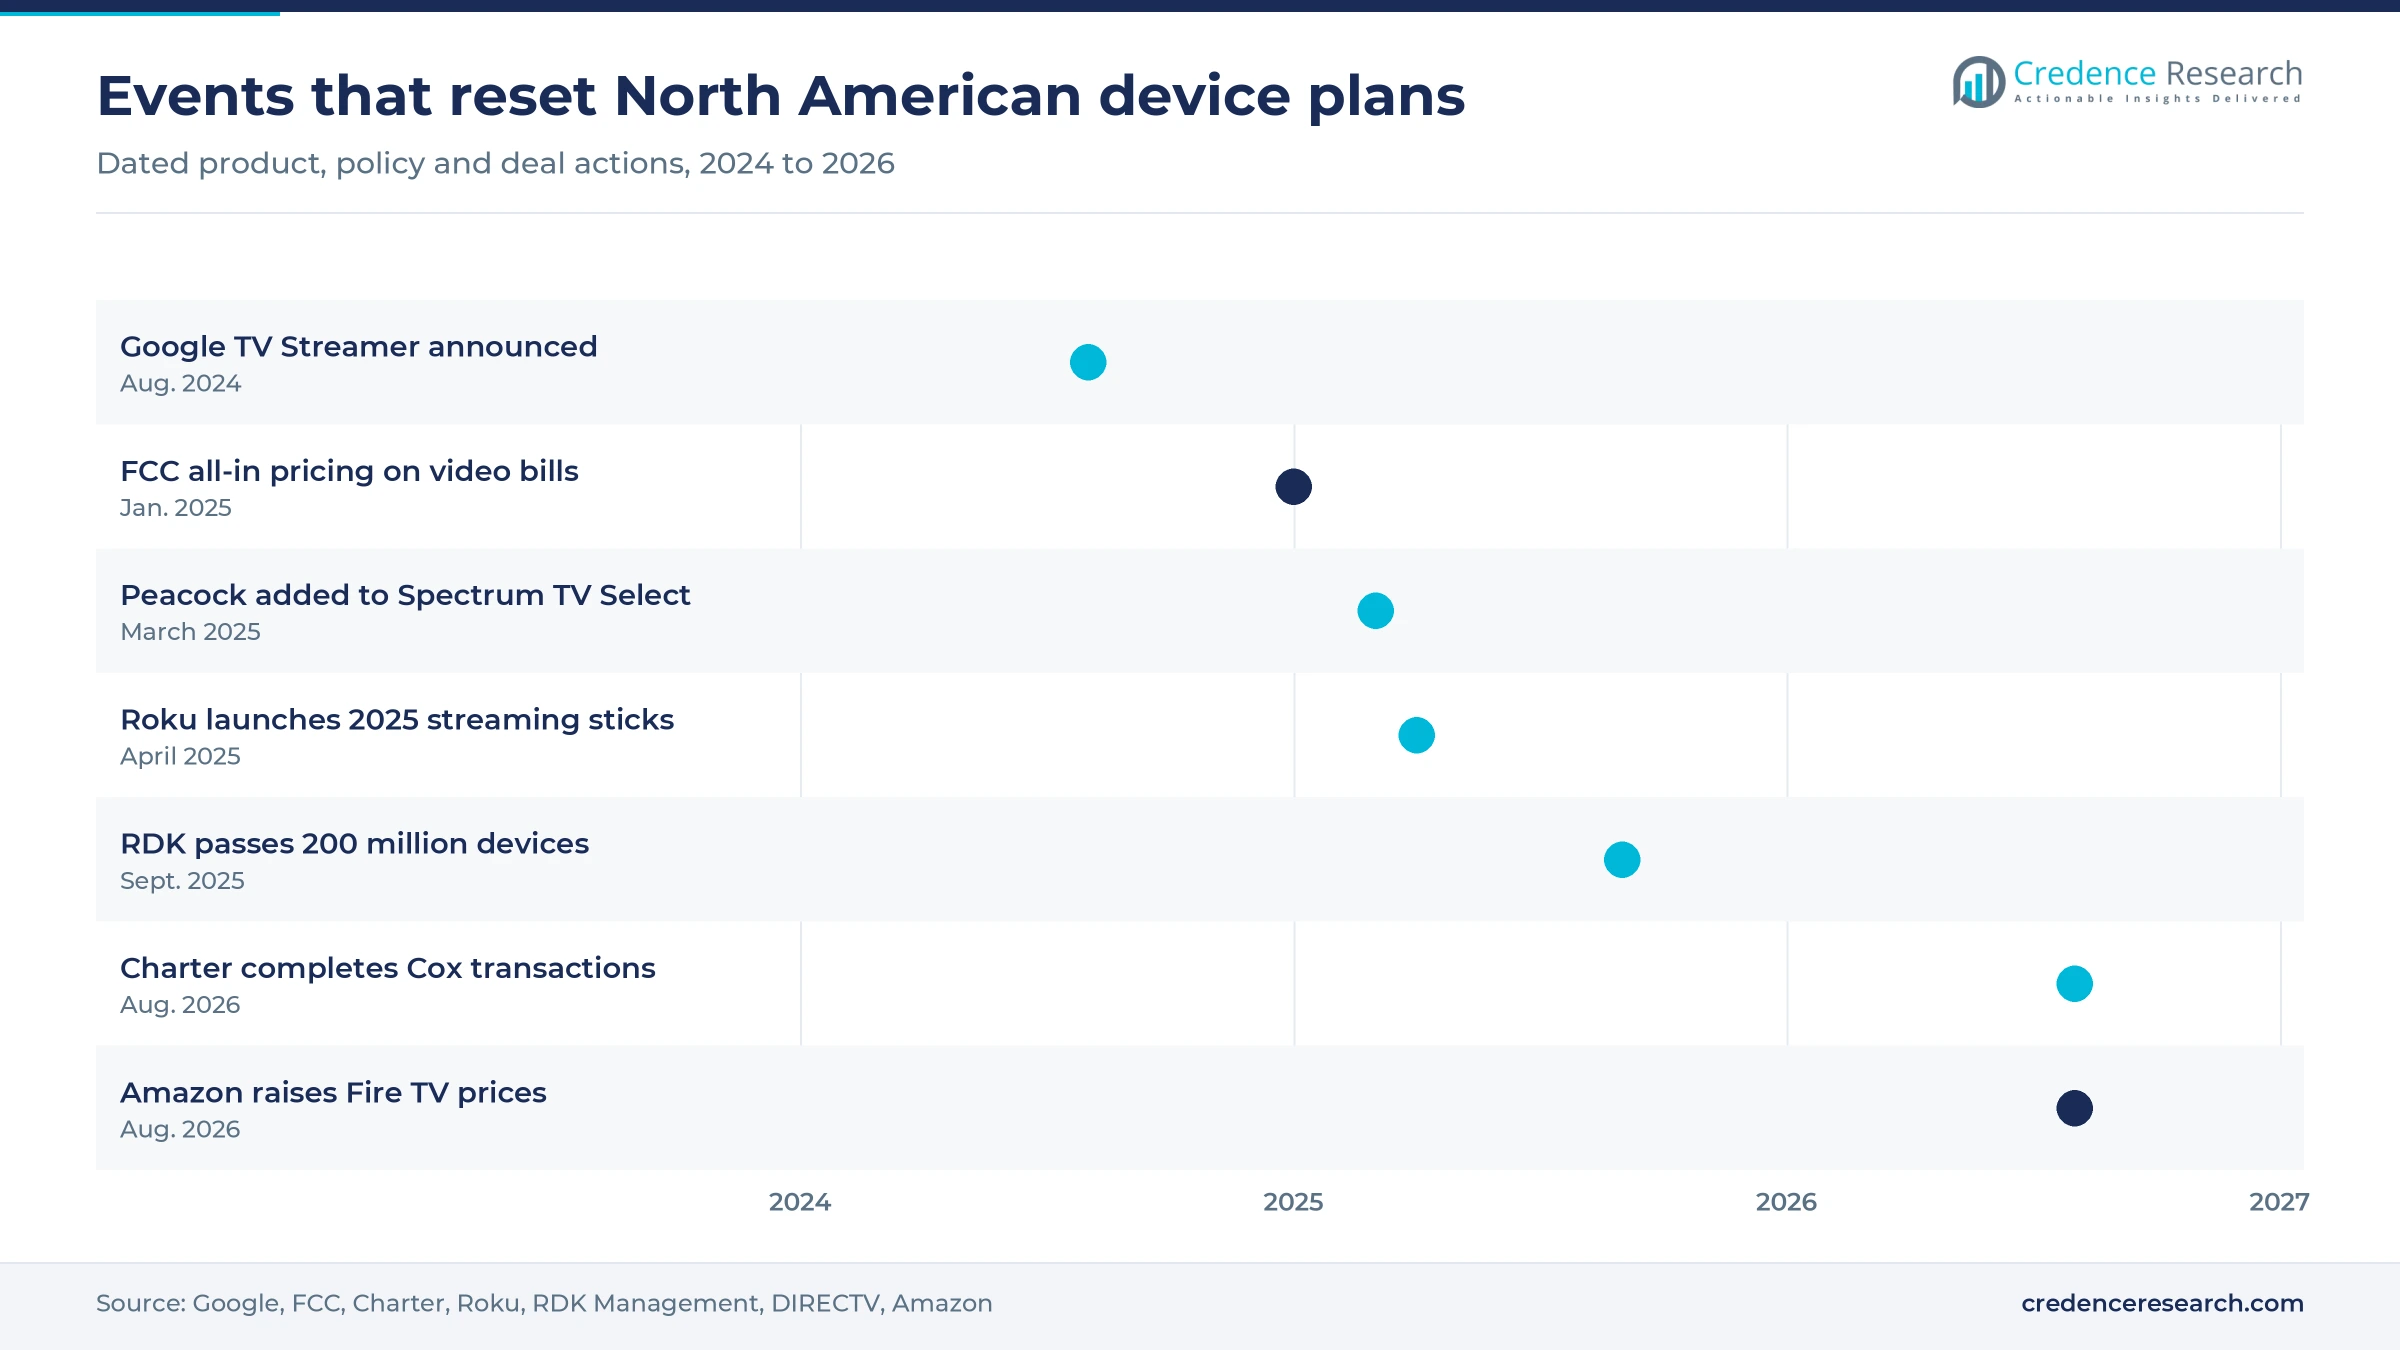
- Amazon raised the Fire TV Stick 4K Max from $59.99 to $84.99 in August 2026, citing memory and storage costs that also pressure other device brands.
Non-DVR clients lead as streaming sticks grow fastest
Why do non-DVR clients outsell recording boxes?
Based on product type, the market is categorized into DVR set-top boxes, non-DVR set-top boxes and streaming sticks. Non-DVR Set-Top Boxes led with 44.0% of 2025 value because operators now ship IP clients without local storage, and Comcast gives Xfinity Internet customers one Xumo Stream Box with the activation fee waived, according to Cord Cutters News. DIRECTV's Gemini client also relies on a Genie server for satellite recordings, according to Light Reading. Streaming Sticks grow fastest at 4.54% a year as entry prices stay low. Roku opened U.S. pre-orders for its $29.99 Streaming Stick and $39.99 Streaming Stick Plus on April 23, 2025, according to Newscast Studio.
Which delivery technology carries the most boxes?
Based on technology, the market is categorized into cable, satellite, IPTV and OTT. Cable led with 46.0% of 2025 value because the two largest cable operators still lease receivers to very large video bases. Charter served 13.8 million video customers on Sept. 30, 2026, according to its third-quarter 2026 earnings release, and TheDesk reported 10.39 million domestic video customers at Comcast. OTT grows fastest at 5.43% a year as viewing moves to apps on retail devices. Nielsen's August 2026 Gauge put cable at 18.9% of U.S. television time, well behind the share taken by streaming.
Who pays for the most devices?
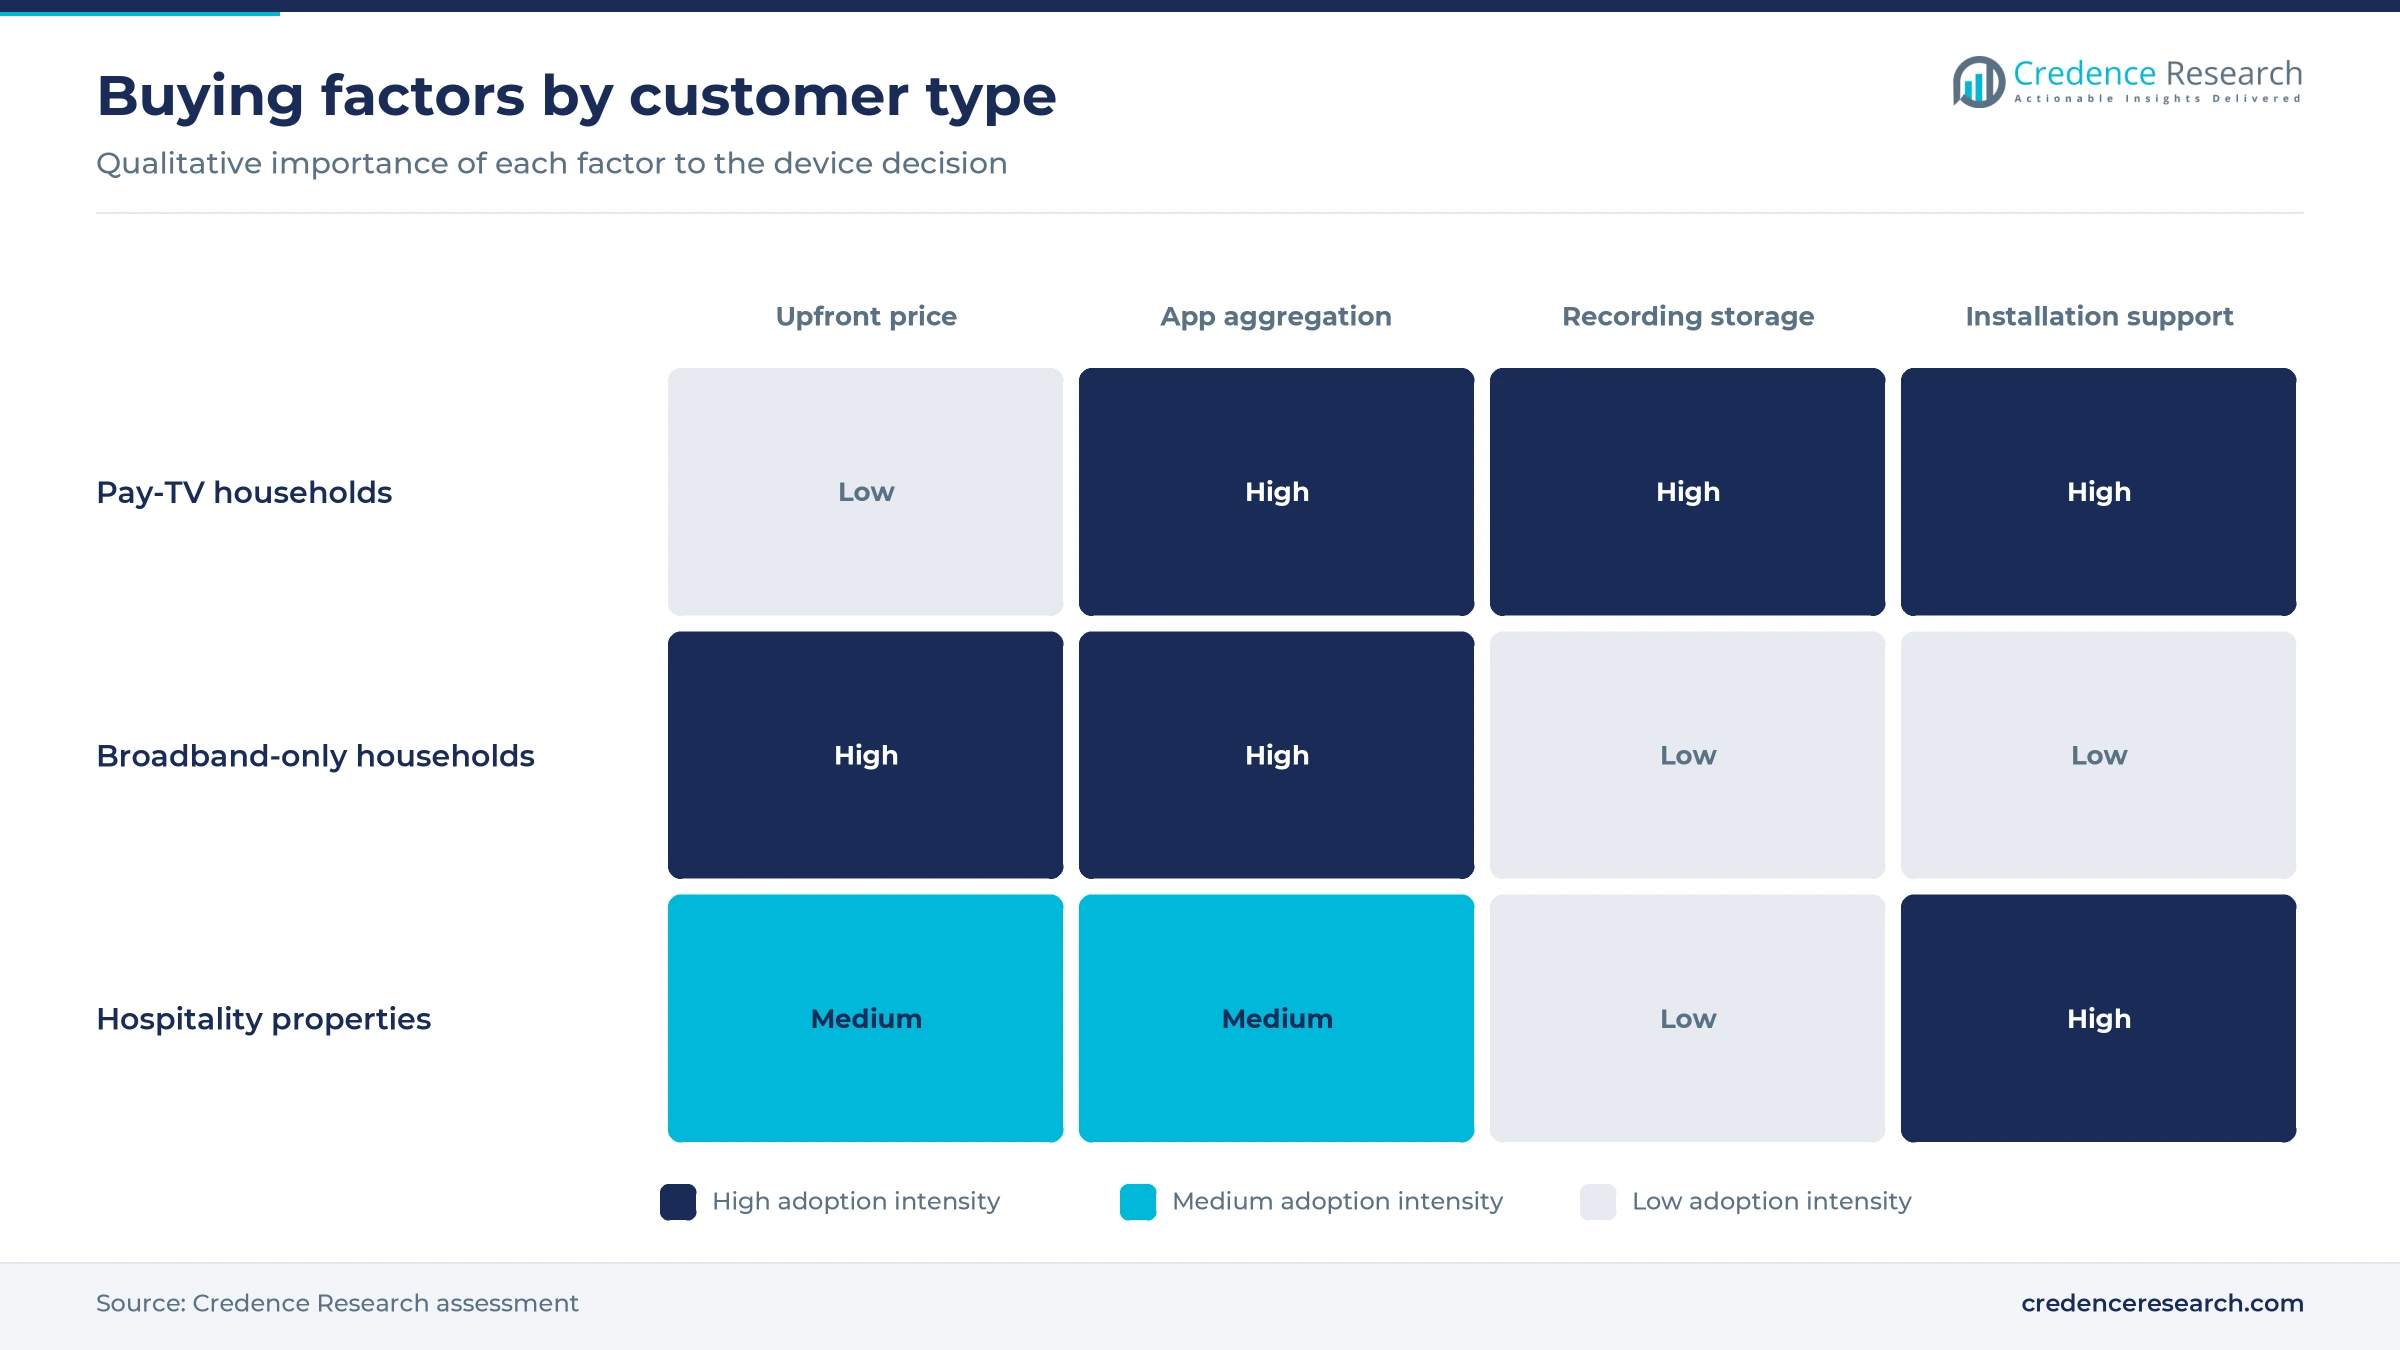
Based on customer type, the market is categorized into pay-TV households, broadband-only households and hospitality properties. Pay-TV Households led with 68.0% of 2025 value because each video subscription usually carries one or more leased receivers. EchoStar counted 4.68 million DISH TV subscribers on June 30, 2026, and DIRECTV lists a $15 monthly Advanced Receiver Fee on its packages, according to the company. Broadband-Only Households grow fastest at 4.66% a year as streaming platforms reach homes without a TV bundle. Roku said in January 2025 that it was present in nearly half of all U.S. broadband households.
How do boxes reach the living room?
Based on distribution channel, the market is categorized into operator fulfillment, consumer electronics retail and brand e-commerce. Operator Fulfillment led with 62.0% of 2025 value because operators install and recover their own hardware, and Comcast requires Xumo boxes to be returned when service ends, according to Cord Cutters News. Brand E-Commerce grows fastest at 4.55% a year as device brands sell directly to households. Roku made its 2025 sticks available through Roku.com and major retailers on May 6, 2025, and Google took U.S. pre-orders for its $99.99 Google TV Streamer from Aug. 7, 2024, according to MacRumors.
| Segment Group | Leading Sub-segment | Share, 2025 | Fastest-growing Sub-segment | CAGR, 2026–2035 |
|---|---|---|---|---|
| By Product Type | Non-DVR Set-Top Boxes | 44.0% | Streaming Sticks | 4.54% |
| By Technology | Cable | 46.0% | OTT | 5.43% |
| By Customer Type | Pay-TV Households | 68.0% | Broadband-Only Households | 4.66% |
| By Distribution Channel | Operator Fulfillment | 62.0% | Brand E-Commerce | 4.55% |
Request a Free Sample
Fill in your details and we'll send you a free sample report.
- Sample data tables & charts
- Research methodology
Broadband swaps and app bundling drive device demand
Broadband homes replace legacy receivers with IP clients
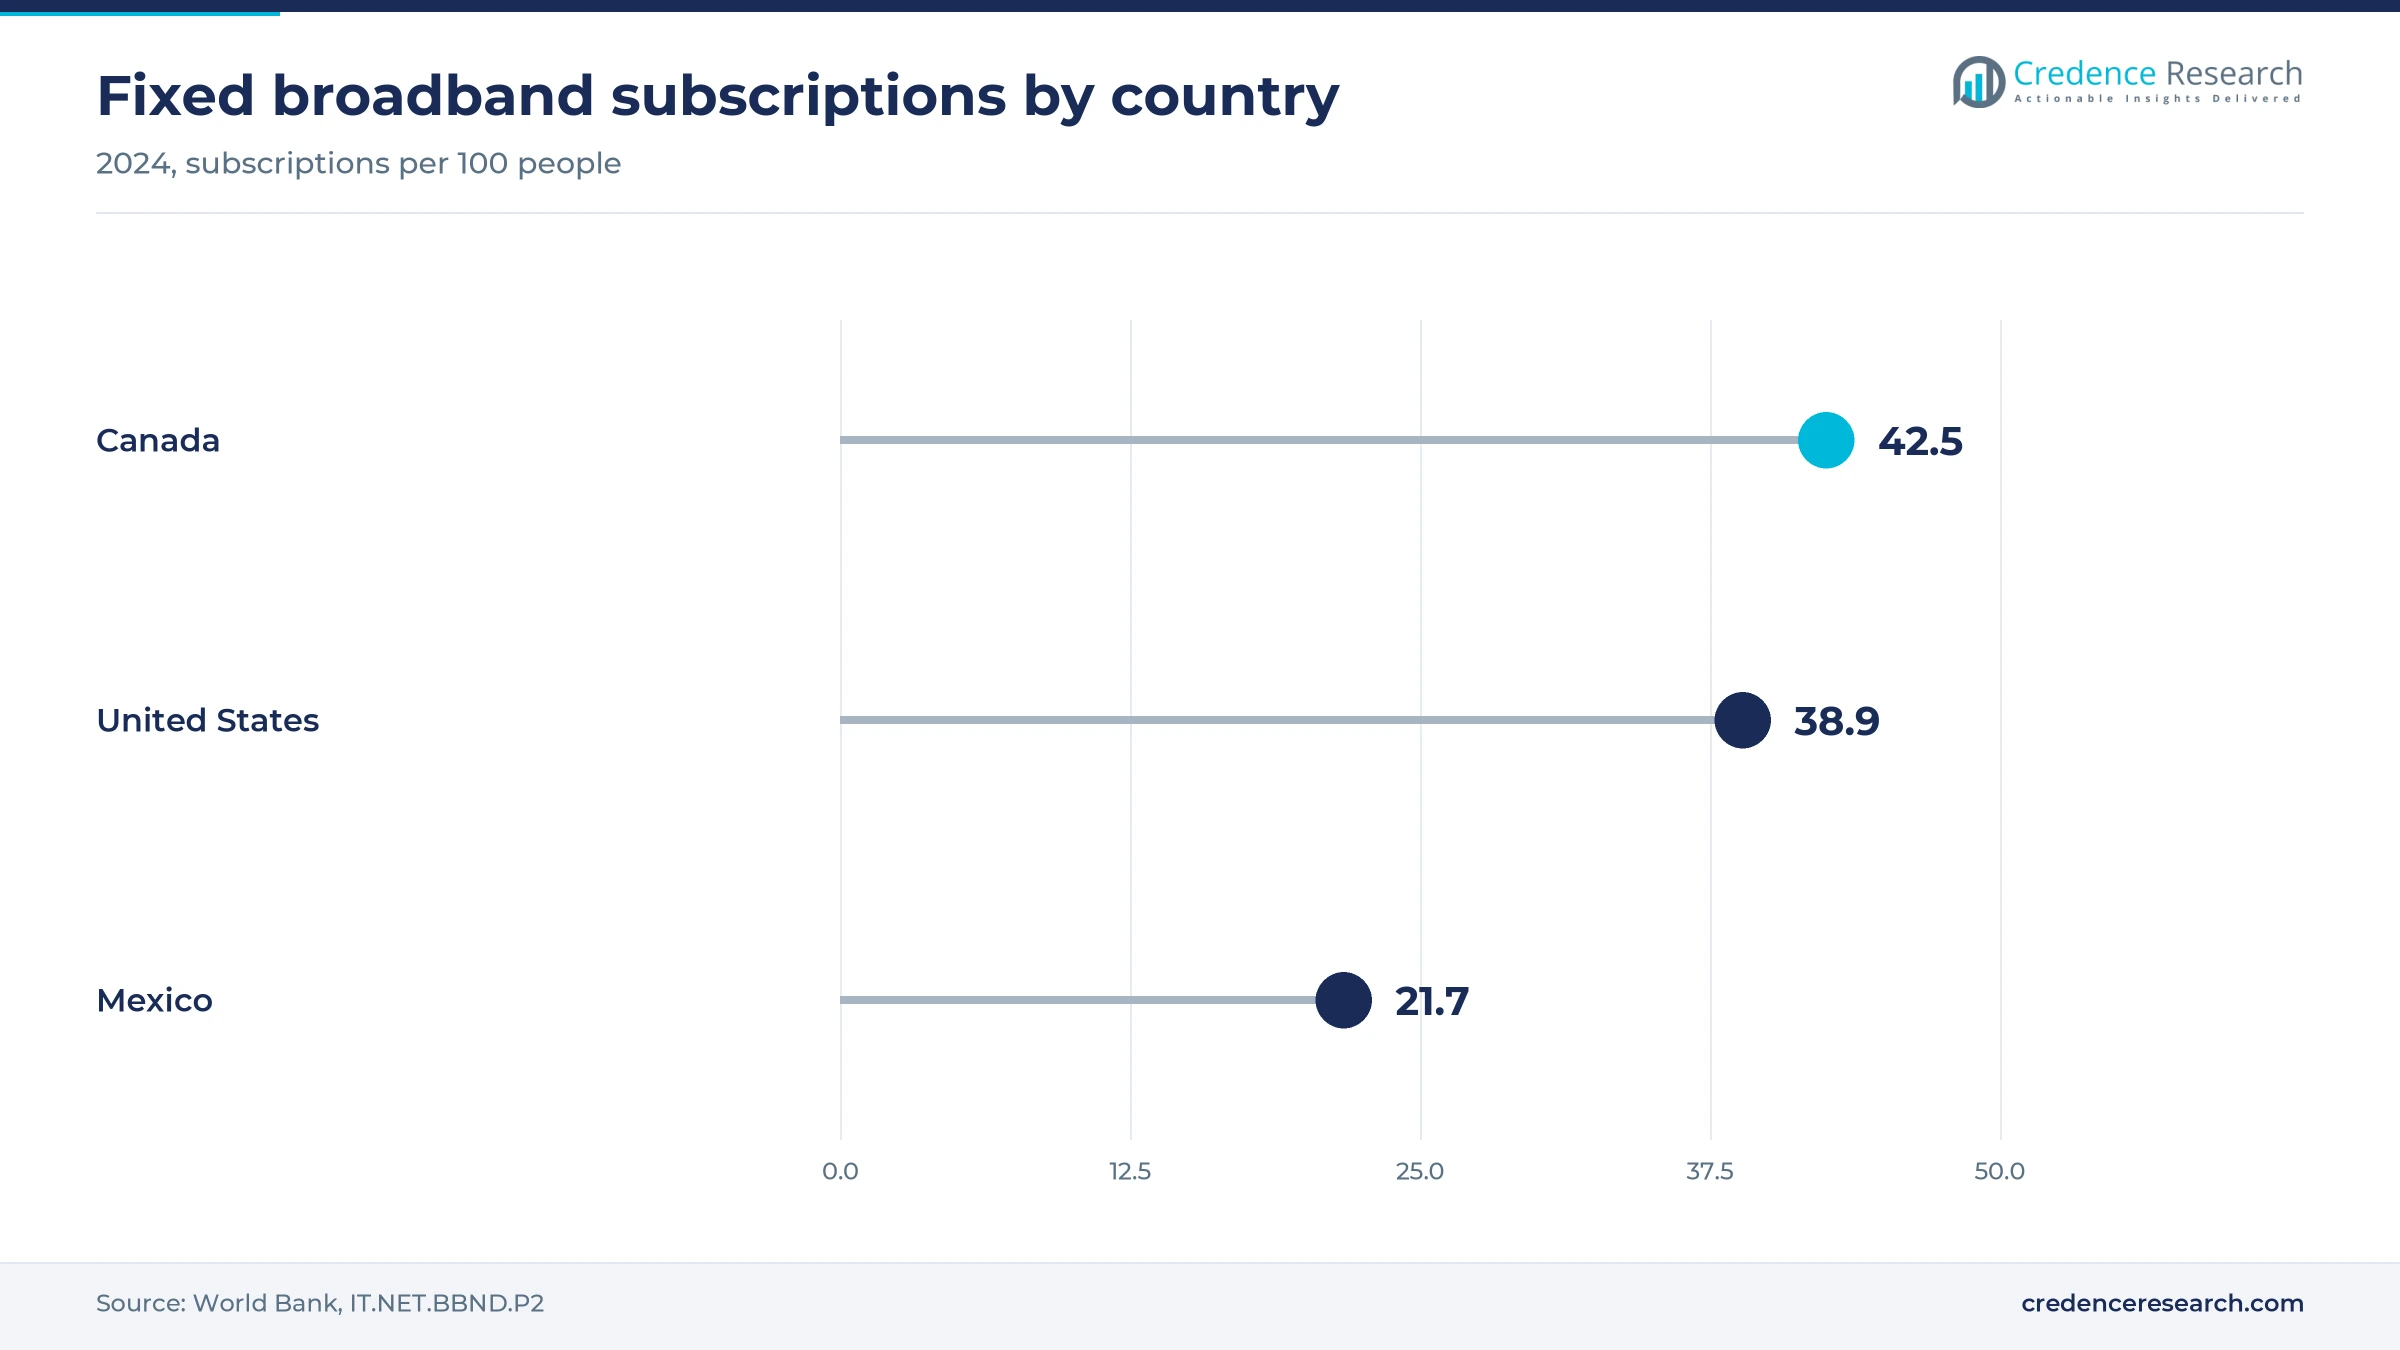
Broadband connections let operators and device brands replace coaxial and satellite receivers with smaller IP clients, which shortens refresh cycles across the installed base. World Bank data show 38.9 fixed broadband subscriptions per 100 people in the United States in 2024, against 42.5 in Canada and 21.7 in Mexico. TheDesk reported that Comcast still held 28.34 million domestic residential broadband customers in the third quarter of 2026. Comcast also gives each Xfinity Internet customer one Xumo Stream Box, according to Cord Cutters News, so every broadband account becomes a possible device placement alongside broadband gateways. DIRECTV's Gemini Air pendant, built by Humax, extends the same approach to DIRECTV Stream, according to TheDesk. As a result, Non-DVR Set-Top Boxes keep the largest share at 44.0% while older receivers retire.
Operators bundle streaming apps onto their own boxes
Pay-TV operators increasingly use their boxes as the place where third-party apps are activated and billed, which keeps operator hardware in the home as viewing moves online. Charter said in a March 27, 2025, release that Spectrum TV Select now includes ad-supported Peacock, Max, Disney+, ESPN+, Paramount+ and ViX, worth up to about $80 a month at retail. Charter's third-quarter 2026 release added that Netflix joined Spectrum App Central in June 2026. DIRECTV took a similar route, putting live channels and apps such as Netflix and HBO Max behind one Google voice remote on Gemini, according to its April 6, 2023, announcement. This bundling helps pay-TV services defend their customer bases, so Pay-TV Households still hold 68.0% of value.
4K, smart home and voice features lift premium device prices
Premium hardware features let brands charge more per device, which raises value even when unit volumes grow slowly. Google priced its Google TV Streamer at $99.99 with 32GB of storage, 4K HDR with Dolby Vision and a built-in Thread border router for Matter devices, according to MacRumors in August 2024. Cord Cutters News reported in August 2026 that the Wi-Fi Apple TV 4K now lists at $199 and the Roku Ultra at $150. DIRECTV's Gemini Air brings Dolby Vision and Dolby Atmos to an operator-supplied device, according to TheDesk. Consequently, premium boxes and 4K sticks widen the value gap over basic HD models, and operators match those features to keep customers from switching to retail streaming devices.
Licensed software platforms spread across operator hardware
Operators increasingly license shared software stacks instead of building their own, which lowers the cost of launching new boxes and keeps software spending inside this market. RDK Management said on Sept. 4, 2025, that RDK software had shipped on more than 200 million devices, naming Comcast, Charter, Cox, Rogers, Vidéotron, Shaw, Megacable and Xumo among its deployers. Roku said in January 2025 that it was the top-selling TV operating system in the United States, Canada and Mexico for the three months to September 2024. DIRECTV Hospitality also agreed with Google in October 2025 to run Android TV on its hotel platform, according to TheDesk. As a result, device software licensing reaches all three countries through the same operating systems that also power smart TV models.
Streaming time and low-power clients reshape hardware
Shift of viewing time toward streaming apps on the TV
Viewing time is moving from linear channels to apps, which changes what households expect a box to do. Streaming took 49.6% of U.S. TV viewing time in August 2026, while broadcast held 17.5%, according to Nielsen, and YouTube alone reached a record 15.8% of television time. TELUS stopped reporting TV subscribers from Jan. 1, 2026, according to its third-quarter 2026 report, which shows Canadian operators placing less weight on linear counts. Comcast's Xumo box also bundles more than 250 apps with Xfinity Stream channels, according to Cord Cutters News. Consequently, OTT grows at 5.43% a year, and operators design new clients around app search rather than channel guides alone.
Rise of low-power IP clients as box energy use falls
Device makers are moving toward low-power clients, which reduces running costs and makes multi-room setups cheaper for households. NCTA said on July 30, 2026, that national set-top box energy use fell about 79%, from 32 TWh in 2012 to 6.8 TWh in 2025, saving consumers an estimated $4.36 billion on utility bills in 2025 alone. The voluntary agreement behind those results has been extended three times, most recently through 2028, according to the same release. Roku's 2025 Streaming Stick and Streaming Stick Plus draw power from the TV's USB port, according to Newscast Studio. In turn, operators can replace DVR receivers with small clients served by cloud recording and IPTV services.
Opening in Mexico as fiber operators add video customers
Mexico offers an opening because television ownership is high while the pay-TV base is moving to newer operators. INEGI reported that 89.9% of households had a television in 2025 and that 75.6% of those owned a smart TV, up 6.6 percentage points from 2024. Xataka México, citing Expansión, reported that pay-TV subscribers fell from 23.4 million in the third quarter of 2020 to 18.3 million in the same quarter of 2025. Over that period, Megacable grew from 3.3 million to 5.3 million and Totalplay from 1.4 million to 2.4 million. Roku also planned to bring its 2025 sticks to Mexico and Canada, according to Newscast Studio, so device suppliers can follow fiber growth across the country.
Opening in hotels as guest rooms adopt streaming platforms
Hotels present an opening because guests now expect their own streaming accounts in the room, which requires managed hardware and software. SONIFI said on June 24, 2024, that it served more than a million rooms across 5,000 properties, with its STAYCAST casting system in more than 500,000 rooms. TheDesk reported in October 2025 that DIRECTV Hospitality and Google would integrate Android TV into DIRECTV's Advanced Entertainment Platform for U.S. hotels. Hospitality Net reported that the American Hotel & Lodging Association projects guest spending of nearly $805 billion in 2026. As a result, hospitality properties remain a small but steady buyer group for managed casting devices and licensed hotel software across the region.
Cord-cutting, memory costs and tariffs squeeze devices
Cord-cutting shrinks the leased receiver base
Video subscriber losses directly cut the number of leased receivers that operators deploy. TheDesk reported that Comcast lost 274,000 domestic video customers in the third quarter of 2026, while EchoStar lost about 241,000 pay-TV subscribers in the second quarter. MobileSyrup reported that Bell lost 5,328 video subscribers in the third quarter of 2026. Operators therefore order fewer DVR receivers, so suppliers must shift toward broadband-only streaming clients and app partnerships.
Memory costs push retail device prices higher
Component costs threaten the low price points that bring households into streaming hardware. Amazon raised the Fire TV Stick 4K Max from $59.99 to $84.99 on Aug. 22, 2026, citing memory and storage costs, according to iClarified. Cord Cutters News reported that the Roku Streaming Stick moved from $30 to $40 in July 2026. Price-sensitive households may delay replacing older sticks, so brands must trim storage, use promotions or rely on platform income to protect volumes.
Tariffs raise the cost of imported hardware
Trade policy adds cost for brands that import finished devices from Asia. Roku said in its quarterly filing for the period ended June 30, 2025, that it expected device gross margin to be slightly lower for 2025, mostly because of tariffs. TheDesk reported that DIRECTV's Gemini Air is built by Humax and made in Vietnam. Importers therefore face margin pressure and pricing risk, and many respond by diversifying assembly locations or passing part of the cost to retail buyers.
Fee transparency rules put equipment charges in view
Price transparency rules make households compare the full monthly cost of video service more closely. Fairfax County reported that FCC all-in pricing rules took effect for cable and satellite bills from January 2025, although equipment fees may still be listed separately. DIRECTV lists a $15 monthly Advanced Receiver Fee on its packages, according to the company. Visible box charges encourage customers to cut receiver counts, so operators increasingly offer one free client and charge for additional rooms.
The United States dominates while Mexico grows fastest
| Country | Value, 2025 (USD billion) | Share, 2025 | CAGR, 2026–2035 |
|---|---|---|---|
| United States | 6.53 | 87.5% | 2.72% |
| Canada | 0.51 | 6.8% | 2.17% |
| Mexico | 0.43 | 5.7% | 3.97% |
The United States leads on operator scale and retail brands
The United States held 87.5% of 2025 value and grows at 2.72% a year, because the largest leased receiver bases and retail streaming brands are concentrated there. Charter completed its Cox transactions on Aug. 19, 2026, and lost 77,000 pro forma video customers in the third quarter, against 121,000 a year earlier. That slower decline matters for operator box orders placed with suppliers. EchoStar still reported 1.71 million Sling TV subscribers in June 2026, which shows streaming bundles reaching homes that use retail devices.
Canada relies on licensed operator platforms
Canada held 6.8% of 2025 value and grows at 2.17% a year, the slowest pace among the three countries. Canadian cable operators Rogers, Vidéotron and Shaw appear among RDK deployers, according to RDK Management, so many boxes share software with U.S. platforms. World Bank data put Canada at 42.5 fixed broadband subscriptions per 100 people in 2024, the highest in the region. That reach supports streaming clients, although TELUS no longer reports TV subscribers, which signals a smaller linear focus.
Mexico grows fastest as fiber operators expand video
Mexico held 5.7% of 2025 value and grows at 3.97% a year, the fastest pace in the region. Expansión reported on July 30, 2026, that Megacable had 4 million unique video subscribers, including 3.8 million on traditional video and 2.4 million app subscriptions. Megacable also appears among RDK deployers, according to RDK Management. However, Mexico recorded only 21.7 fixed broadband subscriptions per 100 people in 2024, according to World Bank data, which limits broadband-only device demand outside large cities.
Launches and deals that reset device plans since 2024
| Development | Status and market relevance |
|---|---|
| In August 2024, Google announced the $99.99 Google TV Streamer as the replacement for Chromecast, with shipping from Sept. 24, 2024. | Adds 32GB storage, Thread and Matter support |
| In March 2025, Charter added ad-supported Peacock Premium to Spectrum TV Select at no extra cost for video customers. | Bundled app value of up to about $80 a month |
| In April 2025, Roku launched its Streaming Stick and Streaming Stick Plus at $29.99 and $39.99 in the U.S. | General availability from May 6, 2025 |
| In October 2025, DIRECTV Hospitality and Google agreed to bring Android TV to DIRECTV's hotel entertainment platform. | Brands and rollout dates to be announced |
| In August 2026, Charter completed its Cox transactions, combining two RDK-based cable operators. | Closed Aug. 19, 2026 |
Shared software stacks decide what each box can do
- RDK operator software runs on Comcast, Charter, Cox, Rogers and Megacable devices, which lets operators share development costs across very large fleets.
- Android TV operator builds power DIRECTV Gemini clients and the DIRECTV Hospitality platform, combining live channels with Google Play apps.
- Retail streaming operating systems such as Roku OS and Google TV run sticks and boxes sold through stores and brand websites.
- Thread and Matter connectivity turns premium boxes such as the Google TV Streamer into smart home hubs, which adds a reason to pay more.
Need a Custom Version of This Report?
Tailor the scope, geography, or segments to your exact requirements.
- Custom geography or segment scope
- Direct access to our analyst team
Operators and streaming brands compete for the HDMI port
Competition divides between pay-TV operators that lease receivers and streaming brands that sell devices at retail, and the line is moving. Comcast and Charter share software through RDK and the Xumo venture, using free or low-cost streaming boxes to keep broadband-only homes on their platforms. DIRECTV and DISH Network defend satellite bases with DVR servers and IP clients, while DIRECTV adds Android TV devices and a hotel platform with Google. Roku competes on price and reach, selling sticks from $29.99 and licensing its operating system to TV makers across the region. Amazon, Google and Apple compete at the premium end with 4K boxes and smart home features. Buyers increasingly judge suppliers on app access, software updates and total monthly cost rather than on hardware specifications alone, so bundling and platform scale now decide most device placements.
Companies profiled and their roles in this market
| Company | Type | Role in the market |
|---|---|---|
| Comcast | Cable operator and platform owner | Leases Xfinity X1 receivers and offers Xumo Stream Boxes to Xfinity Internet customers |
| Charter Communications | Cable operator | Supplies Xumo boxes to Spectrum customers and sells streaming apps through Spectrum App Central |
| DIRECTV | Satellite and streaming operator | Deploys Gemini and Gemini Air clients and builds an Android TV hotel platform with Google |
| DISH Network | Satellite operator | Serves 4.68 million DISH TV subscribers under EchoStar as of June 30, 2026 |
| Roku | Device brand and platform owner | Sells Streaming Stick models across the U.S., Canada and Mexico and licenses Roku OS |
Software and bundles will matter more than hardware
Credence Research's view is that software control and app bundles will decide margins in this market more than hardware specifications. Operators with shared platforms such as RDK can keep device costs low while defending broadband customers with free streaming boxes. Retail brands face a harder period, because memory costs and tariffs raise list prices just as households compare total monthly spending. Suppliers should plan for fewer DVR receivers and more small clients, while operators should price additional room devices carefully to avoid prompting customers to switch to retail alternatives.
How Credence Research built these estimates
The report uses 2025 as the base year and forecasts to 2035, with market values drawn from the Credence Research market model. Segment and country splits are Credence Research estimates informed by operator subscriber counts, device list prices, public statistics and dated company actions. Sources used include government statistics, international organizations, company filings and releases, an industry association release and named trade publications. No interviews or surveys were conducted for this particular report edition.
Broadband-only homes carry device demand to 2035
Through 2035, the market moves from USD 7.69 billion in 2026 to USD 9.82 billion, with broadband-only homes and streaming sticks providing most of the added value. Operator receiver counts should keep falling as households cut video packages, although free IP clients and app marketplaces slow that decline. Mexico should gain share as fiber operators add video customers and smart TV ownership rises beyond the 75.6% recorded by INEGI. Hospitality platforms should expand as more hotels adopt guest casting systems. However, memory prices and tariff policy will continue to influence how quickly retail device volumes grow across all three countries.
Frequently Asked Questions
How big is the North America set-top box market?
Which country leads the market?
Which country grows fastest?
Which product type leads?
Which product type grows fastest?
How does app bundling affect demand?
What are the main challenges?
Who are the leading companies?
Table of Content
Chapter 1 Market Segmentation
- 1.1 Segmentation Framework
- 1.1.1 Product and Service Classification
- 1.1.2 Application and End-Use Classification
- 1.1.3 Technology and Solution Classification
- 1.1.4 Customer and Distribution Channel Classification
- 1.1.5 Geographic Segmentation
- 1.1.6 Market Segment Definitions and Boundaries
- 1.2 By Product Type
- 1.2.1 DVR Set-Top Boxes
- 1.2.2 Non-DVR Set-Top Boxes
- 1.2.3 Streaming Sticks
- 1.3 By Technology
- 1.3.1 Cable
- 1.3.2 Satellite
- 1.3.3 IPTV
- 1.3.4 OTT
- 1.4 By Customer Type
- 1.4.1 Pay-TV Households
- 1.4.2 Broadband-Only Households
- 1.4.3 Hospitality Properties
- 1.5 By Country
- 1.5.1 United States
- 1.5.2 Canada
- 1.5.3 Mexico
Chapter 2 Introduction
- 2.1 Report Objectives and Scope
- 2.2 Product Definition and Industry Terminology
- 2.3 Market Inclusions and Exclusions
- 2.4 Research Process
- 2.4.1 Primary Research and Expert Interviews
- 2.4.2 Secondary Research and Source Review
- 2.4.3 Top-Down and Bottom-Up Estimation
- 2.4.4 Data Triangulation and Verification
- 2.5 Market Size Measurement Basis
- 2.5.1 2025: USD 7.47 billion → 2035: USD 9.82 billion
- 2.6 Historical and Forecast Reference Periods
- 2.6.1 Historical Period: 2018-2025
- 2.6.2 Base Year: 2025
- 2.6.3 Forecast Period: 2025-2035
- 2.7 Research Assumptions and Limitations
Chapter 3 Executive Summary
- 3.1 Market Snapshot and Key Findings
- 3.2 Base-Year Market Size, 2025
- 3.3 Forecast Market Size, 2035
- 3.4 Revenue and Volume Growth Outlook
- 3.5 Key Demand and Supply Indicators
- 3.6 Leading Market Segments
- 3.7 Fastest-Growing Market Opportunities
- 3.8 Regional Performance Highlights
- 3.9 Technology and Industry Transformation
- 3.10 Competitive Landscape Summary
- 3.11 Analyst View and Strategic Implications
Chapter 4 North America Set-Top Box Market Trends and Developments
- 4.1 Historical Industry Development, 2018-2025
- 4.2 Recent Market Trends and Developments
- 4.3 Demand and Customer Behavior Trends
- 4.4 Technology and Product Innovation
- 4.5 Artificial Intelligence, Automation and Digitalization
- 4.6 Local Manufacturing and Supply Chain Realignment
- 4.7 Industry Partnerships, Mergers and Acquisitions
- 4.8 Sustainability and Circular Economy Developments
- 4.9 Government and Private Sector Investment Trends
- 4.10 Emerging Business Models and Commercialization
- 4.11 Industry Developments and Announcements
Chapter 5 North America Set-Top Box Market Production, Supply and Demand Analysis
- 5.1 Demand Trend and Consumption Analysis, 2018-2025
- 5.2 Demand Forecast, 2025-2035
- 5.3 Production and Output Trend, 2018-2025
- 5.4 Production and Output Forecast, 2025-2035
- 5.5 Installed Capacity and Capacity Utilization
- 5.6 Company-Wise Production Plants and Statistics
- 5.6.1 Installed Production Capacity
- 5.6.2 Actual Production
- 5.6.3 Planned Capacity and Expansion Targets
- 5.7 Supply Chain Structure and Procurement Trends
- 5.8 Supply-Demand Gap and Bottlenecks
- 5.9 Import Dependence and Sourcing Structure
- 5.10 Contract Manufacturing and Outsourcing
- 5.11 Regional Supply and Demand Concentration
Chapter 6 North America Set-Top Box Market Pricing Analysis
- 6.1 Pricing Structure and Measurement
- 6.2 Historical Pricing Trends, 2018-2025
- 6.3 Pricing Outlook, 2025-2035
- 6.4 Average Selling Price and Unit Economics
- 6.5 Pricing by Product and Market Segment
- 6.6 Geographic Pricing Differences
- 6.7 Key Input, Energy, Labor and Logistics Costs
- 6.8 Contract Pricing and Purchasing Models
- 6.9 Pricing Sensitivity and Competitive Positioning
- 6.10 Price, Margin and Profitability Implications
Chapter 7 North America Set-Top Box Market Dynamics
- 7.1 Market Growth Drivers
- 7.1.1 Demand-Side Drivers
- 7.1.2 Technology and Innovation Drivers
- 7.1.3 Infrastructure and Investment Drivers
- 7.1.4 Regulatory and Policy Drivers
- 7.2 Market Restraints
- 7.2.1 Cost and Affordability Constraints
- 7.2.2 Technology and Adoption Barriers
- 7.2.3 Supply Chain and Operational Constraints
- 7.3 Market Challenges
- 7.3.1 Competitive Pressure and Margin Erosion
- 7.3.2 Skills, Infrastructure and Implementation Gaps
- 7.4 Emerging Market Opportunities
- 7.5 Market Dynamics Impact and Time-Horizon Assessment
Chapter 8 North America Set-Top Box Value Chain Analysis
- 8.1 Industry Value Chain Overview
- 8.2 Upstream Suppliers and Critical Inputs
- 8.3 Technology and Component Providers
- 8.4 Manufacturing or Service Delivery
- 8.5 Distribution, Channel Partners and Integrators
- 8.6 Downstream Applications and End Users
- 8.7 Value Addition and Profit Pools
- 8.8 Vertical Integration and Outsourcing
- 8.9 Supplier Concentration and Risk
- 8.10 Supply Chain Localization and Resilience
Chapter 9 North America Set-Top Box Market Regulations and Policies
- 9.1 Relevant Laws, Standards and Compliance Frameworks
- 9.2 Product, Service, Safety and Quality Requirements
- 9.3 Government Policies, Incentives and Subsidies
- 9.4 Imports, Exports and Trade Barriers
- 9.5 Public Procurement and Local Content Requirements
- 9.6 Environmental and Sustainability Compliance
- 9.7 Upcoming Policy Changes and Market Implications
Chapter 10 North America Set-Top Box Market Hotspots and Opportunities
- 10.1 Market Opportunity Mapping and Growth Hotspots
- 10.2 High-Growth Applications and Customer Groups
- 10.3 Underserved Markets and White-Space Opportunities
- 10.4 Emerging Technology and Product Opportunities
- 10.5 New Capacity and Investment Hotspots
- 10.6 Market Entry and Expansion Opportunities
- 10.7 Distribution and Partnership Opportunities
- 10.8 Near-Term and Long-Term Commercial Potential
- 10.9 Opportunity Attractiveness and Execution Risks
Chapter 11 North America Set-Top Box Market Outlook, 2025-2035
- 11.1 Market Size and Analysis
- 11.1.1 Revenue (Market Measurement: 2025: USD 7.47 billion → 2035: USD 9.82 billion)
- 11.1.2 Market Volume and Quantity Sold
- 11.1.3 Historical Market Size, 2018-2025
- 11.1.4 Base-Year Market Size, 2025
- 11.2 Market Forecast, 2025-2035
- 11.2.1 Revenue Forecast to 2035
- 11.2.2 Volume Forecast to 2035
- 11.2.3 CAGR and Year-on-Year Growth
- 11.2.4 Incremental Revenue Opportunity
- 11.3 Forecast Assumptions and Scenario Analysis
- 11.3.1 Base-Case Forecast
- 11.3.2 Optimistic and Conservative Scenarios
- 11.3.3 Technology, Pricing and Policy Sensitivities
- 11.4 Market Attractiveness and Growth Outlook
Chapter 12 North America Set-Top Box Market Segmentation and Outlook
- 12.1 Segmentation Summary and Market Shares, 2025
- 12.2 Largest and Fastest-Growing Segments
- 12.3 By Product Type - Market Size and Forecast, 2025-2035
- 12.3.1 Segment Definition and Scope
- 12.3.2 Historical Market Size, 2018-2025
- 12.3.3 Revenue Forecast, 2025-2035
- 12.3.4 Volume Forecast, 2025-2035
- 12.3.5 Base-Year Market Share, 2025
- 12.3.6 Segment CAGR and Growth Drivers
- 12.3.7 Subsegment Market Size and Forecast
- 12.3.7.1 DVR Set-Top Boxes
- 12.3.7.2 Non-DVR Set-Top Boxes
- 12.3.7.3 Streaming Sticks
- 12.3.8 Subsegment Pricing and Adoption Trends
- 12.3.9 Leading Suppliers and Competition
- 12.3.10 Regional Demand and Opportunities
- 12.4 By Technology - Market Size and Forecast, 2025-2035
- 12.4.1 Segment Definition and Scope
- 12.4.2 Historical Market Size, 2018-2025
- 12.4.3 Revenue Forecast, 2025-2035
- 12.4.4 Volume Forecast, 2025-2035
- 12.4.5 Base-Year Market Share, 2025
- 12.4.6 Segment CAGR and Growth Drivers
- 12.4.7 Subsegment Market Size and Forecast
- 12.4.7.1 Cable
- 12.4.7.2 Satellite
- 12.4.7.3 IPTV
- 12.4.7.4 OTT
- 12.4.8 Subsegment Pricing and Adoption Trends
- 12.4.9 Leading Suppliers and Competition
- 12.4.10 Regional Demand and Opportunities
- 12.5 By Customer Type - Market Size and Forecast, 2025-2035
- 12.5.1 Segment Definition and Scope
- 12.5.2 Historical Market Size, 2018-2025
- 12.5.3 Revenue Forecast, 2025-2035
- 12.5.4 Volume Forecast, 2025-2035
- 12.5.5 Base-Year Market Share, 2025
- 12.5.6 Segment CAGR and Growth Drivers
- 12.5.7 Subsegment Market Size and Forecast
- 12.5.7.1 Pay-TV Households
- 12.5.7.2 Broadband-Only Households
- 12.5.7.3 Hospitality Properties
- 12.5.8 Subsegment Pricing and Adoption Trends
- 12.5.9 Leading Suppliers and Competition
- 12.5.10 Regional Demand and Opportunities
- 12.6 By Country - Market Size and Forecast, 2025-2035
- 12.6.1 Segment Definition and Scope
- 12.6.2 Historical Market Size, 2018-2025
- 12.6.3 Revenue Forecast, 2025-2035
- 12.6.4 Volume Forecast, 2025-2035
- 12.6.5 Base-Year Market Share, 2025
- 12.6.6 Segment CAGR and Growth Drivers
- 12.6.7 Subsegment Market Size and Forecast
- 12.6.7.1 United States
- 12.6.7.2 Canada
- 12.6.7.3 Mexico
- 12.6.8 Subsegment Pricing and Adoption Trends
- 12.6.9 Leading Suppliers and Competition
- 12.6.10 Regional Demand and Opportunities
- 12.7 Segment Growth Comparison
- 12.8 Segment Attractiveness and Priority Matrix
Chapter 13 North America Set-Top Box End-Use and Application Market Outlook
- 13.1 End-Use Industry and Customer Demand Structure
- 13.2 Leading Applications and Customer Groups
- 13.3 End-Use Market Size, Share and Forecast
- 13.4 Major End-Use Industry Deep Dives
- 13.4.1 Customer Requirements and Use Cases
- 13.4.2 Demand and Replacement Cycles
- 13.4.3 Technical and Regulatory Considerations
- 13.4.4 Purchasing and Procurement Models
- 13.4.5 Leading Vendors and Distribution Channels
- 13.4.6 Forecast and Commercial Opportunities
- 13.5 Emerging Applications and Cross-Segment Demand
- 13.6 End-Use Industry Investment Priorities
Chapter 14 North America Set-Top Box Geographic Market Outlook, 2025-2035
- 14.1 Regional Market Size and Country-Level Shares, 2025
- 14.2 Country Market Size Comparison, 2025
- 14.3 Country Market Forecasts, 2025-2035
- 14.4 Subregional Industrial and Demand Clusters
- 14.5 Intra-Regional Pricing and Cost Differences
- 14.6 Cross-Border Trade and Supply Networks
- 14.7 Regional Supply and Demand Balances
- 14.8 Country Opportunity Comparison and Prioritization
Note: Every listed country is covered on the structure shown under the first country.
Chapter 15 North America Set-Top Box Technology, Innovation and Sustainability Outlook
- 15.1 Technology Landscape and Maturity
- 15.2 Product, Process and Service Innovation
- 15.3 AI, Automation and Digital Tools in the Industry
- 15.4 Technology Adoption and Performance Benchmarking
- 15.5 Innovation Pipeline and R&D Investment
- 15.6 Patent and Intellectual Property Trends
- 15.7 Energy Efficiency and Resource Management
- 15.8 Sustainability, Recycling and Circularity
- 15.9 Technology Roadmap, 2025-2035
- 15.10 Risks of Obsolescence and Technology Substitution
Chapter 16 North America Set-Top Box Market Key Strategic Imperatives
- 16.1 Growth and Market Entry Priorities
- 16.2 High-Return Products and Segments
- 16.3 Pricing, Profitability and Cost Optimization
- 16.4 Technology Investment and Product Differentiation
- 16.5 Supply Chain Localization and Resilience
- 16.6 Distribution and Customer Acquisition
- 16.7 Partnership, Acquisition and Capacity Strategy
- 16.8 Regional Expansion Priorities
- 16.9 Short-, Medium- and Long-Term Actions
Chapter 17 Competition Outlook
- 17.1 Industry Competition Characteristics
- 17.2 Market Structure and Concentration
- 17.3 Market Share and Competitive Positioning, 2025
- 17.4 Company-Wise Revenue and Product Benchmarking
- 17.5 Production and Service Capacity Benchmarking
- 17.6 Technology, Pricing and Differentiation
- 17.7 Regional Footprint and Distribution Strength
- 17.8 Mergers, Acquisitions and Strategic Alliances
- 17.9 New Entrants and Competitive Threats
- 17.10 Porter's Five Forces and Industry Attractiveness
- 17.11 Competitive Outlook, 2025-2035
Chapter 18 Company Profiles
- 18.1 Company Coverage and Selection Criteria
- 18.2 Comcast
- 18.2.1 Business Description
- 18.2.2 Company Ownership and Geographic Presence
- 18.2.3 Product and Service Portfolio
- 18.2.4 Manufacturing and Operating Footprint
- 18.2.5 Production Capacity and Expansion Plans
- 18.2.6 Financial Performance and Investment
- 18.2.7 Market Share and Competitive Position
- 18.2.8 Technology and Innovation Capabilities
- 18.2.9 Strategic Alliances or Partnerships
- 18.2.10 Recent Developments
- 18.2.11 Growth Strategy and Outlook
- 18.3 Charter Communications
- 18.4 DIRECTV
- 18.5 DISH Network
- 18.6 Roku
- 18.7 Other Relevant Market Participants
Note: Every listed company is profiled on the structure shown under the first company. The company list is preliminary and may change based on research findings, market developments, data availability and client requirements.
Chapter 19 Disclaimer
- 19.1 Research and Forecast Disclaimer
- 19.2 Data Source and Estimation Limitations
Note: The depth of individual sections depends on data availability for this market. Volume, capacity, trade and other unit-based metrics are included where applicable.

