
AI capacity and local regions drive regional demand
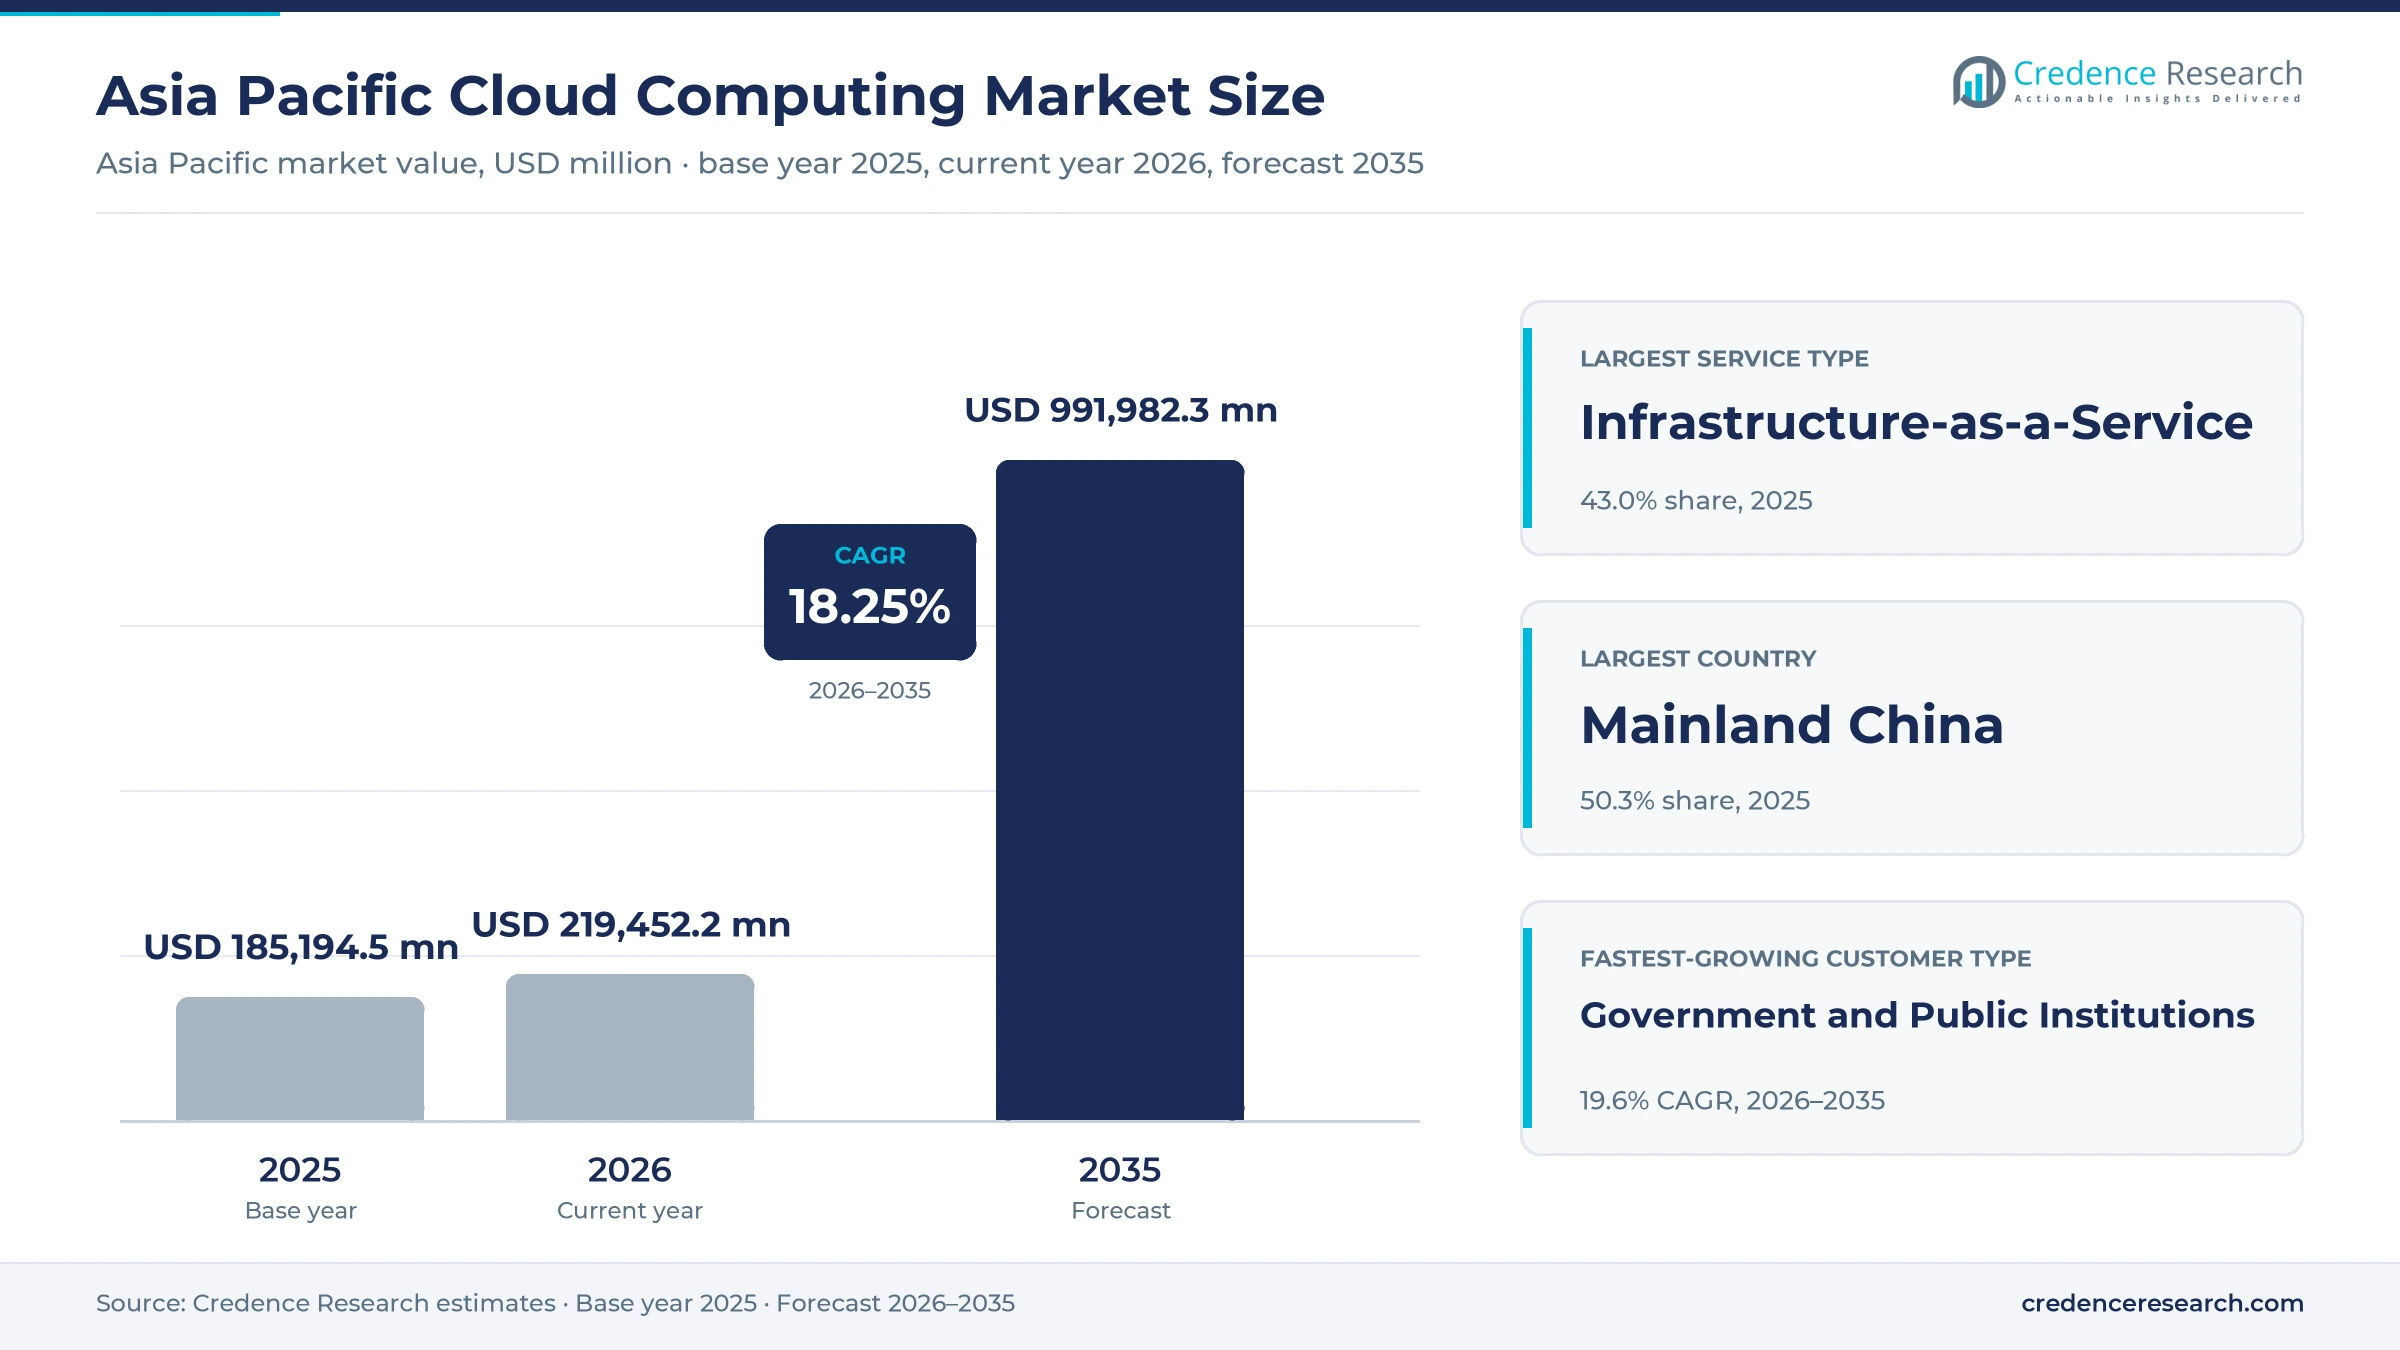
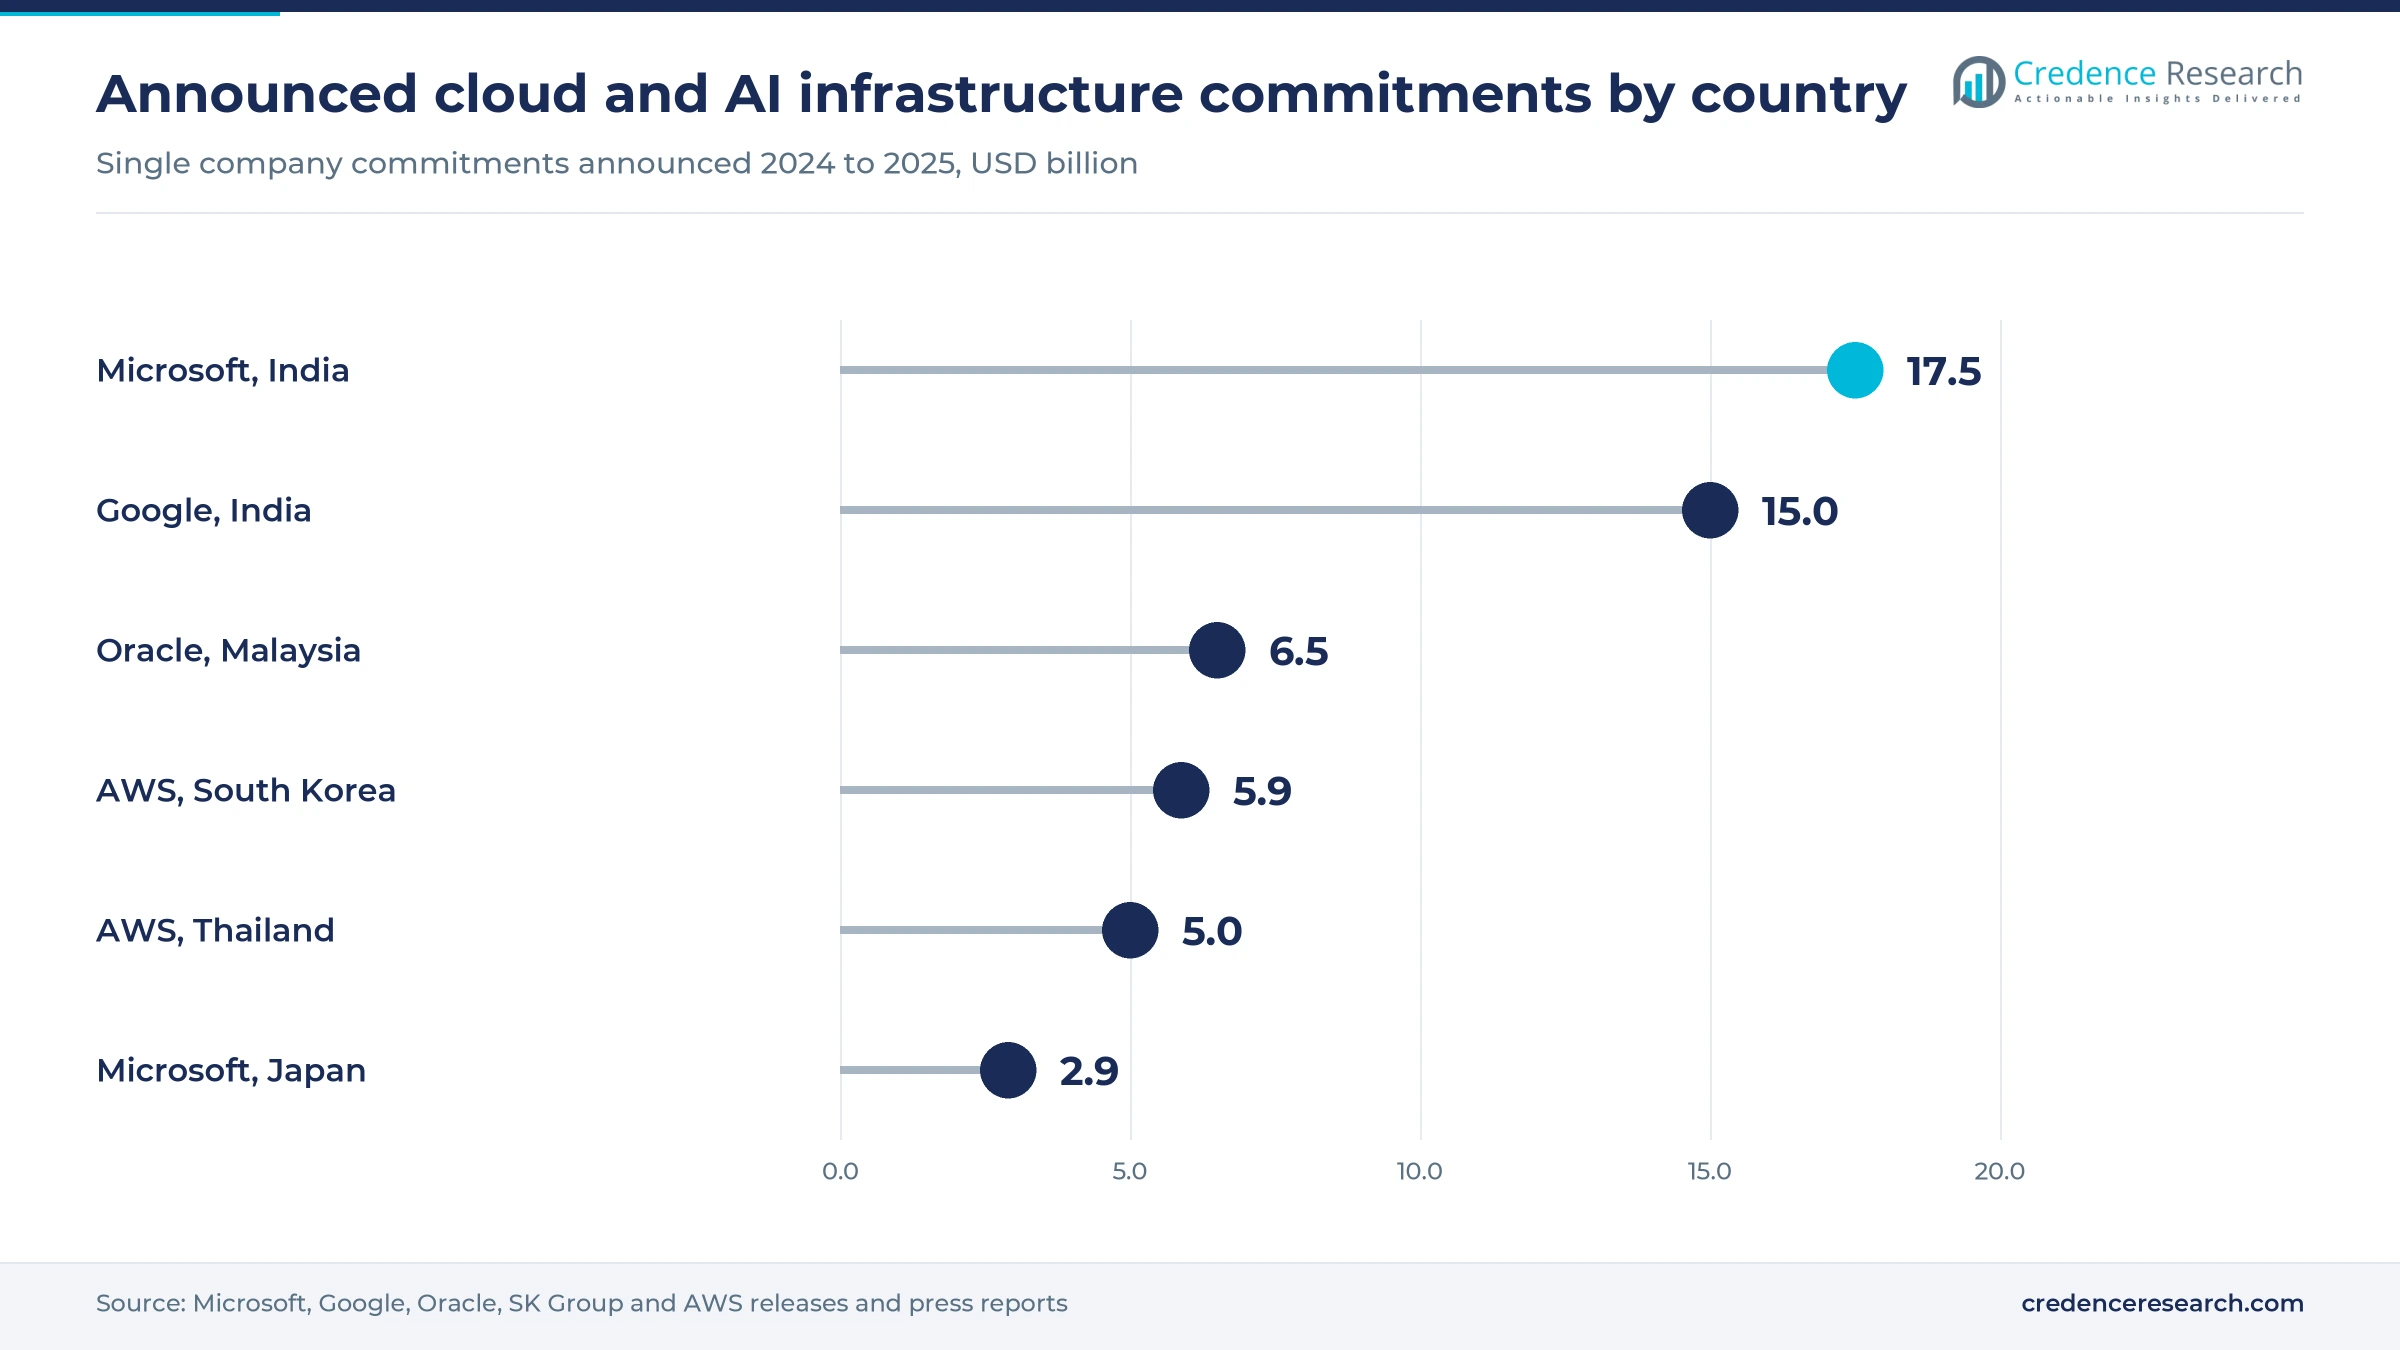
The Asia Pacific cloud computing market was valued at USD 185.19 billion in 2025 and is projected to increase from USD 219.45 billion in 2026 to USD 991.98 billion by 2035, registering a CAGR of 18.25% during 2026–2035. Demand comes from enterprises moving core systems off their own servers, platform companies running apps and payments, governments consolidating agency systems and developers renting GPUs for AI work. Mainland China held the largest country share, 50.3% in 2025, because domestic providers serve a large base of manufacturers, platforms and state-owned firms on local infrastructure. India is the fastest-growing country at 21.9% a year, as new hyperscale regions and subsidized AI compute reach mid-sized firms and start-ups. A notable commercial change came in December 2025, when Microsoft committed USD 17.5 billion to Indian cloud and AI infrastructure over four years. Buyers now choose providers on data residency, AI capacity and committed-spend discounts as much as on list prices.
Rented compute, platforms and software now run most new workloads
The market counts what enterprises, small firms and public bodies in Asia Pacific pay for infrastructure-as-a-service, platform-as-a-service and software-as-a-service delivered from public cloud regions. It covers standard multi-tenant services, regulated and sovereign versions of the same services, and dedicated resources that providers run on public cloud software, billed by consumption, subscription or committed annual spend.
The count excludes on-premises hardware and licenses, colocation space rented without cloud services, and pure consulting fees. Value flows from data center owners and hyperscale providers to platform and application vendors, and then through direct sales teams, self-service consoles, resellers and marketplaces to buyers in each country.
Asia Pacific Cloud Computing Market Insights
- The market rises from USD 185.19 billion in 2025 to USD 991.98 billion by 2035, an 18.25% CAGR, as AI workloads, government migration and new local regions add billable demand.
- Mainland China held 50.3% of 2025 value because domestic providers run large regions for manufacturers, platform companies and state-owned enterprises.
- Infrastructure-as-a-Service led with 43.0% of 2025 value, since AI training and serving consume compute, storage and networking by the hour.
- India is the fastest-growing country at 21.9% a year during 2026–2035, helped by subsidized GPU access and new hyperscale regions in Hyderabad and Visakhapatnam.
- Alibaba Group said on Feb. 24, 2025 that it would invest at least RMB 380 billion in cloud and AI infrastructure over three years.
Infrastructure leads as platform services grow fastest
Why does infrastructure still take the largest share?
Based on service type, the market is categorized into infrastructure-as-a-service, platform-as-a-service and software-as-a-service. Infrastructure-as-a-Service led with 43.0% of 2025 value because hyperscalers keep adding owned capacity across the region, and Amazon said on June 14, 2025 that it would invest AUD 20 billion in Australian data center infrastructure from 2025 to 2029. Platform-as-a-Service grows fastest at 19.8% a year as model access moves onto managed platforms, and Alibaba Cloud said in July 2025 that its new AI center in Singapore would support more than 5,000 businesses and 100,000 developers. Spending on business software subscriptions in India adds a fast-growing application layer above these platforms.
Why are public agencies the fastest-growing buyers?
Based on customer type, the market is categorized into large enterprises, small and medium enterprises, and government and public institutions. Large Enterprises led with 55.0% of 2025 value because big firms already run many workloads on shared platforms, and Japan's communications ministry reported on May 29, 2026 that more than 80% of companies with 100 or more employees use cloud services. Government and Public Institutions grow fastest at 19.6% a year as security agencies sign long contracts, and Australia's Office of National Intelligence said on July 4, 2024 that a Top Secret cloud built with AWS would cost at least AUD 2 billion over a decade.
What makes banks the fastest-growing industry buyers?
Based on end-use industry, the market is categorized into financial services, digital commerce and communications, manufacturing and supply chains, and diversified enterprise and public services. Digital Commerce and Communications led with 31.0% of 2025 value because platform companies run apps, payments and logistics on rented capacity, and Indonesia's GoTo Group signed five-year cloud contracts with both Tencent Cloud and Alibaba Cloud, according to DatacenterDynamics. Financial Services grow fastest at 19.3% a year as in-country regions satisfy bank supervisors, and Computer Weekly reported that Google Cloud's USD 1 billion Bangkok region helps Kasikorn's technology arm KBTG meet Bank of Thailand standards. Factories move more slowly because plant control systems stay on site.
When do buyers pay extra for dedicated resources?
Based on delivery model, the market is categorized into standard shared public cloud, regulated shared public cloud, and dedicated resources on public cloud. Standard Shared Public Cloud led with 68.0% of 2025 value because multi-tenant regions give the lowest unit cost, and AWS opened its Thailand region on Jan. 8, 2025 with three availability zones and more than USD 5 billion of planned investment. Dedicated Resources on Public Cloud grow fastest at 19.9% a year, and NTT DATA began selling OpenCanvas Type-Oracle Alloy in East Japan in December 2025, keeping all data in its Japanese data centers. Buyers that once chose dedicated private hosting in Japan now gain public platform features.
| Segment Group | Leading Sub-segment | Share, 2025 | Fastest-growing Sub-segment | CAGR, 2026–2035 |
|---|---|---|---|---|
| By Service Type | Infrastructure-as-a-Service | 43.0% | Platform-as-a-Service | 19.8% |
| By Customer Type | Large Enterprises | 55.0% | Government and Public Institutions | 19.6% |
| By End-Use Industry | Digital Commerce and Communications | 31.0% | Financial Services | 19.3% |
| By Delivery Model | Standard Shared Public Cloud | 68.0% | Dedicated Resources on Public Cloud | 19.9% |
Falling compute prices meet rising software list prices
Cloud is billed by consumption, by subscription or against a committed annual spend, and each model moves differently. Infrastructure prices drift down as providers chase AI customers, which the Alibaba cuts in the table show most clearly, while application vendors raise list prices as they add AI features. Subsidies distort compute prices in India, where government GPU rates sit well below commercial on-demand rates. Committed-spend contracts give large buyers the deepest discounts, so provider margins are highest on smaller self-service accounts and on managed AI services.
| Offer or segment | Typical price or fee | Basis |
|---|---|---|
| Subsidized GPU compute, IndiaAI Mission | About Rs 65 per GPU hour | Business Standard, June 2026 |
| Alibaba Cloud core products, China | Cuts of up to 55% on more than 100 specifications | CNBC, February 2024 |
| Salesforce Enterprise and Unlimited editions | Average list price rise of 6% from Aug. 1, 2025 | Salesforce Ben, 2025 |
| Japan local government core systems on Government Cloud | Operating cost target at least 30% below fiscal 2018 | Digital Agency, 2026 |
Request a Free Sample
Fill in your details and we'll send you a free sample report.
- Sample data tables & charts
- Research methodology
AI, public procurement and local regions lift billing
AI deployment expands infrastructure and platform billing
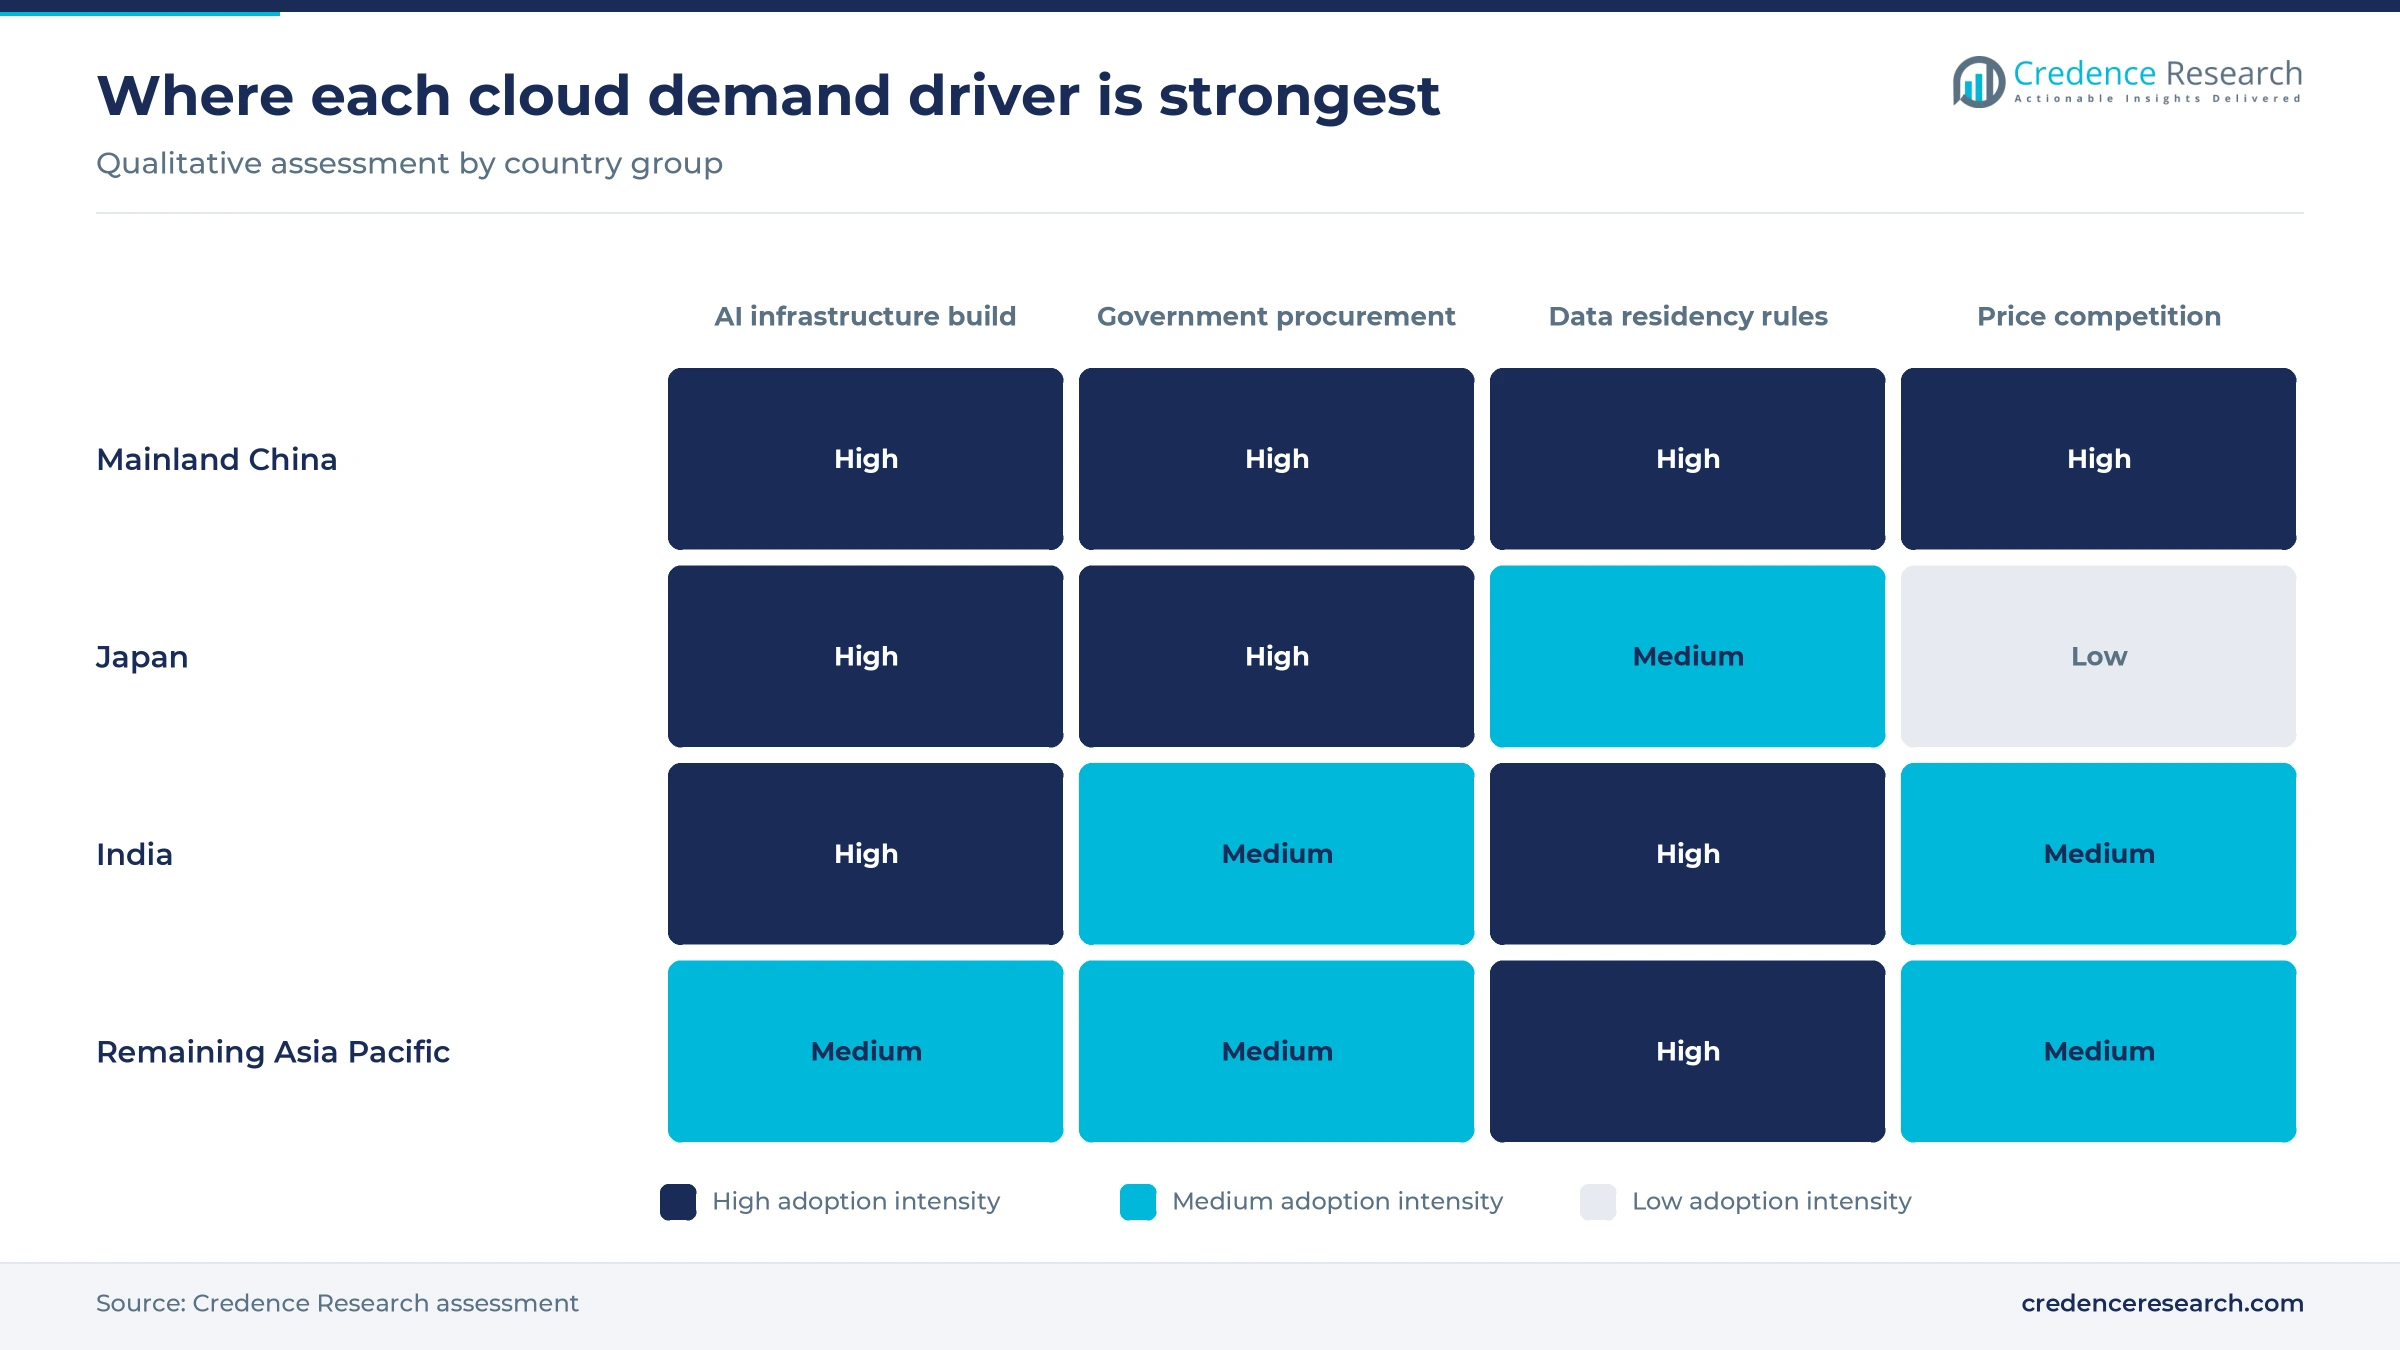
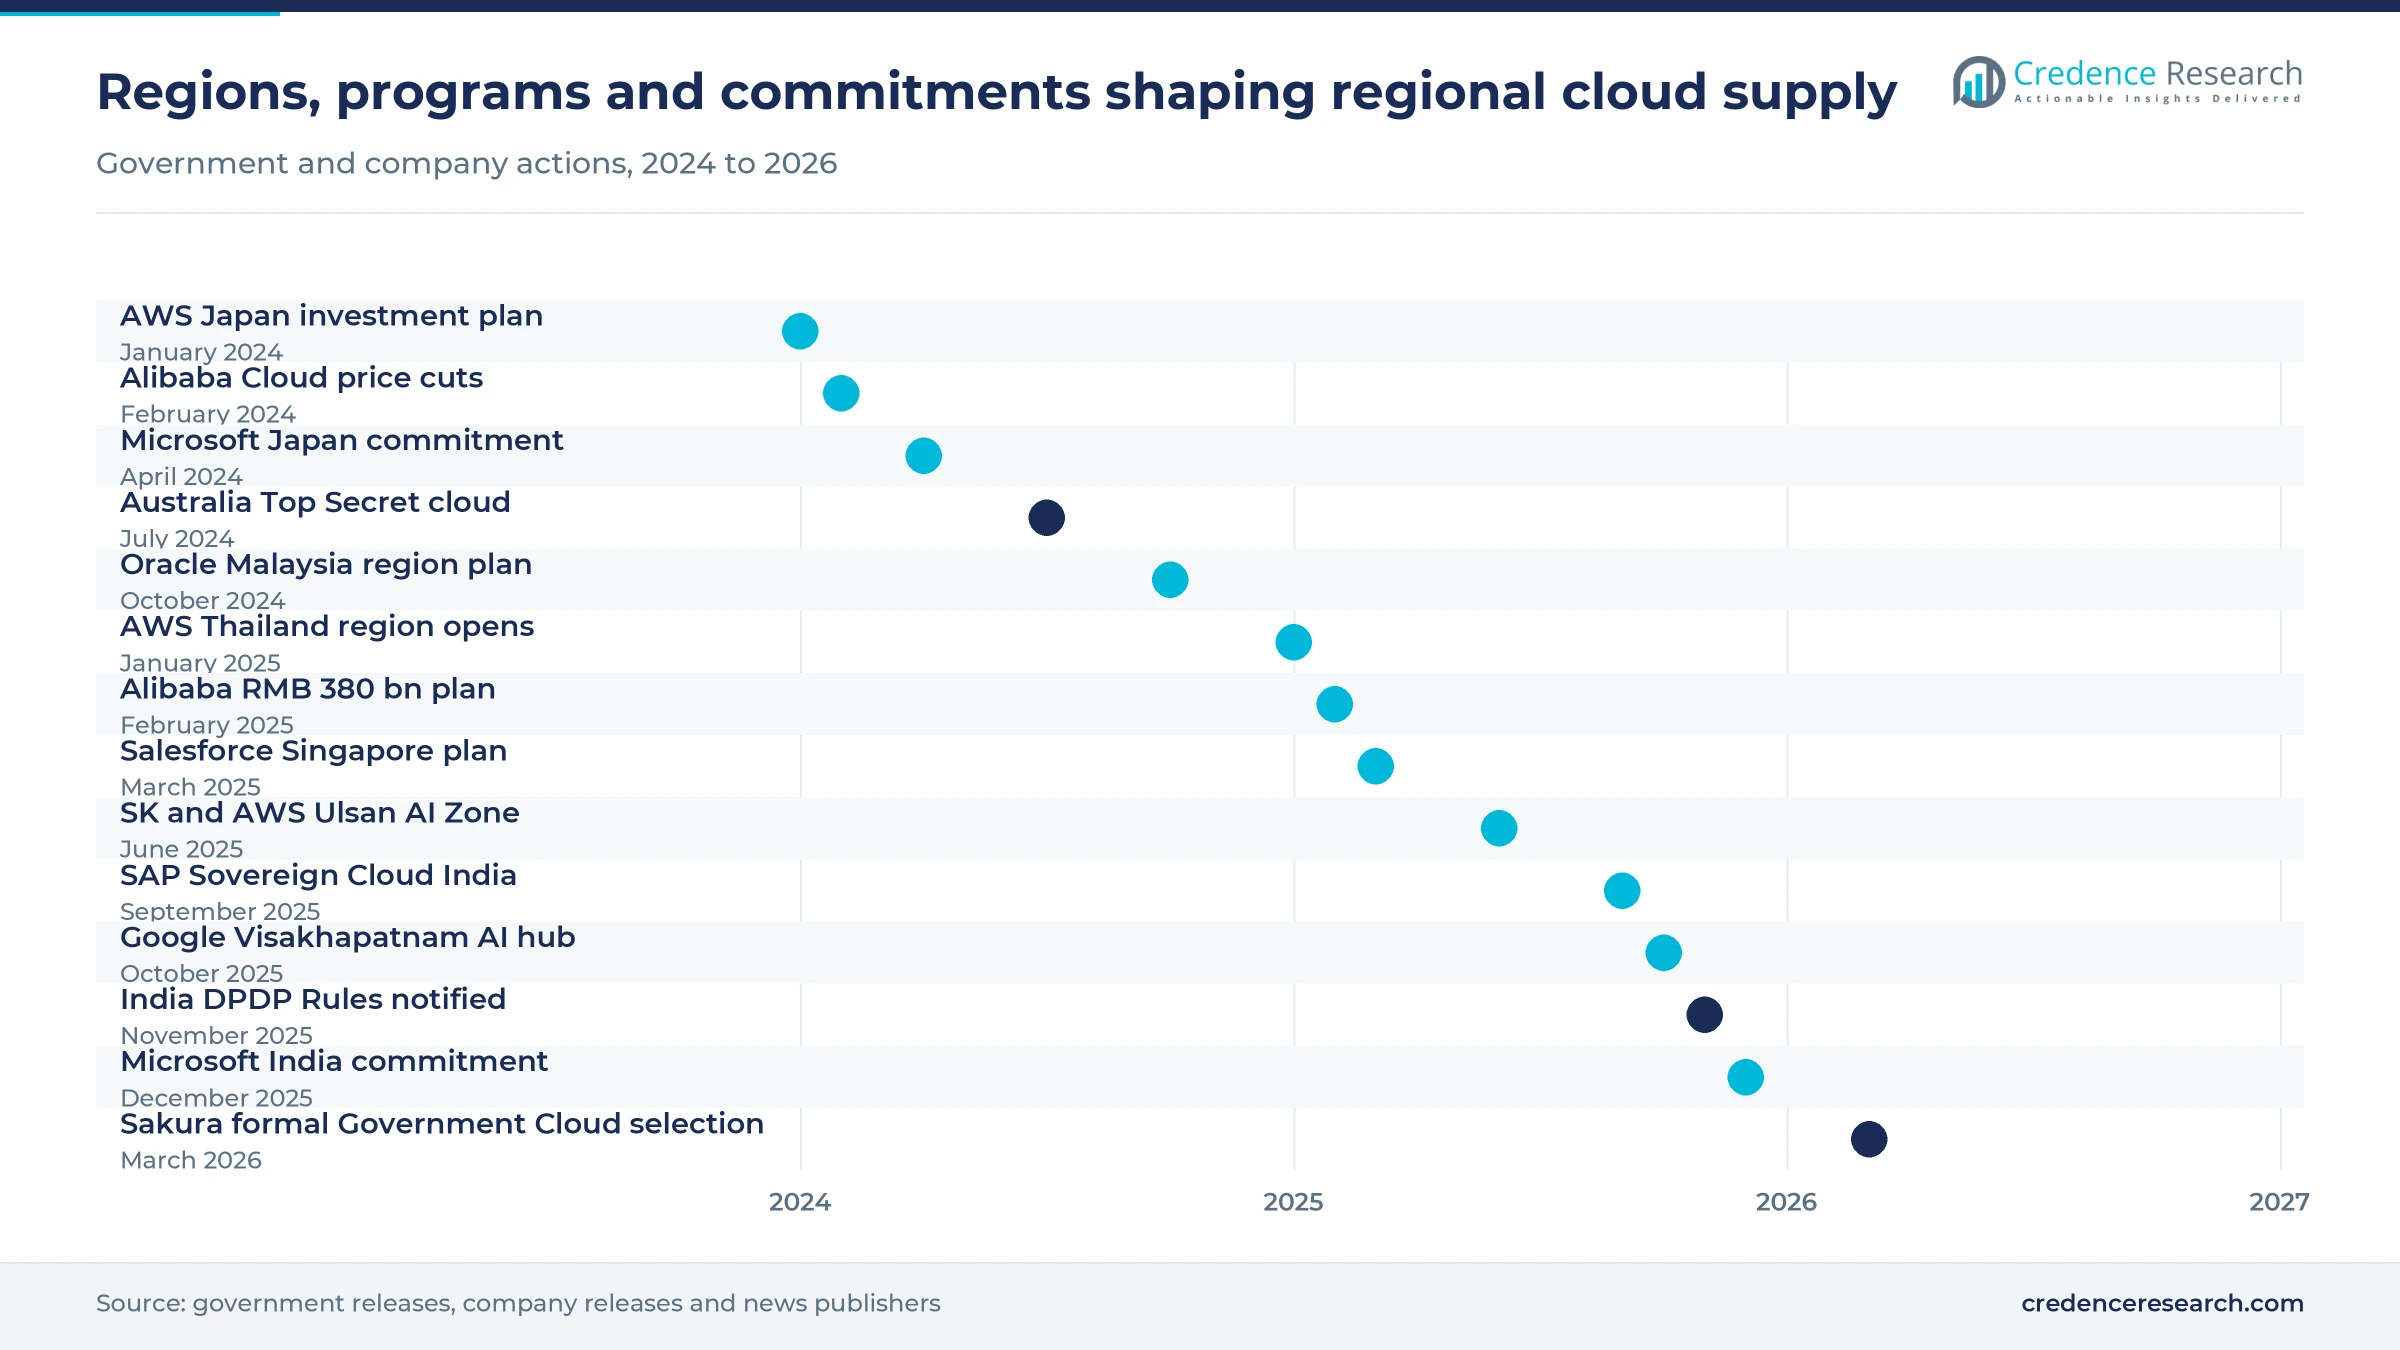
AI deployment is the largest single source of new billable capacity, because training and serving models consume compute, storage and networking by the hour. Alibaba Group said on Feb. 24, 2025 that it would invest at least RMB 380 billion in cloud and AI infrastructure over the next three years. Google announced on Oct. 14, 2025 a USD 15 billion AI hub in Visakhapatnam for 2026 to 2030, built with AdaniConneX and Airtel. SK Group and AWS signed on June 20, 2025 to build an AI Zone in Ulsan, part of a planned USD 5.88 billion AWS investment in Korea by 2027. Each site adds hyperscale data center capacity that providers resell as GPU instances, model APIs and storage, which is why platform services are the fastest-growing service type.
Government procurement turns policy into recurring demand
Public mandates become recurring revenue once agencies move core systems and sign multi-year usage commitments. Japan's Digital Agency is moving about 1,800 local governments onto standardized versions of 20 core business systems, with fiscal 2025 as the basic target and the national Government Cloud as the preferred host. The agency wants operating costs for these systems at least 30% below the fiscal 2018 level once the move is complete, which gives councils a budget reason to migrate. Sakura Internet said on March 27, 2026 that it had met all 305 technical requirements and was formally selected as a Government Cloud provider. The Australian Top Secret cloud contract described above shows the same pattern in defense, where commitments run for a decade.
Local cloud regions unlock residency-sensitive buyers
Banks, insurers, hospitals and agencies often must keep data in the country, so each new in-country region converts workloads that could not move offshore. Oracle said on Oct. 2, 2024 that it would invest more than USD 6.5 billion to build its first public cloud region in Malaysia, The Japan Times reported. Salesforce said on March 12, 2025 that its USD 1 billion, five-year plan for Singapore includes expanding Hyperforce so Data Cloud and Agentforce can store data locally, according to the Singapore Economic Development Board. Microsoft plans to open its India South Central region in Hyderabad in mid-2026 with three availability zones, its largest hyperscale region in India. Each new region turns blocked workloads into billable demand and cuts latency for consumer apps in that country.
Sovereign packages open regulated workloads
Residency alone does not satisfy every regulator, so providers now sell operational control, local staff and audit rights as a package. SAP launched SAP Sovereign Cloud in India on Sept. 19, 2025, built to comply with the National Information Security Policy and Guidelines and offered on site or on AWS. Microsoft made Sovereign Public Cloud available from its Indian regions in December 2025, with landing zones that enforce compliance policies, W.Media reported. India's Digital Personal Data Protection Rules, notified on Nov. 13, 2025, phase in core duties over 12 to 18 months and let the government restrict some transfers abroad, according to Hogan Lovells. Regulated shared public cloud gains share as these rules take effect, and buyers accept a price premium for the added controls.
Domestic clouds and Chinese providers reshape supply
Rise of domestic and state-backed cloud suppliers
Regulated buyers in India and Japan now shortlist domestic and state-backed clouds alongside global hyperscalers. The Reserve Bank of India plans a cloud for financial firms initially funded from the central bank's Rs 229.74 billion (about USD 2.72 billion) asset development fund, and bidders must set up data centers in Mumbai and Hyderabad, The Star reported in November 2024. NTT DATA offers more than 200 Oracle Cloud Infrastructure features inside its Japanese data centers and plans a West Japan region by the end of 2026. Sakura Internet, selected for the Government Cloud as noted above, gives Japanese agencies a domestic option. Global providers increasingly partner with local operators instead of competing head-on, so partner and marketplace sales gain weight in regulated tenders.
Chinese providers shift capacity into Southeast Asia
Alibaba, Tencent and Huawei are following Chinese platform customers into Southeast Asia and competing there on price. Alibaba Cloud opened its third data center in Malaysia on July 1, 2025 and planned a second in the Philippines for October 2025. Tencent plans to invest USD 500 million in Indonesian cloud infrastructure by 2030, DatacenterDynamics reported. Huawei Cloud runs three availability zones in Jakarta and plans a fourth in 2026, and counts more than 300 ecosystem partners there, including Telkomsel and BCA, Intelligent CIO reported in December 2025. These moves widen choice for buyers in Remaining Asia Pacific and push U.S. providers to sharpen pricing in the middle-income markets of the region.
Opportunity in AI-ready migration for Japanese enterprises
Japan offers an opening in AI-ready migration, because large firms there already use cloud widely but are now rebuilding applications around generative AI. AWS said on Jan. 19, 2024 that it plans to invest JPY 2.26 trillion in its Japanese cloud infrastructure by 2027, naming KDDI, Nomura Holdings and Ricoh among users of its generative AI services. Microsoft committed USD 2.9 billion over two years from April 2024 to expand AI infrastructure in Japan, including the latest GPUs. The high cloud use among larger Japanese companies noted above means new revenue comes from deeper workloads rather than first-time buyers. Integrators that pair migration with model deployment can win long committed-spend contracts from manufacturers and financial groups.
Opportunity in India's AI compute and mid-market demand
India is the clearest volume opening, because hyperscale capacity, subsidized compute and new data rules arrive in the same few years. Microsoft said on Dec. 9, 2025 that it would invest USD 17.5 billion in Indian cloud and AI infrastructure over four years. The IndiaAI Mission offers more than 38,000 GPUs at about Rs 65 per GPU hour under an outlay above Rs 10,000 crore, Business Standard reported in June 2026. Start-ups that begin on this rented GPU capacity often move to commercial platforms once their models reach production. Google's Visakhapatnam hub, noted above, adds gigawatt-scale capacity from 2026. Providers with local regions, rupee billing and partner channels into mid-sized firms stand to capture the most of this demand.
Migration delays, data rules and price cuts slow returns
Public sector migration slips beyond fiscal 2025
Nearly a third of Japan's local government systems will now move later than planned, pushing back revenue suppliers had expected in fiscal 2025. Japan's Digital Agency reports that 10,013 of 34,366 local government systems, or 29.1%, were classed in March 2026 as systems allowed to migrate later, with deadlines set within about five years. Providers and integrators that staffed up for a single cut-over now face a longer tail of smaller projects. They can soften the effect by pricing migration in phases and by offering bridging hosting.
Fragmented data rules raise the cost of serving the region
Serving the region from a few large hubs is getting costlier as each country writes its own data rules. India's data protection rules, notified on Nov. 13, 2025, leave the categories of data barred from leaving the country to later government notice, according to Hogan Lovells, so banks and platforms cannot yet fix where data must sit. Providers respond by building more local regions, which lifts capital needs, while multinational buyers must run separate configurations by country and carry higher operating costs.
Price cuts compress margins on basic compute
Margins are thinnest on basic compute and storage, especially in Mainland China. Alibaba Cloud cut prices by as much as 55% on more than 100 product specifications on Feb. 29, 2024, CNBC reported, describing the move as a push to win AI customers. Lower unit prices widen use but leave providers relying on AI services and committed contracts to recover returns. Smaller local clouds feel the pressure most, because they cannot spread data center costs across as many customers.
Thin cloud and AI skills slow production rollouts
Skills shortages slow how fast enterprises move from pilots to production workloads. Microsoft pledged in April 2024 to give more than 3 million people in Japan AI skills training over three years, and Alibaba Cloud set a goal of training 100,000 AI professionals a year through more than 120 partner institutions. The scale of these programs shows how wide the gap is. Buyers without in-house engineers lean on integrators, which lengthens projects and raises the total cost of adoption.
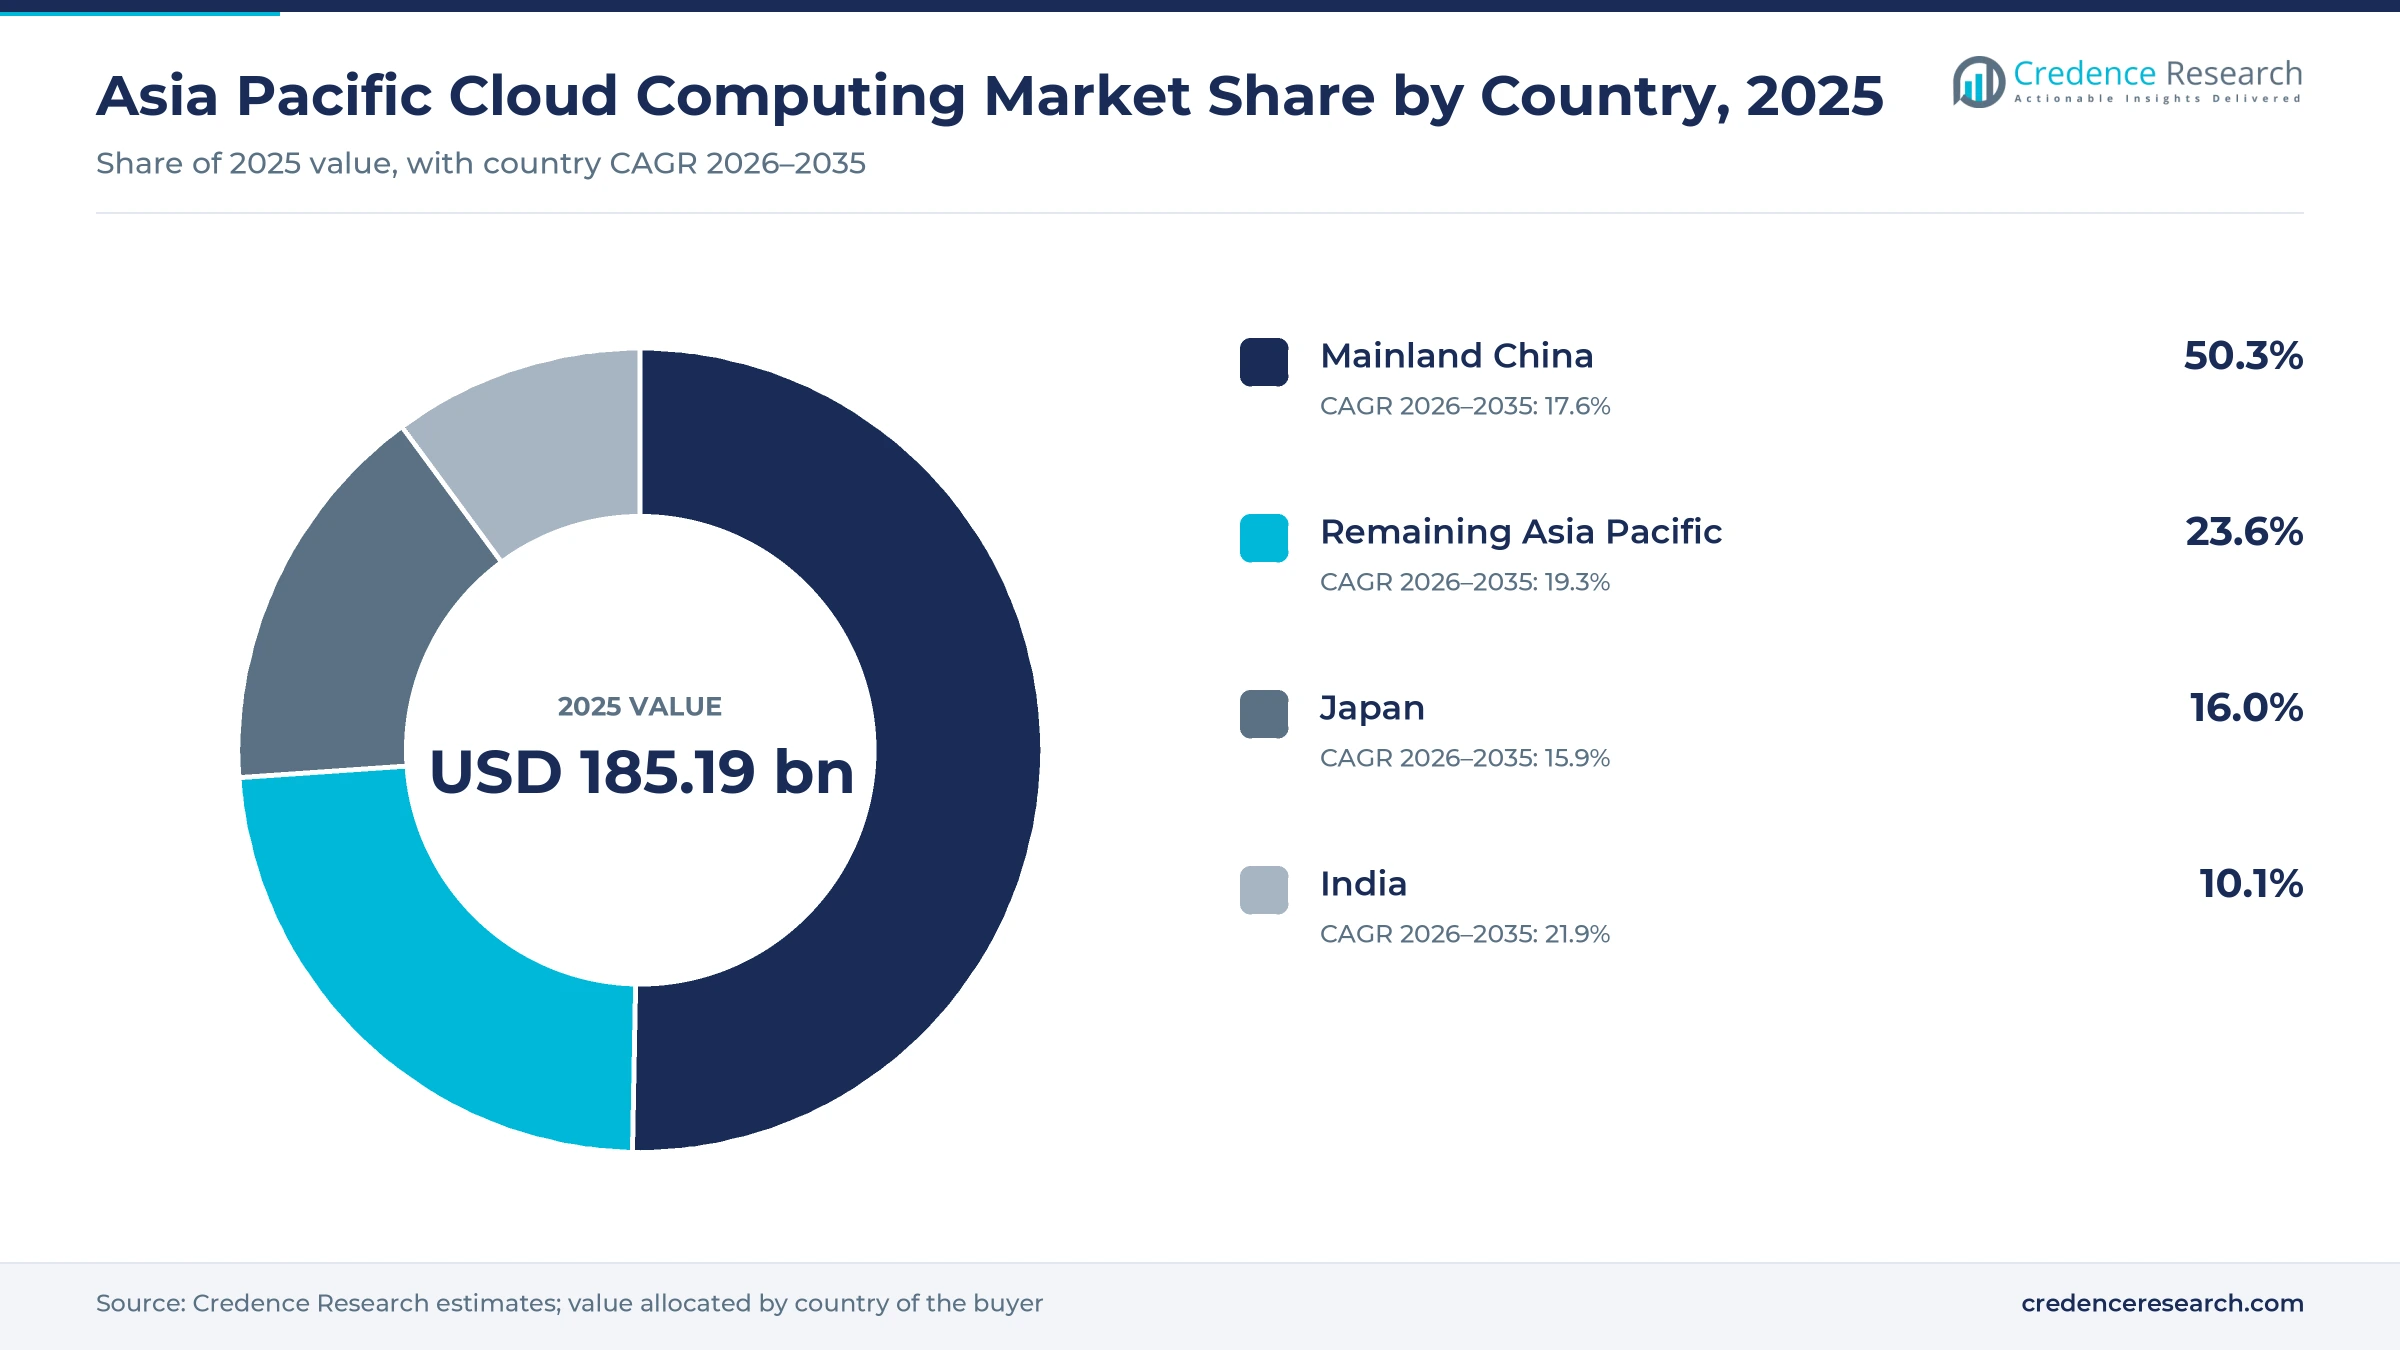
Mainland China leads as India grows fastest
| Country | Value, 2025 (USD billion) | Share, 2025 | CAGR, 2026–2035 |
|---|---|---|---|
| Mainland China | 93.15 | 50.3% | 17.6% |
| Remaining Asia Pacific | 43.71 | 23.6% | 19.3% |
| Japan | 29.63 | 16.0% | 15.9% |
| India | 18.70 | 10.1% | 21.9% |
Mainland China leads on domestic scale
Mainland China held 50.3% of 2025 value and grows at 17.6% a year, below the regional rate, because price cuts and a mature enterprise base hold back revenue per workload. Alibaba Cloud describes itself as the largest provider in China and Asia Pacific, and Huawei Cloud and Tencent Cloud are the other large domestic suppliers. Foreign providers serve mainly multinational firms through local joint ventures and partners. Demand for migration and managed services in China rises as firms rebuild systems for AI, while Alibaba's three-year infrastructure plan keeps capacity ahead of demand.
Remaining Asia Pacific mixes mature and emerging buyers
Remaining Asia Pacific held 23.6% of 2025 value and grows at 19.3% a year, with Australia, South Korea, Singapore and the larger Southeast Asian economies as the main buyers. Australia gains from Amazon's data center program and the defense contract noted above, while Korea gains from the Ulsan AI Zone. New regions in Thailand and Malaysia and Chinese expansion in Indonesia widen supply in Southeast Asia. This mix of mature and emerging markets makes the group the second-largest after Mainland China.
Japan grows on deeper workloads rather than new users
Japan held 16.0% of 2025 value and grows at 15.9% a year, the slowest pace in the region, because most large companies already use cloud services. Japan's public cloud services market reached 4.49 trillion yen in 2025, up 20.3%, according to the communications ministry's 2026 White Paper. Growth now comes from core systems and AI, helped by the AWS and Microsoft programs above. Local government migration to the Government Cloud adds steady public demand, and Sakura Internet and NTT DATA give agencies and banks domestic options.
India grows fastest on new regions and subsidized compute
India held 10.1% of 2025 value and is the fastest-growing country at 21.9% a year, as hyperscale capacity, the IndiaAI compute program and new data rules arrive together. Microsoft's Hyderabad region, Google's Visakhapatnam hub and SAP's sovereign offer, all noted above, give regulated buyers in-country options. The Reserve Bank's planned cloud for financial firms adds a domestic competitor in banking. Revenue per customer stays lower than in Japan, so growth depends on large numbers of mid-sized firms and start-ups.
Regions, sovereign offers and tenders mark 2025 and 2026
| Development | Status and market relevance |
|---|---|
| In January 2025, AWS opened its Thailand region with three availability zones and more than USD 5 billion of planned investment. | Operating, giving Thai banks and agencies in-country hyperscale services. |
| In February 2025, Alibaba Group committed at least RMB 380 billion to cloud and AI infrastructure over three years. | Under way, expanding capacity in China and overseas regions. |
| In September 2025, SAP launched SAP Sovereign Cloud in India for public sector and regulated customers. | Available, on customer sites or on AWS infrastructure. |
| In October 2025, Google announced a USD 15 billion AI hub in Visakhapatnam with AdaniConneX and Airtel. | Planned for 2026 to 2030, adding gigawatt-scale capacity in India. |
| In March 2026, Japan's Digital Agency formally selected Sakura Internet as a Government Cloud provider. | Selected, giving agencies a domestic option beside U.S. hyperscalers. |
GPU instances and sovereign controls change what buyers get
- GPU and accelerator instances let firms rent AI training and inference capacity by the hour instead of buying servers, which turns large upfront hardware budgets into monthly operating spend.
- Model-as-a-service platforms bill model access per token or per call, which brings small firms and developers into AI use without in-house machine learning teams.
- Sovereign landing zones enforce residency, encryption and access policies by default for regulated workloads, so banks and agencies can pass audits on shared regions.
- Multi-zone local regions spread services across three or more data centers in one country, which gives resilience and low latency for consumer and payment apps.
Need a Custom Version of This Report?
Tailor the scope, geography, or segments to your exact requirements.
- Custom geography or segment scope
- Direct access to our analyst team
Seven hyperscalers set terms as domestic suppliers gain
Competition in Asia Pacific cloud computing turns on capacity, local presence and software depth. AWS and Microsoft lead outside China with the broadest service ranges and deep partner networks, while Google Cloud competes on data analytics and AI models and Oracle on databases and dedicated regions. Alibaba Cloud, Huawei Cloud and Tencent Cloud dominate Mainland China and are expanding in Southeast Asia, often following Chinese platform customers. NTT Group competes in Japan with its own platforms and as an integrator for global providers. Salesforce and SAP sell customer, finance and supply chain software as subscriptions on these platforms. Buyers compare price per workload, residency options, AI capacity and support, and switching costs rise once data and applications sit on one provider. Committed-spend discounts and marketplace purchasing lock in large customers for several years.
How concentrated is cloud supply in the region?
Supply is concentrated at the infrastructure layer and fragmented at the application layer. Four U.S. providers, AWS, Microsoft, Google Cloud and Oracle, and three Chinese providers, Alibaba Cloud, Huawei Cloud and Tencent Cloud, own most of the hyperscale regions in Asia Pacific. Entry barriers are high because each region needs several billion dollars of capital, as the commitments above show. Domestic operators such as NTT Group and Sakura Internet compete on sovereignty and government accreditation rather than scale. Salesforce and SAP sell applications on top of these platforms, and margins are richest in software and managed AI services.
Companies profiled and their roles in this market
| Company | Type | Role in the market |
|---|---|---|
| Amazon Web Services (Amazon) | Hyperscale provider | Sells compute, storage and AI services from regions across Asia Pacific |
| Microsoft | Hyperscale and software provider | Sells Azure infrastructure, sovereign options and Microsoft 365 subscriptions |
| Alibaba Cloud (Alibaba Group) | Hyperscale provider | Runs the largest cloud in China and regions in Southeast Asia |
| Google Cloud (Alphabet) | Hyperscale provider | Sells infrastructure, data analytics and AI models from regional cloud regions |
| Huawei Cloud (Huawei) | Hyperscale provider | Sells cloud and AI services in China and Southeast Asia, including Jakarta |
| Tencent Cloud (Tencent) | Hyperscale provider | Serves platform, gaming and digital commerce customers in China and Indonesia |
| Oracle | Infrastructure and database provider | Sells Oracle Cloud Infrastructure, dedicated regions and Alloy partner clouds |
| NTT Group (NTT DATA) | Domestic provider and integrator | Runs Japanese cloud platforms and resells and integrates hyperscaler services |
| Salesforce | Software-as-a-service vendor | Sells customer software and Agentforce with local Hyperforce data residency |
| SAP | Software-as-a-service vendor | Sells cloud enterprise software and a sovereign cloud offer in India |
AI services and sovereignty will decide provider returns
Credence Research's view is that AI services and sovereign controls, not raw compute, will decide provider returns in Asia Pacific through 2035. Unit prices for basic compute keep falling, while demand for GPU capacity, model platforms and regulated delivery grows faster than the market. Mainland China will remain a largely separate market served by domestic providers. India and Southeast Asia offer the fastest growth but lower revenue per customer. Buyers should negotiate committed-spend terms with clear residency guarantees and exit rights before AI workloads make switching harder.
Estimates rest on provider, government and price evidence
The report uses 2025 as the base year and 2026 to 2035 as the forecast period. Market values come from the Credence Research model, and country, service, customer, industry and delivery splits are Credence Research estimates informed by public data. Sources include government and regulator releases, official statistics, company filings and press releases, published price changes and regional news publishers. No interviews or surveys were used to build these estimates.
India and AI platforms set the pace to 2035
Credence Research expects Asia Pacific cloud computing spending to reach USD 991.98 billion by 2035 as AI workloads reach production and new local regions open across the region. India should keep the fastest pace, while Mainland China stays the largest source of value because of its domestic provider base. Spending will move toward platform services, government buyers and regulated or dedicated delivery as data rules tighten. Chinese and U.S. providers will compete harder in Southeast Asia. Power and chip shortages are the main risk, because delayed regions would slow capacity growth for every buyer.
AI uptake and data rules set the range to 2035
The range of outcomes depends mainly on how fast AI workloads move into production and on whether data rules let providers serve several countries from shared regions. Fast AI adoption multiplies platform and GPU billing, while strict localization would raise costs and slow smaller markets. Power and chip supply matter too, because a delay in new regions pushes demand back by years.
| Scenario | CAGR, 2026–2035 | Value, 2035 | What has to hold |
|---|---|---|---|
| Downside | 15.2% | USD 787.24 billion | AI projects stall at pilot stage, price wars deepen and localization rules multiply across major economies |
| Base | 18.25% | USD 991.98 billion | Hyperscale regions open on announced schedules and government migration continues at the current pace |
| Upside | 20.2% | USD 1,153.73 billion | AI services reach mass production use and India and Southeast Asia adopt cloud faster than expected |
Frequently Asked Questions
How big is the Asia Pacific cloud computing market?
Which country leads the market?
Which country is growing fastest?
Which service type holds the largest share?
Why does government procurement matter to providers?
What holds the market back?
How is cloud computing priced in the region?
Who are the main companies in this market?
Table of Content
Chapter 1 Market Segmentation
- 1.1 Segmentation Framework
- 1.1.1 Product and Service Classification
- 1.1.2 Application and End-Use Classification
- 1.1.3 Technology and Solution Classification
- 1.1.4 Customer and Distribution Channel Classification
- 1.1.5 Geographic Segmentation
- 1.1.6 Market Segment Definitions and Boundaries
- 1.2 By Service Type
- 1.2.1 Infrastructure-as-a-Service
- 1.2.2 Software-as-a-Service
- 1.2.3 Platform-as-a-Service
- 1.3 By Customer Type
- 1.3.1 Large Enterprises
- 1.3.2 Small and Medium Enterprises
- 1.3.3 Government and Public Institutions
- 1.4 By End-Use Industry
- 1.4.1 Digital Commerce and Communications
- 1.4.2 Diversified Enterprise and Public Services
- 1.4.3 Financial Services
- 1.4.4 Manufacturing and Supply Chains
- 1.5 By Delivery Model
- 1.5.1 Standard Shared Public Cloud
- 1.5.2 Regulated Shared Public Cloud
- 1.5.3 Dedicated Resources on Public Cloud
- 1.6 By Country
- 1.6.1 Mainland China
- 1.6.2 Japan
- 1.6.3 India
- 1.6.4 Remaining Asia Pacific
Chapter 2 Introduction
- 2.1 Report Objectives and Scope
- 2.2 Product Definition and Industry Terminology
- 2.3 Market Inclusions and Exclusions
- 2.4 Research Process
- 2.4.1 Primary Research and Expert Interviews
- 2.4.2 Secondary Research and Source Review
- 2.4.3 Top-Down and Bottom-Up Estimation
- 2.4.4 Data Triangulation and Verification
- 2.5 Market Size Measurement Basis
- 2.5.1 2025: USD 185.19 billion → 2035: USD 991.98 billion
- 2.6 Historical and Forecast Reference Periods
- 2.6.1 Historical Period: 2018-2025
- 2.6.2 Base Year: 2025
- 2.6.3 Forecast Period: 2025-2035
- 2.7 Research Assumptions and Limitations
Chapter 3 Executive Summary
- 3.1 Market Snapshot and Key Findings
- 3.2 Base-Year Market Size, 2025
- 3.3 Forecast Market Size, 2035
- 3.4 Revenue and Volume Growth Outlook
- 3.5 Key Demand and Supply Indicators
- 3.6 Leading Market Segments
- 3.7 Fastest-Growing Market Opportunities
- 3.8 Regional Performance Highlights
- 3.9 Technology and Industry Transformation
- 3.10 Competitive Landscape Summary
- 3.11 Analyst View and Strategic Implications
Chapter 4 Asia Pacific Cloud Computing Market Trends and Developments
- 4.1 Historical Industry Development, 2018-2025
- 4.2 Recent Market Trends and Developments
- 4.3 Demand and Customer Behavior Trends
- 4.4 Technology and Product Innovation
- 4.5 Artificial Intelligence, Automation and Digitalization
- 4.6 Local Manufacturing and Supply Chain Realignment
- 4.7 Industry Partnerships, Mergers and Acquisitions
- 4.8 Sustainability and Circular Economy Developments
- 4.9 Government and Private Sector Investment Trends
- 4.10 Emerging Business Models and Commercialization
- 4.11 Industry Developments and Announcements
Chapter 5 Asia Pacific Cloud Computing Market Production, Supply and Demand Analysis
- 5.1 Demand Trend and Consumption Analysis, 2018-2025
- 5.2 Demand Forecast, 2025-2035
- 5.3 Production and Output Trend, 2018-2025
- 5.4 Production and Output Forecast, 2025-2035
- 5.5 Installed Capacity and Capacity Utilization
- 5.6 Company-Wise Production Plants and Statistics
- 5.6.1 Installed Production Capacity
- 5.6.2 Actual Production
- 5.6.3 Planned Capacity and Expansion Targets
- 5.7 Supply Chain Structure and Procurement Trends
- 5.8 Supply-Demand Gap and Bottlenecks
- 5.9 Import Dependence and Sourcing Structure
- 5.10 Contract Manufacturing and Outsourcing
- 5.11 Regional Supply and Demand Concentration
Chapter 6 Asia Pacific Cloud Computing Market Pricing Analysis
- 6.1 Pricing Structure and Measurement
- 6.2 Historical Pricing Trends, 2018-2025
- 6.3 Pricing Outlook, 2025-2035
- 6.4 Average Selling Price and Unit Economics
- 6.5 Pricing by Product and Market Segment
- 6.6 Geographic Pricing Differences
- 6.7 Key Input, Energy, Labor and Logistics Costs
- 6.8 Contract Pricing and Purchasing Models
- 6.9 Pricing Sensitivity and Competitive Positioning
- 6.10 Price, Margin and Profitability Implications
Chapter 7 Asia Pacific Cloud Computing Market Dynamics
- 7.1 Market Growth Drivers
- 7.1.1 Demand-Side Drivers
- 7.1.2 Technology and Innovation Drivers
- 7.1.3 Infrastructure and Investment Drivers
- 7.1.4 Regulatory and Policy Drivers
- 7.2 Market Restraints
- 7.2.1 Cost and Affordability Constraints
- 7.2.2 Technology and Adoption Barriers
- 7.2.3 Supply Chain and Operational Constraints
- 7.3 Market Challenges
- 7.3.1 Competitive Pressure and Margin Erosion
- 7.3.2 Skills, Infrastructure and Implementation Gaps
- 7.4 Emerging Market Opportunities
- 7.5 Market Dynamics Impact and Time-Horizon Assessment
Chapter 8 Asia Pacific Cloud Computing Value Chain Analysis
- 8.1 Industry Value Chain Overview
- 8.2 Upstream Suppliers and Critical Inputs
- 8.3 Technology and Component Providers
- 8.4 Manufacturing or Service Delivery
- 8.5 Distribution, Channel Partners and Integrators
- 8.6 Downstream Applications and End Users
- 8.7 Value Addition and Profit Pools
- 8.8 Vertical Integration and Outsourcing
- 8.9 Supplier Concentration and Risk
- 8.10 Supply Chain Localization and Resilience
Chapter 9 Asia Pacific Cloud Computing Market Regulations and Policies
- 9.1 Relevant Laws, Standards and Compliance Frameworks
- 9.2 Product, Service, Safety and Quality Requirements
- 9.3 Government Policies, Incentives and Subsidies
- 9.4 Imports, Exports and Trade Barriers
- 9.5 Public Procurement and Local Content Requirements
- 9.6 Environmental and Sustainability Compliance
- 9.7 Data Protection, AI and Cybersecurity Compliance
- 9.8 Upcoming Policy Changes and Market Implications
Chapter 10 Asia Pacific Cloud Computing Market Hotspots and Opportunities
- 10.1 Market Opportunity Mapping and Growth Hotspots
- 10.2 High-Growth Applications and Customer Groups
- 10.3 Underserved Markets and White-Space Opportunities
- 10.4 Emerging Technology and Product Opportunities
- 10.5 New Capacity and Investment Hotspots
- 10.6 Market Entry and Expansion Opportunities
- 10.7 Distribution and Partnership Opportunities
- 10.8 Near-Term and Long-Term Commercial Potential
- 10.9 Opportunity Attractiveness and Execution Risks
Chapter 11 Asia Pacific Cloud Computing Market Outlook, 2025-2035
- 11.1 Market Size and Analysis
- 11.1.1 Revenue (Market Measurement: 2025: USD 185.19 billion → 2035: USD 991.98 billion)
- 11.1.2 Market Volume and Quantity Sold
- 11.1.3 Historical Market Size, 2018-2025
- 11.1.4 Base-Year Market Size, 2025
- 11.2 Market Forecast, 2025-2035
- 11.2.1 Revenue Forecast to 2035
- 11.2.2 Volume Forecast to 2035
- 11.2.3 CAGR and Year-on-Year Growth
- 11.2.4 Incremental Revenue Opportunity
- 11.3 Forecast Assumptions and Scenario Analysis
- 11.3.1 Base-Case Forecast
- 11.3.2 Optimistic and Conservative Scenarios
- 11.3.3 Technology, Pricing and Policy Sensitivities
- 11.4 Market Attractiveness and Growth Outlook
Chapter 12 Asia Pacific Cloud Computing Market Segmentation and Outlook
- 12.1 Segmentation Summary and Market Shares, 2025
- 12.2 Largest and Fastest-Growing Segments
- 12.3 By Service Type - Market Size and Forecast, 2025-2035
- 12.3.1 Segment Definition and Scope
- 12.3.2 Historical Market Size, 2018-2025
- 12.3.3 Revenue Forecast, 2025-2035
- 12.3.4 Volume Forecast, 2025-2035
- 12.3.5 Base-Year Market Share, 2025
- 12.3.6 Segment CAGR and Growth Drivers
- 12.3.7 Subsegment Market Size and Forecast
- 12.3.7.1 Infrastructure-as-a-Service
- 12.3.7.2 Software-as-a-Service
- 12.3.7.3 Platform-as-a-Service
- 12.3.8 Subsegment Pricing and Adoption Trends
- 12.3.9 Leading Suppliers and Competition
- 12.3.10 Regional Demand and Opportunities
- 12.4 By Customer Type - Market Size and Forecast, 2025-2035
- 12.4.1 Segment Definition and Scope
- 12.4.2 Historical Market Size, 2018-2025
- 12.4.3 Revenue Forecast, 2025-2035
- 12.4.4 Volume Forecast, 2025-2035
- 12.4.5 Base-Year Market Share, 2025
- 12.4.6 Segment CAGR and Growth Drivers
- 12.4.7 Subsegment Market Size and Forecast
- 12.4.7.1 Large Enterprises
- 12.4.7.2 Small and Medium Enterprises
- 12.4.7.3 Government and Public Institutions
- 12.4.8 Subsegment Pricing and Adoption Trends
- 12.4.9 Leading Suppliers and Competition
- 12.4.10 Regional Demand and Opportunities
- 12.5 By End-Use Industry - Market Size and Forecast, 2025-2035
- 12.5.1 Segment Definition and Scope
- 12.5.2 Historical Market Size, 2018-2025
- 12.5.3 Revenue Forecast, 2025-2035
- 12.5.4 Volume Forecast, 2025-2035
- 12.5.5 Base-Year Market Share, 2025
- 12.5.6 Segment CAGR and Growth Drivers
- 12.5.7 Subsegment Market Size and Forecast
- 12.5.7.1 Digital Commerce and Communications
- 12.5.7.2 Diversified Enterprise and Public Services
- 12.5.7.3 Financial Services
- 12.5.7.4 Manufacturing and Supply Chains
- 12.5.8 Subsegment Pricing and Adoption Trends
- 12.5.9 Leading Suppliers and Competition
- 12.5.10 Regional Demand and Opportunities
- 12.6 By Delivery Model - Market Size and Forecast, 2025-2035
- 12.6.1 Segment Definition and Scope
- 12.6.2 Historical Market Size, 2018-2025
- 12.6.3 Revenue Forecast, 2025-2035
- 12.6.4 Volume Forecast, 2025-2035
- 12.6.5 Base-Year Market Share, 2025
- 12.6.6 Segment CAGR and Growth Drivers
- 12.6.7 Subsegment Market Size and Forecast
- 12.6.7.1 Standard Shared Public Cloud
- 12.6.7.2 Regulated Shared Public Cloud
- 12.6.7.3 Dedicated Resources on Public Cloud
- 12.6.8 Subsegment Pricing and Adoption Trends
- 12.6.9 Leading Suppliers and Competition
- 12.6.10 Regional Demand and Opportunities
- 12.7 By Country - Market Size and Forecast, 2025-2035
- 12.7.1 Segment Definition and Scope
- 12.7.2 Historical Market Size, 2018-2025
- 12.7.3 Revenue Forecast, 2025-2035
- 12.7.4 Volume Forecast, 2025-2035
- 12.7.5 Base-Year Market Share, 2025
- 12.7.6 Segment CAGR and Growth Drivers
- 12.7.7 Subsegment Market Size and Forecast
- 12.7.7.1 Mainland China
- 12.7.7.2 Japan
- 12.7.7.3 India
- 12.7.7.4 Remaining Asia Pacific
- 12.7.8 Subsegment Pricing and Adoption Trends
- 12.7.9 Leading Suppliers and Competition
- 12.7.10 Regional Demand and Opportunities
- 12.8 Segment Growth Comparison
- 12.9 Segment Attractiveness and Priority Matrix
Chapter 13 Asia Pacific Cloud Computing End-Use and Application Market Outlook
- 13.1 End-Use Industry and Customer Demand Structure
- 13.2 Leading Applications and Customer Groups
- 13.3 End-Use Market Size, Share and Forecast
- 13.4 Major End-Use Industry Deep Dives
- 13.4.1 Customer Requirements and Use Cases
- 13.4.2 Demand and Replacement Cycles
- 13.4.3 Technical and Regulatory Considerations
- 13.4.4 Purchasing and Procurement Models
- 13.4.5 Leading Vendors and Distribution Channels
- 13.4.6 Forecast and Commercial Opportunities
- 13.5 Emerging Applications and Cross-Segment Demand
- 13.6 End-Use Industry Investment Priorities
Chapter 14 Asia Pacific Cloud Computing Geographic Market Outlook, 2025-2035
- 14.1 Regional Market Size and Country-Level Shares, 2025
- 14.2 Country Market Size Comparison, 2025
- 14.3 Country Market Forecasts, 2025-2035
- 14.4 Subregional Industrial and Demand Clusters
- 14.5 Intra-Regional Pricing and Cost Differences
- 14.6 Cross-Border Trade and Supply Networks
- 14.7 Regional Supply and Demand Balances
- 14.8 Country Opportunity Comparison and Prioritization
Note: Every listed country is covered on the structure shown under the first country.
Chapter 15 Asia Pacific Cloud Computing Technology, Innovation and Sustainability Outlook
- 15.1 Technology Landscape and Maturity
- 15.2 Product, Process and Service Innovation
- 15.3 AI, Automation and Digital Tools in the Industry
- 15.4 Technology Adoption and Performance Benchmarking
- 15.5 Innovation Pipeline and R&D Investment
- 15.6 Patent and Intellectual Property Trends
- 15.7 Energy Efficiency and Resource Management
- 15.8 Sustainability, Recycling and Circularity
- 15.9 Technology Roadmap, 2025-2035
- 15.10 Risks of Obsolescence and Technology Substitution
Chapter 16 Asia Pacific Cloud Computing Market Key Strategic Imperatives
- 16.1 Growth and Market Entry Priorities
- 16.2 High-Return Products and Segments
- 16.3 Pricing, Profitability and Cost Optimization
- 16.4 Technology Investment and Product Differentiation
- 16.5 Supply Chain Localization and Resilience
- 16.6 Distribution and Customer Acquisition
- 16.7 Partnership, Acquisition and Capacity Strategy
- 16.8 Regional Expansion Priorities
- 16.9 Short-, Medium- and Long-Term Actions
Chapter 17 Competition Outlook
- 17.1 Industry Competition Characteristics
- 17.2 Market Structure and Concentration
- 17.3 Market Share and Competitive Positioning, 2025
- 17.4 Company-Wise Revenue and Product Benchmarking
- 17.5 Production and Service Capacity Benchmarking
- 17.6 Technology, Pricing and Differentiation
- 17.7 Regional Footprint and Distribution Strength
- 17.8 Mergers, Acquisitions and Strategic Alliances
- 17.9 New Entrants and Competitive Threats
- 17.10 Porter's Five Forces and Industry Attractiveness
- 17.11 Competitive Outlook, 2025-2035
Chapter 18 Company Profiles
- 18.1 Company Coverage and Selection Criteria
- 18.2 Amazon Web Services (Amazon)
- 18.2.1 Business Description
- 18.2.2 Company Ownership and Geographic Presence
- 18.2.3 Product and Service Portfolio
- 18.2.4 Manufacturing and Operating Footprint
- 18.2.5 Production Capacity and Expansion Plans
- 18.2.6 Financial Performance and Investment
- 18.2.7 Market Share and Competitive Position
- 18.2.8 Technology and Innovation Capabilities
- 18.2.9 Strategic Alliances or Partnerships
- 18.2.10 Recent Developments
- 18.2.11 Growth Strategy and Outlook
- 18.3 Microsoft
- 18.4 Alibaba Cloud (Alibaba Group)
- 18.5 Google Cloud (Alphabet)
- 18.6 Huawei Cloud (Huawei)
- 18.7 Tencent Cloud (Tencent)
- 18.8 Oracle
- 18.9 NTT Group (NTT DATA)
- 18.10 Salesforce
- 18.11 SAP
- 18.12 Other Relevant Market Participants
Note: Every listed company is profiled on the structure shown under the first company. The company list is preliminary and may change based on research findings, market developments, data availability and client requirements.
Chapter 19 Disclaimer
- 19.1 Research and Forecast Disclaimer
- 19.2 Data Source and Estimation Limitations
Note: The depth of individual sections depends on data availability for this market. Volume, capacity, trade and other unit-based metrics are included where applicable.

