
Engagement suites anchor spend as AI agents take on work
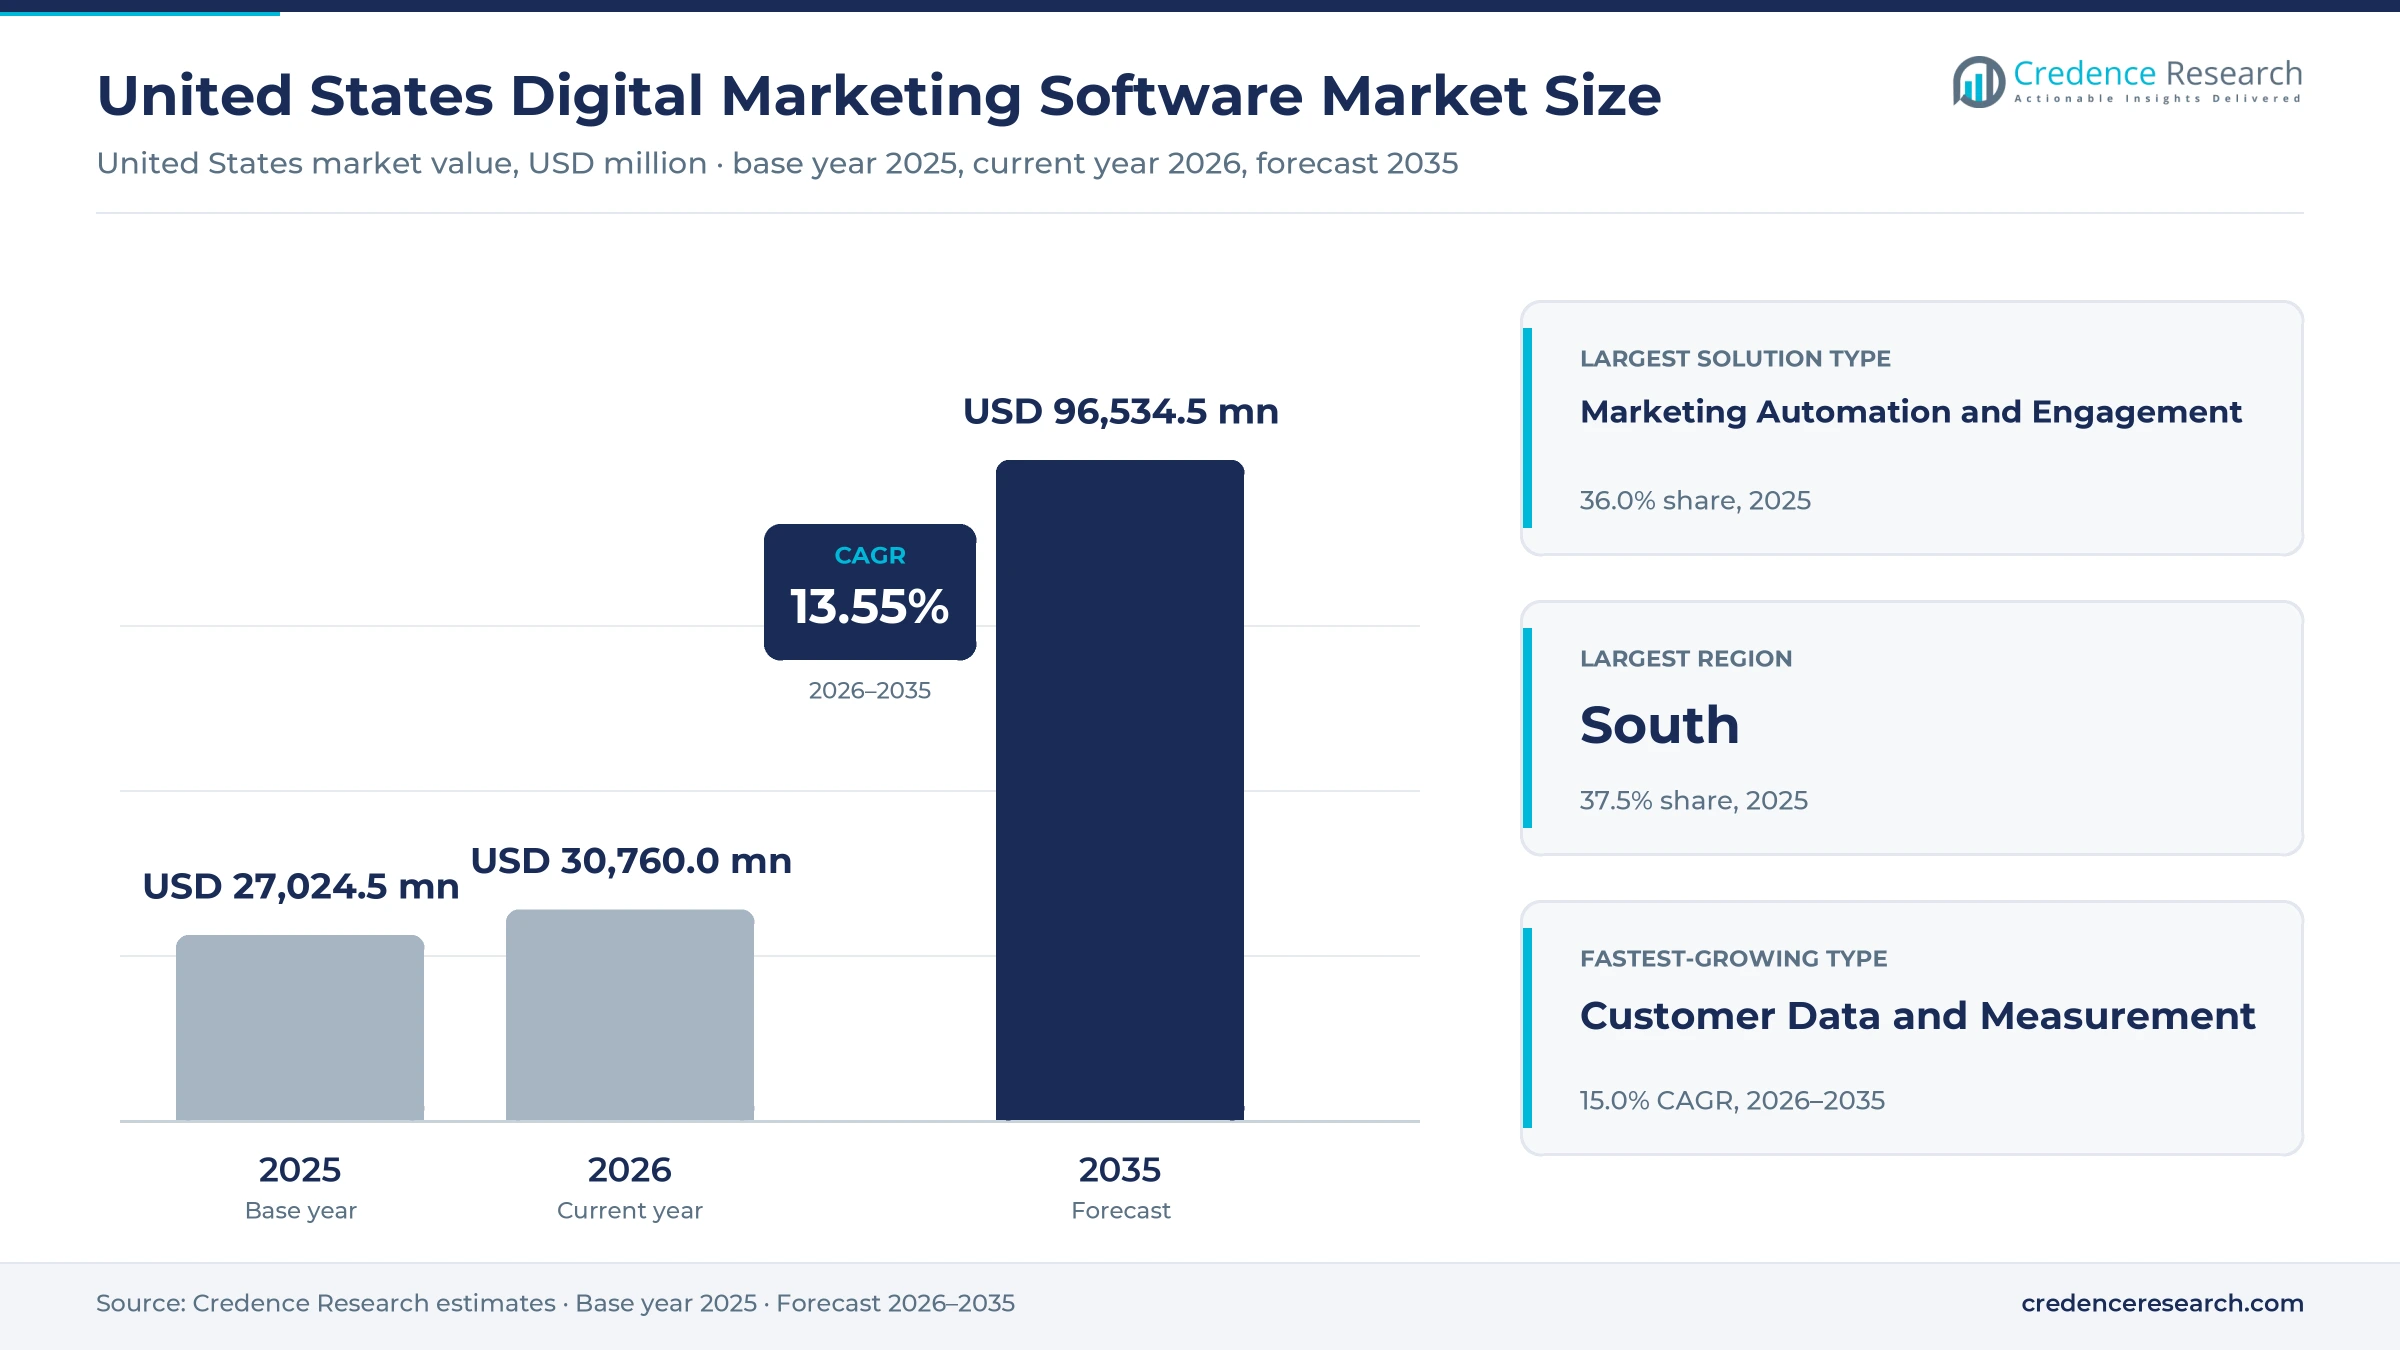
The United States digital marketing software market was valued at USD 27.02 billion in 2025 and is projected to increase from USD 30.76 billion in 2026 to USD 96.53 billion by 2035, registering a CAGR of 13.55% during 2026–2035. Demand comes from retailers and consumer brands that run email, SMS and loyalty programs, from business-to-business sellers that score and nurture leads, and from millions of small firms that buy their first automation plan online. The South held the largest regional share, 37.5% in 2025, because Florida, Texas and Georgia generate the most new businesses and a dense base of consumer brands. The West is the fastest-growing region at 13.9% a year as California buyers adopt AI agents early and the state enforces the strictest privacy rules. Vendors are now embedding AI agents that build campaigns, segment audiences and answer customers, which shifts pricing from seats toward usage and outcomes.
Software that plans, targets and measures campaigns sets the scope
The market counts software fees paid by organizations in the United States for marketing automation and engagement, customer data and measurement, search and content optimization, and advertising and social operations tools. Buyers pay subscription fees, usage fees for messages, contacts or AI actions, and license and vendor implementation fees, mostly to vendors directly or through solution partners.
Media spending itself, agency and consulting fees billed by third parties, general CRM seats used only by sales teams, and hardware sit outside the count. The value chain runs from cloud infrastructure and data providers through suite vendors and specialists to agencies, in-house marketing teams and small-business owners.
United States Digital Marketing Software Market Insights
- Software spending rises from USD 27.02 billion in 2025 to USD 96.53 billion by 2035, a 13.55% CAGR, as AI agents, consent-ready data platforms and new business cohorts expand together.
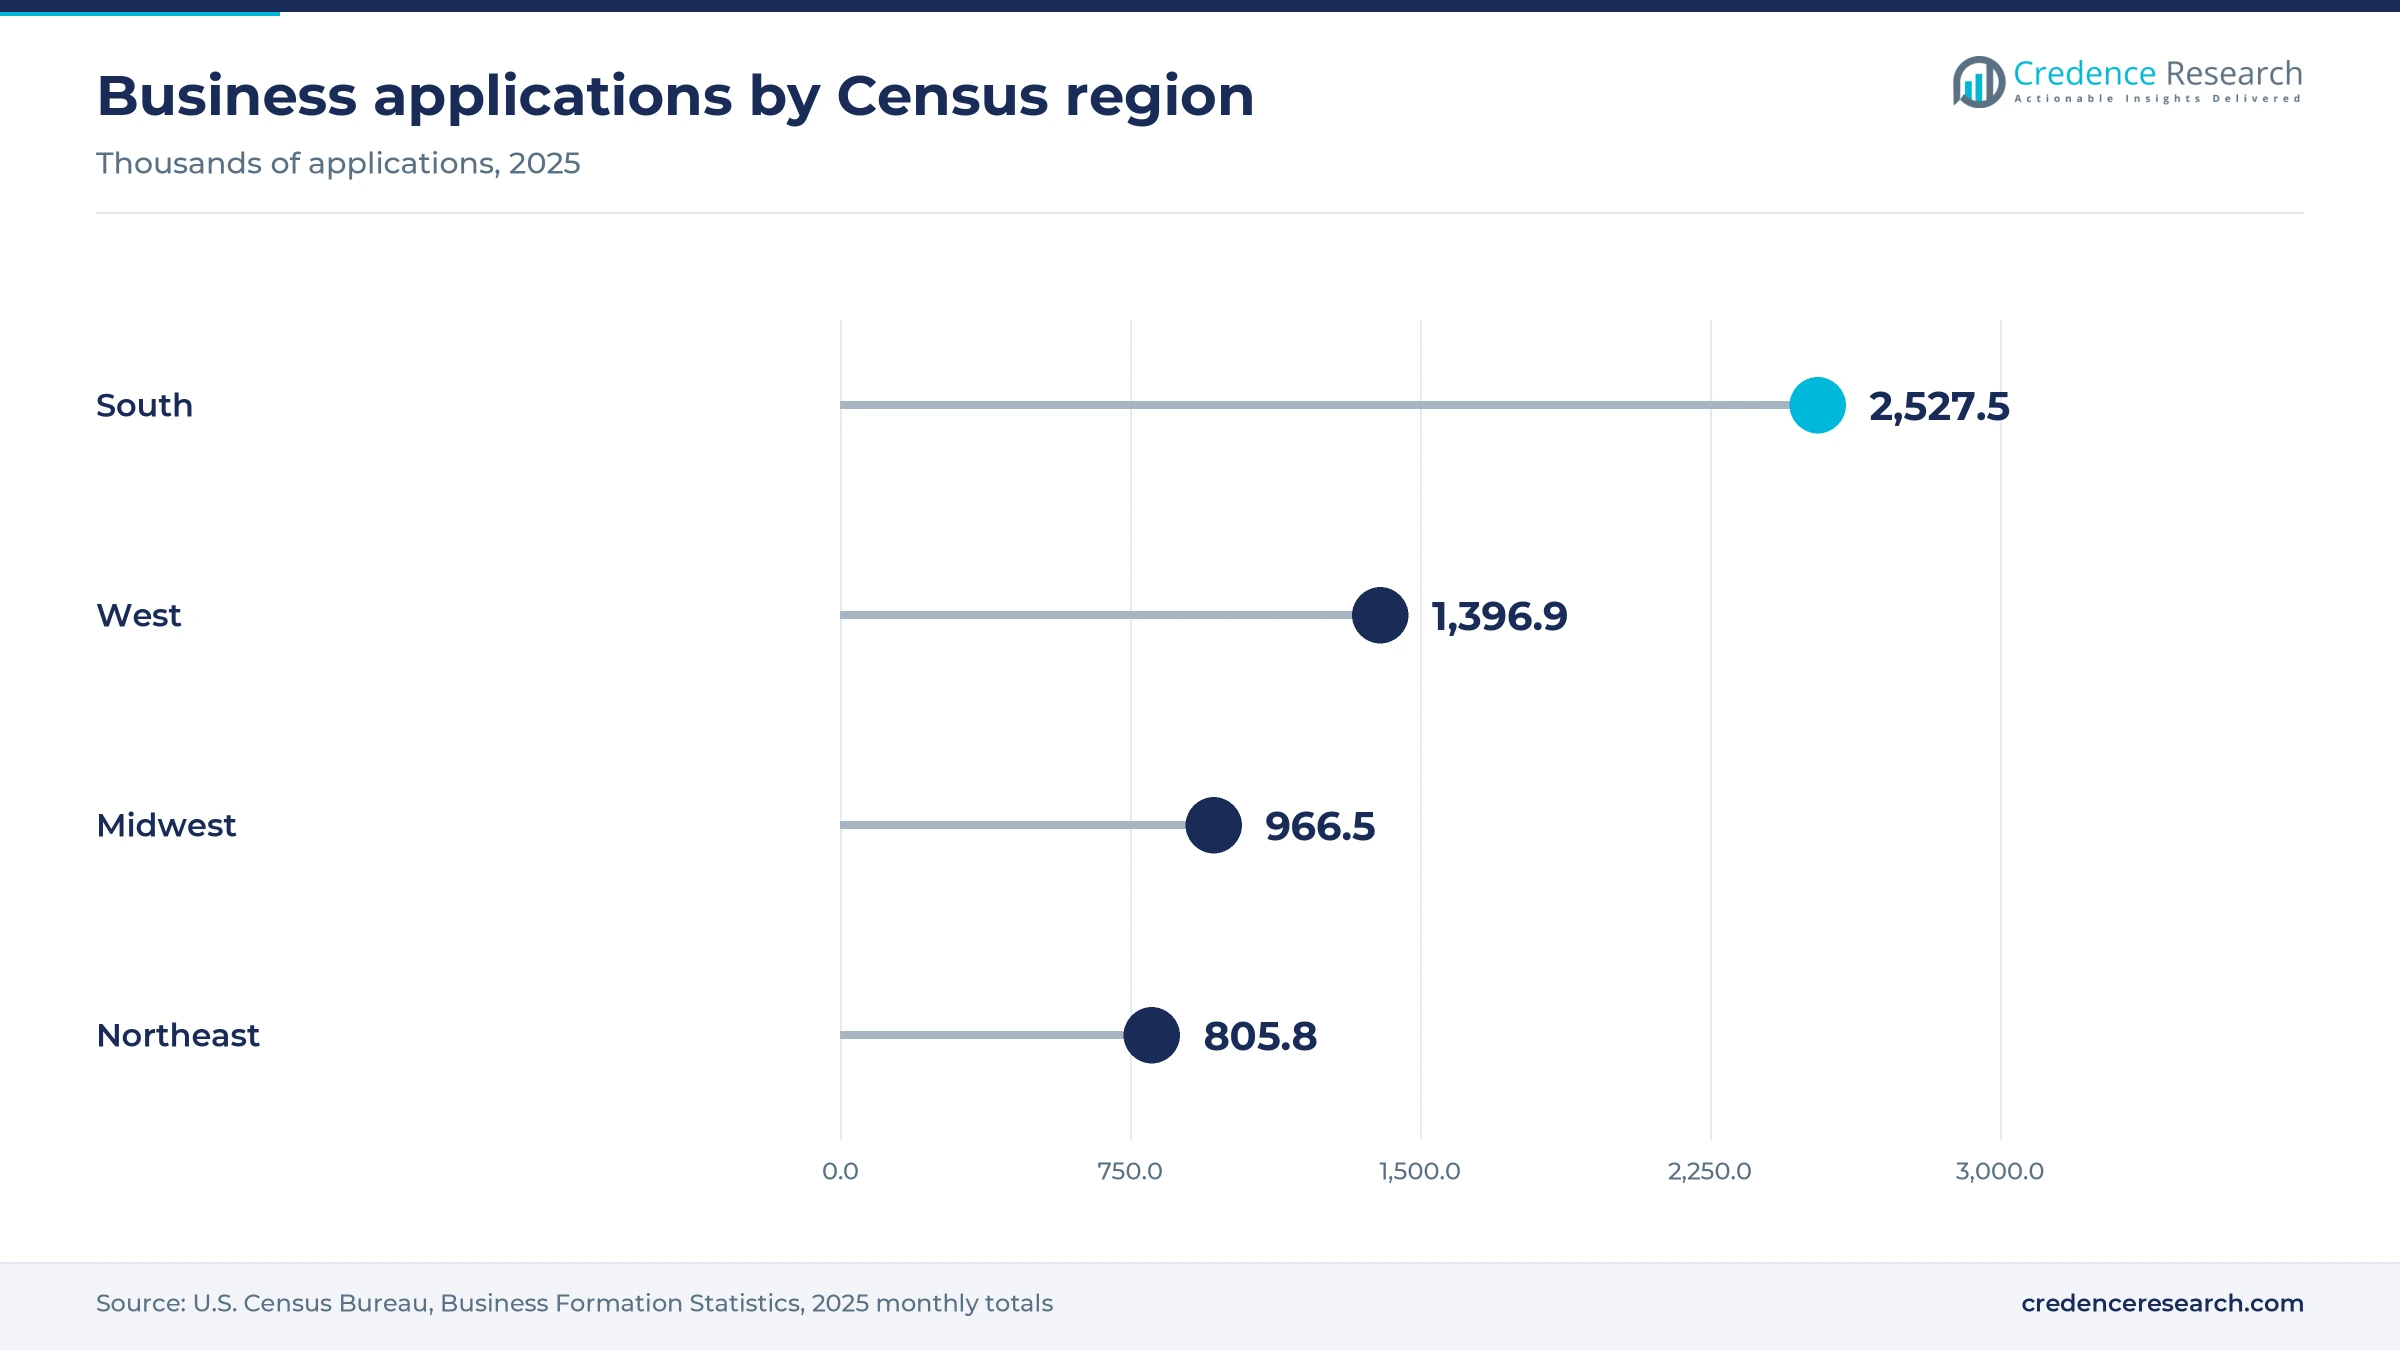
- The South held 37.5% of 2025 value, supported by the 2.53 million business applications filed in the region in 2025, the most of any Census region.
- Marketing Automation and Engagement accounted for 36.0% of 2025 value, while Multitenant Software as a Service carried 78.0% of spending.
- U.S. internet advertising revenue reached USD 294.6 billion in 2025, and each growing channel needs tools to plan, target and measure it.
- Adobe completed its USD 1.9 billion purchase of Semrush on April 28, 2026, adding search and AI-answer visibility to its enterprise marketing stack.
Engagement tools lead while customer data grows fastest
Why do marketing automation and engagement tools lead spending?
Based on solution type, the market is categorized into marketing automation and engagement, customer data and measurement, search and content optimization, and advertising and social operations. Marketing Automation and Engagement led with 36.0% of 2025 value because email, SMS and journey tools are the first systems every brand licenses, and Klaviyo alone reported more than 196,000 paying customers in June 2026. Customer data and measurement grows fastest at 15.0% a year because state privacy laws and AI agents both need unified, consent-tracked profiles. Salesforce closed its Informatica purchase on Nov. 18, 2025, to supply that data layer to its own agents.
How do U.S. buyers choose between shared, dedicated and on-premises software?
Based on deployment model, the market is categorized into multitenant software as a service, dedicated cloud and on-premises. Multitenant Software as a Service led with 78.0% of 2025 value and also grows fastest at 14.0% a year, because vendors ship AI features to shared platforms first, and Adobe said in September 2025 that more than 70% of eligible Experience Platform customers already used its AI Assistant. Dedicated cloud keeps a role with federal and defense buyers, since Salesforce says its Government Cloud Plus holds a FedRAMP High provisional authority to operate.
Which industries buy the most marketing software?
Based on end-use industry, the market is categorized into consumer-facing industries, business-to-business industries, regulated services and public and nonprofit organizations. Consumer-Facing Industries led with 45.5% of 2025 value because retailers run high-volume email, SMS and loyalty programs, and e-commerce reached 17.1% of U.S. retail sales in the second quarter of 2026, the Census Bureau reported. Regulated services grow fastest at 14.3% a year as health apps fall under the Federal Trade Commission health breach rule effective July 29, 2024, which pushes digital health brands toward platforms that log consent and data sharing.
How does firm size split marketing software spending?
Based on enterprise size, the market is categorized into small businesses with fewer than 20 employees, mid-market firms with 20 to 499 employees, and enterprises with 500 or more employees. Enterprises (500 or More Employees) led with 52.0% of 2025 value because large brands license several clouds at once, and they run several brands, regions and channels that each need separate journeys, which multiplies licenses per account. Small Businesses (Fewer Than 20 Employees) grow fastest at 14.7% a year as the SBA counts 36.2 million small businesses, a base that self-serve starter plans are built to reach.
| Segment Group | Leading Sub-segment | Share, 2025 | Fastest-growing Sub-segment | CAGR, 2026–2035 |
|---|---|---|---|---|
| By Solution Type | Marketing Automation and Engagement | 36.0% | Customer Data and Measurement | 15.0% |
| By Deployment Model | Multitenant Software as a Service | 78.0% | Multitenant Software as a Service | 14.0% |
| By End-Use Industry | Consumer-Facing Industries | 45.5% | Regulated Services | 14.3% |
| By Enterprise Size | Enterprises (500 or More Employees) | 52.0% | Small Businesses (Fewer Than 20 Employees) | 14.7% |
Tiered plans and metered AI set what buyers pay
Pricing in U.S. digital marketing software combines a platform tier, a contact or profile count and, increasingly, a meter for AI work. Entry plans start at about USD 20 a month, but contact bands and seat add-ons climb steeply, so a growing list is the main reason bills rise. Salesforce prices Agentforce actions at USD 0.10 each, sold in packs of 100,000 Flex Credits for USD 500, a model that ties cost to work completed. Margins sit in professional and enterprise tiers, where onboarding fees, data features and AI usage stack on top of the base subscription.
| Offer or plan | Typical price or fee | Basis |
|---|---|---|
| HubSpot Marketing Hub Starter, per month | USD 20 with 1,000 marketing contacts | eesel pricing review, June 2026 |
| HubSpot Marketing Hub Professional, per month | From USD 800 with three seats, plus USD 3,000 onboarding | eesel pricing review, June 2026 |
| HubSpot Marketing Hub Enterprise, per month | From USD 3,600 with five seats | eesel pricing review, June 2026 |
| Klaviyo Email plan, entry tier | USD 20 a month | Klaviyo pricing page, November 2026 |
| Salesforce Agentforce Flex Credits | USD 500 per 100,000 credits, USD 0.10 per action | Salesforce, May 2025 |
Request a Free Sample
Fill in your details and we'll send you a free sample report.
- Sample data tables & charts
- Research methodology
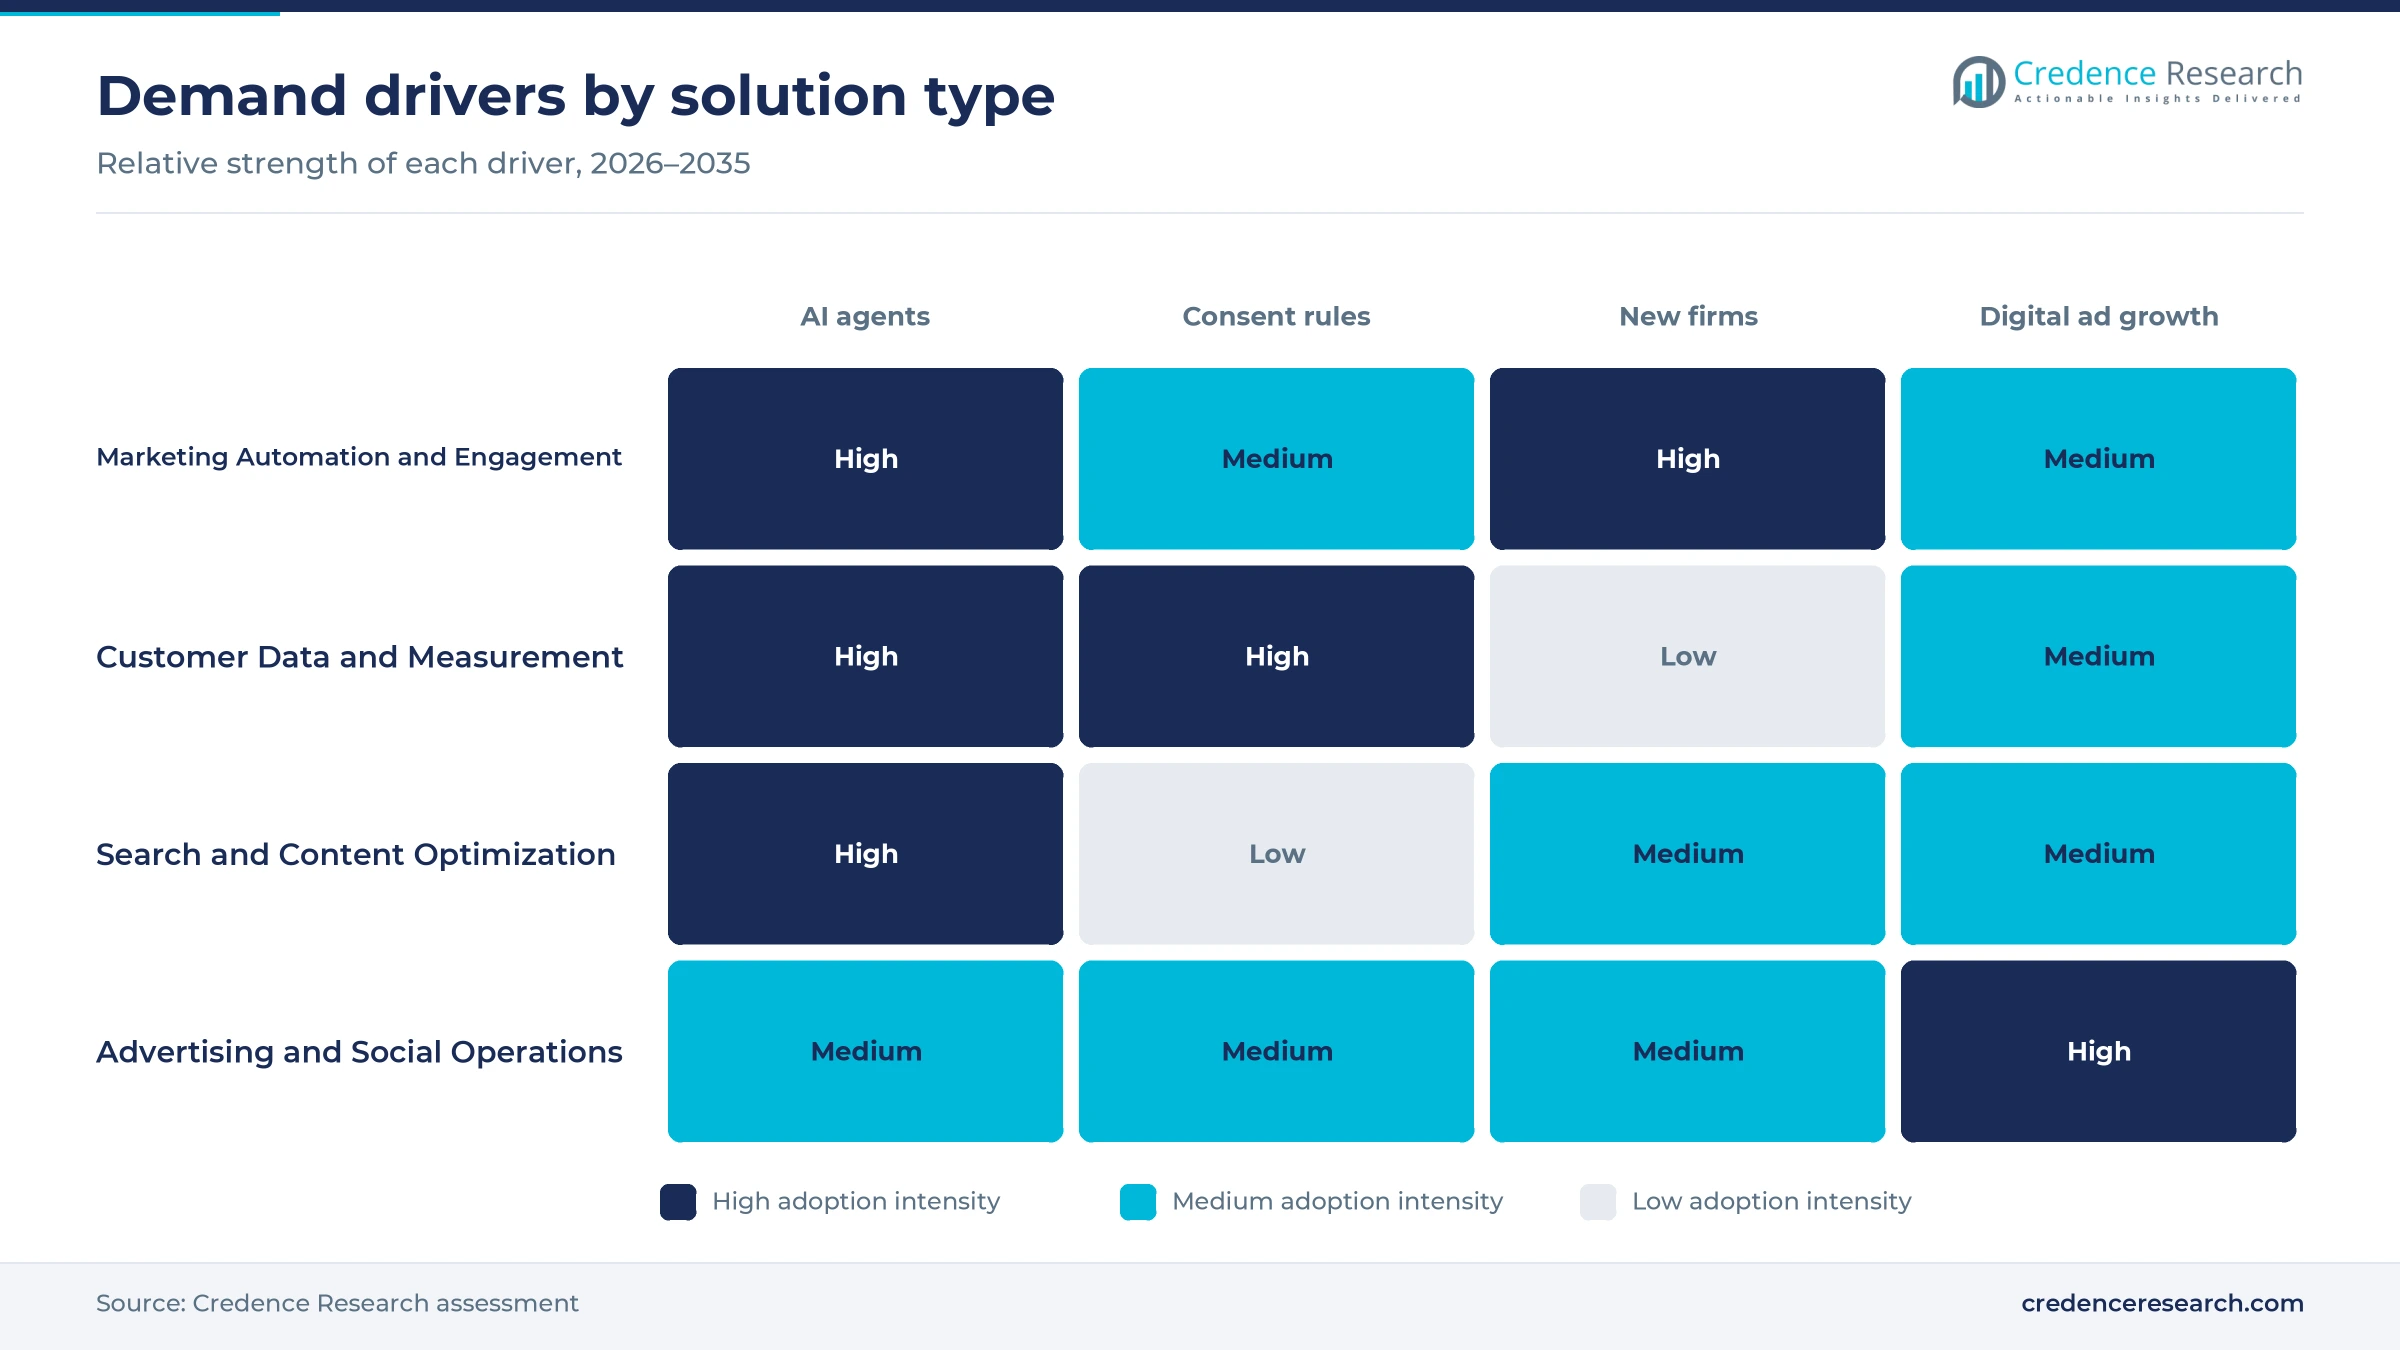
AI agents, consent rules and new firms lift software demand
AI embedded in marketing workflows raises value per account
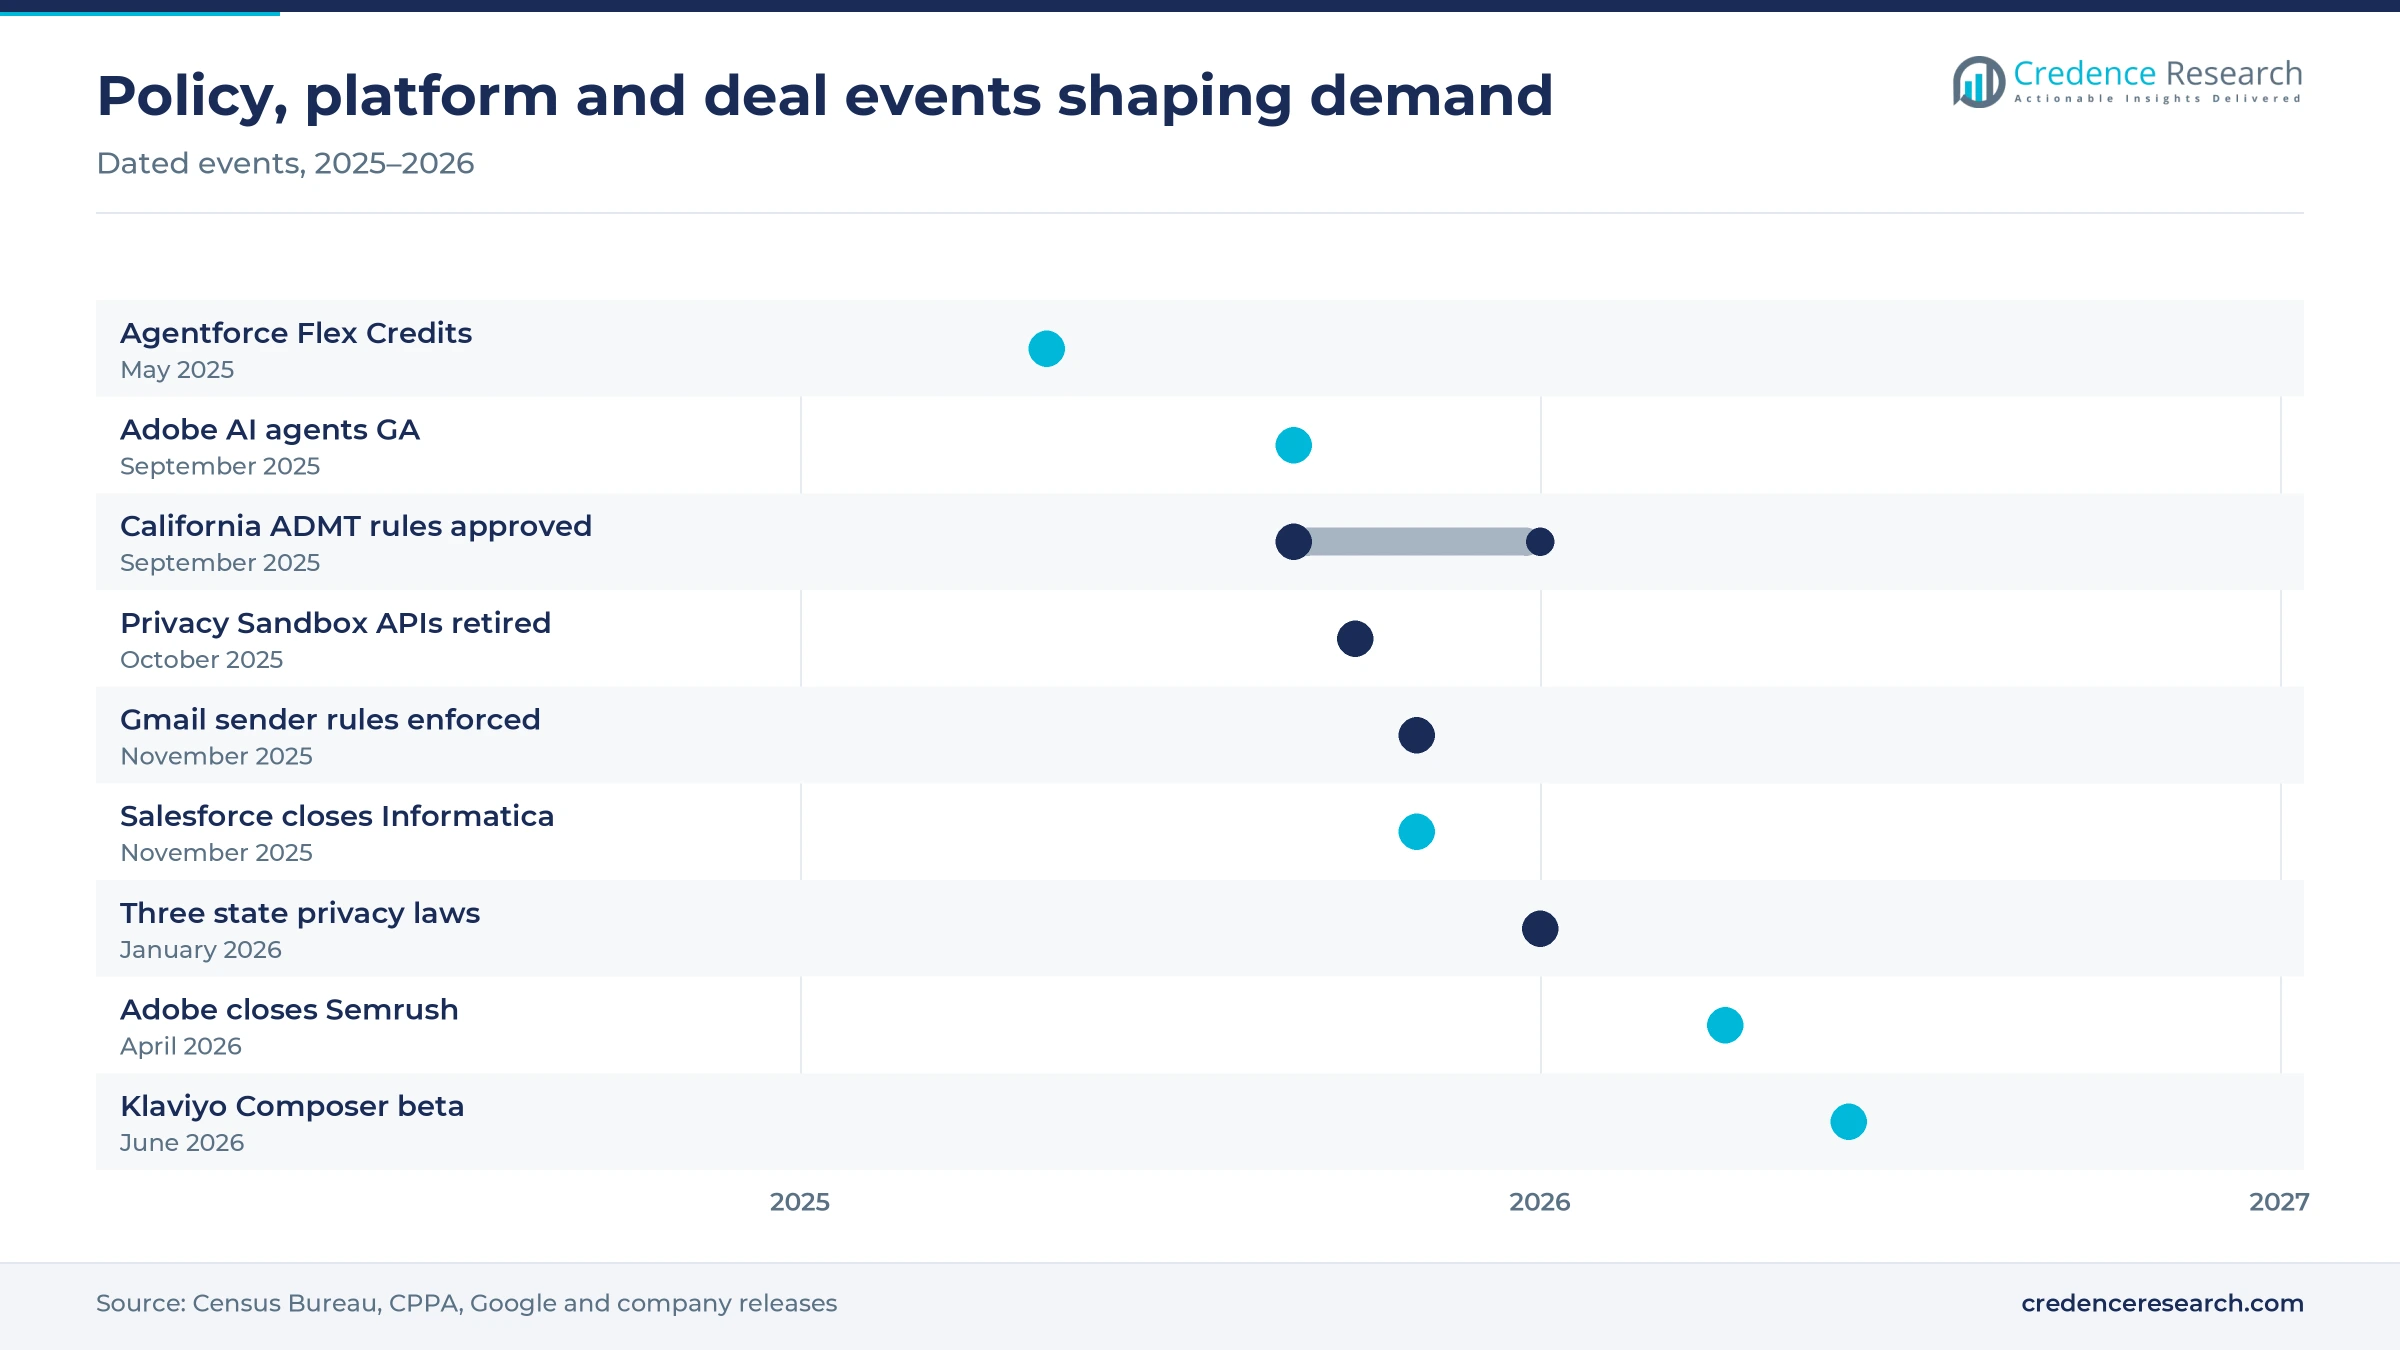
Generative AI is moving from content drafts into the core of campaign work, which lets vendors sell more capacity to each account instead of more seats. AI use among U.S. businesses reached 19.8% in the period ending May 3, 2026, according to the Census Bureau Business Trends and Outlook Survey, with use rising among firms of 20 or more employees. Adobe made six AI agents generally available on Sept. 10, 2025, covering audiences, journeys, experiments and site optimization. HubSpot announced 18 new Breeze agents at INBOUND in September 2025, taking its total to 33, CX Today reported. Buyers that adopt these agents move into higher plan tiers and metered usage, which is why Marketing Automation and Engagement still carries the largest budget.
Consent-aware customer data infrastructure becomes mandatory
State privacy law now forces brands to know which consent covers each profile before they target it, and that work runs through customer data software. Indiana, Kentucky and Rhode Island laws took effect on Jan. 1, 2026, each granting opt-outs from targeted advertising and profiling. California regulations on automated decisionmaking, risk assessments and cybersecurity audits were approved on Sept. 22, 2025, and took effect on Jan. 1, 2026, the California Privacy Protection Agency said. Google said on Oct. 17, 2025, that it would retire Topics, Protected Audience and other Privacy Sandbox technologies, leaving brands to build their own first-party identity. Customer data and measurement, at 15.0% a year, therefore leads solution growth as customer data platforms absorb consent records.
Expansion of paying business cohorts widens the base
New firms are the cheapest buyers to win, because they choose a starter marketing plan within months of opening and then move up the price ladder. Business applications rose in all four Census regions in 2025, led by the South, according to Census Bureau Business Formation Statistics. Of the 36.2 million small businesses noted above, 82.3% have no employees, the SBA Office of Advocacy said in January 2026, which makes self-serve tools the natural entry point. Klaviyo runs a free plan for up to 250 active profiles, which turns new online stores into paying accounts as lists grow. Small Businesses (Fewer Than 20 Employees), at 14.7% a year, are the fastest size band as these cohorts convert.
Digital ad and commerce growth expands the tools budget
Every dollar that moves into digital channels needs software to plan, target and measure it, so media growth lifts tool spending with a lag. U.S. internet advertising revenue reached USD 294.6 billion in 2025, the IAB/PwC report released on April 16, 2026, said. Social media advertising grew 32.6% to USD 117.7 billion, and programmatic buying rose 20.5% to USD 162.4 billion in the same report. Brands that run programmatic advertising and social campaigns at that scale buy ad operations, attribution and social publishing tools to control waste. Consumer brands in the South and West, where most new firms open, carry much of that spending.
Answer engines and suite consolidation reshape buying
Shift from blue-link search to AI answer visibility
Search optimization is being rebuilt for AI answer engines, because consumers increasingly ask chat assistants before they click a search result. Adobe said traffic from generative AI sources to U.S. retail sites rose 1,200% year over year in October 2025, when it agreed to buy Semrush for about USD 1.9 billion. The deal closed on April 28, 2026, and Adobe said in its completion release that Semrush brings more than 28 million users and tools for generative engine optimization. Search advertising still grew 11% to USD 114.2 billion in 2025, IAB/PwC data show, so brands now fund both classic search and answer-engine visibility. Search and content optimization vendors that track brand mentions inside AI answers gain budget from both lines.
Rise of suite consolidation through acquisitions
Large vendors are buying point tools to sell one platform, which narrows choice for enterprise buyers but lowers their integration costs. Zeta Global said on Nov. 24, 2025, that it had completed the purchase of the Marigold enterprise business, including Cheetah Digital, Selligent, Sailthru and Liveclicker. Salesforce launched Marketing Cloud Next in June 2025 on top of Data Cloud and said it combines nine acquired marketing and customer data products, Salesforce Ben reported. The Semrush deal described above extends the same pattern into search. Enterprises with 500 or more employees, at 52.0% of 2025 value, are the main buyers of these consolidated suites, while smaller firms keep using specialists.
Opportunity in agent-led retention for commerce brands
Retention marketing is the clearest place where AI agents can show revenue, because commerce brands measure every repeat order. Commerce media revenue rose 18.0% to USD 63.4 billion in 2025, IAB/PwC data show, which raises the value of the first-party shopper data that retention tools hold. Klaviyo put its Composer marketing agent into public beta on June 30, 2026, saying it audits flows and builds cross-channel campaigns drawing on patterns from nearly 200,000 brands. It also lists a Customer Agent with 10 resolutions a month in entry plans. Vendors that tie agent fees to repeat-purchase revenue can win mid-market brands that resist larger suite contracts.
Opportunity in nonprofit and public sector engagement
Nonprofits and public agencies are still underserved by marketing software, yet they run large donor and constituent lists that need segmentation and consent tracking. Giving USA estimated U.S. charitable giving at a record USD 617.2 billion in 2025, up 5.7%, as reported by The NonProfit Times in June 2026. Individuals gave about USD 394.2 billion, or 64% of the total, which makes donor email, SMS and peer-to-peer campaigns the core use case. Federal buyers need authorized clouds, and Salesforce Government Cloud Plus holds a FedRAMP High authority, as noted above. Vendors that package donor journeys with integration into CRM systems can widen this small segment.
State privacy rules and inbox limits raise operating costs
State-by-state privacy rules raise compliance costs
Compliance costs keep rising because each new state law adds its own consent, opt-out and penalty rules, and Rhode Island allows no cure period with fines up to USD 10,000 per violation. Indiana and Kentucky set fines up to USD 7,500 per violation with 30-day cure windows. Mid-market brands without privacy teams must buy consent tools or limit targeting, which slows campaign launches and shifts budget away from new engagement features.
Inbox provider rules penalize high-volume senders
Email programs now face hard limits, because Google requires anyone sending 5,000 or more messages a day to Gmail accounts to authenticate mail and keep spam complaints below 0.3%. Senders that miss the rules have faced permanent rejections since November 2025, and Microsoft began enforcing similar rules on Outlook.com in May 2025, GMass reported. Brands with old lists lose reach, while vendors must add authentication and list-hygiene tools without raising prices.
The small-firm AI gap limits upsell
AI features are not yet reaching the smallest buyers, because the Census Bureau found that AI use among firms with fewer than 20 employees did not change significantly between December 2025 and May 2026. Firms with four or fewer employees stayed below 20% adoption over the same period. Vendors that price AI as a premium add-on therefore struggle to lift revenue per small account, which slows the move from starter plans to professional tiers.
Billing changes and onboarding fees test buyer loyalty
Pricing changes are straining small and mid-market accounts, because Klaviyo moved to billing on total active profiles in February 2025, which raised bills for brands with large unemailed lists, Email Tool Tester reported. HubSpot lists a USD 3,000 onboarding fee for Marketing Hub Professional, according to eesel in June 2026. These costs push some buyers toward cheaper tools at renewal, which raises churn risk for vendors that depend on small accounts.
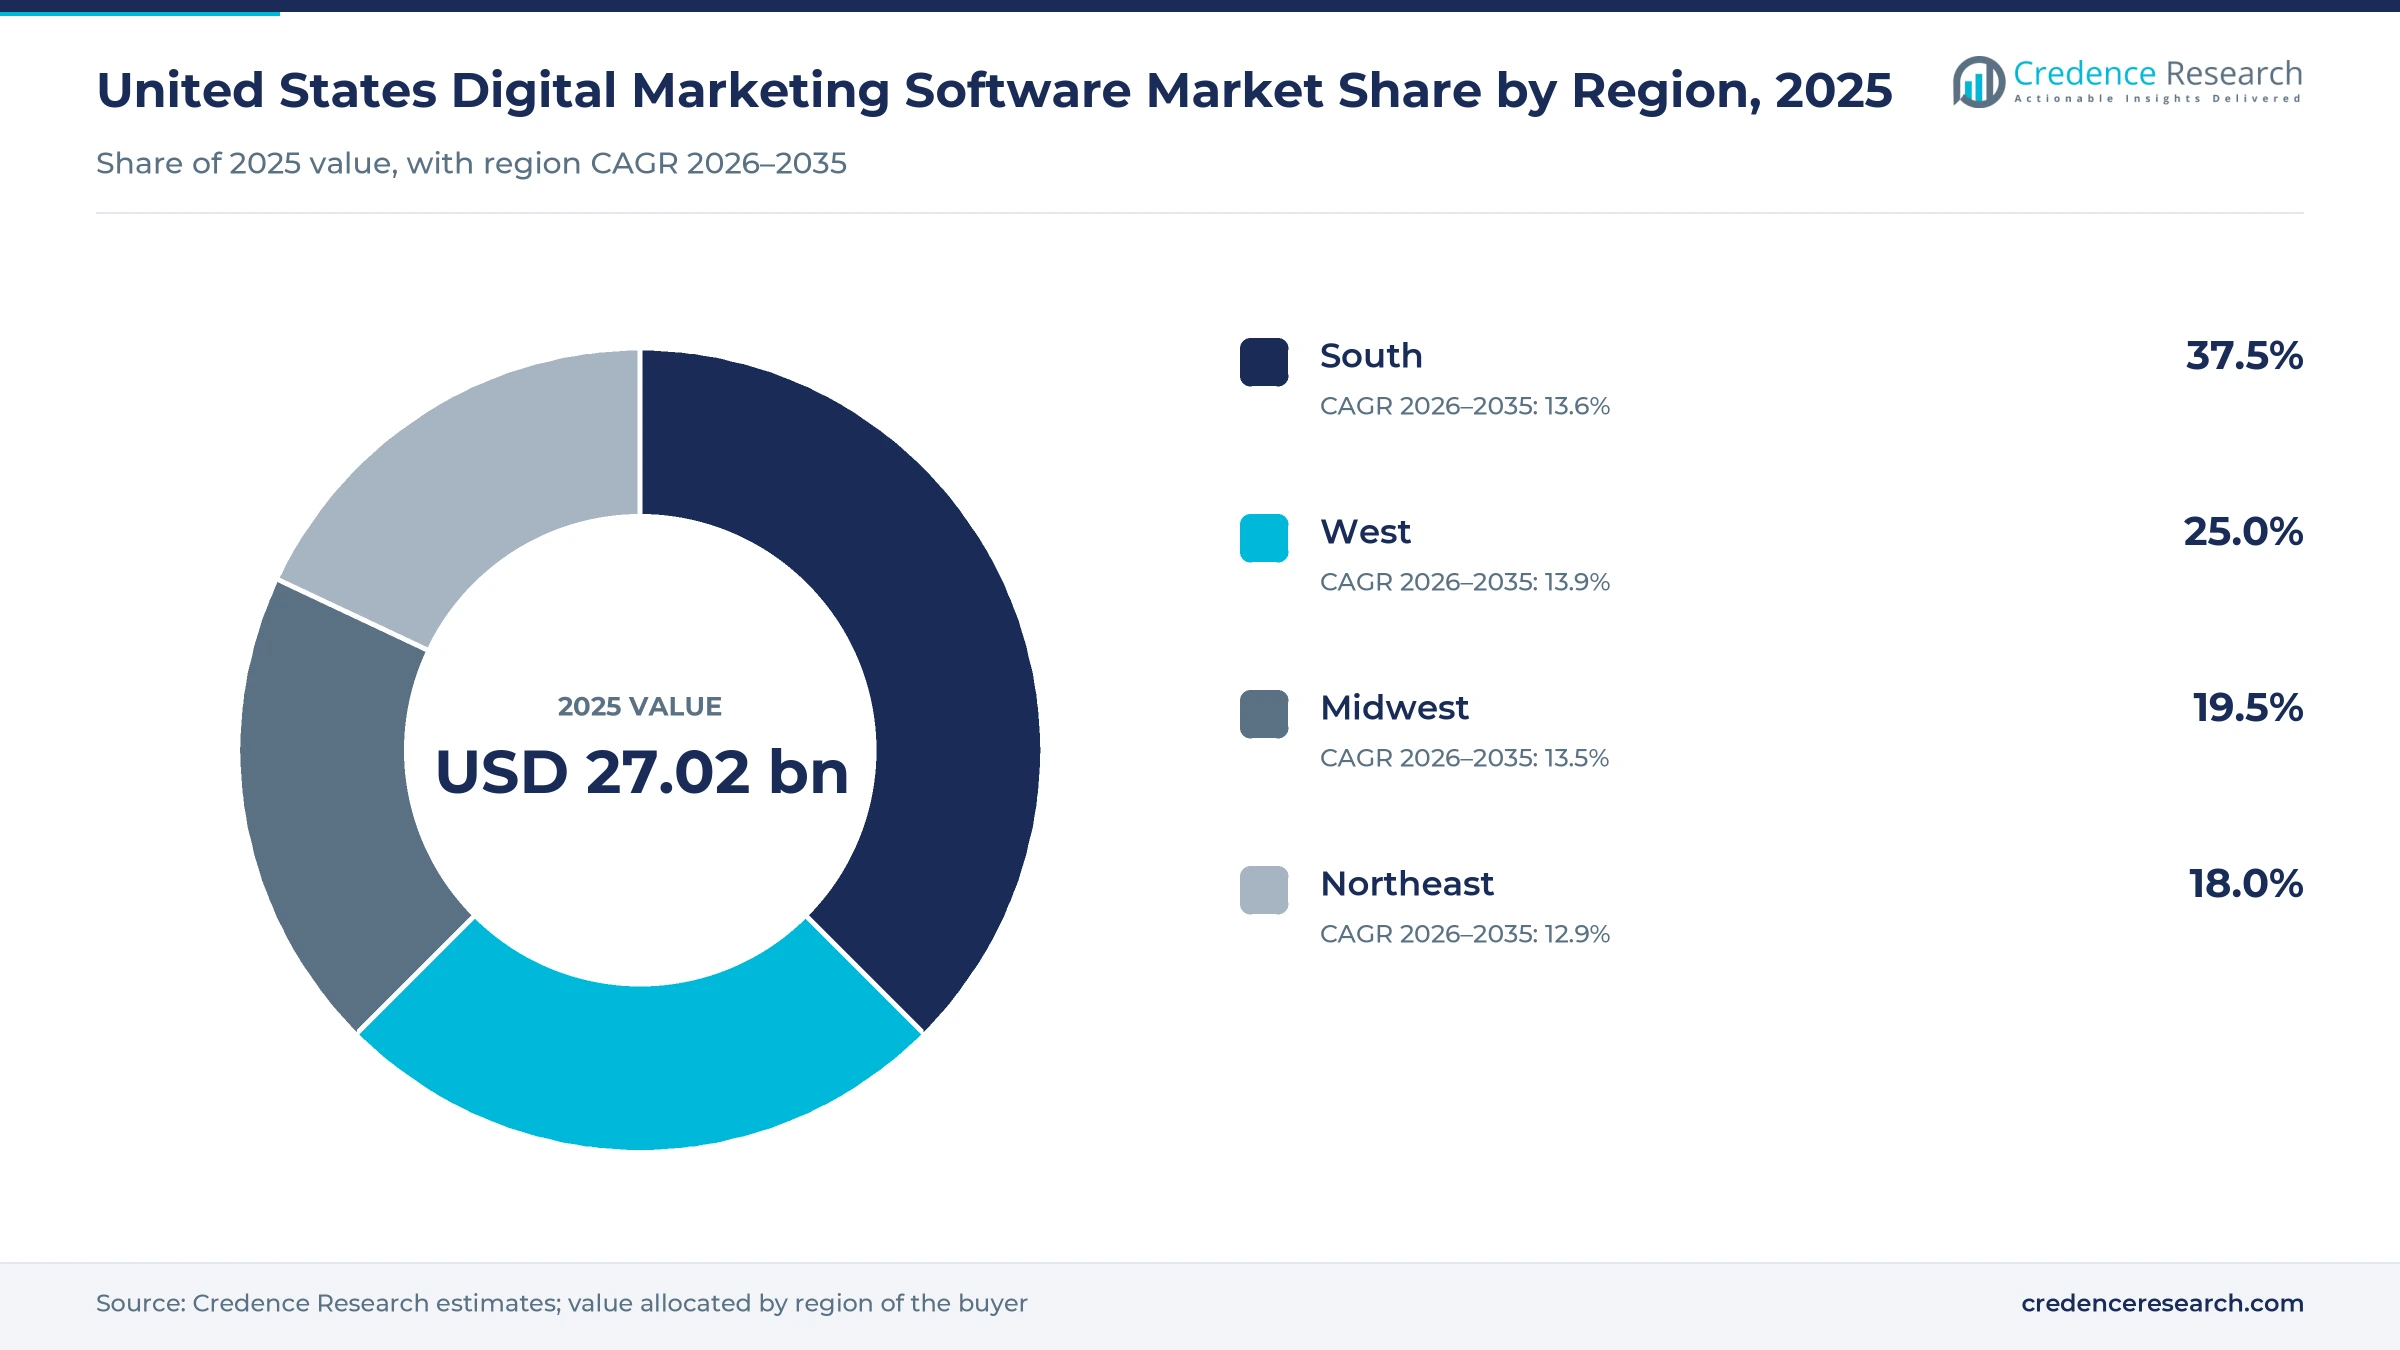
The South leads on firm formation as the West grows fastest
| Region | Value, 2025 (USD billion) | Share, 2025 | CAGR, 2026–2035 |
|---|---|---|---|
| South | 10.13 | 37.5% | 13.6% |
| West | 6.76 | 25.0% | 13.9% |
| Midwest | 5.27 | 19.5% | 13.5% |
| Northeast | 4.86 | 18.0% | 12.9% |
The South leads on new businesses and consumer brands
The South held 37.5% of 2025 value and grows at 13.6% a year. Florida led every state with 649,821 business applications in 2025, and Texas followed with 546,586, according to Census Bureau Business Formation Statistics. The region filed 2.53 million business applications in 2025, more than any other Census region. Most of these new firms start on self-serve email plans priced from about USD 20 a month, as the pricing section shows. Kentucky's new privacy law, described in the drivers section, adds consent duties that lift demand for data tools among southern brands.
The West grows fastest on early AI adoption
The West is the fastest-growing region at 13.9% a year and held 25.0% of 2025 value. California recorded 555,928 business applications in 2025, the second-highest state total, which keeps a steady flow of new accounts. The California Privacy Protection Agency rules on automated decisionmaking, covered above, make the state the first test market for consent-aware AI. Brands here adopt agent features early, which pulls regional spending ahead of the national pace.
The Midwest relies on manufacturers and B2B sellers
The Midwest held 19.5% of 2025 value and grows at 13.5% a year. The region filed 966,506 business applications in 2025, up from 862,593 in 2024, the fastest rise among the four Census regions. Manufacturers and distributors in the region buy lead scoring and account-based tools rather than high-volume consumer messaging. Indiana's privacy law, noted above, adds consent work for the region's manufacturers and B2B sellers.
The Northeast hosts vendors and media buyers
The Northeast held 18.0% of 2025 value and grows at 12.9% a year. Buyers in the region skew toward banks, insurers, publishers and agencies, which license enterprise suites on multi-year contracts rather than starter plans. The region filed 805,836 business applications in 2025, the fewest of the four Census regions, which limits the flow of new small accounts. Because fewer new small accounts arrive each year, growth in the region trails the national rate.
Acquisitions and agent launches reset the vendor map
| Development | Status and market relevance |
|---|---|
| In September 2025, Adobe made six AI agents generally available on Adobe Experience Platform. | Generally available to enterprise customers |
| In November 2025, Salesforce completed its acquisition of Informatica. | Closed, data foundation for Agentforce |
| In November 2025, Zeta Global completed the acquisition of the Marigold enterprise software business. | Closed, adds loyalty and email brands |
| In April 2026, Adobe completed its acquisition of Semrush. | Closed, search and AI visibility added |
| In June 2026, Klaviyo put its Composer marketing agent into public beta. | Public beta for consumer brands |
Agents, identity graphs and GEO decide platform value
- AI agents build audiences, draft journeys and run experiments inside automation suites, which shifts value from seats to completed work.
- Consent-aware identity graphs link each profile to its opt-in and opt-out record, so brands can target only the customers state laws allow.
- Generative engine optimization tracks how brands appear inside AI chat answers, extending classic search tools to a new discovery channel.
- Social publishing and listening connects social media management tools to campaign data, so teams can measure organic and paid social together.
Need a Custom Version of This Report?
Tailor the scope, geography, or segments to your exact requirements.
- Custom geography or segment scope
- Direct access to our analyst team
Cloud suites face commerce and SMB specialists on price
Competition turns on data depth, AI features, price per contact and ease of setup rather than on brand alone. Salesforce and Adobe lead enterprise accounts with suites built on their own customer data platforms and now sell AI agents on top. Oracle sells Eloqua marketing automation to large B2B brands, while Google sells Campaign Manager 360 and Search Ads 360 to advertisers and agencies. HubSpot dominates many mid-market B2B accounts with an all-in-one platform, and Intuit Mailchimp serves small firms with self-serve email. Klaviyo competes for commerce brands with profile-based pricing, and Braze sells customer engagement software to consumer and app-based businesses. Zeta Global combines identity data with the Marigold email and loyalty brands, and Sprout Social sells social management to brands and agencies.
Suite owners, commerce specialists and a long tail
Supply in this market is organized in three distinct tiers of vendors. Salesforce, Adobe, Oracle and Google sell broad enterprise suites through direct teams and large agencies, and they defend accounts with data platforms that are costly to replace. HubSpot, Intuit Mailchimp, Klaviyo and Braze compete in the mid-market and small-business tiers with self-serve plans and fast product cycles. A long tail of search, social and analytics tools serves agencies and in-house teams. Entry is easy for point tools, but data integration and consent records create switching costs, so margins concentrate with suite owners and the largest specialists.
Leading vendors serving U.S. marketing teams
| Company | Type | Role in the market |
|---|---|---|
| Salesforce | Enterprise suite vendor | Sells Marketing Cloud, Data Cloud and Agentforce agents to U.S. brands |
| Adobe | Enterprise suite vendor | Sells Experience Platform AI agents, Experience Manager and Semrush tools |
| HubSpot | Mid-market platform | Sells Marketing Hub and Breeze AI agents to B2B and small firms |
| Google (Alphabet) | Advertising platform vendor | Sells Google Marketing Platform tools including Campaign Manager 360 and Search Ads 360 |
| Oracle | Enterprise suite vendor | Sells Eloqua marketing automation and account intelligence to large B2B brands |
| Intuit (Mailchimp) | Small-business specialist | Sells self-serve email and automation plans from its Atlanta base |
| Klaviyo | Commerce specialist | Sells email, SMS and AI agents to consumer brands on profile-based plans |
| Zeta Global | Data-led marketing platform | Sells identity data, email and loyalty tools including the Marigold brands |
| Braze | Engagement specialist | Sells customer engagement software to consumer and app-based brands |
| Sprout Social | Social software specialist | Sells social publishing, listening and analytics software from Chicago |
Data readiness, not seat counts, decides vendor growth
Credence Research's view is that vendor growth over the next decade will depend more on how ready buyers' data is than on how many seats they license. AI agents only work when profiles are unified and consent is recorded, and state rules now make that a legal duty rather than a choice. Small firms are the largest untapped pool, but they have been slow to pay for AI add-ons. Vendors that bundle consent-ready data, usage-priced agents and simple onboarding should gain share, while seat-only pricing faces pressure as agents do more of the work.
Ad spend, firm counts and list prices anchor the estimate
The report uses 2025 as the base year and forecasts to 2035. Market values come from the Credence Research model, built top-down from U.S. digital advertising revenue and the share spent on marketing software, then checked against vendor customer counts, published list prices and business formation data. Regional, segment and size splits are Credence Research estimates based on Census business applications, firm-size AI adoption rates and vendor presence. Sources include Census Bureau and SBA statistics, state privacy agencies, industry association data, company announcements and trade press. The analysts conducted no interviews or surveys for this edition of the report.
Customer data, small firms and the West carry growth
The United States digital marketing software market is set to grow from USD 30.76 billion in 2026 to USD 96.53 billion by 2035, a 13.55% CAGR. Customer data and measurement will be the fastest solution type as consent rules and AI agents both depend on unified profiles, and small businesses will be the fastest size band as new firms adopt starter plans. Regulated services should take a larger part of spending as health and financial brands buy consent-tracked tools, and the West will edge ahead of the national pace. Vendors that price agents by usage and keep onboarding simple will be best placed.
Data readiness and AI pricing decide the range of outcomes
In the base case, spending grows along the central forecast as AI agents spread, consent rules lift data spending and new firms adopt starter plans. The downside case assumes ad budgets slow, small firms stay away from AI add-ons and agents reduce seat counts faster than usage pricing replaces them. The upside case adds quick adoption of agent-led retention and answer-engine optimization by mid-market brands.
| Scenario | CAGR, 2026–2035 | Value, 2035 | What has to hold |
|---|---|---|---|
| Downside | 11.6% | USD 82.26 billion | Ad budgets slow and AI agents cut paid seats faster than usage fees grow |
| Base | 13.55% | USD 96.53 billion | Agents spread across suites and state privacy rules lift customer data spending |
| Upside | 15.1% | USD 108.63 billion | Mid-market brands adopt agent-led retention and answer-engine optimization quickly |
Frequently Asked Questions
How big is the United States digital marketing software market?
Which solution type leads the market?
Which solution type grows fastest?
Which region leads the U.S. market?
How do state privacy laws affect marketing software buying?
How is marketing software priced in the United States?
Who are the leading companies in the market?
What are the main challenges for vendors?
Table of Content
Chapter 1 Market Segmentation
- 1.1 Segmentation Framework
- 1.1.1 Product and Service Classification
- 1.1.2 Application and End-Use Classification
- 1.1.3 Technology and Solution Classification
- 1.1.4 Customer and Distribution Channel Classification
- 1.1.5 Geographic Segmentation
- 1.1.6 Market Segment Definitions and Boundaries
- 1.2 By Solution Type
- 1.2.1 Marketing Automation and Engagement
- 1.2.2 Customer Data and Measurement
- 1.2.3 Search and Content Optimization
- 1.2.4 Advertising and Social Operations
- 1.3 By Deployment Model
- 1.3.1 Multitenant Software as a Service
- 1.3.2 Dedicated Cloud
- 1.3.3 On-Premises
- 1.4 By End-Use Industry
- 1.4.1 Consumer-Facing Industries
- 1.4.2 Business-to-Business Industries
- 1.4.3 Regulated Services
- 1.4.4 Public and Nonprofit Organizations
- 1.5 By Enterprise Size
- 1.5.1 Enterprises (500 or More Employees)
- 1.5.2 Mid-Market Firms (20–499 Employees)
- 1.5.3 Small Businesses (Fewer Than 20 Employees)
Chapter 2 Introduction
- 2.1 Report Objectives and Scope
- 2.2 Product Definition and Industry Terminology
- 2.3 Market Inclusions and Exclusions
- 2.4 Research Process
- 2.4.1 Primary Research and Expert Interviews
- 2.4.2 Secondary Research and Source Review
- 2.4.3 Top-Down and Bottom-Up Estimation
- 2.4.4 Data Triangulation and Verification
- 2.5 Market Size Measurement Basis
- 2.5.1 2025: USD 27.02 billion → 2035: USD 96.53 billion
- 2.6 Historical and Forecast Reference Periods
- 2.6.1 Historical Period: 2018-2025
- 2.6.2 Base Year: 2025
- 2.6.3 Forecast Period: 2025-2035
- 2.7 Research Assumptions and Limitations
Chapter 3 Executive Summary
- 3.1 Market Snapshot and Key Findings
- 3.2 Base-Year Market Size, 2025
- 3.3 Forecast Market Size, 2035
- 3.4 Revenue and Volume Growth Outlook
- 3.5 Key Demand and Supply Indicators
- 3.6 Leading Market Segments
- 3.7 Fastest-Growing Market Opportunities
- 3.8 Regional Performance Highlights
- 3.9 Technology and Industry Transformation
- 3.10 Competitive Landscape Summary
- 3.11 Analyst View and Strategic Implications
Chapter 4 United States Digital Marketing Software Market Trends and Developments
- 4.1 Historical Industry Development, 2018-2025
- 4.2 Recent Market Trends and Developments
- 4.3 Demand and Customer Behavior Trends
- 4.4 Technology and Product Innovation
- 4.5 Artificial Intelligence, Automation and Digitalization
- 4.6 Local Manufacturing and Supply Chain Realignment
- 4.7 Industry Partnerships, Mergers and Acquisitions
- 4.8 Sustainability and Circular Economy Developments
- 4.9 Government and Private Sector Investment Trends
- 4.10 Emerging Business Models and Commercialization
- 4.11 Industry Developments and Announcements
Chapter 5 United States Digital Marketing Software Market Supply and Demand Analysis
- 5.1 Demand Trend and Consumption Analysis, 2018-2025
- 5.2 Demand Forecast, 2025-2035
- 5.3 Supply Chain Structure and Procurement Trends
- 5.4 Supply-Demand Gap and Bottlenecks
- 5.5 Import Dependence and Sourcing Structure
- 5.6 Regional Supply and Demand Concentration
Chapter 6 United States Digital Marketing Software Market Pricing Analysis
- 6.1 Pricing Structure and Measurement
- 6.2 Historical Pricing Trends, 2018-2025
- 6.3 Pricing Outlook, 2025-2035
- 6.4 Pricing by Product and Market Segment
- 6.5 Geographic Pricing Differences
- 6.6 Key Input, Energy, Labor and Logistics Costs
- 6.7 Contract Pricing and Purchasing Models
- 6.8 Pricing Sensitivity and Competitive Positioning
- 6.9 Price, Margin and Profitability Implications
Chapter 7 United States Digital Marketing Software Market Dynamics
- 7.1 Market Growth Drivers
- 7.1.1 Demand-Side Drivers
- 7.1.2 Technology and Innovation Drivers
- 7.1.3 Infrastructure and Investment Drivers
- 7.1.4 Regulatory and Policy Drivers
- 7.2 Market Restraints
- 7.2.1 Cost and Affordability Constraints
- 7.2.2 Technology and Adoption Barriers
- 7.2.3 Supply Chain and Operational Constraints
- 7.3 Market Challenges
- 7.3.1 Competitive Pressure and Margin Erosion
- 7.3.2 Skills, Infrastructure and Implementation Gaps
- 7.4 Emerging Market Opportunities
- 7.5 Market Dynamics Impact and Time-Horizon Assessment
Chapter 8 United States Digital Marketing Software Value Chain Analysis
- 8.1 Industry Value Chain Overview
- 8.2 Upstream Suppliers and Critical Inputs
- 8.3 Technology and Component Providers
- 8.4 Manufacturing or Service Delivery
- 8.5 Distribution, Channel Partners and Integrators
- 8.6 Downstream Applications and End Users
- 8.7 Value Addition and Profit Pools
- 8.8 Vertical Integration and Outsourcing
- 8.9 Supplier Concentration and Risk
- 8.10 Supply Chain Localization and Resilience
Chapter 9 United States Digital Marketing Software Market Regulations and Policies
- 9.1 Relevant Laws, Standards and Compliance Frameworks
- 9.2 Product, Service, Safety and Quality Requirements
- 9.3 Government Policies, Incentives and Subsidies
- 9.4 Imports, Exports and Trade Barriers
- 9.5 Public Procurement and Local Content Requirements
- 9.6 Data Protection, AI and Cybersecurity Compliance
- 9.7 Upcoming Policy Changes and Market Implications
Chapter 10 United States Digital Marketing Software Market Hotspots and Opportunities
- 10.1 Market Opportunity Mapping and Growth Hotspots
- 10.2 High-Growth Applications and Customer Groups
- 10.3 Underserved Markets and White-Space Opportunities
- 10.4 Emerging Technology and Product Opportunities
- 10.5 New Capacity and Investment Hotspots
- 10.6 Market Entry and Expansion Opportunities
- 10.7 Distribution and Partnership Opportunities
- 10.8 Near-Term and Long-Term Commercial Potential
- 10.9 Opportunity Attractiveness and Execution Risks
Chapter 11 United States Digital Marketing Software Market Outlook, 2025-2035
- 11.1 Market Size and Analysis
- 11.1.1 Revenue (Market Measurement: 2025: USD 27.02 billion → 2035: USD 96.53 billion)
- 11.1.2 Historical Market Size, 2018-2025
- 11.1.3 Base-Year Market Size, 2025
- 11.2 Market Forecast, 2025-2035
- 11.2.1 Revenue Forecast to 2035
- 11.2.2 CAGR and Year-on-Year Growth
- 11.2.3 Incremental Revenue Opportunity
- 11.3 Forecast Assumptions and Scenario Analysis
- 11.3.1 Base-Case Forecast
- 11.3.2 Optimistic and Conservative Scenarios
- 11.3.3 Technology, Pricing and Policy Sensitivities
- 11.4 Market Attractiveness and Growth Outlook
Chapter 12 United States Digital Marketing Software Market Segmentation and Outlook
- 12.1 Segmentation Summary and Market Shares, 2025
- 12.2 Largest and Fastest-Growing Segments
- 12.3 By Solution Type - Market Size and Forecast, 2025-2035
- 12.3.1 Segment Definition and Scope
- 12.3.2 Historical Market Size, 2018-2025
- 12.3.3 Revenue Forecast, 2025-2035
- 12.3.4 Base-Year Market Share, 2025
- 12.3.5 Segment CAGR and Growth Drivers
- 12.3.6 Subsegment Market Size and Forecast
- 12.3.6.1 Marketing Automation and Engagement
- 12.3.6.2 Customer Data and Measurement
- 12.3.6.3 Search and Content Optimization
- 12.3.6.4 Advertising and Social Operations
- 12.3.7 Subsegment Pricing and Adoption Trends
- 12.3.8 Leading Suppliers and Competition
- 12.3.9 Regional Demand and Opportunities
- 12.4 By Deployment Model - Market Size and Forecast, 2025-2035
- 12.4.1 Segment Definition and Scope
- 12.4.2 Historical Market Size, 2018-2025
- 12.4.3 Revenue Forecast, 2025-2035
- 12.4.4 Base-Year Market Share, 2025
- 12.4.5 Segment CAGR and Growth Drivers
- 12.4.6 Subsegment Market Size and Forecast
- 12.4.6.1 Multitenant Software as a Service
- 12.4.6.2 Dedicated Cloud
- 12.4.6.3 On-Premises
- 12.4.7 Subsegment Pricing and Adoption Trends
- 12.4.8 Leading Suppliers and Competition
- 12.4.9 Regional Demand and Opportunities
- 12.5 By End-Use Industry - Market Size and Forecast, 2025-2035
- 12.5.1 Segment Definition and Scope
- 12.5.2 Historical Market Size, 2018-2025
- 12.5.3 Revenue Forecast, 2025-2035
- 12.5.4 Base-Year Market Share, 2025
- 12.5.5 Segment CAGR and Growth Drivers
- 12.5.6 Subsegment Market Size and Forecast
- 12.5.6.1 Consumer-Facing Industries
- 12.5.6.2 Business-to-Business Industries
- 12.5.6.3 Regulated Services
- 12.5.6.4 Public and Nonprofit Organizations
- 12.5.7 Subsegment Pricing and Adoption Trends
- 12.5.8 Leading Suppliers and Competition
- 12.5.9 Regional Demand and Opportunities
- 12.6 By Enterprise Size - Market Size and Forecast, 2025-2035
- 12.6.1 Segment Definition and Scope
- 12.6.2 Historical Market Size, 2018-2025
- 12.6.3 Revenue Forecast, 2025-2035
- 12.6.4 Base-Year Market Share, 2025
- 12.6.5 Segment CAGR and Growth Drivers
- 12.6.6 Subsegment Market Size and Forecast
- 12.6.6.1 Enterprises (500 or More Employees)
- 12.6.6.2 Mid-Market Firms (20–499 Employees)
- 12.6.6.3 Small Businesses (Fewer Than 20 Employees)
- 12.6.7 Subsegment Pricing and Adoption Trends
- 12.6.8 Leading Suppliers and Competition
- 12.6.9 Regional Demand and Opportunities
- 12.7 Segment Growth Comparison
- 12.8 Segment Attractiveness and Priority Matrix
Chapter 13 United States Digital Marketing Software End-Use and Application Market Outlook
- 13.1 End-Use Industry and Customer Demand Structure
- 13.2 Leading Applications and Customer Groups
- 13.3 End-Use Market Size, Share and Forecast
- 13.4 Major End-Use Industry Deep Dives
- 13.4.1 Customer Requirements and Use Cases
- 13.4.2 Demand and Replacement Cycles
- 13.4.3 Technical and Regulatory Considerations
- 13.4.4 Purchasing and Procurement Models
- 13.4.5 Leading Vendors and Distribution Channels
- 13.4.6 Forecast and Commercial Opportunities
- 13.5 Emerging Applications and Cross-Segment Demand
- 13.6 End-Use Industry Investment Priorities
Chapter 14 United States Digital Marketing Software Geographic Market Outlook, 2025-2035
- 14.1 Domestic Market Distribution and Demand Clusters
- 14.2 State- or Province-Wise Market Size and Forecast, 2025-2035
- 14.3 City and Metropolitan Market Outlook
- 14.4 Industrial, Manufacturing and Commercial Clusters
- 14.5 Geographic Concentration of Key End Users
- 14.6 Local Pricing and Purchasing Differences
- 14.7 Domestic Production Facilities and Capacity Map
- 14.8 Local Infrastructure and Project Pipeline
- 14.9 State-Level Policy and Incentive Differences
- 14.10 Subnational Investment Hotspots and Opportunities
- 14.11 Distribution and Logistics Networks
- 14.12 Domestic Competitive Footprint
Chapter 15 United States Digital Marketing Software Technology, Innovation and Sustainability Outlook
- 15.1 Technology Landscape and Maturity
- 15.2 Product, Process and Service Innovation
- 15.3 AI, Automation and Digital Tools in the Industry
- 15.4 Technology Adoption and Performance Benchmarking
- 15.5 Innovation Pipeline and R&D Investment
- 15.6 Patent and Intellectual Property Trends
- 15.7 Energy Efficiency and Resource Management
- 15.8 Sustainability, Recycling and Circularity
- 15.9 Technology Roadmap, 2025-2035
- 15.10 Risks of Obsolescence and Technology Substitution
Chapter 16 United States Digital Marketing Software Market Key Strategic Imperatives
- 16.1 Growth and Market Entry Priorities
- 16.2 High-Return Products and Segments
- 16.3 Pricing, Profitability and Cost Optimization
- 16.4 Technology Investment and Product Differentiation
- 16.5 Supply Chain Localization and Resilience
- 16.6 Distribution and Customer Acquisition
- 16.7 Partnership, Acquisition and Capacity Strategy
- 16.8 Regional Expansion Priorities
- 16.9 Short-, Medium- and Long-Term Actions
Chapter 17 Competition Outlook
- 17.1 Industry Competition Characteristics
- 17.2 Market Structure and Concentration
- 17.3 Market Share and Competitive Positioning, 2025
- 17.4 Company-Wise Revenue and Product Benchmarking
- 17.5 Production and Service Capacity Benchmarking
- 17.6 Technology, Pricing and Differentiation
- 17.7 Regional Footprint and Distribution Strength
- 17.8 Mergers, Acquisitions and Strategic Alliances
- 17.9 New Entrants and Competitive Threats
- 17.10 Porter's Five Forces and Industry Attractiveness
- 17.11 Competitive Outlook, 2025-2035
Chapter 18 Company Profiles
- 18.1 Company Coverage and Selection Criteria
- 18.2 Salesforce
- 18.2.1 Business Description
- 18.2.2 Company Ownership and Geographic Presence
- 18.2.3 Product and Service Portfolio
- 18.2.4 Manufacturing and Operating Footprint
- 18.2.5 Financial Performance and Investment
- 18.2.6 Market Share and Competitive Position
- 18.2.7 Technology and Innovation Capabilities
- 18.2.8 Strategic Alliances or Partnerships
- 18.2.9 Recent Developments
- 18.2.10 Growth Strategy and Outlook
- 18.3 Adobe
- 18.4 HubSpot
- 18.5 Google (Alphabet)
- 18.6 Oracle
- 18.7 Intuit (Mailchimp)
- 18.8 Klaviyo
- 18.9 Zeta Global
- 18.10 Braze
- 18.11 Sprout Social
- 18.12 Other Relevant Market Participants
Note: Every listed company is profiled on the structure shown under the first company. The company list is preliminary and may change based on research findings, market developments, data availability and client requirements.
Chapter 19 Disclaimer
- 19.1 Research and Forecast Disclaimer
- 19.2 Data Source and Estimation Limitations
Note: The depth of individual sections depends on data availability for this market. Volume, capacity, trade and other unit-based metrics are included where applicable.

