
Collaboration suites anchor spend as AI reshapes the stack
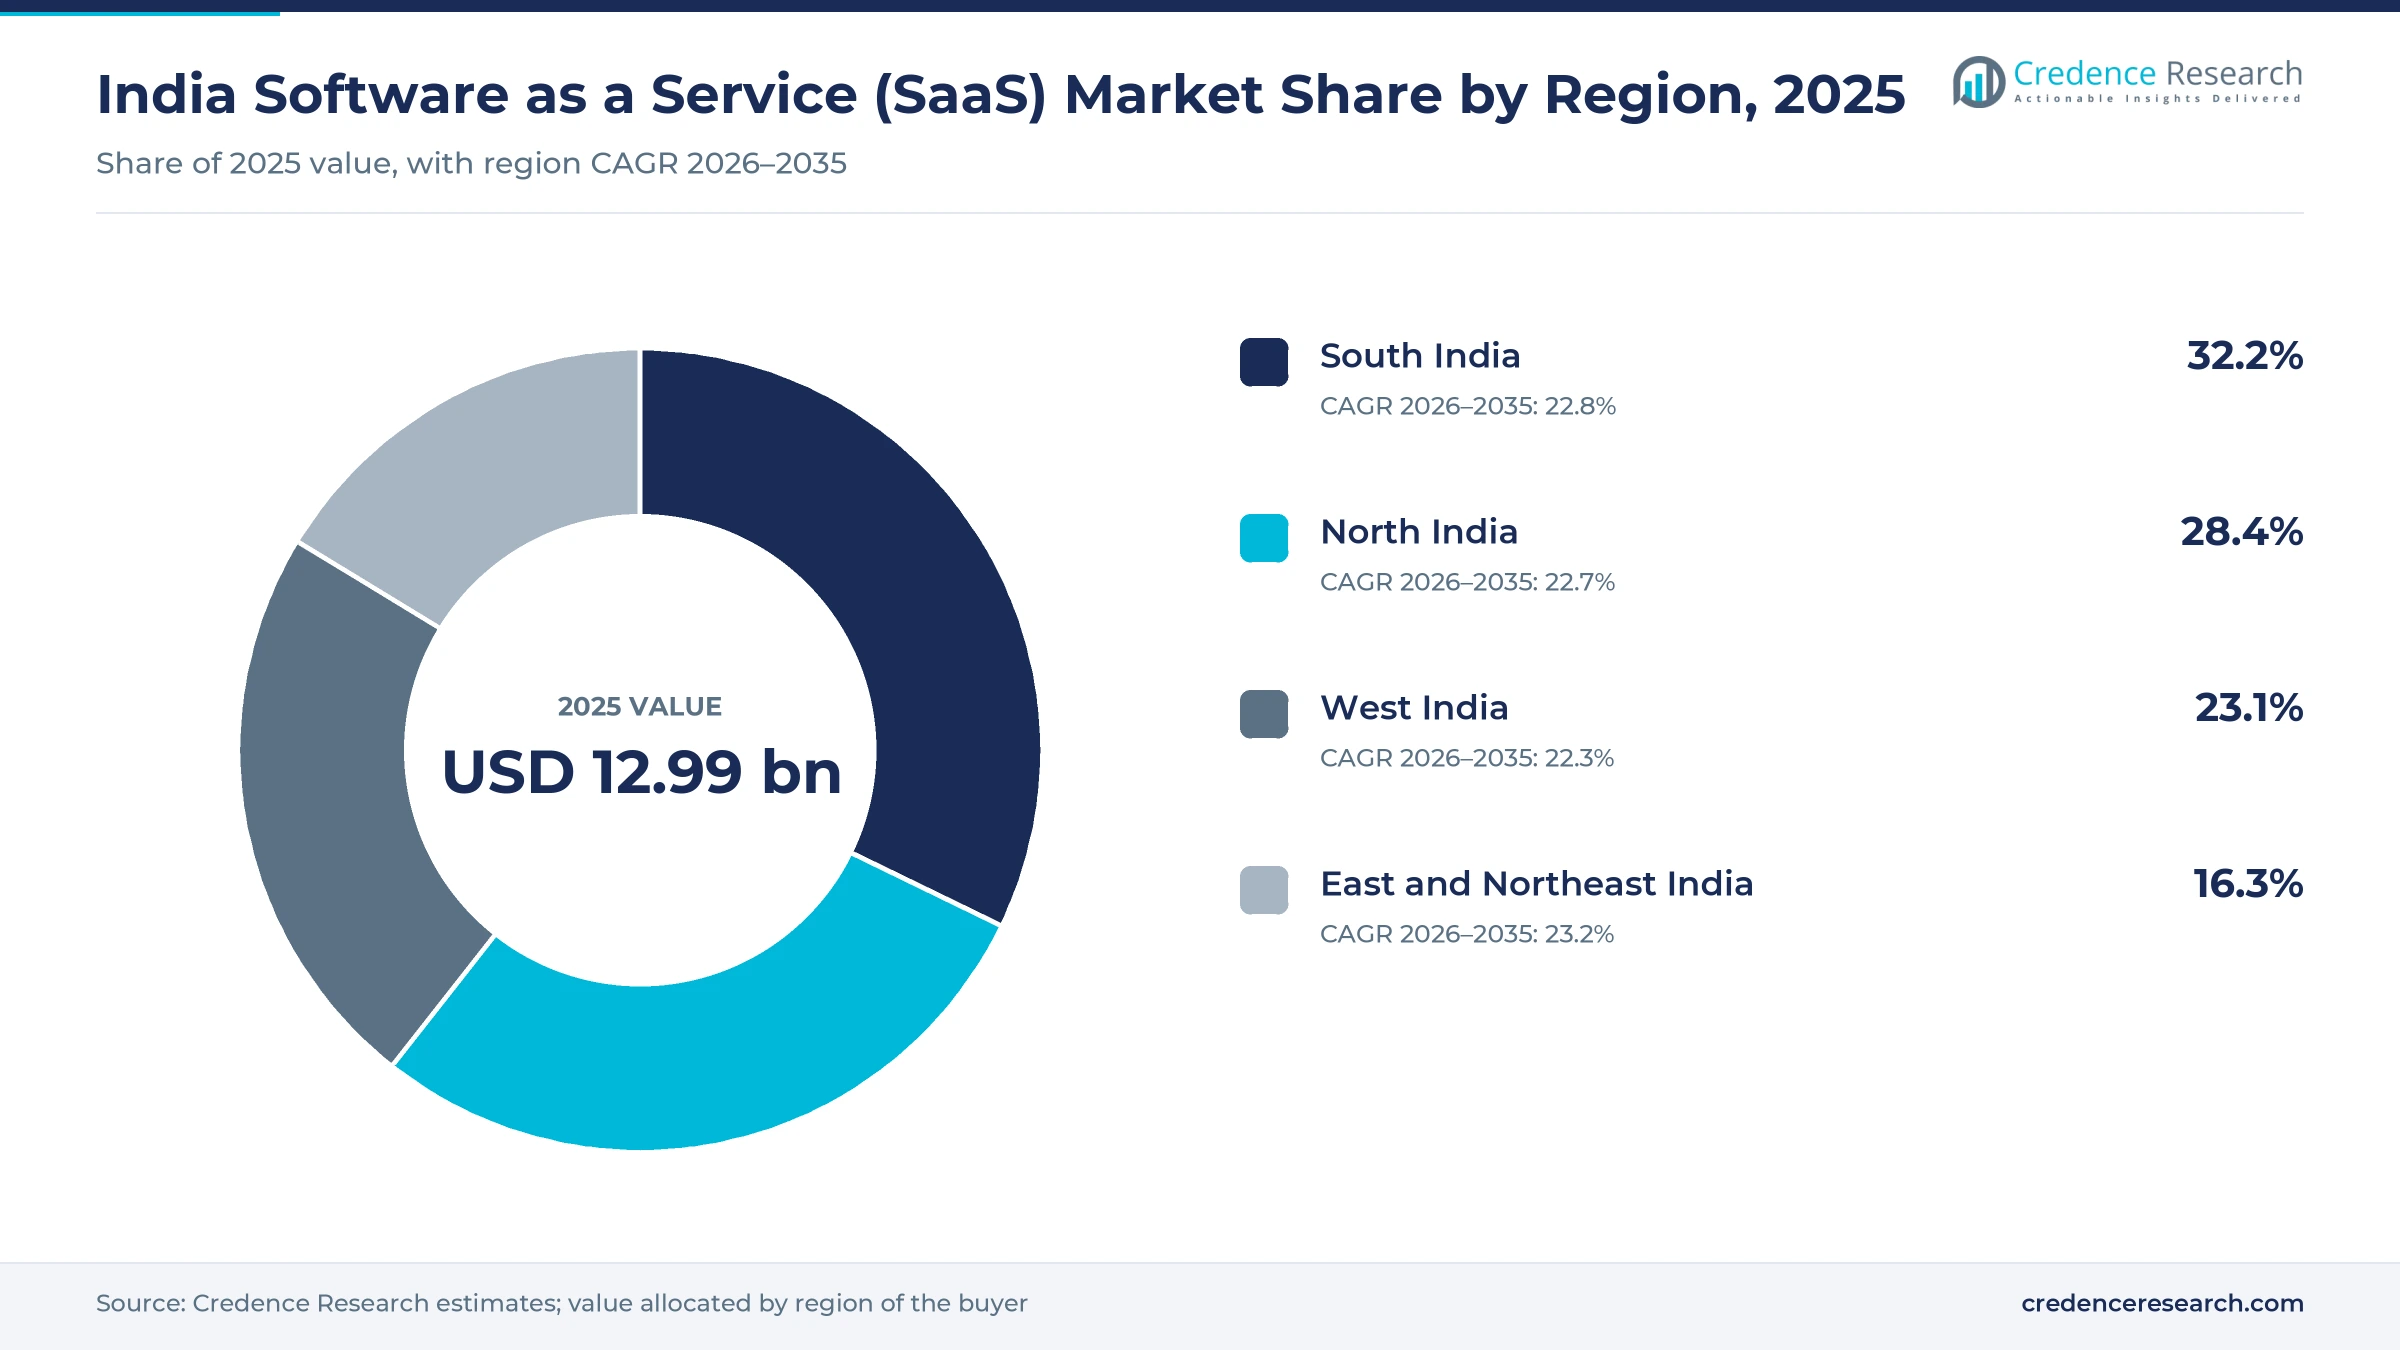
The India software as a service (SaaS) market was valued at USD 12.99 billion in 2025 and is projected to increase from USD 15.90 billion in 2026 to USD 100.44 billion by 2035, registering a CAGR of 22.73% during 2026–2035. Demand comes from banks, retailers and manufacturers moving customer, finance and workforce processes to subscriptions, from government departments adopting cloud email and office suites, and from millions of small firms buying their first accounting or billing tool. South India held the largest regional share, 32.2% in 2025, because Bengaluru, Chennai and Hyderabad host most product companies and their earliest enterprise buyers. East and Northeast India is the fastest-growing region at 23.2% a year as Kolkata and Bhubaneswar add delivery centers and state programs. The Digital Personal Data Protection Rules notified in November 2025 now push buyers toward vendors that host data inside the country.
Subscription business applications define the scope
The market counts subscription fees for business applications delivered over the internet to buyers in India, including CRM, ERP, human capital management, collaboration and productivity suites, analytics, IT service management and security tools. Buyers pay per user, per agent or by usage under monthly or annual plans, directly to vendors or through resellers and system integrators.
Infrastructure and platform cloud spending, one-time licenses for on-premises software, implementation and consulting fees, and software that Indian vendors sell to overseas buyers sit outside the count. The value chain runs from hyperscale data centers and cloud regions through application vendors, marketplaces and partners to enterprise, government and small-business subscribers.
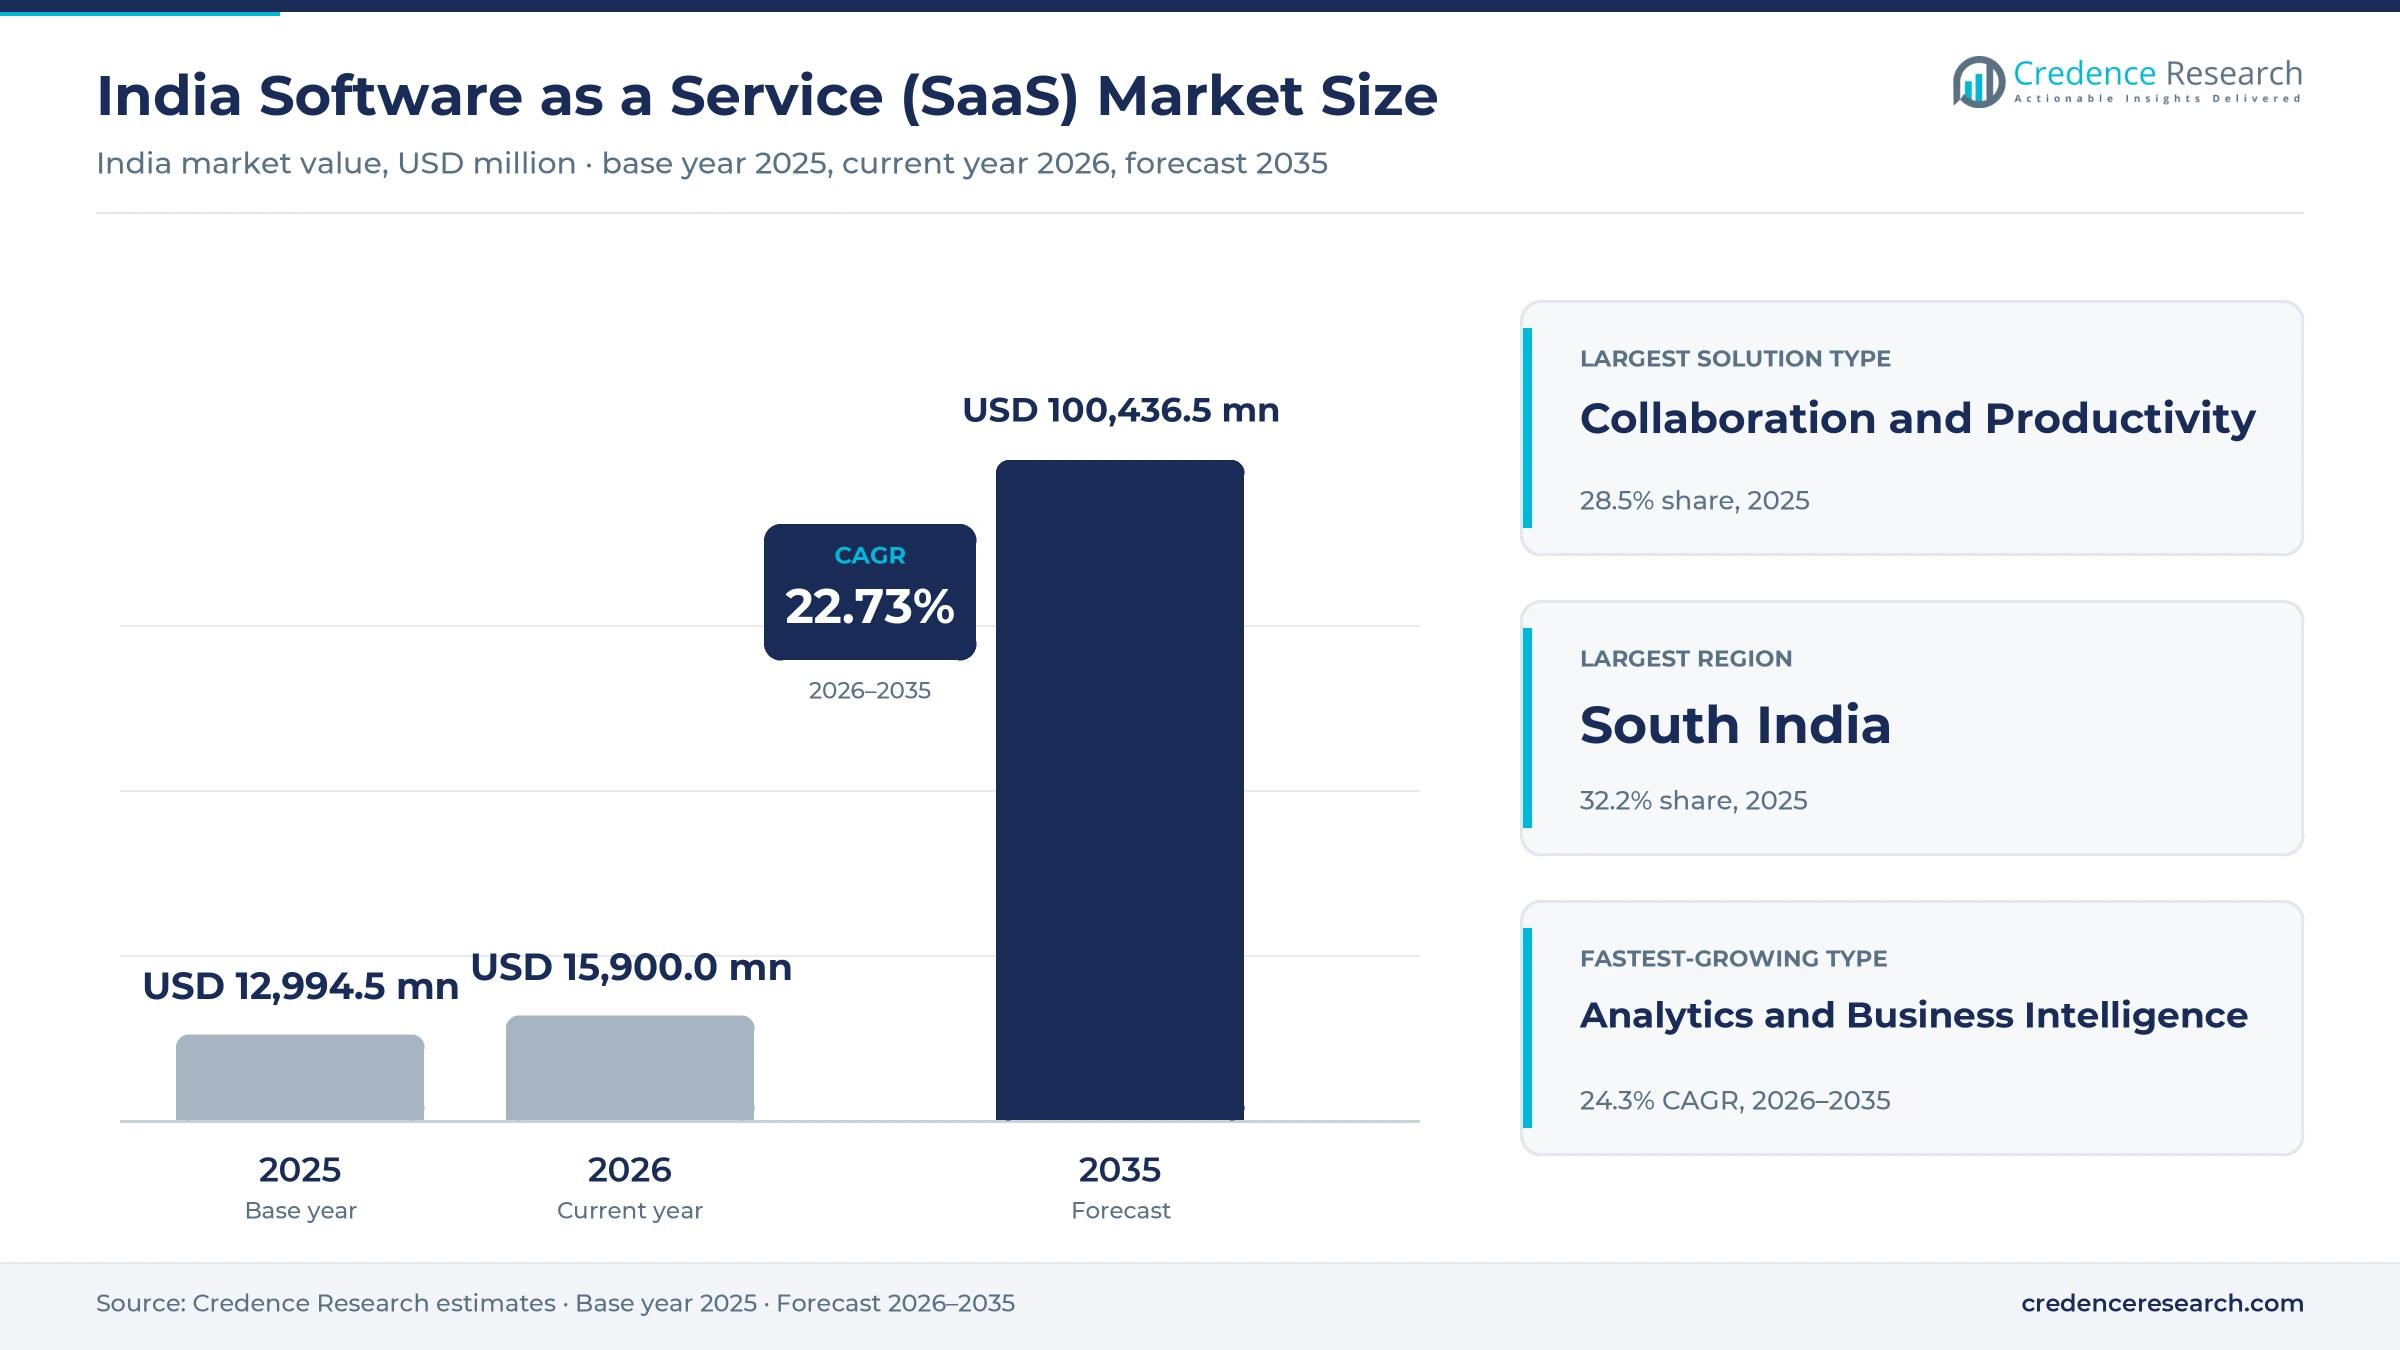
India Software as a Service (SaaS) Market Insights
- Subscription spending rises from USD 12.99 billion in 2025 to USD 100.44 billion by 2035, a 22.73% CAGR, as cloud regions, AI features and small-business adoption expand together.
- South India held 32.2% of 2025 value, supported by the product hubs of Bengaluru, Chennai and Hyderabad and their large enterprise buyers.
- Collaboration and Productivity accounted for 28.5% of 2025 value, while Public Cloud SaaS carried 68.5% of subscriptions, reflecting how mail and documents move to the cloud first.
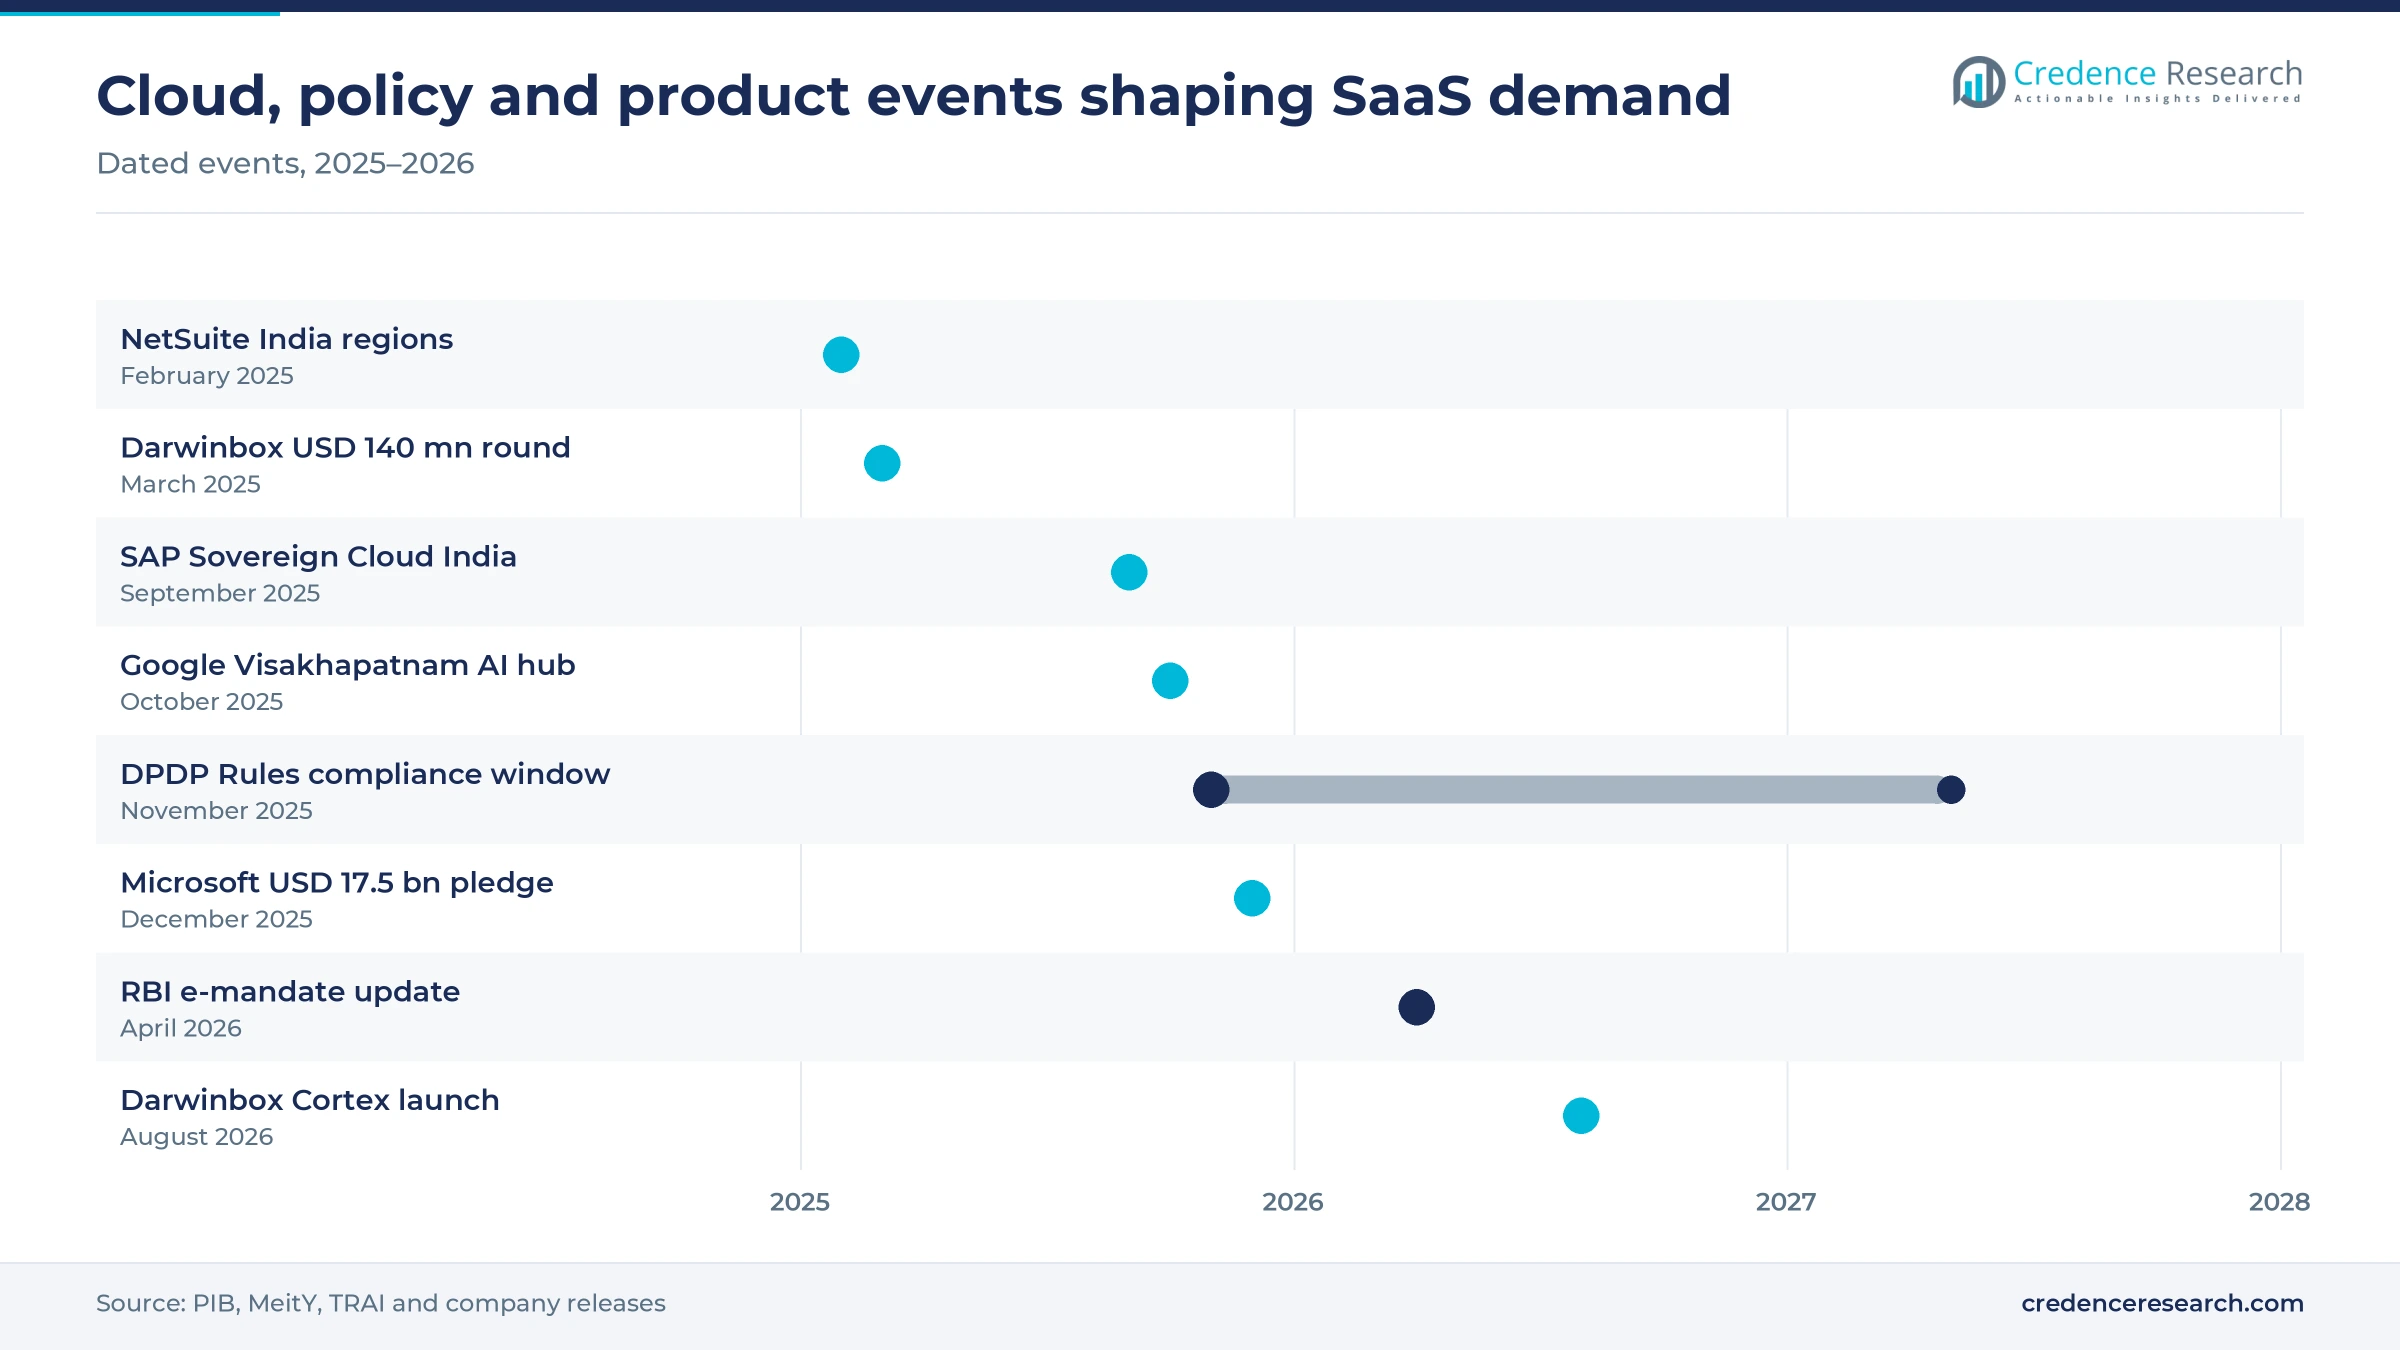
- The Digital Personal Data Protection Rules, notified on Nov. 14, 2025, give data fiduciaries 18 months to comply, turning hosting location into a purchase criterion.
- Microsoft pledged USD 17.5 billion for Indian cloud and AI infrastructure in December 2025, while Google committed about USD 15 billion to a Visakhapatnam AI hub.
Collaboration leads while analytics grows fastest
Why do collaboration suites lead SaaS spending in India?
Based on solution type, the market is categorized into customer relationship management, enterprise resource planning, human capital management, collaboration and productivity, and analytics and business intelligence. Collaboration and Productivity led with 28.5% of 2025 value because mail, documents and meetings are the first workloads every organization moves, and the National Informatics Centre shifted about 12.68 lakh central government accounts to a Zoho cloud email platform, the Minister of State for Electronics and IT told Parliament in December 2025. Analytics and business intelligence grows fastest at 24.3% a year as the IndiaAI Mission had onboarded more than 38,000 GPUs for startups and academia by March 2026, according to the Ministry of Electronics and IT.
How do Indian buyers choose between public, private and hybrid SaaS?
Based on deployment model, the market is categorized into public cloud SaaS, private hosted SaaS and hybrid SaaS. Public Cloud SaaS led with 68.5% of 2025 value because multitenant suites run close to buyers, and Oracle NetSuite began provisioning new Indian customers in its Mumbai and Hyderabad cloud regions in February 2025, Oracle said. Private hosted SaaS grows fastest at 24.0% a year as SAP launched its Sovereign Cloud in India on Sept. 19, 2025, with an on-site option hosted in the customer's own data center for government and regulated buyers.
Which industries buy the most SaaS in India?
Based on end-use industry, the market is categorized into BFSI, IT and telecom, retail and e-commerce, manufacturing and healthcare and life sciences. BFSI led with 26.5% of 2025 value because banks, insurers and fintech lenders buy CRM, workflow and compliance tools, and ServiceNow opened Mumbai and Bengaluru data centers in April 2022 so financial firms could use its platform locally. Retail and e-commerce grows fastest at 23.7% a year as Amazon said in December 2025 that it aims to quadruple e-commerce exports enabled from India to USD 80 billion by 2030, which adds sellers that need listing, inventory and invoicing subscriptions.
How does enterprise size split SaaS spending?
Based on enterprise size, the market is categorized into micro and small businesses, mid-market enterprises, large enterprises and digital-native startups. Large Enterprises led with 40.0% of 2025 value because conglomerates and airlines sign multi-suite contracts, and Salesforce named Air India, Tata Play and Tata Consumer Products among its Indian clients in November 2025. Micro and small businesses grow fastest at 24.1% a year as only 29% of digitally active small retailers used accounting software in the PayNearby MSME Digital Index 2024, which leaves a large base still to convert.
| Segment Group | Leading Sub-segment | Share, 2025 | Fastest-growing Sub-segment | CAGR, 2026–2035 |
|---|---|---|---|---|
| By Solution Type | Collaboration and Productivity | 28.5% | Analytics and Business Intelligence | 24.3% |
| By Deployment Model | Public Cloud SaaS | 68.5% | Private Hosted SaaS | 24.0% |
| By End-Use Industry | BFSI | 26.5% | Retail and E-Commerce | 23.7% |
| By Enterprise Size | Large Enterprises | 40.0% | Micro and Small Businesses | 24.1% |
Per-user rupee tiers set the SaaS trade-up path
SaaS pricing in India works per user or per agent per month, with annual billing about 17% cheaper than monthly in the Freshdesk listing below and 18% GST added on top. Zoho lists CRM at Rs 800 a user for its Standard edition and Rs 2,400 for Enterprise, billed annually, Business Today reported in September 2025. Domestic vendors price in rupees, while global suites track U.S. dollar list prices, so currency moves and global increases pass straight to Indian buyers. Margins sit in higher tiers, where AI assistants, analytics and sandboxes are bundled, which is why vendors push buyers up the ladder.
| Offer or plan | Typical price or fee | Basis |
|---|---|---|
| Zoho CRM Standard, per user, billed annually | Rs 800 | Business Today, September 2025 |
| Zoho CRM Enterprise with Zia AI, per user, billed annually | Rs 2,400 | Business Today, September 2025 |
| Freshdesk Growth, per agent per month | Rs 1,499 billed annually, Rs 1,799 monthly, plus 18% GST | itforsme.in reseller listing, 2026 |
| Microsoft 365 Business Basic, per user per month | USD 7 from July 1, 2026 (up 16.7%) | Digit, December 2025 |
| Microsoft 365 Business Standard, per user per month | USD 14 from July 1, 2026 (up 12%) | Digit, December 2025 |
Request a Free Sample
Fill in your details and we'll send you a free sample report.
- Sample data tables & charts
- Research methodology
Cloud regions, AI suites and MSME onboarding lift demand
Public cloud scale and broadband reach widen the buyer base
In-country cloud regions and cheap mobile data now let a shop in a tier-3 town run the same billing or CRM tool as a Mumbai bank. India had 1,065.88 million broadband subscribers on March 31, 2026, the Telecom Regulatory Authority of India reported. Microsoft said in December 2025 that it would spend USD 17.5 billion on Indian cloud and AI infrastructure over four years, with its Hyderabad region due to go live in mid-2026. Google committed about USD 15 billion for 2026 to 2030 to a Visakhapatnam AI hub built with AdaniConneX and Airtel, adding to the hyperscale data center capacity that SaaS vendors rent. Lower latency and local hosting cut the cost of serving smaller cities, which is where the next subscribers come from.
Enterprise AI adoption and SaaS rebundling raise spend per seat
Generative AI is moving from pilots into the suites that Indian enterprises already license, which raises the value of each seat rather than only the seat count. Salesforce said in November 2025 that Agentforce adoption in India was moving from pilots to full deployments, citing Air India and Bandhan Bank among clients. Its Trailblazer learning community in India has more than 3.9 million members, which gives buyers a ready pool of administrators for new AI features. Adobe offers Adobe Express in 8 Indian languages and said in May 2025 that it would add 1 million localized templates for Indian creators. Vendors now price AI agents and copilots as add-ons or bundle them into higher tiers, so buyers that adopt them move up the price ladder.
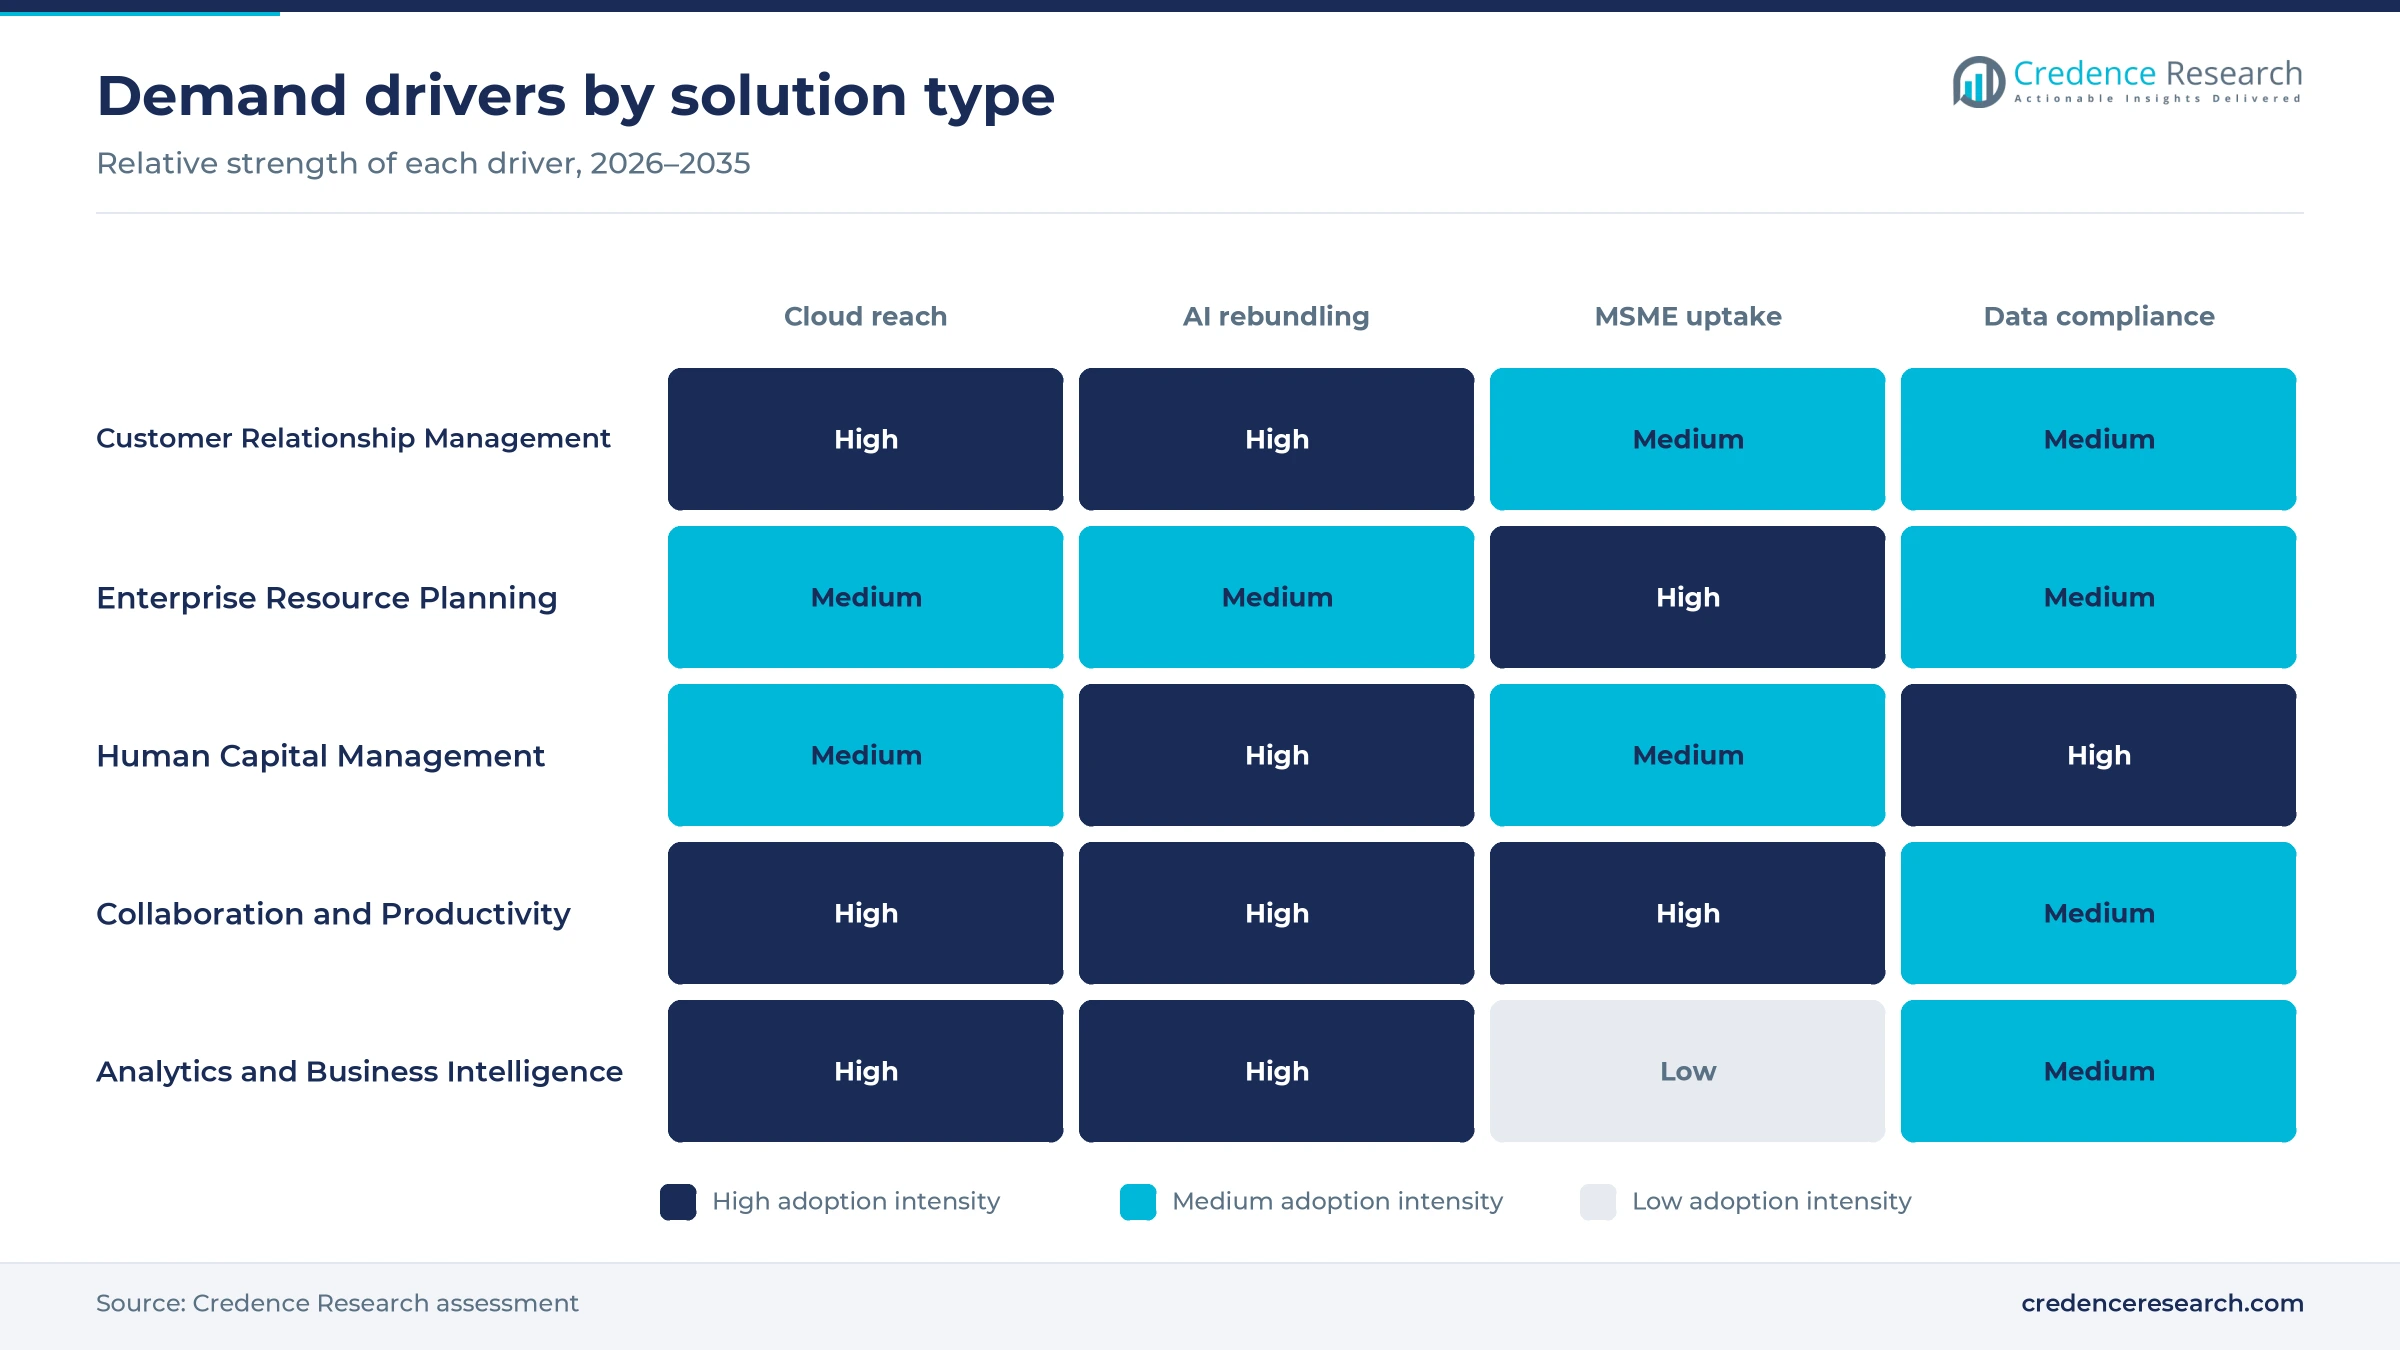
MSME and startup digitization adds millions of first-time buyers
India's small-business base is formalizing quickly, and each registered firm needs invoicing, payroll and GST tools that are cheapest to buy as subscriptions. Registrations on the Udyam portal and Udyam Assist platform crossed 8.7 crore by June 2026, the Ministry of MSME said. DPIIT recognized more than 55,200 startups in FY26, a record, taking the total past 2.23 lakh by March 31, 2026, Inc42 reported. The Reserve Bank of India rules reported by Business Today in April 2026 let recurring e-mandates up to Rs 15,000 run without a fresh OTP, which suits monthly SaaS billing. Micro and small businesses, at 24.1% a year, are the fastest size band as these firms adopt their first tools.
Data protection rules and cyber risk turn governance into a purchase
Compliance has become a reason to buy SaaS, because vendors now ship consent, breach-reporting and audit features that most Indian firms cannot build themselves. The Digital Personal Data Protection Rules were notified on Nov. 14, 2025, with an 18-month phased compliance window, and penalties reach Rs 250 crore for weak security safeguards, the Press Information Bureau said. CERT-In handled more than 29.44 lakh cyber incidents in 2025 and issued 1,530 alerts, according to a government statement reported by IANS in January 2026. Security and compliance applications, identity tools and ITSM therefore gain budget, and vendors with Indian hosting win shortlists in banking and government.
Sovereign hosting and AI-native rebuilds reshape choice
Shift toward in-country and sovereign SaaS hosting
Buyers in government, banking and healthcare increasingly ask where data sits before they ask about features, and vendors are responding with Indian hosting. SAP's Sovereign Cloud in India, launched in September 2025 and noted in the deployment segment above, is designed to comply with the National Information Security Policy and Guidelines. Microsoft made its Sovereign Public Cloud available from its Indian regions in December 2025 and said its Hyderabad region will open with 3 availability zones. Private hosted SaaS, at 24.0% a year, is the fastest deployment model, and vendors without Indian regions risk losing regulated tenders.
Rise of AI-native rebuilds by Indian vendors
Indian SaaS vendors are rebuilding core products around AI agents, which changes how they compete with larger global suites. Darwinbox launched Cortex, an AI-native platform for human capital management, on Aug. 4, 2026, and said it serves more than 1,400 enterprises and 4.5 million employees. Freshworks unveiled Freddy AI Agent Studio, a no-code tool to build and deploy service agents, at its Refresh event in June 2025. Zoho founder Sridhar Vembu said in January 2026 that the company had paused new regional projects for about 1.5 years to focus on AI before resuming expansion. Indian vendors that ship agents at rupee prices can win mid-market accounts from global suites.
Opportunity in government and public sector SaaS
Public sector demand is opening to domestic and sovereign cloud suppliers, and the central government email migration noted above shows the scale. The National Informatics Centre selected Zoho as master system integrator through GeM after proof-of-concept trials, with STQC and C-DAC security audits completed in May 2024 and August 2025. The contract keeps primary and disaster-recovery data centers in India and bars replication abroad, a template that later departments can follow. Odisha's Global Capability Centre Policy 2025 targets at least five hubs and over 50,000 jobs across three regions, including Bhubaneswar and Cuttack, widening public digital demand in the east. Vendors with audited Indian hosting and GeM listings are best placed for this demand.
Opportunity in vernacular, mobile-first tools for small firms
Most of India's next SaaS buyers work on phones and prefer local languages, so vendors that localize gain users that English-only tools miss. Individuals using the internet reached 70% of India's population in 2025, World Bank data show. English was the preferred language of only 52% of small retailers surveyed in the PayNearby MSME Digital Index 2024, followed by Hindi at 21%, and WhatsApp use reached 97%. The Ministry of MSME also made the PMEGP application available in 19 regional languages from June 2025. Low-priced, phone-first accounting, billing and CRM apps in Indian languages could turn these users into paying subscribers.
Price-sensitive buyers and dollar prices squeeze growth
Price sensitivity slows small-business conversion
Small buyers still weigh every rupee, because 18% of MSME owners cited the high cost of implementation and 36% cited resistance to new technology in the PayNearby MSME Digital Index 2024. Over half of the surveyed retailers spent less than Rs 500 a month on internet access, which caps what they will pay for software. Vendors respond with free tiers and annual discounts, which lowers revenue per account and lengthens payback on acquisition costs.
Dollar-linked list price rises squeeze budgets
Global suites priced in U.S. dollars are getting dearer, because Microsoft raised Microsoft 365 Business Basic to USD 7 a user a month on July 1, 2026, a 16.7% increase, Digit reported. Business Standard rose 12% to USD 14 in the same move, and any rupee depreciation adds to the cost for Indian buyers. Finance teams react by trimming licenses and consolidating tools, which slows seat growth for global vendors and opens room for rupee-priced rivals.
Compliance deadlines raise costs for smaller vendors
Smaller SaaS vendors face new fixed costs, because the DPDP Rules require breach notices to every affected person and answers to access or erasure requests within 90 days. Significant data fiduciaries must also run independent audits and impact assessments, and penalties for not reporting a breach reach Rs 200 crore. Startups without compliance teams must buy tools or partners to meet these duties, which raises their costs before revenue scales.
AI disruption threatens seat-based revenue models
AI agents that resolve tickets or process claims reduce the number of human users a buyer needs, which threatens per-seat pricing, as the agent tools from Freshworks and the AI-led pause at Zoho described above show. Darwinbox's Cortex platform, described above, is also built around agents, so the shift is reaching HR software as well as service desks. With 4.5 million employees on Darwinbox alone, even a small cut in seats per account would weigh on HR software revenue. Vendors that move toward usage or outcome pricing risk losing predictable recurring revenue during the transition.
South India leads as eastern states add delivery capacity
| Region | Value, 2025 (USD billion) | Share, 2025 | CAGR, 2026–2035 |
|---|---|---|---|
| South India | 4.18 | 32.2% | 22.8% |
| North India | 3.69 | 28.4% | 22.7% |
| West India | 3.00 | 23.1% | 22.3% |
| East and Northeast India | 2.12 | 16.3% | 23.2% |
South India leads on product hubs and early adopters
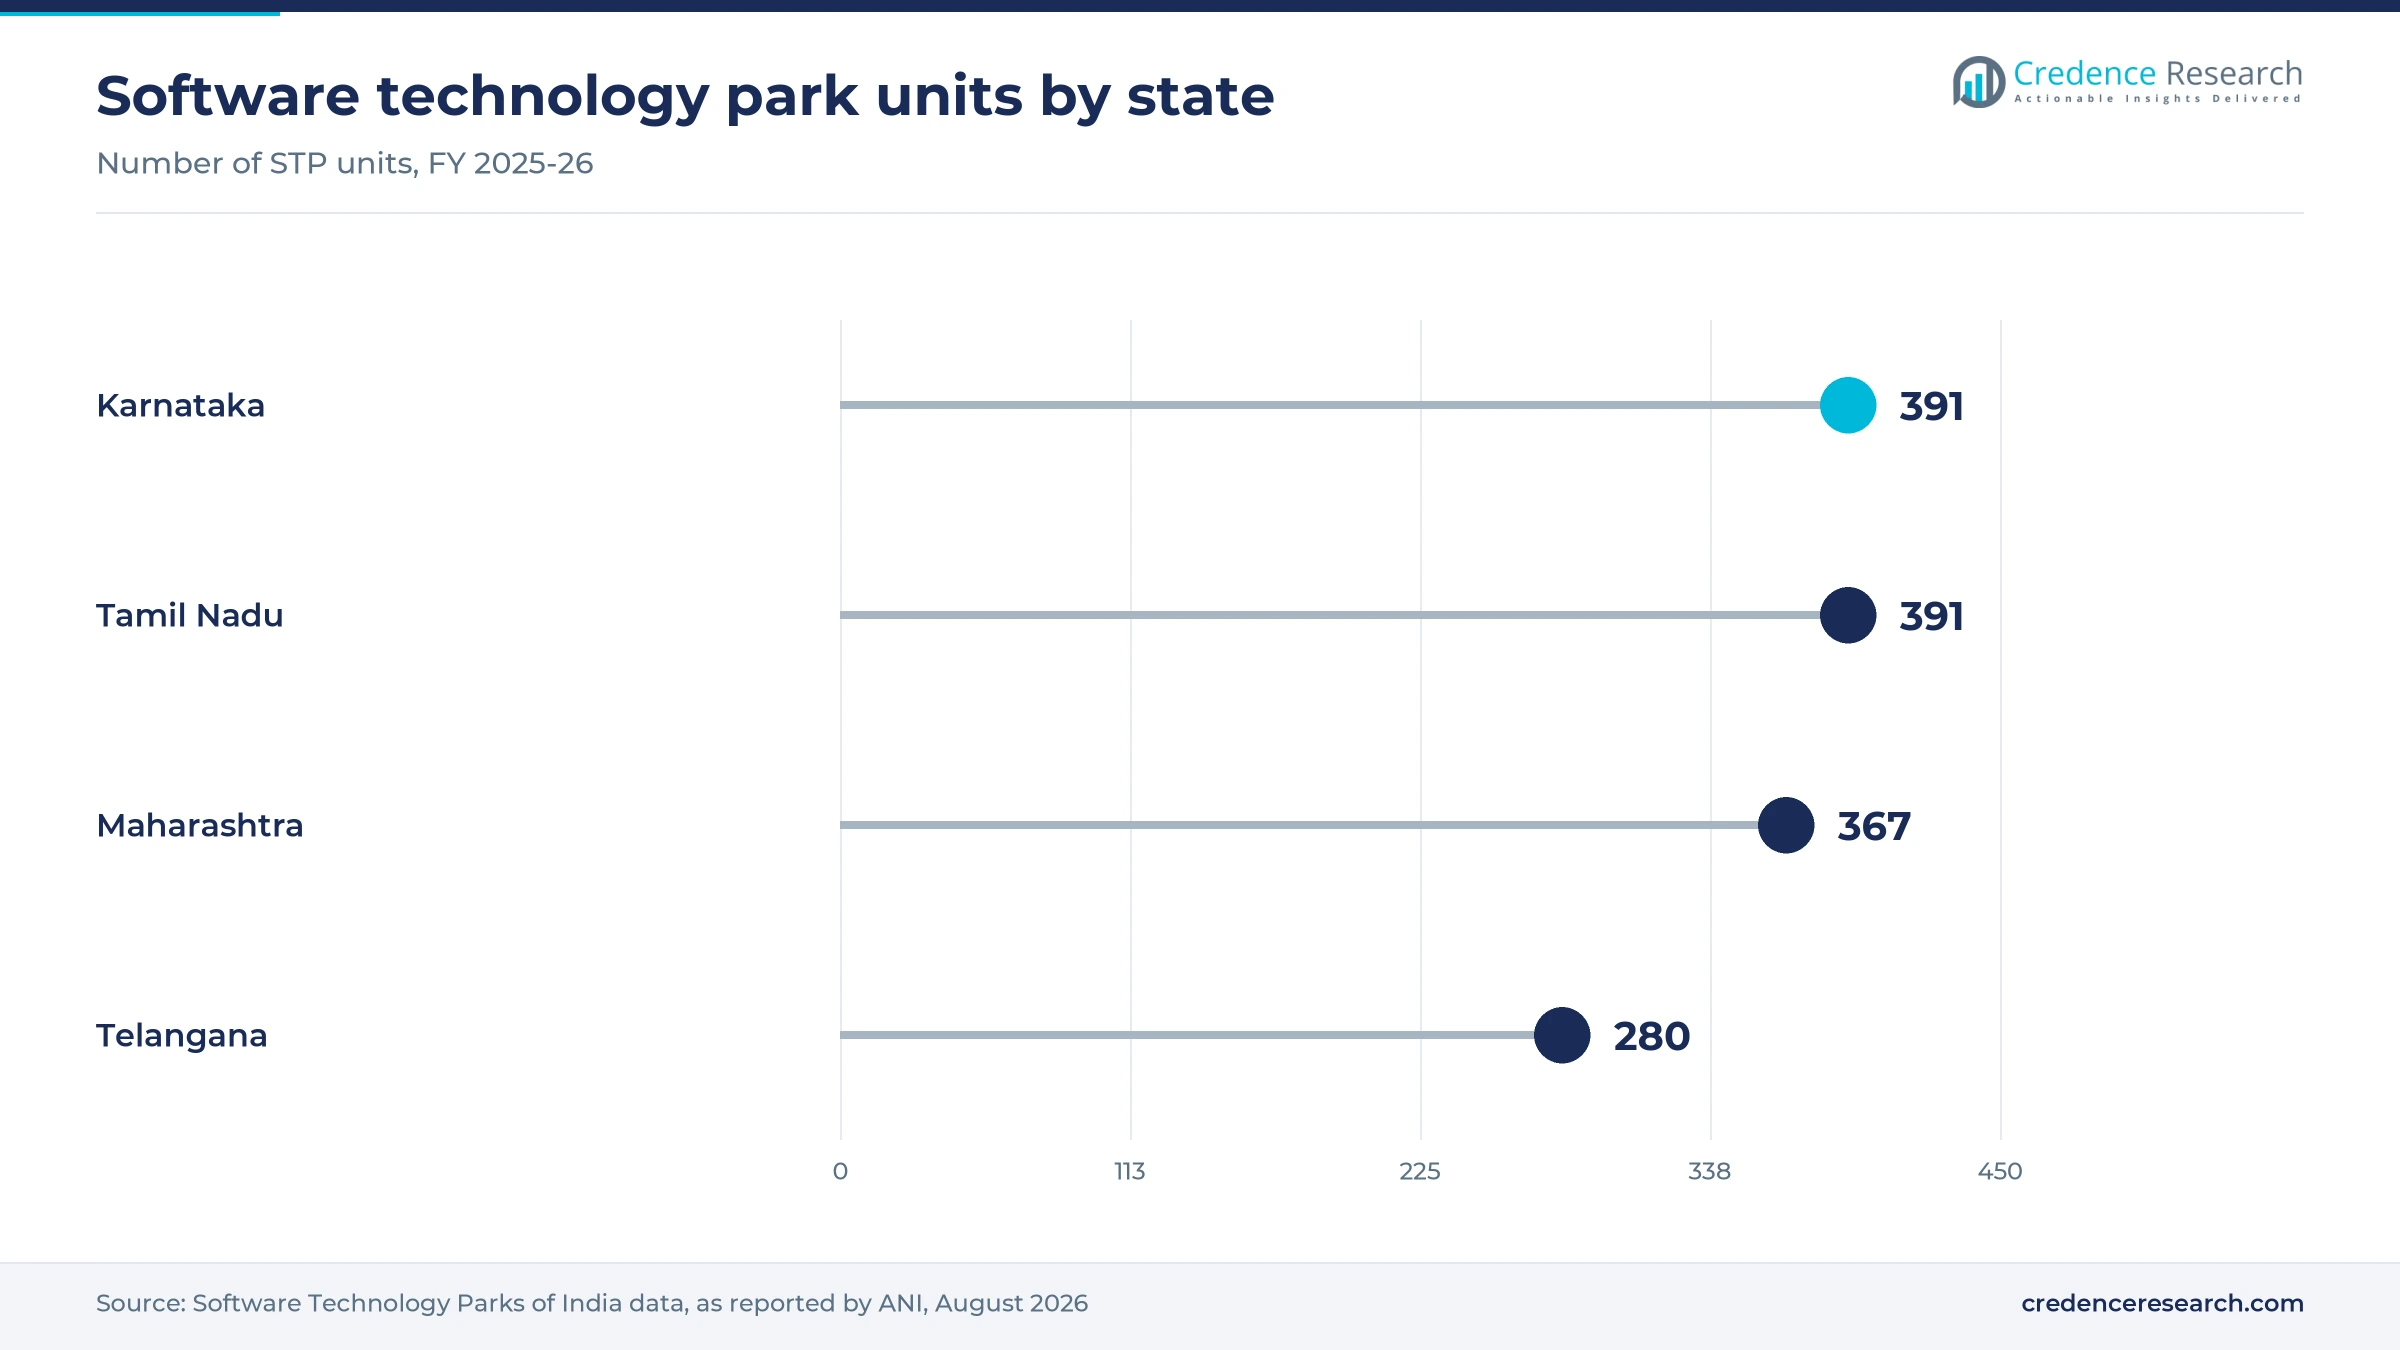
South India held 32.2% of 2025 value and grows at 22.8% a year. Karnataka and Tamil Nadu each had 391 software technology park units in FY26, the most in the country, according to STPI data reported by ANI in August 2026. Zoho, Freshworks and Darwinbox are rooted in Chennai and Hyderabad, and Google's Visakhapatnam hub adds capacity in Andhra Pradesh. Dense buyer and vendor networks let new tools find early customers here before spreading nationally.
North India rests on government and large enterprise demand
North India held 28.4% of 2025 value and grows at 22.7% a year. Central ministries in New Delhi drive the largest public sector contracts, including the NIC email migration covered above. Zoho said in January 2026 that it would expand in Uttar Pradesh under its hub-and-spoke model, which brings vendor presence closer to the state's large MSME base. Large employers across the National Capital Region add steady demand for HR and finance subscriptions, while most small firms in the northern states remain unconverted.
West India draws on financial services buyers
West India held 23.1% of 2025 value and grows at 22.3% a year. Mumbai hosts the headquarters of many banks, insurers and brokers, and Maharashtra had 367 software technology park units in FY26. AWS, Oracle and ServiceNow all run Mumbai hosting, which suits regulated buyers that need local data residency. Growth here is steadier than in the east because large financial buyers already use cloud suites and now expand within them.
Kolkata and Odisha capability centers lift eastern demand
East and Northeast India is the fastest-growing region at 23.2% a year and held 16.3% of 2025 value. LTM inaugurated a New Town campus in Kolkata on Aug. 27, 2026, for about 5,800 engineers working on AI, data and cloud, and the state allotted 10 more acres for a data center. The Odisha government's GCC policy adds hubs in Bhubaneswar and Cuttack, so demand for business software should broaden as these centers fill.
Hyperscaler pledges and sovereign launches mark 2025-2026
| Development | Status and market relevance |
|---|---|
| In February 2025, Oracle NetSuite opened data centers in its Mumbai and Hyderabad cloud regions for Indian customers. | Live, new customers provisioned in India |
| In March 2025, Darwinbox raised USD 140 million in a round co-led by Partners Group and KKR. | Closed, funds for product and global growth |
| In September 2025, SAP launched SAP Sovereign Cloud in India with on-site and AWS-based options. | Available to government and regulated buyers |
| In December 2025, Microsoft announced a USD 17.5 billion investment in Indian cloud and AI infrastructure. | Hyderabad region due mid-2026 |
| In August 2026, Darwinbox launched Cortex, an AI-native HCM platform, with pilot customers. | In pilot with Microsoft, Slack and Glean as partners |
Agents, sovereign hosting and analytics decide suite value
- AI agents resolve tickets, update payroll records and process claims inside CRM, ITSM and HCM suites, which shifts value from seats to outcomes.
- Sovereign and in-country hosting keeps primary and disaster-recovery copies of data inside India, a condition in government and many banking contracts.
- Embedded analytics brings business intelligence and analytics into operational screens, so managers act on data without exporting it.
- Vernacular and mobile interfaces let small firms run billing, inventory and customer follow-ups in their own language on a phone.
Need a Custom Version of This Report?
Tailor the scope, geography, or segments to your exact requirements.
- Custom geography or segment scope
- Direct access to our analyst team
Global suites face Indian challengers on price and fit
Competition in the India software as a service (SaaS) market turns on suite breadth, rupee pricing, local hosting and AI features rather than on brand alone. Microsoft and Google lead collaboration and productivity, while Salesforce is a leading CRM supplier to large accounts. SAP and Oracle hold ERP accounts and now add sovereign or in-country hosting to keep regulated buyers. ServiceNow sells IT and employee workflows to banks and technology firms from Indian data centers. Zoho competes across CRM, finance and office suites at rupee prices and won the central government email contract. Freshworks sells customer service and IT service tools to mid-market firms, and Darwinbox serves large Indian employers in HCM. Adobe sells creative and document subscriptions and has localized Adobe Express in eight Indian languages.
Global suites, Indian challengers and a long vertical tail
Supply in the India software as a service (SaaS) market is organized in three tiers. Microsoft, Google, Salesforce, SAP, Oracle, ServiceNow and Adobe sell broad suites to large enterprises through direct teams and system integrators. Zoho, Freshworks and Darwinbox compete on rupee pricing, local support and faster product cycles, mostly in the mid-market. A long tail of vertical vendors serves clinics, schools, retailers and lenders. Entry is easy for point tools but hard in ERP and CRM systems, where switching costs and integrations protect incumbents, so margins sit with suite owners.
Leading SaaS vendors serving Indian buyers
| Company | Type | Role in the market |
|---|---|---|
| Microsoft | Global suite vendor | Sells Microsoft 365, Dynamics 365 and Copilot from Indian Azure regions |
| Salesforce | CRM leader | Sells Sales Cloud, Service Cloud and Agentforce to large Indian enterprises |
| Oracle | ERP and database vendor | Sells Fusion applications and NetSuite from its Mumbai and Hyderabad regions |
| SAP | ERP leader | Sells RISE with SAP and SAP Sovereign Cloud to Indian enterprises and government |
| Zoho Corporation | Indian suite vendor | Sells CRM, Books, Workplace and mail at rupee prices, incl. NIC email |
| Freshworks | Service software specialist | Sells Freshdesk, Freshservice and Freddy AI agents to mid-market firms |
| ServiceNow | Workflow platform | Sells IT, employee and customer workflows from Mumbai and Bengaluru data centers |
| Adobe | Creative and document vendor | Sells Creative Cloud, Adobe Express and Document Cloud subscriptions in India |
| Google (Alphabet) | Collaboration suite vendor | Sells Google Workspace and AI tools to Indian businesses and schools |
| Darwinbox | HCM specialist | Sells AI-native HR and payroll software to large Indian employers |
Small-firm conversion, not seat inflation, decides growth
Credence Research's view is that India's SaaS growth over the next decade will depend more on converting small firms and public bodies than on raising prices for large enterprises. Large buyers already license broad suites and are trimming seats as dollar prices rise, while millions of registered small firms still keep accounts manually. Data protection rules and sovereign hosting favor vendors with Indian regions and audits. Suppliers that combine rupee pricing, local-language interfaces, in-country hosting and AI agents priced by outcome should take most of the gain, while seat-only models face pressure.
Software spend and seat counts anchor the estimate
The report uses 2025 as the base year and forecasts to 2035. Market values come from the Credence Research model, built top-down from industry estimates of domestic software spending and the share sold as subscriptions, then checked against public seat counts, vendor announcements and published list prices. Regional, segment and size splits are Credence Research estimates based on software technology park units, cloud region locations, enterprise headquarters and small-business registrations. Sources include regulator and ministry releases, Press Information Bureau documents, World Bank data, company announcements and trade press. The analysts conducted no interviews or surveys for this edition of the report.
Analytics, small firms and the east carry growth to 2035
The India software as a service (SaaS) market is set to grow from USD 15.90 billion in 2026 to USD 100.44 billion by 2035, a 22.73% CAGR. Analytics and business intelligence will be the fastest solution type as AI features spread across suites, and micro and small businesses will be the fastest size band as Udyam-registered firms adopt their first tools. Private hosted SaaS should gain share as DPDP compliance matures, and East and Northeast India will close part of the gap with the south. Over the forecast period, vendors with rupee pricing and Indian hosting will be best placed.
Small-firm conversion and AI pricing decide the range of outcomes
In the base case, subscriptions grow along the central forecast as cloud regions open, DPDP compliance lifts governance spending and small firms adopt their first tools. The downside case assumes weak small-business conversion, sharp license trimming after dollar price rises and AI agents that cut seats faster than usage pricing replaces them. The upside case adds faster government cloud procurement and wide take-up of vernacular, phone-first tools.
| Scenario | CAGR, 2026–2035 | Value, 2035 | What has to hold |
|---|---|---|---|
| Downside | 18.0% | USD 70.52 billion | Small-firm conversion and seat growth track the narrower cloud-application pace of 17–18% a year |
| Base | 22.73% | USD 100.44 billion | Cloud regions open on schedule and DPDP compliance lifts governance spending |
| Upside | 24.2% | USD 112.06 billion | Government cloud buying and vernacular tools speed small-firm conversion |
Frequently Asked Questions
How big is the India software as a service (SaaS) market?
Which solution type leads the market?
Which solution type grows fastest?
Which region leads the India SaaS market?
How do the DPDP Rules affect SaaS buying?
How is SaaS priced in India?
Who are the leading companies in the market?
What are the main challenges for SaaS vendors?
Table of Content
Chapter 1 Market Segmentation
- 1.1 Segmentation Framework
- 1.1.1 Product and Service Classification
- 1.1.2 Application and End-Use Classification
- 1.1.3 Technology and Solution Classification
- 1.1.4 Customer and Distribution Channel Classification
- 1.1.5 Geographic Segmentation
- 1.1.6 Market Segment Definitions and Boundaries
- 1.2 By Solution Type
- 1.2.1 Customer Relationship Management
- 1.2.2 Enterprise Resource Planning
- 1.2.3 Human Capital Management
- 1.2.4 Collaboration and Productivity
- 1.2.5 Analytics and Business Intelligence
- 1.3 By Deployment Model
- 1.3.1 Public Cloud SaaS
- 1.3.2 Private Hosted SaaS
- 1.3.3 Hybrid SaaS
- 1.4 By End-Use Industry
- 1.4.1 BFSI
- 1.4.2 IT and Telecom
- 1.4.3 Retail and E-Commerce
- 1.4.4 Manufacturing
- 1.4.5 Healthcare and Life Sciences
- 1.5 By Enterprise Size
- 1.5.1 Micro and Small Businesses
- 1.5.2 Mid-Market Enterprises
- 1.5.3 Large Enterprises
- 1.5.4 Digital-Native Startups
Chapter 2 Introduction
- 2.1 Report Objectives and Scope
- 2.2 Product Definition and Industry Terminology
- 2.3 Market Inclusions and Exclusions
- 2.4 Research Process
- 2.4.1 Primary Research and Expert Interviews
- 2.4.2 Secondary Research and Source Review
- 2.4.3 Top-Down and Bottom-Up Estimation
- 2.4.4 Data Triangulation and Verification
- 2.5 Market Size Measurement Basis
- 2.5.1 2025: USD 12.99 billion → 2035: USD 100.44 billion
- 2.6 Historical and Forecast Reference Periods
- 2.6.1 Historical Period: 2018-2025
- 2.6.2 Base Year: 2025
- 2.6.3 Forecast Period: 2025-2035
- 2.7 Research Assumptions and Limitations
Chapter 3 Executive Summary
- 3.1 Market Snapshot and Key Findings
- 3.2 Base-Year Market Size, 2025
- 3.3 Forecast Market Size, 2035
- 3.4 Revenue and Volume Growth Outlook
- 3.5 Key Demand and Supply Indicators
- 3.6 Leading Market Segments
- 3.7 Fastest-Growing Market Opportunities
- 3.8 Regional Performance Highlights
- 3.9 Technology and Industry Transformation
- 3.10 Competitive Landscape Summary
- 3.11 Analyst View and Strategic Implications
Chapter 4 India Software as a Service (SaaS) Market Trends and Developments
- 4.1 Historical Industry Development, 2018-2025
- 4.2 Recent Market Trends and Developments
- 4.3 Demand and Customer Behavior Trends
- 4.4 Technology and Product Innovation
- 4.5 Artificial Intelligence, Automation and Digitalization
- 4.6 Local Manufacturing and Supply Chain Realignment
- 4.7 Industry Partnerships, Mergers and Acquisitions
- 4.8 Sustainability and Circular Economy Developments
- 4.9 Government and Private Sector Investment Trends
- 4.10 Emerging Business Models and Commercialization
- 4.11 Industry Developments and Announcements
Chapter 5 India Software as a Service (SaaS) Market Supply and Demand Analysis
- 5.1 Demand Trend and Consumption Analysis, 2018-2025
- 5.2 Demand Forecast, 2025-2035
- 5.3 Supply Chain Structure and Procurement Trends
- 5.4 Supply-Demand Gap and Bottlenecks
- 5.5 Import Dependence and Sourcing Structure
- 5.6 Regional Supply and Demand Concentration
Chapter 6 India Software as a Service (SaaS) Market Pricing Analysis
- 6.1 Pricing Structure and Measurement
- 6.2 Historical Pricing Trends, 2018-2025
- 6.3 Pricing Outlook, 2025-2035
- 6.4 Pricing by Product and Market Segment
- 6.5 Geographic Pricing Differences
- 6.6 Key Input, Energy, Labor and Logistics Costs
- 6.7 Contract Pricing and Purchasing Models
- 6.8 Pricing Sensitivity and Competitive Positioning
- 6.9 Price, Margin and Profitability Implications
Chapter 7 India Software as a Service (SaaS) Market Dynamics
- 7.1 Market Growth Drivers
- 7.1.1 Demand-Side Drivers
- 7.1.2 Technology and Innovation Drivers
- 7.1.3 Infrastructure and Investment Drivers
- 7.1.4 Regulatory and Policy Drivers
- 7.2 Market Restraints
- 7.2.1 Cost and Affordability Constraints
- 7.2.2 Technology and Adoption Barriers
- 7.2.3 Supply Chain and Operational Constraints
- 7.3 Market Challenges
- 7.3.1 Competitive Pressure and Margin Erosion
- 7.3.2 Skills, Infrastructure and Implementation Gaps
- 7.4 Emerging Market Opportunities
- 7.5 Market Dynamics Impact and Time-Horizon Assessment
Chapter 8 India Software as a Service (SaaS) Value Chain Analysis
- 8.1 Industry Value Chain Overview
- 8.2 Upstream Suppliers and Critical Inputs
- 8.3 Technology and Component Providers
- 8.4 Manufacturing or Service Delivery
- 8.5 Distribution, Channel Partners and Integrators
- 8.6 Downstream Applications and End Users
- 8.7 Value Addition and Profit Pools
- 8.8 Vertical Integration and Outsourcing
- 8.9 Supplier Concentration and Risk
- 8.10 Supply Chain Localization and Resilience
Chapter 9 India Software as a Service (SaaS) Market Regulations and Policies
- 9.1 Relevant Laws, Standards and Compliance Frameworks
- 9.2 Product, Service, Safety and Quality Requirements
- 9.3 Government Policies, Incentives and Subsidies
- 9.4 Imports, Exports and Trade Barriers
- 9.5 Public Procurement and Local Content Requirements
- 9.6 Data Protection, AI and Cybersecurity Compliance
- 9.7 Upcoming Policy Changes and Market Implications
Chapter 10 India Software as a Service (SaaS) Market Hotspots and Opportunities
- 10.1 Market Opportunity Mapping and Growth Hotspots
- 10.2 High-Growth Applications and Customer Groups
- 10.3 Underserved Markets and White-Space Opportunities
- 10.4 Emerging Technology and Product Opportunities
- 10.5 New Capacity and Investment Hotspots
- 10.6 Market Entry and Expansion Opportunities
- 10.7 Distribution and Partnership Opportunities
- 10.8 Near-Term and Long-Term Commercial Potential
- 10.9 Opportunity Attractiveness and Execution Risks
Chapter 11 India Software as a Service (SaaS) Market Outlook, 2025-2035
- 11.1 Market Size and Analysis
- 11.1.1 Revenue (Market Measurement: 2025: USD 12.99 billion → 2035: USD 100.44 billion)
- 11.1.2 Historical Market Size, 2018-2025
- 11.1.3 Base-Year Market Size, 2025
- 11.2 Market Forecast, 2025-2035
- 11.2.1 Revenue Forecast to 2035
- 11.2.2 CAGR and Year-on-Year Growth
- 11.2.3 Incremental Revenue Opportunity
- 11.3 Forecast Assumptions and Scenario Analysis
- 11.3.1 Base-Case Forecast
- 11.3.2 Optimistic and Conservative Scenarios
- 11.3.3 Technology, Pricing and Policy Sensitivities
- 11.4 Market Attractiveness and Growth Outlook
Chapter 12 India Software as a Service (SaaS) Market Segmentation and Outlook
- 12.1 Segmentation Summary and Market Shares, 2025
- 12.2 Largest and Fastest-Growing Segments
- 12.3 By Solution Type - Market Size and Forecast, 2025-2035
- 12.3.1 Segment Definition and Scope
- 12.3.2 Historical Market Size, 2018-2025
- 12.3.3 Revenue Forecast, 2025-2035
- 12.3.4 Base-Year Market Share, 2025
- 12.3.5 Segment CAGR and Growth Drivers
- 12.3.6 Subsegment Market Size and Forecast
- 12.3.6.1 Customer Relationship Management
- 12.3.6.2 Enterprise Resource Planning
- 12.3.6.3 Human Capital Management
- 12.3.6.4 Collaboration and Productivity
- 12.3.6.5 Analytics and Business Intelligence
- 12.3.7 Subsegment Pricing and Adoption Trends
- 12.3.8 Leading Suppliers and Competition
- 12.3.9 Regional Demand and Opportunities
- 12.4 By Deployment Model - Market Size and Forecast, 2025-2035
- 12.4.1 Segment Definition and Scope
- 12.4.2 Historical Market Size, 2018-2025
- 12.4.3 Revenue Forecast, 2025-2035
- 12.4.4 Base-Year Market Share, 2025
- 12.4.5 Segment CAGR and Growth Drivers
- 12.4.6 Subsegment Market Size and Forecast
- 12.4.6.1 Public Cloud SaaS
- 12.4.6.2 Private Hosted SaaS
- 12.4.6.3 Hybrid SaaS
- 12.4.7 Subsegment Pricing and Adoption Trends
- 12.4.8 Leading Suppliers and Competition
- 12.4.9 Regional Demand and Opportunities
- 12.5 By End-Use Industry - Market Size and Forecast, 2025-2035
- 12.5.1 Segment Definition and Scope
- 12.5.2 Historical Market Size, 2018-2025
- 12.5.3 Revenue Forecast, 2025-2035
- 12.5.4 Base-Year Market Share, 2025
- 12.5.5 Segment CAGR and Growth Drivers
- 12.5.6 Subsegment Market Size and Forecast
- 12.5.6.1 BFSI
- 12.5.6.2 IT and Telecom
- 12.5.6.3 Retail and E-Commerce
- 12.5.6.4 Manufacturing
- 12.5.6.5 Healthcare and Life Sciences
- 12.5.7 Subsegment Pricing and Adoption Trends
- 12.5.8 Leading Suppliers and Competition
- 12.5.9 Regional Demand and Opportunities
- 12.6 By Enterprise Size - Market Size and Forecast, 2025-2035
- 12.6.1 Segment Definition and Scope
- 12.6.2 Historical Market Size, 2018-2025
- 12.6.3 Revenue Forecast, 2025-2035
- 12.6.4 Base-Year Market Share, 2025
- 12.6.5 Segment CAGR and Growth Drivers
- 12.6.6 Subsegment Market Size and Forecast
- 12.6.6.1 Micro and Small Businesses
- 12.6.6.2 Mid-Market Enterprises
- 12.6.6.3 Large Enterprises
- 12.6.6.4 Digital-Native Startups
- 12.6.7 Subsegment Pricing and Adoption Trends
- 12.6.8 Leading Suppliers and Competition
- 12.6.9 Regional Demand and Opportunities
- 12.7 Segment Growth Comparison
- 12.8 Segment Attractiveness and Priority Matrix
Chapter 13 India Software as a Service (SaaS) End-Use and Application Market Outlook
- 13.1 End-Use Industry and Customer Demand Structure
- 13.2 Leading Applications and Customer Groups
- 13.3 End-Use Market Size, Share and Forecast
- 13.4 Major End-Use Industry Deep Dives
- 13.4.1 Customer Requirements and Use Cases
- 13.4.2 Demand and Replacement Cycles
- 13.4.3 Technical and Regulatory Considerations
- 13.4.4 Purchasing and Procurement Models
- 13.4.5 Leading Vendors and Distribution Channels
- 13.4.6 Forecast and Commercial Opportunities
- 13.5 Emerging Applications and Cross-Segment Demand
- 13.6 End-Use Industry Investment Priorities
Chapter 14 India Software as a Service (SaaS) Geographic Market Outlook, 2025-2035
- 14.1 Domestic Market Distribution and Demand Clusters
- 14.2 State- or Province-Wise Market Size and Forecast, 2025-2035
- 14.3 City and Metropolitan Market Outlook
- 14.4 Industrial, Manufacturing and Commercial Clusters
- 14.5 Geographic Concentration of Key End Users
- 14.6 Local Pricing and Purchasing Differences
- 14.7 Domestic Production Facilities and Capacity Map
- 14.8 Local Infrastructure and Project Pipeline
- 14.9 State-Level Policy and Incentive Differences
- 14.10 Subnational Investment Hotspots and Opportunities
- 14.11 Distribution and Logistics Networks
- 14.12 Domestic Competitive Footprint
Chapter 15 India Software as a Service (SaaS) Technology, Innovation and Sustainability Outlook
- 15.1 Technology Landscape and Maturity
- 15.2 Product, Process and Service Innovation
- 15.3 AI, Automation and Digital Tools in the Industry
- 15.4 Technology Adoption and Performance Benchmarking
- 15.5 Innovation Pipeline and R&D Investment
- 15.6 Patent and Intellectual Property Trends
- 15.7 Energy Efficiency and Resource Management
- 15.8 Sustainability, Recycling and Circularity
- 15.9 Technology Roadmap, 2025-2035
- 15.10 Risks of Obsolescence and Technology Substitution
Chapter 16 India Software as a Service (SaaS) Market Key Strategic Imperatives
- 16.1 Growth and Market Entry Priorities
- 16.2 High-Return Products and Segments
- 16.3 Pricing, Profitability and Cost Optimization
- 16.4 Technology Investment and Product Differentiation
- 16.5 Supply Chain Localization and Resilience
- 16.6 Distribution and Customer Acquisition
- 16.7 Partnership, Acquisition and Capacity Strategy
- 16.8 Regional Expansion Priorities
- 16.9 Short-, Medium- and Long-Term Actions
Chapter 17 Competition Outlook
- 17.1 Industry Competition Characteristics
- 17.2 Market Structure and Concentration
- 17.3 Market Share and Competitive Positioning, 2025
- 17.4 Company-Wise Revenue and Product Benchmarking
- 17.5 Production and Service Capacity Benchmarking
- 17.6 Technology, Pricing and Differentiation
- 17.7 Regional Footprint and Distribution Strength
- 17.8 Mergers, Acquisitions and Strategic Alliances
- 17.9 New Entrants and Competitive Threats
- 17.10 Porter's Five Forces and Industry Attractiveness
- 17.11 Competitive Outlook, 2025-2035
Chapter 18 Company Profiles
- 18.1 Company Coverage and Selection Criteria
- 18.2 Microsoft
- 18.2.1 Business Description
- 18.2.2 Company Ownership and Geographic Presence
- 18.2.3 Product and Service Portfolio
- 18.2.4 Manufacturing and Operating Footprint
- 18.2.5 Financial Performance and Investment
- 18.2.6 Market Share and Competitive Position
- 18.2.7 Technology and Innovation Capabilities
- 18.2.8 Strategic Alliances or Partnerships
- 18.2.9 Recent Developments
- 18.2.10 Growth Strategy and Outlook
- 18.3 Salesforce
- 18.4 Oracle
- 18.5 SAP
- 18.6 Zoho Corporation
- 18.7 Freshworks
- 18.8 ServiceNow
- 18.9 Adobe
- 18.10 Google (Alphabet)
- 18.11 Darwinbox
- 18.12 Other Relevant Market Participants
Note: Every listed company is profiled on the structure shown under the first company. The company list is preliminary and may change based on research findings, market developments, data availability and client requirements.
Chapter 19 Disclaimer
- 19.1 Research and Forecast Disclaimer
- 19.2 Data Source and Estimation Limitations
Note: The depth of individual sections depends on data availability for this market. Volume, capacity, trade and other unit-based metrics are included where applicable.

