
Rules, hybrid estates and AI widen governed access demand
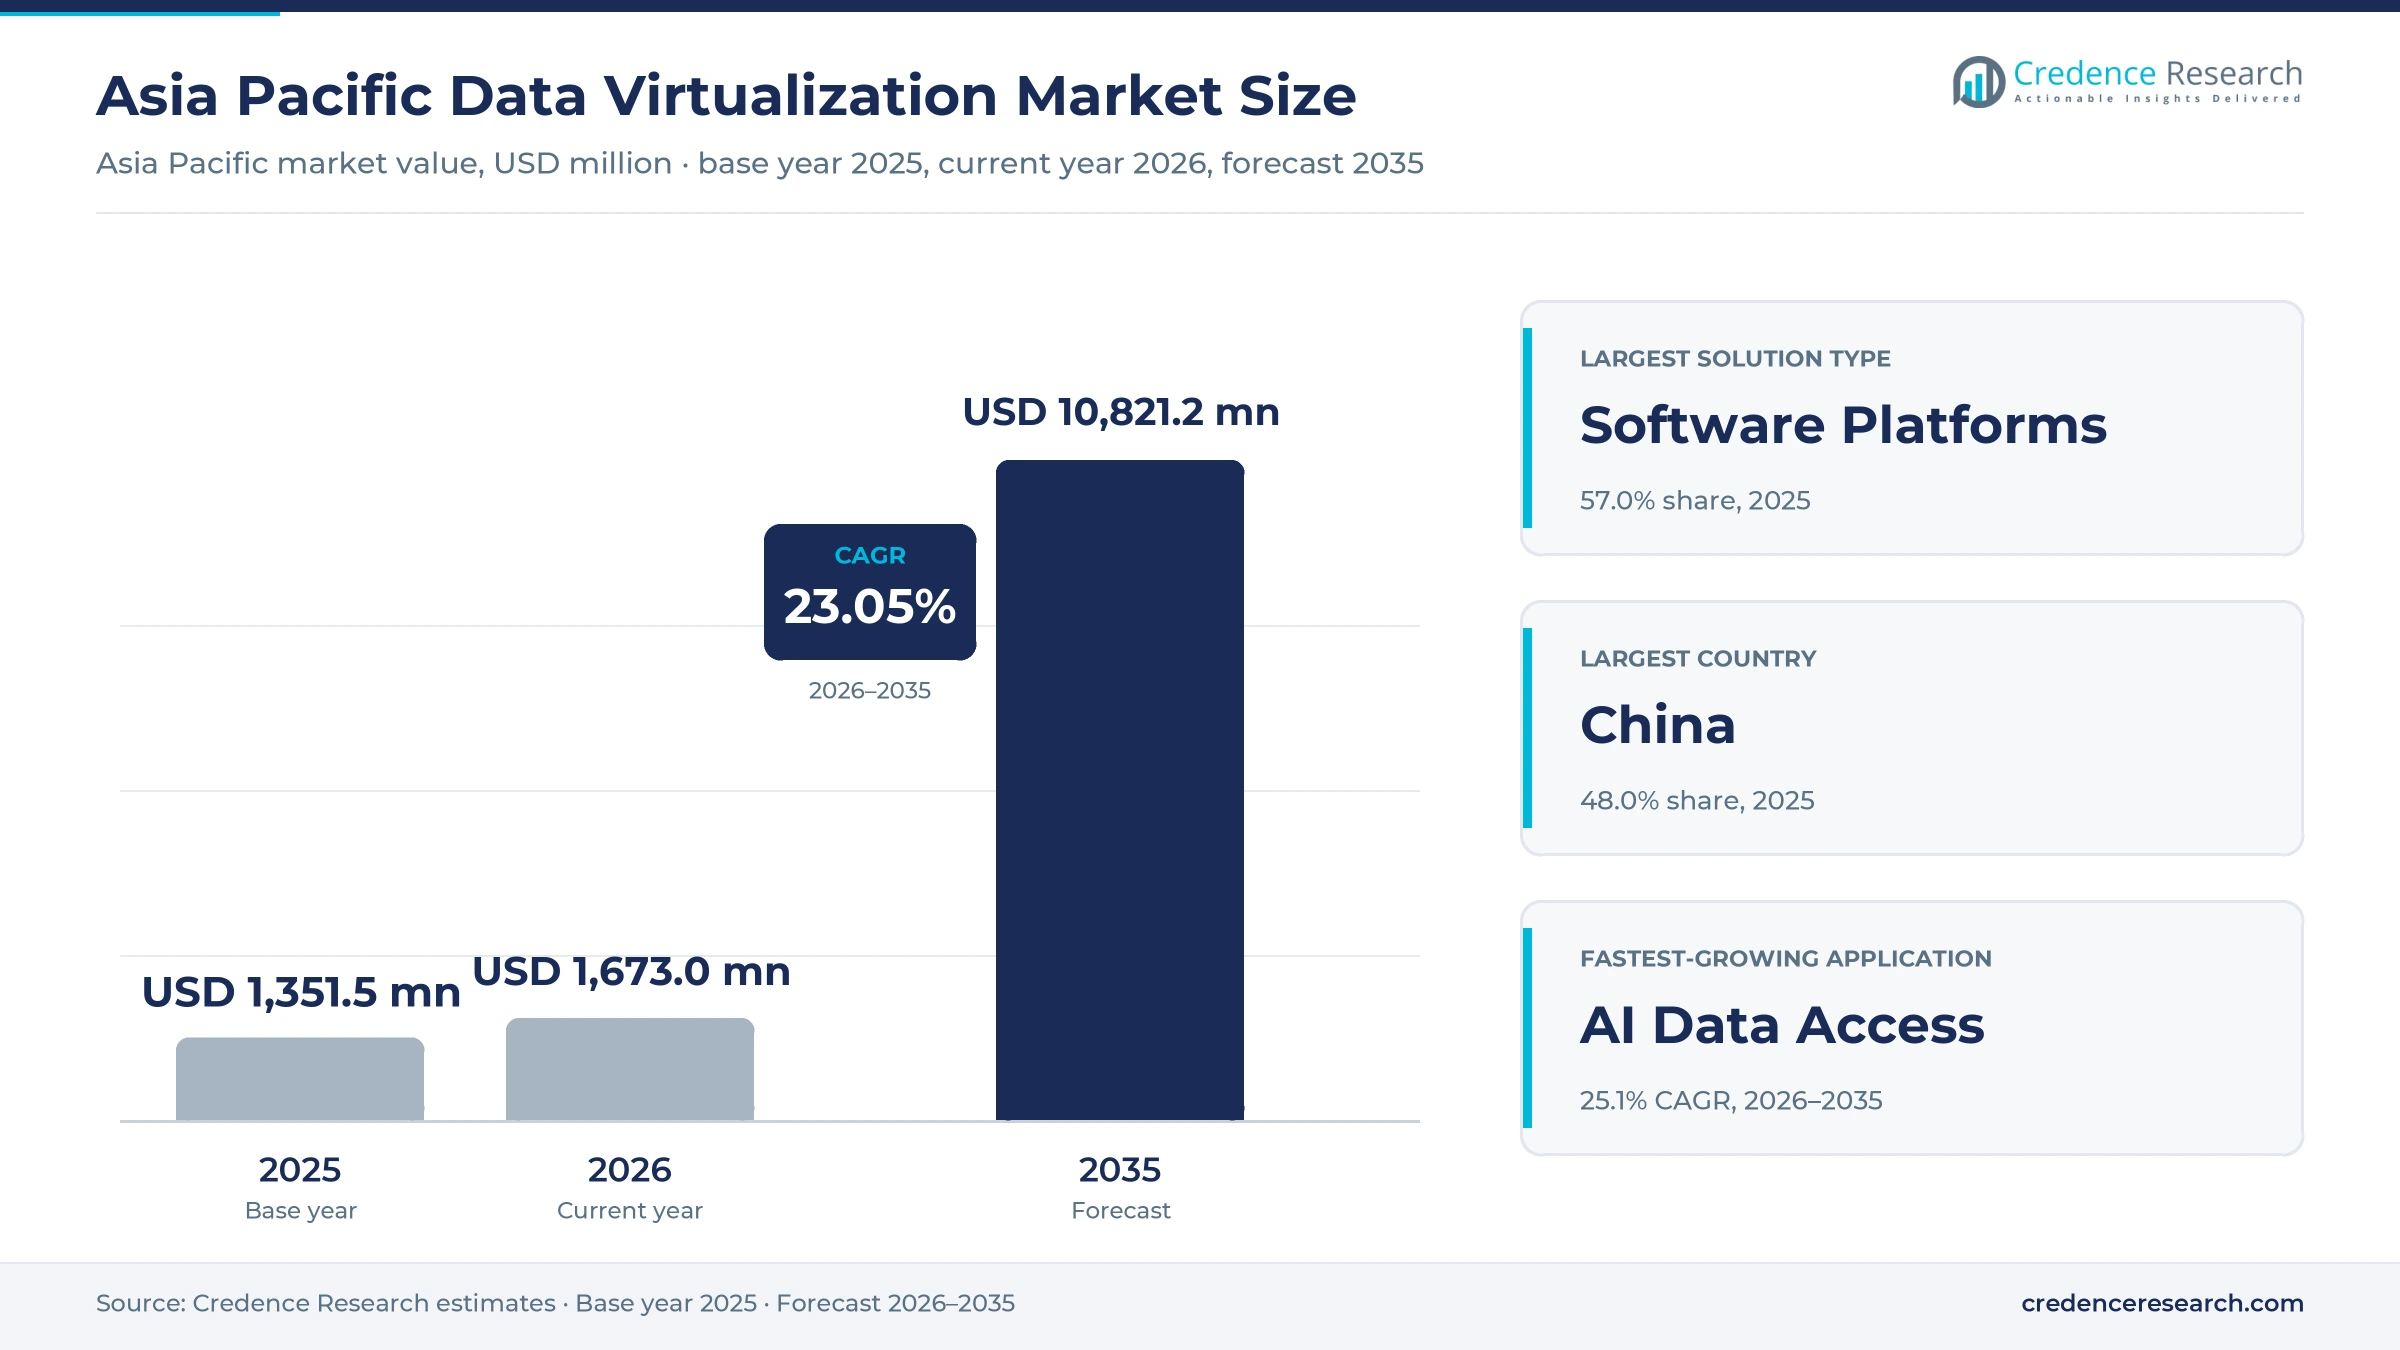
The Asia Pacific data virtualization market was valued at USD 1.35 billion in 2025 and is projected to increase from USD 1.67 billion in 2026 to USD 10.82 billion by 2035, registering a CAGR of 23.05% during 2026–2035. Demand comes from banks, telecom operators, hospitals, manufacturers and public agencies that need one governed query layer over databases, cloud storage and business applications spread across several countries. China held the largest country share, 48.0% in 2025, because large enterprises there run data on domestic platforms and must keep regulated records onshore. India is the fastest-growing country at 25.6% a year, as new data protection rules and consent-based financial data sharing push lenders to control access without copying records. A notable commercial change came in November 2025, when Salesforce completed its acquisition of Informatica and folded a major integration and catalog vendor into an application suite. Buyers now weigh connector coverage, policy enforcement and query cost per source as heavily as license price.
One governed query layer over scattered sources
The market counts what enterprises and public bodies in Asia Pacific spend on software that lets users and applications query data where it sits, plus the services that design, run and support those platforms. It covers logical data layers, federated query engines, zero-copy shortcut features inside larger data platforms and connector services, billed by subscription, perpetual license, compute usage or project fee.
The count excludes physical data warehouses, storage hardware, server and desktop virtualization, and pipelines that copy data into a new store. Value flows from platform vendors and open-source engine developers to systems integrators, cloud marketplaces and managed service providers, and then to banks, operators, hospitals, retailers, factories and agencies across the region.
Asia Pacific Data Virtualization Market Insights
- The market rises from USD 1.35 billion in 2025 to USD 10.82 billion by 2035, a 23.05% CAGR, as data rules, hybrid estates and AI assistants raise demand for governed access without copies.
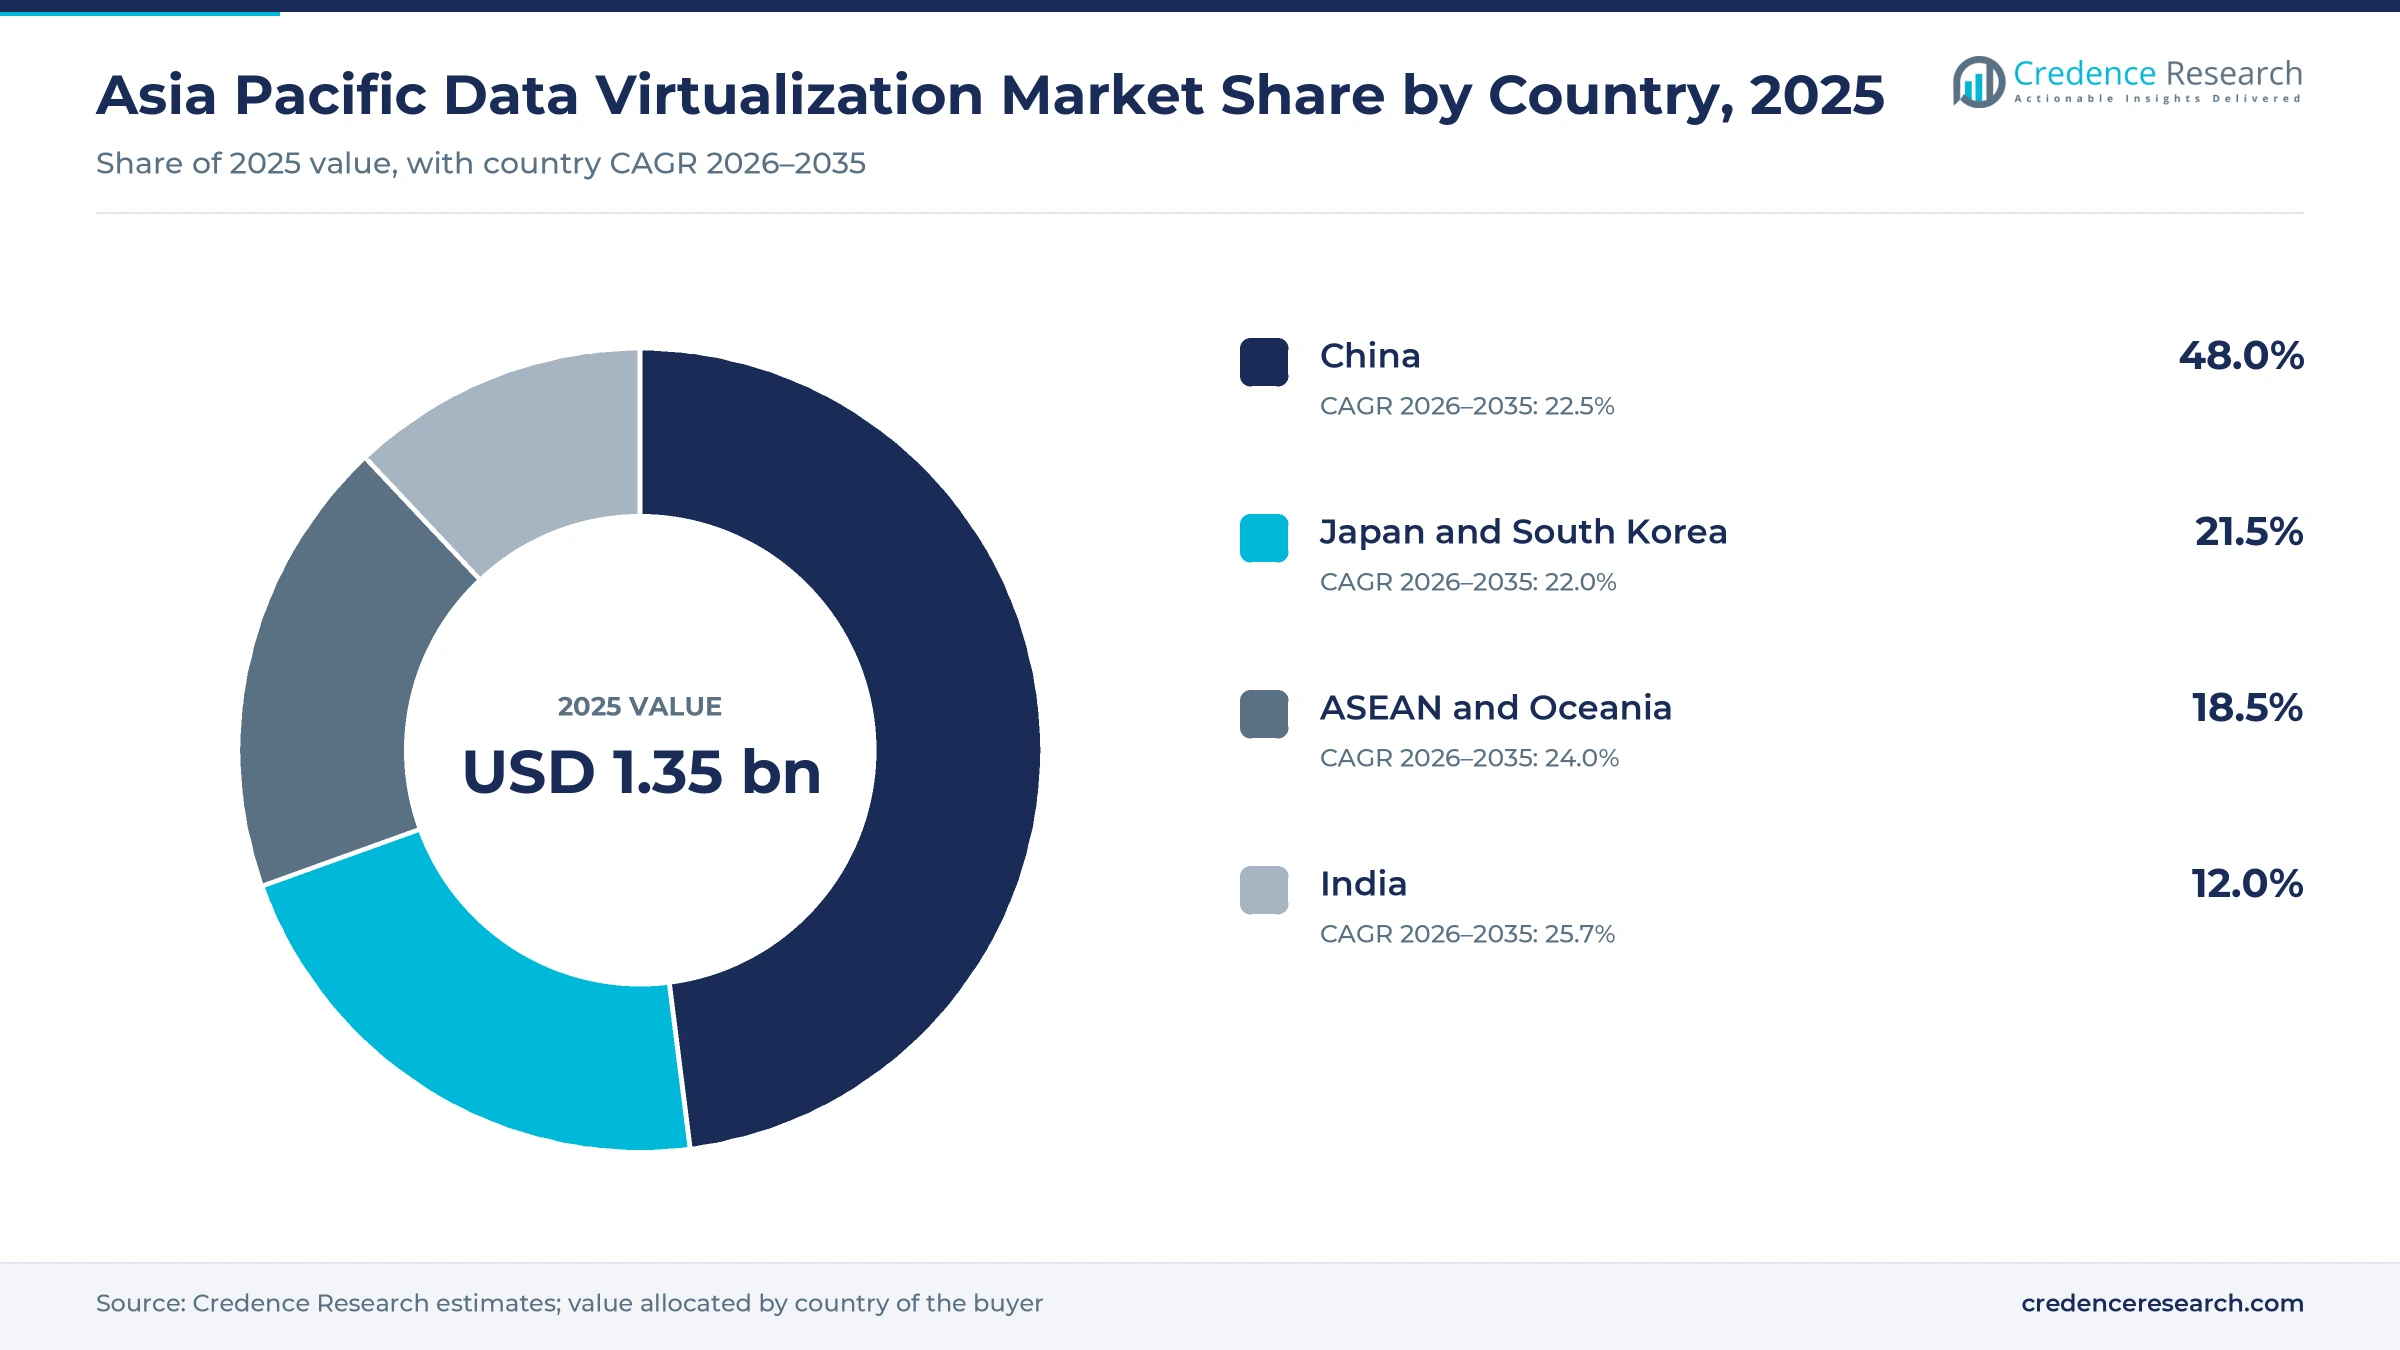
- China held 48.0% of 2025 value because large firms keep regulated records onshore under cross-border rules finalized by Chinese regulators in March 2024.
- Software Platforms led with 57.0% of 2025 value, since buyers pay first for the query engine, connectors and policy layer before any services.
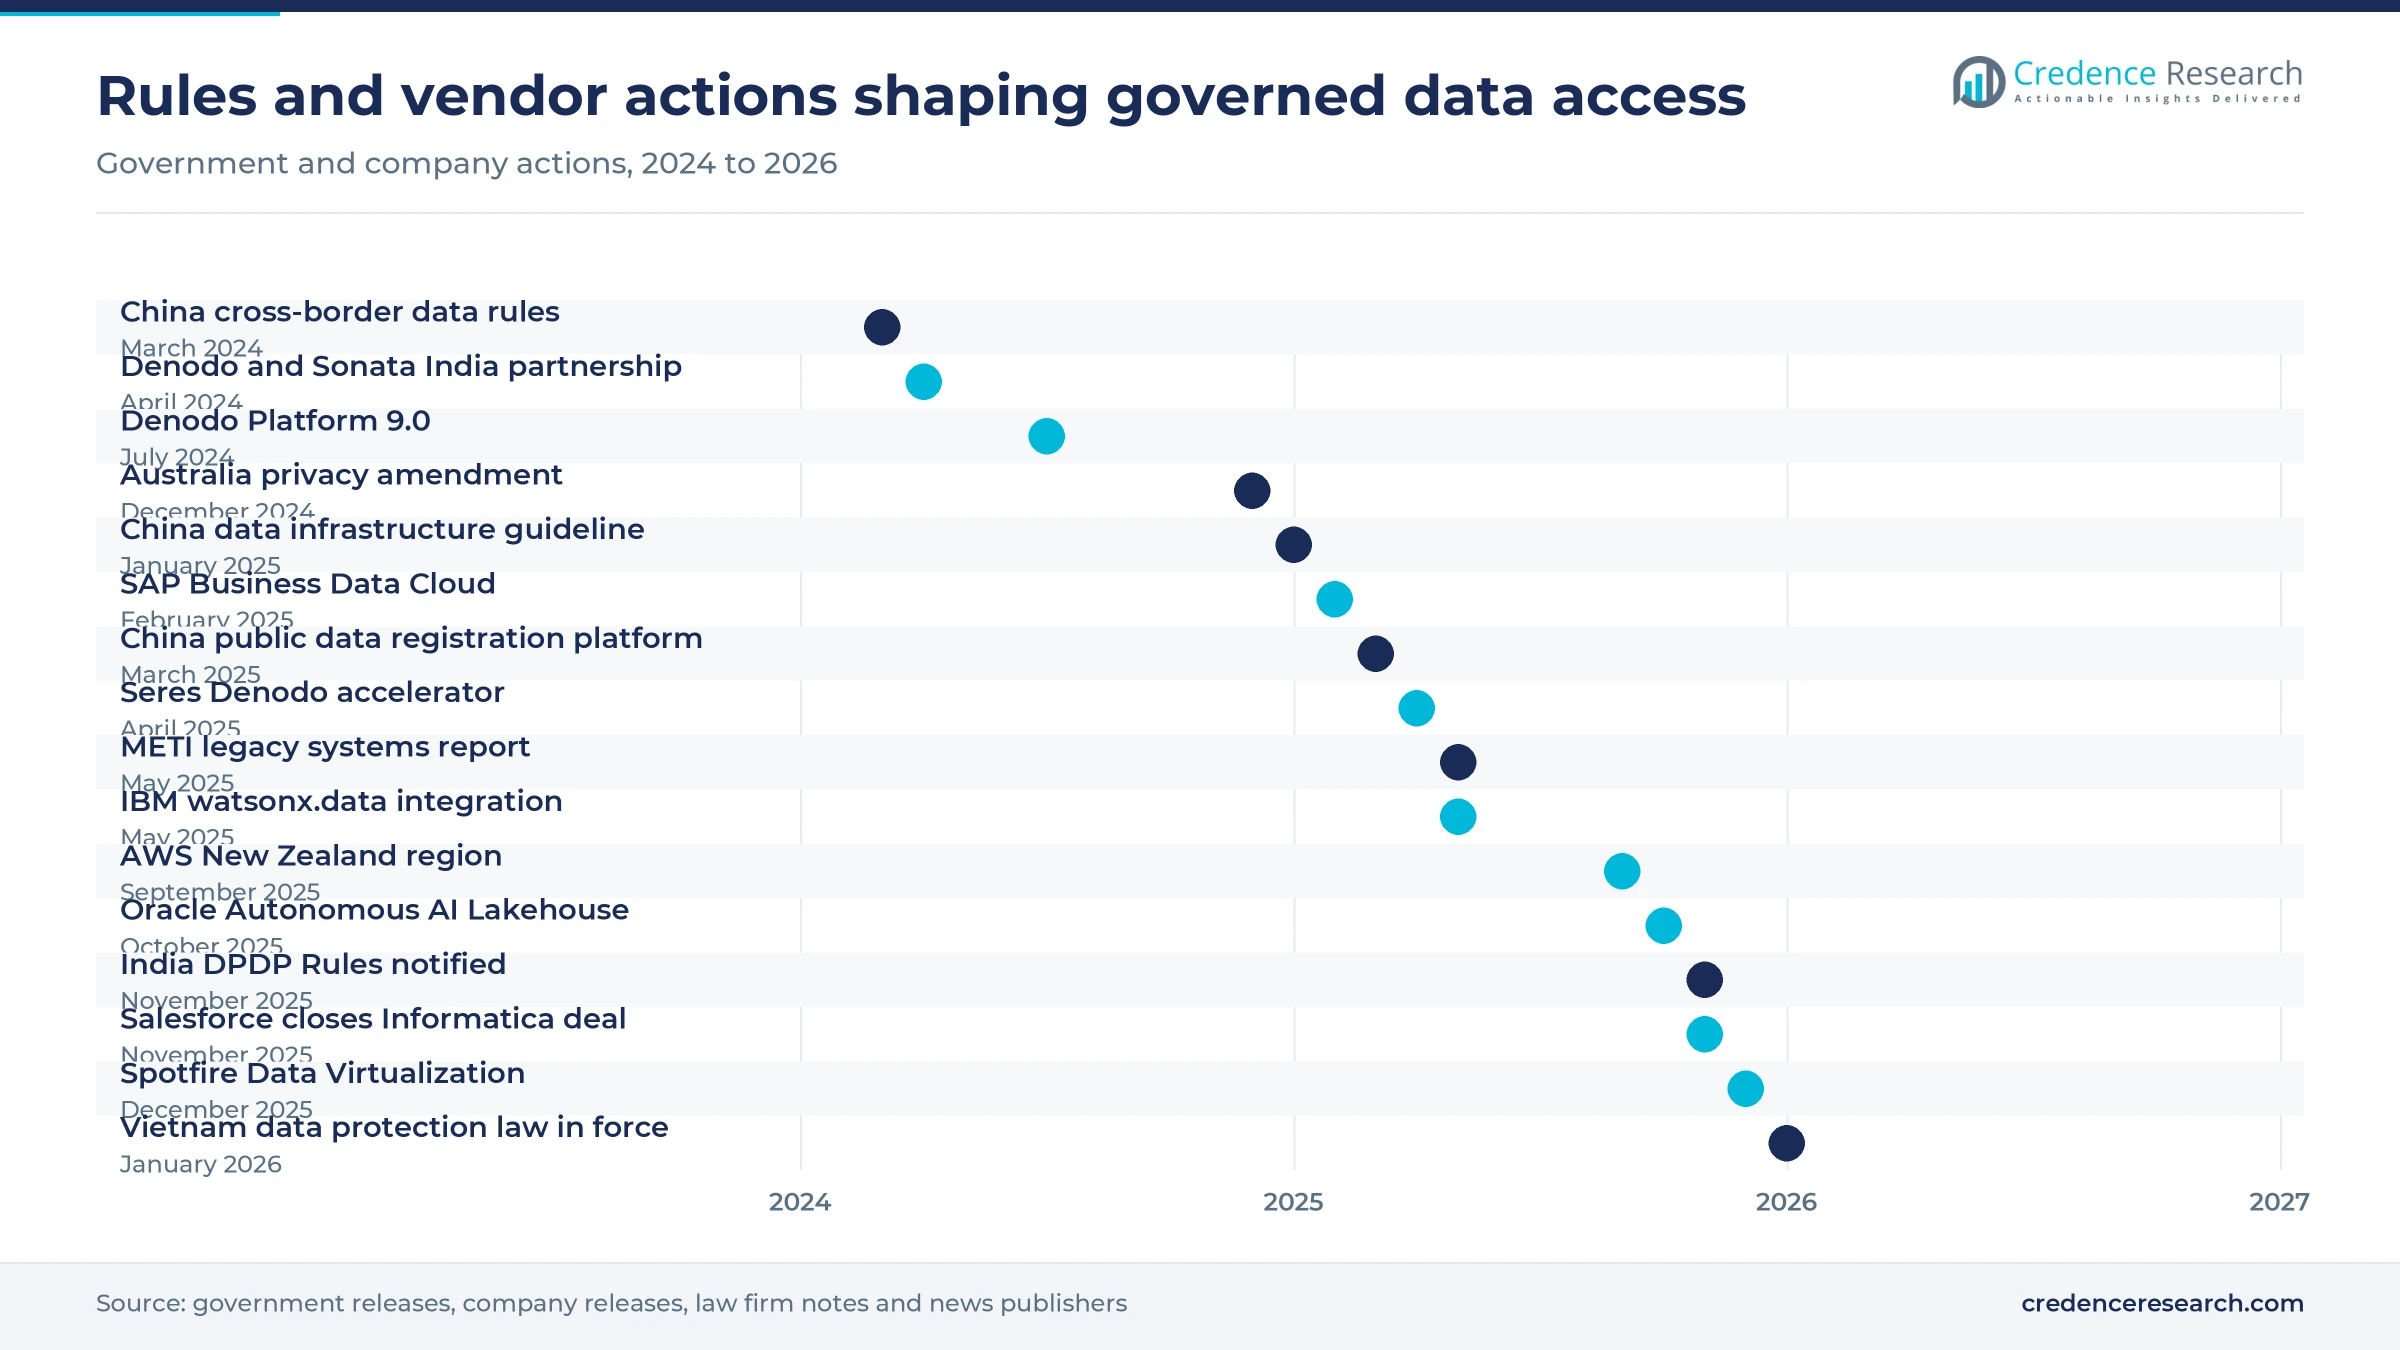
- India notified its Digital Personal Data Protection Rules on Nov. 13, 2025, phasing in core duties over 12 to 18 months and lifting demand for access controls.
- Salesforce completed its acquisition of Informatica on Nov. 18, 2025, and Spotfire Data Virtualization replaced the TIBCO product on Dec. 1, 2025.
Software leads as managed and AI access grow fastest
Software platforms take most spending as hosted engines gain
Based on solution type, the market is categorized into software platforms, professional services and managed services. Software Platforms led with 57.0% of 2025 value because buyers license the query engine, connectors and policy controls first, and IBM said on May 6, 2025 that watsonx.data integration would be sold as a standalone product from June 2025. Managed Services grow fastest at 24.9% a year as buyers rent hosted engines instead of running clusters, and Starburst reported on Feb. 20, 2025 that customers of its fully managed Galaxy service rose 76% in a year.
Public cloud leads as regulated buyers move to private cloud
Based on deployment model, the market is categorized into public cloud, on-premises and private cloud. Public Cloud led with 44.0% of 2025 value because most new data now lands in hyperscale storage, and Amazon launched its New Zealand region with three availability zones in September 2025, planning to invest more than NZ$7.5 billion there, W.Media reported. Private Cloud grows fastest at 24.3% a year as regulated buyers want cloud features inside domestic facilities, and NTT DATA began selling OpenCanvas Type-Oracle Alloy in East Japan in December 2025, keeping all data in its Japanese data centers. On-premises spending holds steady where banks and agencies still run core systems in their own facilities.
Banks buy most while health records drive the fastest growth
Based on end-use industry, the market is categorized into BFSI, IT and telecom, retail and healthcare, and manufacturing and public services. BFSI led with 31.0% of 2025 value because banks must join risk, customer and trading data across legacy cores, and Starburst said in February 2025 that HSBC, recognized in Hong Kong for its data and AI use, runs a virtual data lake on its engine. Retail and Healthcare grows fastest at 24.3% a year as health records multiply across providers, and India's National Health Authority said in May 2026 that more than 1 billion records were linked to national health accounts.
Analytics leads while AI assistants pull the fastest growth
Based on application, the market is categorized into analytics data access, operational data access, AI data access and governed data sharing. Analytics Data Access led with 41.0% of 2025 value because reporting teams running business intelligence software query many sources every day, and Chinese automaker Seres said in April 2025 that its Denodo-based accelerator delivered data 88% faster than traditional copy-based methods. AI Data Access grows fastest at 25.1% a year as AI assistants need live business data, and CData Software Japan released Connect AI in November 2025, a remote server that links more than 300 applications and data sources to AI assistants.
| Segment Group | Leading Sub-segment | Share, 2025 | Fastest-growing Sub-segment | CAGR, 2026–2035 |
|---|---|---|---|---|
| By Solution Type | Software Platforms | 57.0% | Managed Services | 24.9% |
| By Deployment Model | Public Cloud | 44.0% | Private Cloud | 24.3% |
| By End-Use Industry | BFSI | 31.0% | Retail and Healthcare | 24.3% |
| By Application | Analytics Data Access | 41.0% | AI Data Access | 25.1% |
Hourly fees, capacity units and credits set access costs
Pricing follows three models, and each moves with a different input. Specialist platforms charge an hourly or annual software fee tied to cores and source counts, so a Denodo Professional instance capped at five sources suits a first project but not an enterprise estate. Cloud data platforms sell capacity units billed per second, which turns the access layer into one line of a wider analytics bill. Managed engines charge per compute credit, with the credit price rising by support tier. Region matters too, because Fabric capacity hosted in Southeast Asia lists about 22% above the U.S. West 2 rate, so buyers should price in their own region and negotiate committed-use discounts.
| Offer or segment | Typical price or fee | Basis |
|---|---|---|
| Denodo Professional, Azure Marketplace | From USD 6.27 per hour software fee, four cores, up to five sources | Microsoft Azure Marketplace listing, 2026 |
| Microsoft Fabric capacity, F2 and F64, U.S. West 2 | USD 0.36 and USD 11.52 per hour, at USD 0.18 per capacity unit hour | Microsoft Azure retail prices, 2026 |
| Microsoft Fabric capacity, F2 and F64, Southeast Asia | USD 0.44 and USD 14.08 per hour, at USD 0.22 per capacity unit hour | Microsoft Azure retail prices, 2026 |
| OneLake hot storage, U.S. West 2 and Southeast Asia | USD 0.023 and USD 0.025 per GB per month | Microsoft Azure retail prices, 2026 |
| Starburst Galaxy Pro, Enterprise and Mission-Critical | From USD 0.50, USD 0.75 and USD 1.00 per credit | Starburst pricing page, 2026 |
Request a Free Sample
Fill in your details and we'll send you a free sample report.
- Sample data tables & charts
- Research methodology
Data rules, hybrid estates and AI lift spending
Data protection rules push governed access across sources
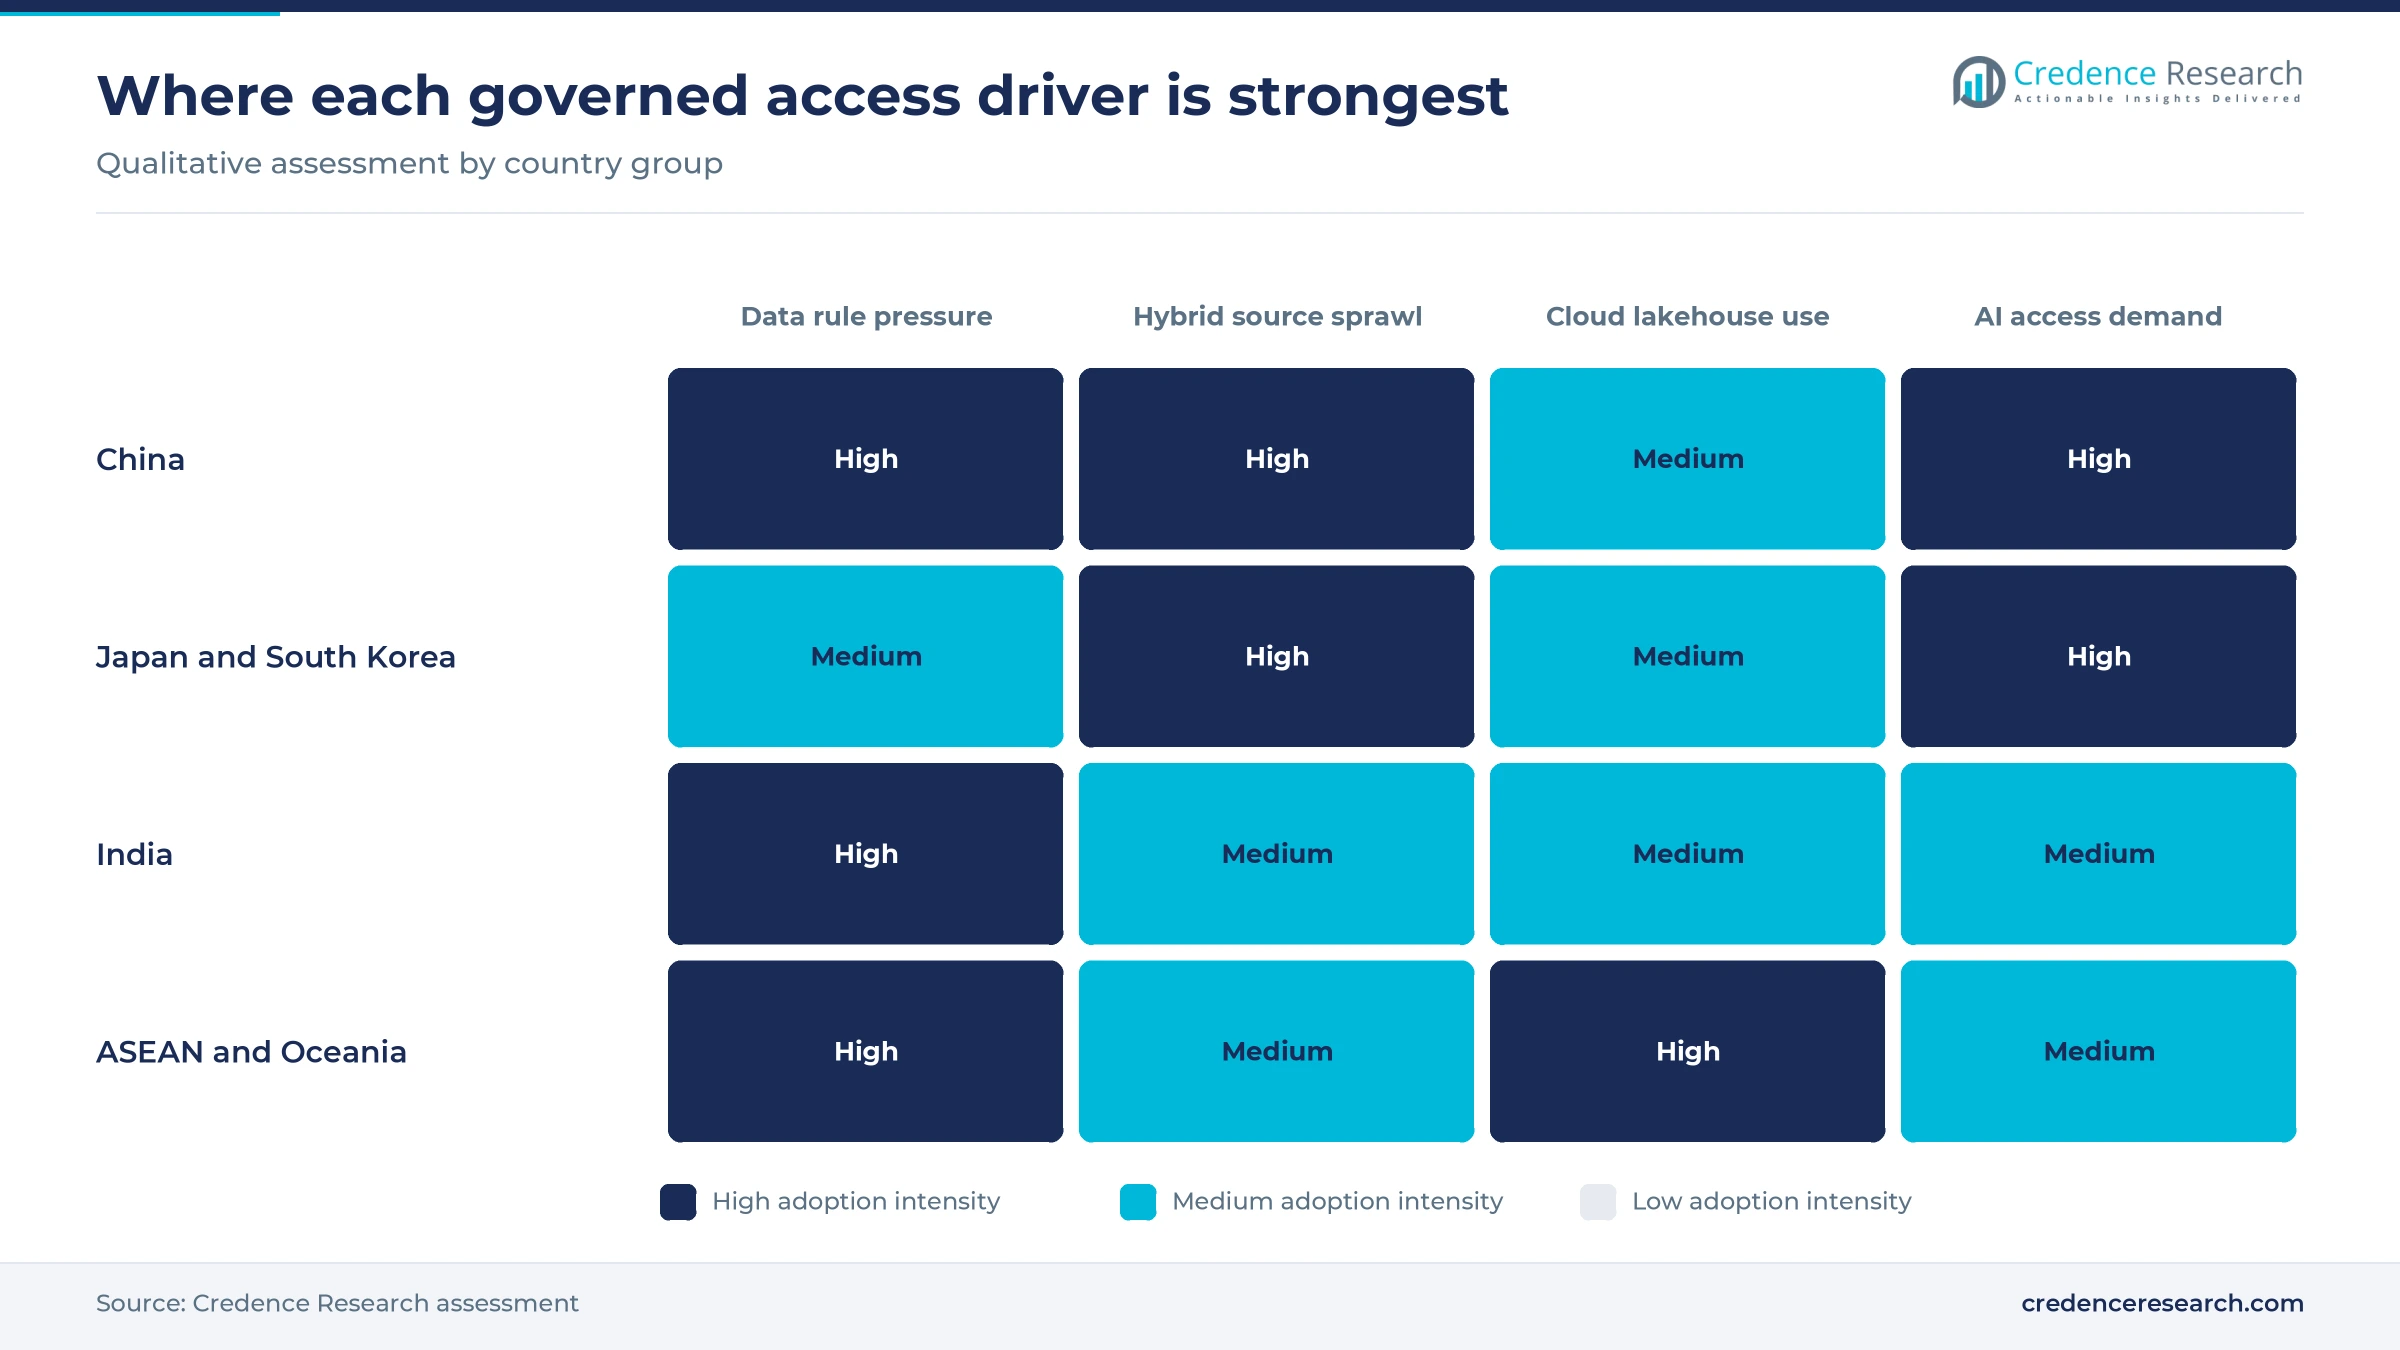
Data protection rules are the strongest driver of demand, because a virtual layer lets a firm enforce consent, masking and residency once instead of inside every copied database. India notified its Digital Personal Data Protection Rules on Nov. 13, 2025, phasing in core duties over 12 to 18 months, according to Hogan Lovells. The rules also let the government bar named categories of personal data from leaving India, a list that is still undefined. Australia's Privacy and Other Legislation Amendment Act received royal assent on Dec. 10, 2024, and requires privacy policies to disclose automated decisions from Dec. 10, 2026, MinterEllison noted. Banks, insurers and platforms facing these deadlines gain most from query-time policy controls, which is why governed data sharing outgrows reporting use in these estimates.
Hybrid estates reward reuse of existing sources
Most large firms in the region run old core systems beside newer cloud stores, so a layer that reuses sources in place costs less than rebuilding them. Japan's trade ministry published a report on May 28, 2025 from its Legacy Systems Modernization Committee, warning that aging systems hold back digital transformation and industrial competitiveness. SAP launched Business Data Cloud on Feb. 13, 2025, combining SAP Datasphere with Databricks so customers can share SAP data products with existing lakehouses without duplicating them. Denodo named Bengaluru-based Sonata Software a tier-one partner on April 30, 2024 to bring logical data management to Indian enterprises. Integrators gain a steady stream of hybrid integration platform and access-layer projects as legacy estates are modernized in stages rather than replaced.
Azure, AWS and OneLake support widens reachable sources
Support for the main cloud stores lets buyers query data where it already sits, which removes the cost of copying files between providers. Microsoft's OneLake shortcut documentation lists Amazon S3 and S3-compatible stores, Azure Data Lake Storage Gen2, Google Cloud Storage, Dataverse and Iceberg tables as sources, with on-premises data reached through a gateway. Oracle introduced Autonomous AI Lakehouse on Oct. 14, 2025, running on Oracle Cloud Infrastructure, AWS, Azure and Google Cloud and reading Iceberg catalogs from Databricks Unity, AWS Glue and Snowflake Polaris. Public cloud deployments held 44.0% of 2025 value, so vendors that match these connectors keep access to the largest pool of new workloads. Platforms without native support for the big cloud stores risk being bypassed by buyers.
AI assistants need live, governed business data
Generative AI projects need current, permissioned company data and a virtual layer supplies it without building a new copy for each model. Denodo released Platform 9.0 in July 2024 with natural-language queries through ChatGPT and AWS Bedrock and retrieval-augmented generation over governed data, IT Brief Australia reported. IBM announced watsonx.data integration and watsonx.data intelligence on May 6, 2025, planning availability for June 2025, to orchestrate data across formats and pipelines and draw insight from unstructured content. AI data access is the fastest-growing application at 25.1% a year through 2035, so it gains share faster than any other application. Vendors that pair natural-language access with lineage and masking stand to win AI budgets, while those selling bare query federation face pressure on price.
Platform suites and open engines reshape supply
Shift of virtual access into larger platform suites
Large software groups are absorbing standalone virtualization and integration products into wider suites, so buyers increasingly purchase access layers inside application or analytics contracts. Salesforce completed its acquisition of Informatica on Nov. 18, 2025, bringing catalog, integration, governance and master data management services to its platform. TIBCO Data Virtualization was replaced by Spotfire Data Virtualization on Dec. 1, 2025, and is now sold only through Spotfire Platform subscriptions, the vendor's support notice states. Cloud Software Group lists TIBCO and Spotfire as separate business units, which moves the product toward analytics buyers. Independent specialists such as Denodo and Starburst now compete against bundled features, and they respond by stressing neutrality across clouds and applications.
Rise of Trino-based engines and open table formats
Open-source Trino and the Iceberg table format are emerging as a shared base for federated query in the region, which lowers switching costs. Huawei Cloud describes HetuEngine, its interactive engine for SQL analysis and data virtualization, as built on Trino syntax and able to join Hive, HBase, GaussDB(DWS) and ClickHouse data across regions. Alibaba Cloud agreed in December 2021 to sell and support Starburst Enterprise in Greater China, and the joint release said 87.4% of Chinese firms use open-source technologies. Starburst said on Feb. 20, 2025 that net new customers rose 20% in its last fiscal year, as more buyers chose a commercial Trino engine over in-house clusters. OneLake and Oracle's lakehouse, both described above, also read Iceberg tables. Buyers gain portability, so vendors compete mainly on governance features.
Opportunity in consent-based financial data sharing in India
India's consent-based financial data system gives vendors a clear opening in governed data sharing, because every request must be permissioned, logged and served from the data holder's own systems. The account aggregator network served about 24.4 million users in fiscal 2025 and handled 115.8 million consent-based data transactions, Business Standard reported in October 2025, citing the industry alliance Sahamati. Non-bank lenders accounted for about 60% of completed consents across 276 such institutions, while 179 financial information providers were live. These lenders, and the banks that supply their data, need access layers that enforce consent at query time. Vendors with Indian integrators, local support and rupee pricing stand to win this demand from mid-sized institutions.
Opportunity in China's public data registration
China's push to register and circulate public data opens room for governed access tools in agencies and state-linked enterprises. The national public data registration platform went live in early March 2025 with medical insurance, meteorology and natural resources data, China Daily reported. Under the export rules finalized in March 2024, sensitive personal data on more than 10,000 people still needs a security assessment. A January 2025 guideline from the planning agency, the National Data Administration and the industry ministry targets the main structure of national data infrastructure by 2029. Domestic vendors are best placed, because public projects favor local software.
Product changes, transfer rules and egress slow rollouts
Product transitions disrupt established deployments
Product and channel changes force some buyers to re-plan their access layers in the middle of a contract. NTT DOCOMO BUSINESS stopped new sales of its TIBCO Data Virtualization service on April 24, 2025 and ended provision on May 30, 2025, its service page states. The move to subscription-only Spotfire licensing noted above adds a second change for the same installed base. Japanese firms that built virtual warehouses on these services face migration cost, retraining and project risk, while integrators can win the replacement projects.
Divergent transfer rules raise compliance cost
Each new national data law adds separate filings, which puts cost pressure on regional deployments. Vietnam's Personal Data Protection Law took effect on Jan. 1, 2026, requiring a transfer impact assessment for every cross-border transfer and a copy to the Ministry of Public Security within 60 days, Baker McKenzie notes. Transfer breaches can draw fines of up to 5% of prior-year revenue. Multinational retailers and lenders serving several ASEAN markets carry the heaviest load, since each country needs its own policy set.
Cross-cloud queries carry egress and latency costs
Querying data held in another provider's cloud adds transfer fees and slower responses, which can erase the savings from avoiding copies. Microsoft's OneLake caches files read through Amazon S3, Google Cloud Storage and gateway shortcuts specifically to reduce egress costs, keeping them for 1 to 28 days. Files larger than 1 GB are not cached, so heavy analytical workloads still pay transfer charges on every read. This limits savings, so buyers with large cross-cloud estates need careful workload placement and query pushdown.
Thin budgets and vendor-sourced returns slow approvals
Small budgets constrain many buyers, which slows enterprise-wide rollouts after the first project. Nearly half of the organizations in Denodo's 2025 market study spend less than USD 100,000 on data architecture, TechEdt reported in December 2025. Return figures quoted in the region come mostly from vendor-funded studies, and no independent regional benchmark was found for this report. Smaller firms and public agencies are most exposed, because finance teams ask for proof before scaling beyond a pilot.
China leads as India grows fastest
| Country | Value, 2025 (USD billion) | Share, 2025 | CAGR, 2026–2035 |
|---|---|---|---|
| China | 0.65 | 48.0% | 22.4% |
| Japan and South Korea | 0.29 | 21.5% | 21.9% |
| ASEAN and Oceania | 0.25 | 18.5% | 23.9% |
| India | 0.16 | 12.0% | 25.6% |
China leads on a large onshore data estate
China held 48.0% of 2025 value and grows at 22.4% a year, below the regional rate, because domestic platforms already serve many large buyers. The cross-border data rules finalized on March 22, 2024 still require a security assessment before a non-critical operator exports non-sensitive personal data of more than 1 million people, WilmerHale notes, so firms prefer to query records onshore. The Seres accelerator noted above shows foreign specialists still win factory projects. Domestic suppliers such as Huawei Cloud tend to be favored in public and state-linked projects.
Japan and South Korea grow on reuse of mature systems
Japan and South Korea held 21.5% of 2025 value and grow at 21.9% a year, the slowest pace in the region, because large firms there already run mature warehouses and change core systems cautiously. Japan's legacy modernization agenda, described above, keeps demand focused on reusing old cores rather than replacing them. NTT DATA's domestic Oracle Alloy cloud and CData Software Japan's AI connector give Japanese buyers local options. Public evidence on Korean deployments is thinner, so the Korean portion carries more estimation risk.
ASEAN and Oceania split by digital maturity
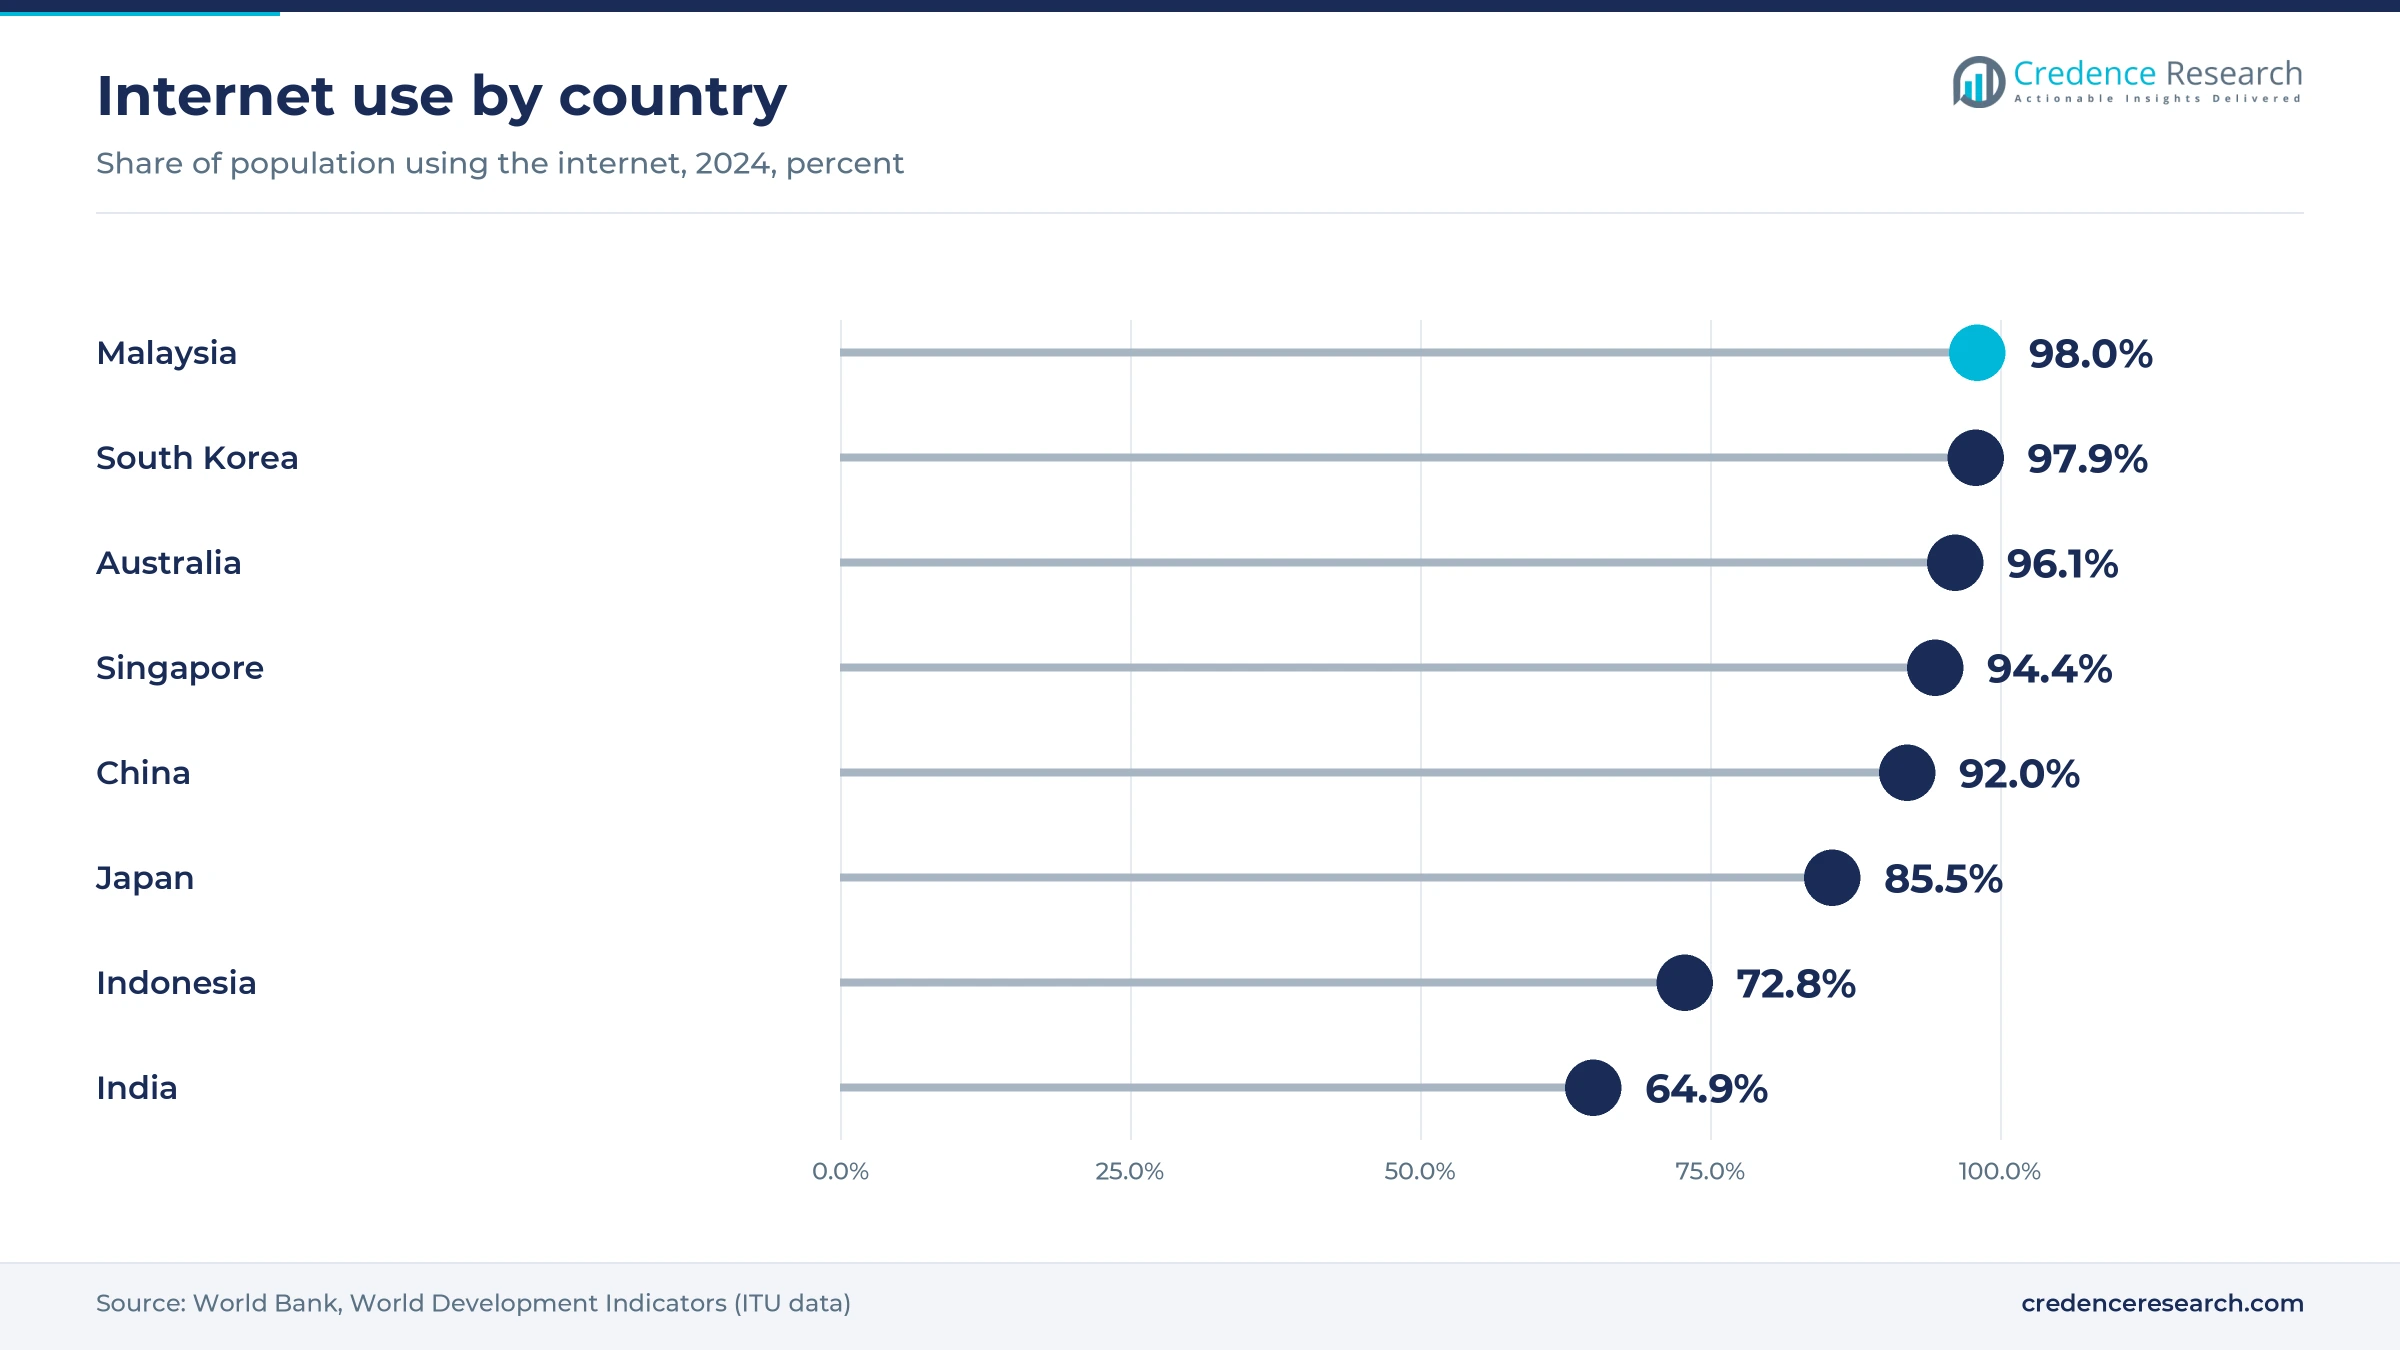
ASEAN and Oceania held 18.5% of 2025 value and grow at 23.9% a year, with Australia, Singapore, Malaysia, Indonesia and Vietnam as the main buyers. Australia's privacy reforms and Vietnam's new data law, both noted above, raise governance demands in two very different markets. Internet use reached 98.0% of Malaysia's population in 2024, against 72.8% in Indonesia, World Bank data show, so demand is deepest in the more digital economies. Hyperscale capacity in New Zealand and wider regional cloud computing spending add new sources to query.
India grows fastest on rules, finance and health records
India held 12.0% of 2025 value and is the fastest-growing country at 25.6% a year, as data rules, consent-based finance and digital health records arrive together. Internet use reached 64.9% of India's population in 2024, World Bank data show, which leaves a large base still to come online. The data protection rules and the account aggregator network, both described above, give banks and lenders reasons to buy governed access. Bengaluru integrators such as Sonata Software, a Denodo tier-one partner since April 2024, supply the delivery capacity these projects need.
Acquisitions and launches mark late 2025
| Development | Status and market relevance |
|---|---|
| In April 2025, Seres said its Data on Wheels accelerator built on the Denodo Platform delivered data 88% faster than traditional methods. | Completed deployment, a reference case for factory data access in China. |
| In October 2025, Oracle introduced Autonomous AI Lakehouse, which reads Iceberg tables across Oracle, AWS, Azure and Google Cloud. | Launched and available, widening multicloud access for Oracle database customers. |
| In November 2025, CData Software Japan released CData Connect AI, a remote server linking more than 300 sources to AI assistants. | Launched in Japan, aimed at the fast-growing AI data access application. |
| In November 2025, Salesforce completed its acquisition of Informatica, the data integration, catalog and master data vendor. | Completed, placing a leading integration vendor inside a large application suite. |
| In December 2025, Spotfire Data Virtualization replaced TIBCO Data Virtualization and became available only through Spotfire Platform subscriptions. | Effective, so existing customers move to the new subscriptions at renewal. |
Shortcuts, open tables and AI connectors change access
- Logical query layers push filters and joins down to each source system, so users query many databases through one interface without moving the records.
- Zero-copy shortcuts point a data platform at files in another cloud store, which removes duplicate copies and keeps schema changes in sync with the source.
- Open table formats such as Apache Iceberg let several engines read the same tables, which reduces lock-in and lets buyers switch query vendors later.
- AI connector servers expose business systems to AI assistants through standard protocols, so natural-language questions return answers drawn from permissioned company data.
Need a Custom Version of This Report?
Tailor the scope, geography, or segments to your exact requirements.
- Custom geography or segment scope
- Direct access to our analyst team
Platform vendors bundle access as specialists defend
Competition turns on connector breadth, governance depth and where the access layer is bought. Microsoft, Oracle, SAP and IBM embed virtual access in data platforms already licensed by large Asian banks, operators and manufacturers, which makes bundled features hard to dislodge. Salesforce gained a full integration and catalog portfolio when it closed the Informatica deal. Denodo competes as a neutral logical data layer, with integrators such as Sonata in India and factory references in China. Starburst sells Trino-based query engines as self-managed software and as the Galaxy managed service. Huawei Cloud offers a domestic engine in China, while Cloud Software Group now sells the former TIBCO engine through Spotfire. CData competes on connector count and AI connectivity in Japan. Buyers compare price per source, security certifications and local support.
Platform suites, specialists and domestic vendors split supply
Supply in this market sits in three distinct layers of vendors. Large platform vendors, Microsoft, Oracle, SAP, IBM and Salesforce through Informatica, embed virtual access in data platforms they already sell to the same accounts. Independent specialists such as Denodo, Starburst and CData compete on neutrality, connector breadth and query optimization. Domestic suppliers, such as Huawei Cloud in China, serve buyers that require local software. Entry barriers rest on connector libraries, security certifications and integrator networks rather than capital. Margins are highest in subscriptions and lowest in implementation services, where Indian and Japanese integrators compete hard.
Companies profiled and their roles in this market
| Company | Type | Role in the market |
|---|---|---|
| Microsoft Corporation | Platform vendor | Sells Fabric and OneLake shortcuts that query Azure, AWS and Google storage in place |
| Oracle Corporation | Platform vendor | Sells Autonomous AI Lakehouse reading Iceberg catalogs across four public clouds |
| IBM Corporation | Platform vendor | Sells watsonx.data and watsonx.data integration for hybrid query and orchestration |
| SAP SE | Platform vendor | Sells Business Data Cloud and Datasphere for zero-copy access to SAP data |
| Informatica (Salesforce) | Integration and catalog vendor | Sells cloud data integration, catalog, governance and master data management |
| Denodo Technologies | Specialist | Sells the Denodo Platform logical data layer, with Indian partners and Chinese customers |
| Huawei Cloud (Huawei) | Domestic platform vendor | Sells HetuEngine cross-source SQL and data virtualization engine in its MRS service |
| Cloud Software Group (TIBCO and Spotfire) | Analytics and integration vendor | Sells Spotfire Data Virtualization through Spotfire Platform subscriptions since December 2025 |
| Starburst Data | Specialist | Sells Trino-based Starburst Enterprise and the managed Galaxy query service |
| CData Software | Connectivity specialist | Sells data connectors and the Connect AI service, including through CData Software Japan |
Governance depth will decide vendor returns
Credence Research's view is that governance depth, not raw query speed, will decide vendor returns in Asia Pacific through 2035. Platform vendors will keep bundling virtual access, which caps prices for basic federation, while consent enforcement, lineage and AI connectors command premiums. China will remain a largely domestic market, and India will add the most new deployments. India's share should rise from 12.0% in 2025 as lenders, insurers and hospitals add governed access layers. Buyers should insist on open table formats, portable policies and exit rights, so the access layer does not become another source of lock-in as AI use spreads.
Model built on rule changes, vendor actions and prices
The report uses 2025 as the base year and 2026 to 2035 as the forecast period. Market values come from the Credence Research model, and country, solution, deployment, industry and application splits are Credence Research estimates informed by public data. Sources include government and regulator releases, law firm summaries of new data rules, company press releases, product documentation, published list prices and regional news publishers. No interviews or surveys were used to build these estimates.
India and AI access set the pace to 2035
Credence Research expects Asia Pacific data virtualization spending to reach USD 10.82 billion by 2035 as data rules phase in and AI assistants need live, permissioned company data. India should keep the fastest pace, while China stays the largest source of value because of its onshore enterprise estate. Spending will tilt toward managed services, private cloud and AI data access as buyers rent engines and keep regulated data at home. China keeps close to half of regional demand through 2035, although its 22.4% growth rate trails India by about three points. Platform bundling is the main risk to value, because cheaper built-in features could limit what specialists can charge.
Rule enforcement and AI uptake set the range to 2035
The range of outcomes depends on how strictly new data laws are enforced and how fast AI assistants move from pilots into daily work. Strict enforcement with clear transfer lists favors query-time controls, while delayed rules let firms keep copying data. Bundling by platform vendors could also compress software prices, which would lower market value even when usage keeps growing.
| Scenario | CAGR, 2026–2035 | Value, 2035 | What has to hold |
|---|---|---|---|
| Downside | 20.1% | USD 8.66 billion | Rule enforcement slips, AI pilots stall and platform bundling compresses software prices across the region |
| Base | 23.05% | USD 10.82 billion | Data rules phase in on published schedules and AI assistants spread steadily in banks and telecom operators |
| Upside | 25.1% | USD 12.51 billion | India and ASEAN enforce consent rules firmly and AI agents need live governed data in most functions |
Frequently Asked Questions
How big is the Asia Pacific data virtualization market?
Which country leads the market?
Which country is growing fastest?
Which solution type holds the largest share?
Why do data protection rules lift demand?
What holds the market back?
How is data virtualization priced in the region?
Who are the main companies in this market?
Table of Content
Chapter 1 Market Segmentation
- 1.1 Segmentation Framework
- 1.1.1 Product and Service Classification
- 1.1.2 Application and End-Use Classification
- 1.1.3 Technology and Solution Classification
- 1.1.4 Customer and Distribution Channel Classification
- 1.1.5 Geographic Segmentation
- 1.1.6 Market Segment Definitions and Boundaries
- 1.2 By Solution Type
- 1.2.1 Software Platforms
- 1.2.2 Professional Services
- 1.2.3 Managed Services
- 1.3 By Deployment Model
- 1.3.1 Public Cloud
- 1.3.2 On-Premises
- 1.3.3 Private Cloud
- 1.4 By End-Use Industry
- 1.4.1 BFSI
- 1.4.2 IT and Telecom
- 1.4.3 Retail and Healthcare
- 1.4.4 Manufacturing and Public Services
- 1.5 By Application
- 1.5.1 Analytics Data Access
- 1.5.2 Operational Data Access
- 1.5.3 AI Data Access
- 1.5.4 Governed Data Sharing
- 1.6 By Country
- 1.6.1 China
- 1.6.2 India
- 1.6.3 Japan and South Korea
- 1.6.4 ASEAN and Oceania
Chapter 2 Introduction
- 2.1 Report Objectives and Scope
- 2.2 Product Definition and Industry Terminology
- 2.3 Market Inclusions and Exclusions
- 2.4 Research Process
- 2.4.1 Primary Research and Expert Interviews
- 2.4.2 Secondary Research and Source Review
- 2.4.3 Top-Down and Bottom-Up Estimation
- 2.4.4 Data Triangulation and Verification
- 2.5 Market Size Measurement Basis
- 2.5.1 2025: USD 1.35 billion → 2035: USD 10.82 billion
- 2.6 Historical and Forecast Reference Periods
- 2.6.1 Historical Period: 2018-2025
- 2.6.2 Base Year: 2025
- 2.6.3 Forecast Period: 2025-2035
- 2.7 Research Assumptions and Limitations
Chapter 3 Executive Summary
- 3.1 Market Snapshot and Key Findings
- 3.2 Base-Year Market Size, 2025
- 3.3 Forecast Market Size, 2035
- 3.4 Revenue and Volume Growth Outlook
- 3.5 Key Demand and Supply Indicators
- 3.6 Leading Market Segments
- 3.7 Fastest-Growing Market Opportunities
- 3.8 Regional Performance Highlights
- 3.9 Technology and Industry Transformation
- 3.10 Competitive Landscape Summary
- 3.11 Analyst View and Strategic Implications
Chapter 4 Asia Pacific Data Virtualization Market Trends and Developments
- 4.1 Historical Industry Development, 2018-2025
- 4.2 Recent Market Trends and Developments
- 4.3 Demand and Customer Behavior Trends
- 4.4 Technology and Product Innovation
- 4.5 Artificial Intelligence, Automation and Digitalization
- 4.6 Local Manufacturing and Supply Chain Realignment
- 4.7 Industry Partnerships, Mergers and Acquisitions
- 4.8 Sustainability and Circular Economy Developments
- 4.9 Government and Private Sector Investment Trends
- 4.10 Emerging Business Models and Commercialization
- 4.11 Industry Developments and Announcements
Chapter 5 Asia Pacific Data Virtualization Market Supply and Demand Analysis
- 5.1 Demand Trend and Consumption Analysis, 2018-2025
- 5.2 Demand Forecast, 2025-2035
- 5.3 Supply Chain Structure and Procurement Trends
- 5.4 Supply-Demand Gap and Bottlenecks
- 5.5 Import Dependence and Sourcing Structure
- 5.6 Regional Supply and Demand Concentration
Chapter 6 Asia Pacific Data Virtualization Market Pricing Analysis
- 6.1 Pricing Structure and Measurement
- 6.2 Historical Pricing Trends, 2018-2025
- 6.3 Pricing Outlook, 2025-2035
- 6.4 Pricing by Product and Market Segment
- 6.5 Geographic Pricing Differences
- 6.6 Key Input, Energy, Labor and Logistics Costs
- 6.7 Contract Pricing and Purchasing Models
- 6.8 Pricing Sensitivity and Competitive Positioning
- 6.9 Price, Margin and Profitability Implications
Chapter 7 Asia Pacific Data Virtualization Market Dynamics
- 7.1 Market Growth Drivers
- 7.1.1 Demand-Side Drivers
- 7.1.2 Technology and Innovation Drivers
- 7.1.3 Infrastructure and Investment Drivers
- 7.1.4 Regulatory and Policy Drivers
- 7.2 Market Restraints
- 7.2.1 Cost and Affordability Constraints
- 7.2.2 Technology and Adoption Barriers
- 7.2.3 Supply Chain and Operational Constraints
- 7.3 Market Challenges
- 7.3.1 Competitive Pressure and Margin Erosion
- 7.3.2 Skills, Infrastructure and Implementation Gaps
- 7.4 Emerging Market Opportunities
- 7.5 Market Dynamics Impact and Time-Horizon Assessment
Chapter 8 Asia Pacific Data Virtualization Value Chain Analysis
- 8.1 Industry Value Chain Overview
- 8.2 Upstream Suppliers and Critical Inputs
- 8.3 Technology and Component Providers
- 8.4 Manufacturing or Service Delivery
- 8.5 Distribution, Channel Partners and Integrators
- 8.6 Downstream Applications and End Users
- 8.7 Value Addition and Profit Pools
- 8.8 Vertical Integration and Outsourcing
- 8.9 Supplier Concentration and Risk
- 8.10 Supply Chain Localization and Resilience
Chapter 9 Asia Pacific Data Virtualization Market Regulations and Policies
- 9.1 Relevant Laws, Standards and Compliance Frameworks
- 9.2 Product, Service, Safety and Quality Requirements
- 9.3 Government Policies, Incentives and Subsidies
- 9.4 Imports, Exports and Trade Barriers
- 9.5 Public Procurement and Local Content Requirements
- 9.6 Data Protection, AI and Cybersecurity Compliance
- 9.7 Upcoming Policy Changes and Market Implications
Chapter 10 Asia Pacific Data Virtualization Market Hotspots and Opportunities
- 10.1 Market Opportunity Mapping and Growth Hotspots
- 10.2 High-Growth Applications and Customer Groups
- 10.3 Underserved Markets and White-Space Opportunities
- 10.4 Emerging Technology and Product Opportunities
- 10.5 New Capacity and Investment Hotspots
- 10.6 Market Entry and Expansion Opportunities
- 10.7 Distribution and Partnership Opportunities
- 10.8 Near-Term and Long-Term Commercial Potential
- 10.9 Opportunity Attractiveness and Execution Risks
Chapter 11 Asia Pacific Data Virtualization Market Outlook, 2025-2035
- 11.1 Market Size and Analysis
- 11.1.1 Revenue (Market Measurement: 2025: USD 1.35 billion → 2035: USD 10.82 billion)
- 11.1.2 Historical Market Size, 2018-2025
- 11.1.3 Base-Year Market Size, 2025
- 11.2 Market Forecast, 2025-2035
- 11.2.1 Revenue Forecast to 2035
- 11.2.2 CAGR and Year-on-Year Growth
- 11.2.3 Incremental Revenue Opportunity
- 11.3 Forecast Assumptions and Scenario Analysis
- 11.3.1 Base-Case Forecast
- 11.3.2 Optimistic and Conservative Scenarios
- 11.3.3 Technology, Pricing and Policy Sensitivities
- 11.4 Market Attractiveness and Growth Outlook
Chapter 12 Asia Pacific Data Virtualization Market Segmentation and Outlook
- 12.1 Segmentation Summary and Market Shares, 2025
- 12.2 Largest and Fastest-Growing Segments
- 12.3 By Solution Type - Market Size and Forecast, 2025-2035
- 12.3.1 Segment Definition and Scope
- 12.3.2 Historical Market Size, 2018-2025
- 12.3.3 Revenue Forecast, 2025-2035
- 12.3.4 Base-Year Market Share, 2025
- 12.3.5 Segment CAGR and Growth Drivers
- 12.3.6 Subsegment Market Size and Forecast
- 12.3.6.1 Software Platforms
- 12.3.6.2 Professional Services
- 12.3.6.3 Managed Services
- 12.3.7 Subsegment Pricing and Adoption Trends
- 12.3.8 Leading Suppliers and Competition
- 12.3.9 Regional Demand and Opportunities
- 12.4 By Deployment Model - Market Size and Forecast, 2025-2035
- 12.4.1 Segment Definition and Scope
- 12.4.2 Historical Market Size, 2018-2025
- 12.4.3 Revenue Forecast, 2025-2035
- 12.4.4 Base-Year Market Share, 2025
- 12.4.5 Segment CAGR and Growth Drivers
- 12.4.6 Subsegment Market Size and Forecast
- 12.4.6.1 Public Cloud
- 12.4.6.2 On-Premises
- 12.4.6.3 Private Cloud
- 12.4.7 Subsegment Pricing and Adoption Trends
- 12.4.8 Leading Suppliers and Competition
- 12.4.9 Regional Demand and Opportunities
- 12.5 By End-Use Industry - Market Size and Forecast, 2025-2035
- 12.5.1 Segment Definition and Scope
- 12.5.2 Historical Market Size, 2018-2025
- 12.5.3 Revenue Forecast, 2025-2035
- 12.5.4 Base-Year Market Share, 2025
- 12.5.5 Segment CAGR and Growth Drivers
- 12.5.6 Subsegment Market Size and Forecast
- 12.5.6.1 BFSI
- 12.5.6.2 IT and Telecom
- 12.5.6.3 Retail and Healthcare
- 12.5.6.4 Manufacturing and Public Services
- 12.5.7 Subsegment Pricing and Adoption Trends
- 12.5.8 Leading Suppliers and Competition
- 12.5.9 Regional Demand and Opportunities
- 12.6 By Application - Market Size and Forecast, 2025-2035
- 12.6.1 Segment Definition and Scope
- 12.6.2 Historical Market Size, 2018-2025
- 12.6.3 Revenue Forecast, 2025-2035
- 12.6.4 Base-Year Market Share, 2025
- 12.6.5 Segment CAGR and Growth Drivers
- 12.6.6 Subsegment Market Size and Forecast
- 12.6.6.1 Analytics Data Access
- 12.6.6.2 Operational Data Access
- 12.6.6.3 AI Data Access
- 12.6.6.4 Governed Data Sharing
- 12.6.7 Subsegment Pricing and Adoption Trends
- 12.6.8 Leading Suppliers and Competition
- 12.6.9 Regional Demand and Opportunities
- 12.7 By Country - Market Size and Forecast, 2025-2035
- 12.7.1 Segment Definition and Scope
- 12.7.2 Historical Market Size, 2018-2025
- 12.7.3 Revenue Forecast, 2025-2035
- 12.7.4 Base-Year Market Share, 2025
- 12.7.5 Segment CAGR and Growth Drivers
- 12.7.6 Subsegment Market Size and Forecast
- 12.7.6.1 China
- 12.7.6.2 India
- 12.7.6.3 Japan and South Korea
- 12.7.6.4 ASEAN and Oceania
- 12.7.7 Subsegment Pricing and Adoption Trends
- 12.7.8 Leading Suppliers and Competition
- 12.7.9 Regional Demand and Opportunities
- 12.8 Segment Growth Comparison
- 12.9 Segment Attractiveness and Priority Matrix
Chapter 13 Asia Pacific Data Virtualization End-Use and Application Market Outlook
- 13.1 End-Use Industry and Customer Demand Structure
- 13.2 Leading Applications and Customer Groups
- 13.3 End-Use Market Size, Share and Forecast
- 13.4 Major End-Use Industry Deep Dives
- 13.4.1 Customer Requirements and Use Cases
- 13.4.2 Demand and Replacement Cycles
- 13.4.3 Technical and Regulatory Considerations
- 13.4.4 Purchasing and Procurement Models
- 13.4.5 Leading Vendors and Distribution Channels
- 13.4.6 Forecast and Commercial Opportunities
- 13.5 Emerging Applications and Cross-Segment Demand
- 13.6 End-Use Industry Investment Priorities
Chapter 14 Asia Pacific Data Virtualization Geographic Market Outlook, 2025-2035
- 14.1 Regional Market Size and Country-Level Shares, 2025
- 14.2 Country Market Size Comparison, 2025
- 14.3 Country Market Forecasts, 2025-2035
- 14.4 Subregional Industrial and Demand Clusters
- 14.5 Intra-Regional Pricing and Cost Differences
- 14.6 Cross-Border Trade and Supply Networks
- 14.7 Regional Supply and Demand Balances
- 14.8 Country Opportunity Comparison and Prioritization
Note: Every listed country is covered on the structure shown under the first country.
Chapter 15 Asia Pacific Data Virtualization Technology, Innovation and Sustainability Outlook
- 15.1 Technology Landscape and Maturity
- 15.2 Product, Process and Service Innovation
- 15.3 AI, Automation and Digital Tools in the Industry
- 15.4 Technology Adoption and Performance Benchmarking
- 15.5 Innovation Pipeline and R&D Investment
- 15.6 Patent and Intellectual Property Trends
- 15.7 Energy Efficiency and Resource Management
- 15.8 Sustainability, Recycling and Circularity
- 15.9 Technology Roadmap, 2025-2035
- 15.10 Risks of Obsolescence and Technology Substitution
Chapter 16 Asia Pacific Data Virtualization Market Key Strategic Imperatives
- 16.1 Growth and Market Entry Priorities
- 16.2 High-Return Products and Segments
- 16.3 Pricing, Profitability and Cost Optimization
- 16.4 Technology Investment and Product Differentiation
- 16.5 Supply Chain Localization and Resilience
- 16.6 Distribution and Customer Acquisition
- 16.7 Partnership, Acquisition and Capacity Strategy
- 16.8 Regional Expansion Priorities
- 16.9 Short-, Medium- and Long-Term Actions
Chapter 17 Competition Outlook
- 17.1 Industry Competition Characteristics
- 17.2 Market Structure and Concentration
- 17.3 Market Share and Competitive Positioning, 2025
- 17.4 Company-Wise Revenue and Product Benchmarking
- 17.5 Production and Service Capacity Benchmarking
- 17.6 Technology, Pricing and Differentiation
- 17.7 Regional Footprint and Distribution Strength
- 17.8 Mergers, Acquisitions and Strategic Alliances
- 17.9 New Entrants and Competitive Threats
- 17.10 Porter's Five Forces and Industry Attractiveness
- 17.11 Competitive Outlook, 2025-2035
Chapter 18 Company Profiles
- 18.1 Company Coverage and Selection Criteria
- 18.2 Microsoft Corporation
- 18.2.1 Business Description
- 18.2.2 Company Ownership and Geographic Presence
- 18.2.3 Product and Service Portfolio
- 18.2.4 Manufacturing and Operating Footprint
- 18.2.5 Financial Performance and Investment
- 18.2.6 Market Share and Competitive Position
- 18.2.7 Technology and Innovation Capabilities
- 18.2.8 Strategic Alliances or Partnerships
- 18.2.9 Recent Developments
- 18.2.10 Growth Strategy and Outlook
- 18.3 Oracle Corporation
- 18.4 IBM Corporation
- 18.5 SAP SE
- 18.6 Informatica (Salesforce)
- 18.7 Denodo Technologies
- 18.8 Huawei Cloud (Huawei)
- 18.9 Cloud Software Group (TIBCO and Spotfire)
- 18.10 Starburst Data
- 18.11 CData Software
- 18.12 Other Relevant Market Participants
Note: Every listed company is profiled on the structure shown under the first company. The company list is preliminary and may change based on research findings, market developments, data availability and client requirements.
Chapter 19 Disclaimer
- 19.1 Research and Forecast Disclaimer
- 19.2 Data Source and Estimation Limitations
Note: The depth of individual sections depends on data availability for this market. Volume, capacity, trade and other unit-based metrics are included where applicable.

