
New jets, cabin refits and local content lift IFE spending
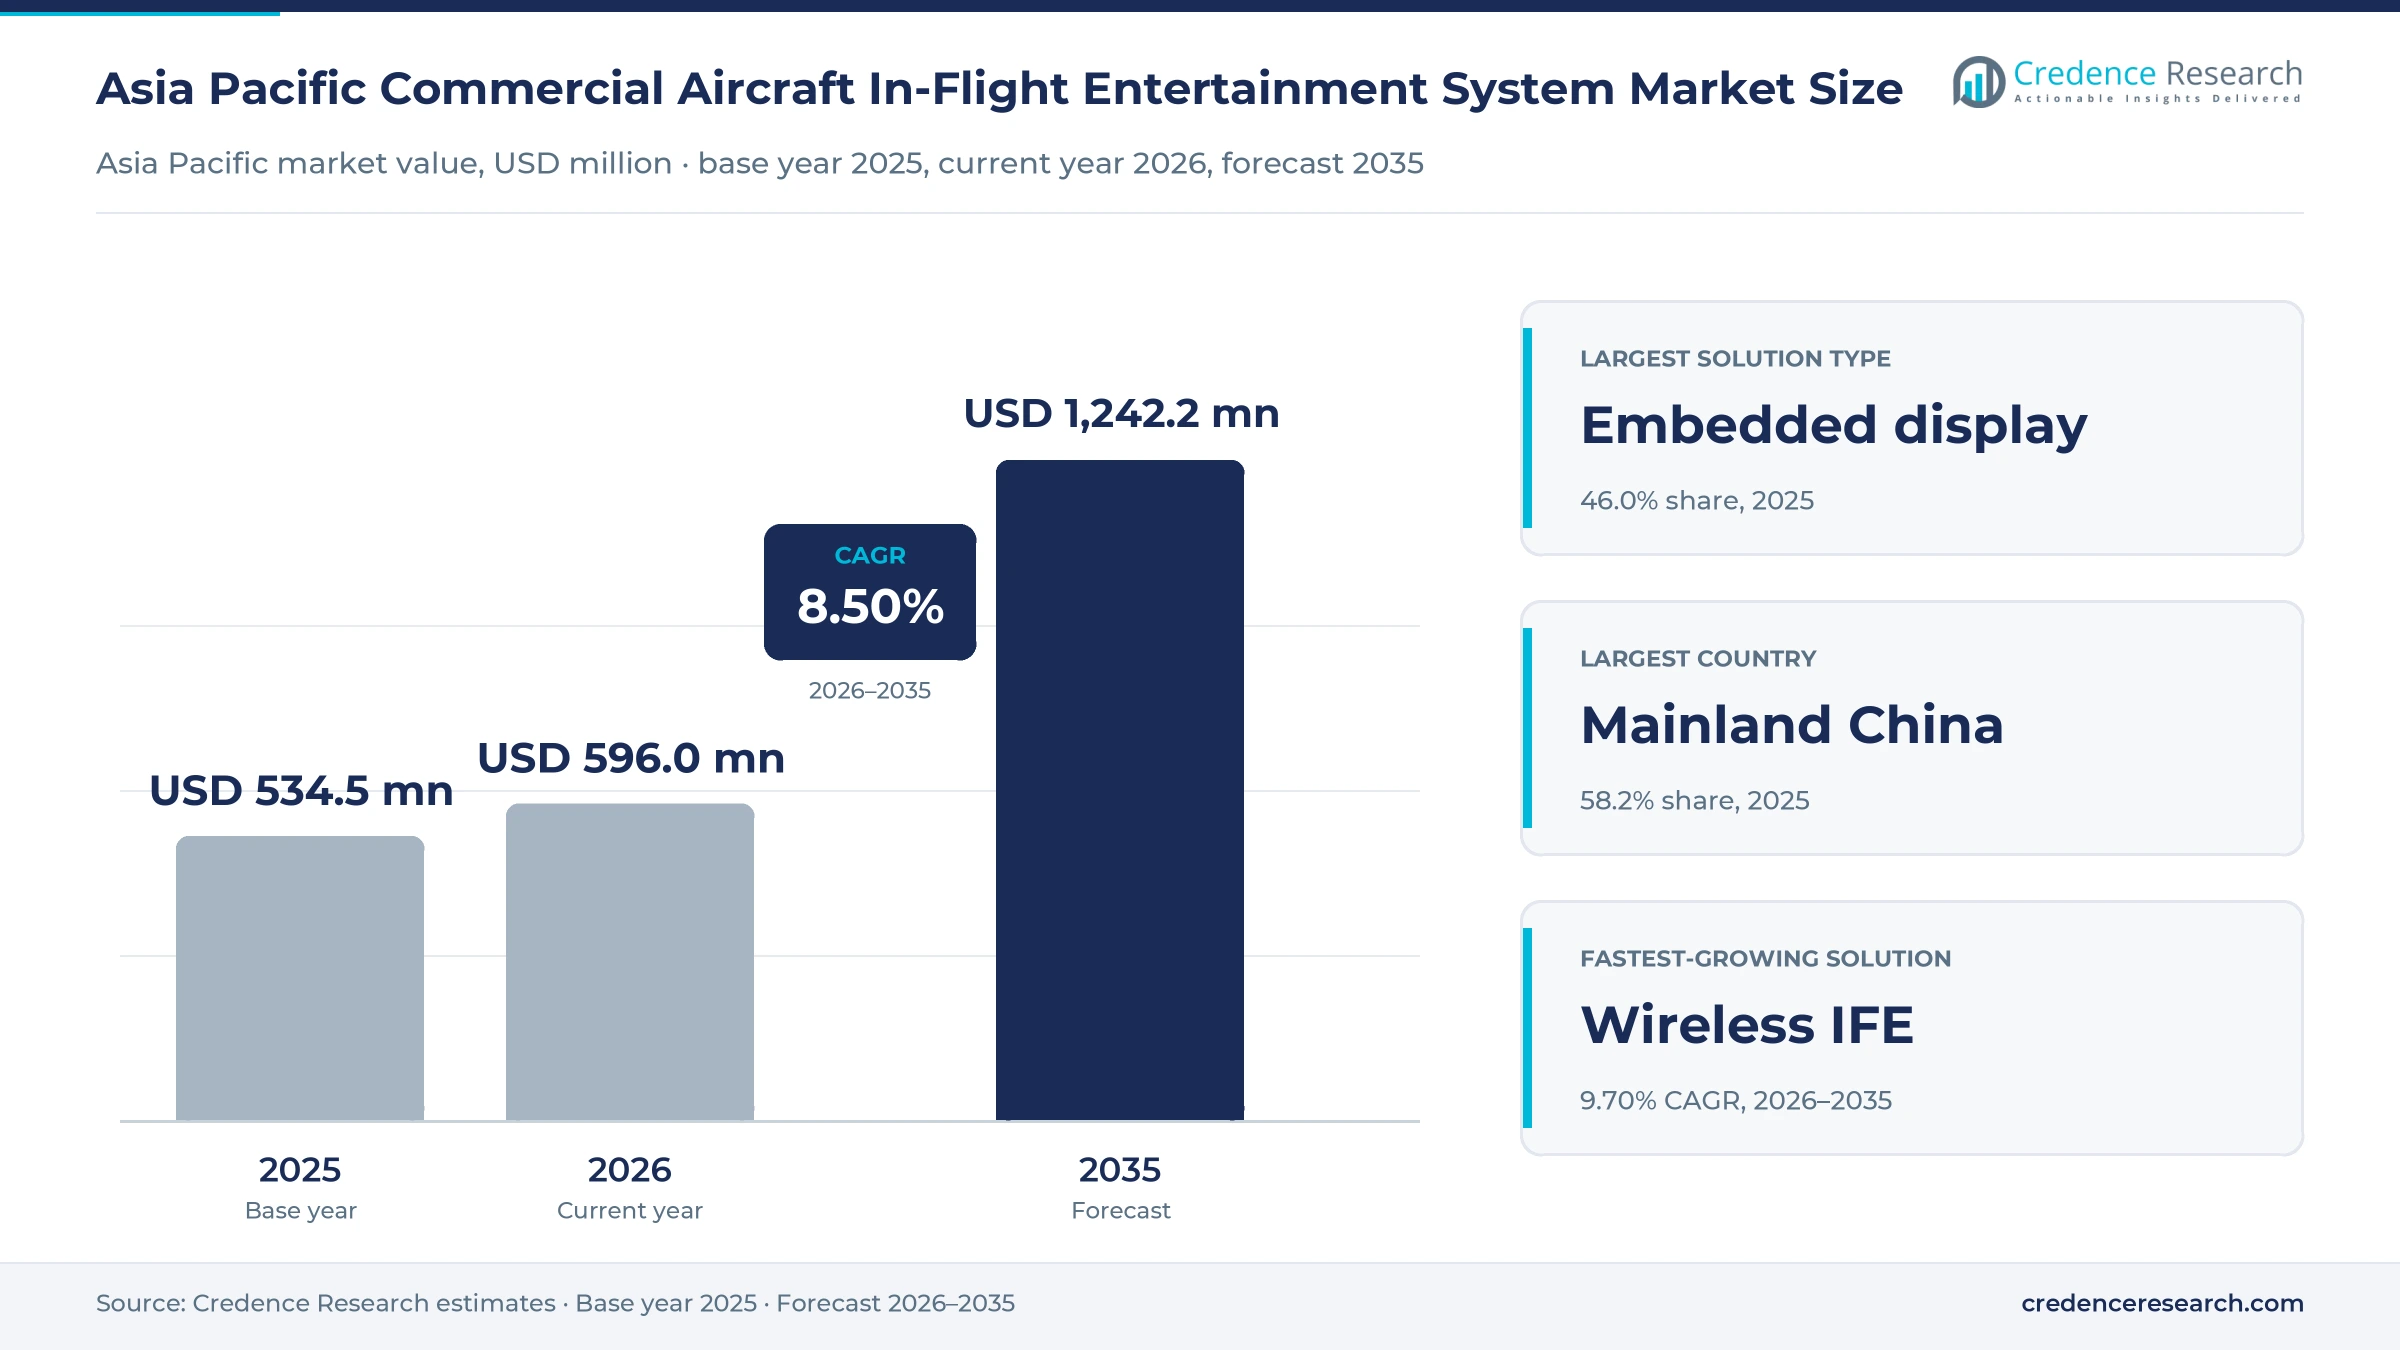
The Asia Pacific commercial aircraft in-flight entertainment system market was valued at USD 534.5 million in 2025 and is projected to increase from USD 596.0 million in 2026 to USD 1.24 billion by 2035, registering a CAGR of 8.50% during 2026–2035. Demand comes from seatback screens, onboard servers, wireless streaming systems, content services and integration work that airlines buy for new jets and for refits of older cabins. Mainland China held the largest regional share, 58.2% in 2025, because its carriers fly the largest domestic network in the region and keep adding widebody and C919 aircraft. South and Southeast Asia is the fastest-growing area at 9.69% a year, as Indian and Southeast Asian carriers take large aircraft orders. In turn, airlines are moving from older seatback platforms to 4K OLED screens with Bluetooth audio and USB-C power, while low-cost carriers favor streaming systems that use passengers' own devices.
Which cabin entertainment products does the estimate cover?
The estimate measures the value of embedded seatback and overhead display hardware, wireless streaming infrastructure, content and software services, and integration and maintenance services bought by airlines based in Asia Pacific for commercial passenger aircraft. It covers linefit installs on new aircraft, permanent retrofits and portable systems carried on board.
The estimate excludes satellite connectivity airtime, cabin seats, lighting and business jets. The value chain runs from display, server and software makers through content licensors and integrators to airframe makers, maintenance shops and the airlines that pay for entertainment as part of the cabin product.
Asia Pacific Commercial Aircraft In-Flight Entertainment System Market Insights
- The Asia Pacific commercial aircraft in-flight entertainment system market was valued at USD 534.5 million in 2025 and is projected to reach USD 1.24 billion by 2035, registering a CAGR of 8.50% during 2026–2035.
- Mainland China held a 58.2% share of 2025 value, because its airlines fly the largest domestic network in the region.
- Embedded display hardware led with a 46.0% share of 2025 value, because seatback screens remain standard on widebody jets.
- Air India selected Panasonic Avionics Astrova for 34 new widebody aircraft in April 2025, with 4K OLED screens and 67W USB-C power.
- Wireless IFE infrastructure grows fastest by solution type at 9.70% a year during 2026–2035, as low-cost airlines adopt streaming.
Seatback hardware leads while wireless streaming gains
Why does embedded display hardware lead spending?
Based on solution type, the market is categorized into embedded display hardware, wireless IFE infrastructure, content and software services, and integration and maintenance services. Embedded Display Hardware led with a 46.0% share of 2025 value, because widebody jets carry a screen at almost every seat. Wireless IFE Infrastructure grows fastest at 9.70% a year, as narrowbody operators stream content to passengers' own devices.
How do linefit and retrofit installs split demand?
Based on deployment model, the market is categorized into OEM linefit, permanent retrofit and portable deployment. OEM Linefit led with a 58.0% share of 2025 value, because most systems are installed when new aircraft leave Airbus, Boeing and COMAC lines. OEM Linefit also grows fastest at 8.77% a year, as large Indian and Chinese orders turn into deliveries.
Why do full-service airlines dominate purchases?
Based on customer type, the market is categorized into full-service network airlines, low-cost airlines, regional airlines and charter airlines. Full-Service Network Airlines led with a 68.0% share of 2025 value, because they fly long-haul widebody fleets with seatback screens in every cabin. Low-Cost Airlines grow fastest at 9.64% a year, as long-range narrowbodies bring streaming systems.
How do widebody and narrowbody cabins compare?
Based on application, the market is categorized into narrowbody cabin entertainment, widebody cabin entertainment and regional aircraft entertainment. Widebody Cabin Entertainment led with a 59.0% share of 2025 value, because long flights need more screens, content and power per seat. Narrowbody Cabin Entertainment grows fastest at 9.19% a year, as single-aisle jets fly longer routes across the region.
| Segment Group | Leading Sub-segment | Share, 2025 | Fastest-growing Sub-segment | CAGR, 2026–2035 |
|---|---|---|---|---|
| By Solution Type | Embedded Display Hardware | 46.0% | Wireless IFE Infrastructure | 9.70% |
| By Deployment Model | OEM Linefit | 58.0% | OEM Linefit | 8.77% |
| By Customer Type | Full-Service Network Airlines | 68.0% | Low-Cost Airlines | 9.64% |
| By Application | Widebody Cabin Entertainment | 59.0% | Narrowbody Cabin Entertainment | 9.19% |
Request a Free Sample
Fill in your details and we'll send you a free sample report.
- Sample data tables & charts
- Research methodology
Fleet growth, cabin refits and traffic gains lift demand
How do fleet expansion and linefit demand lift orders?
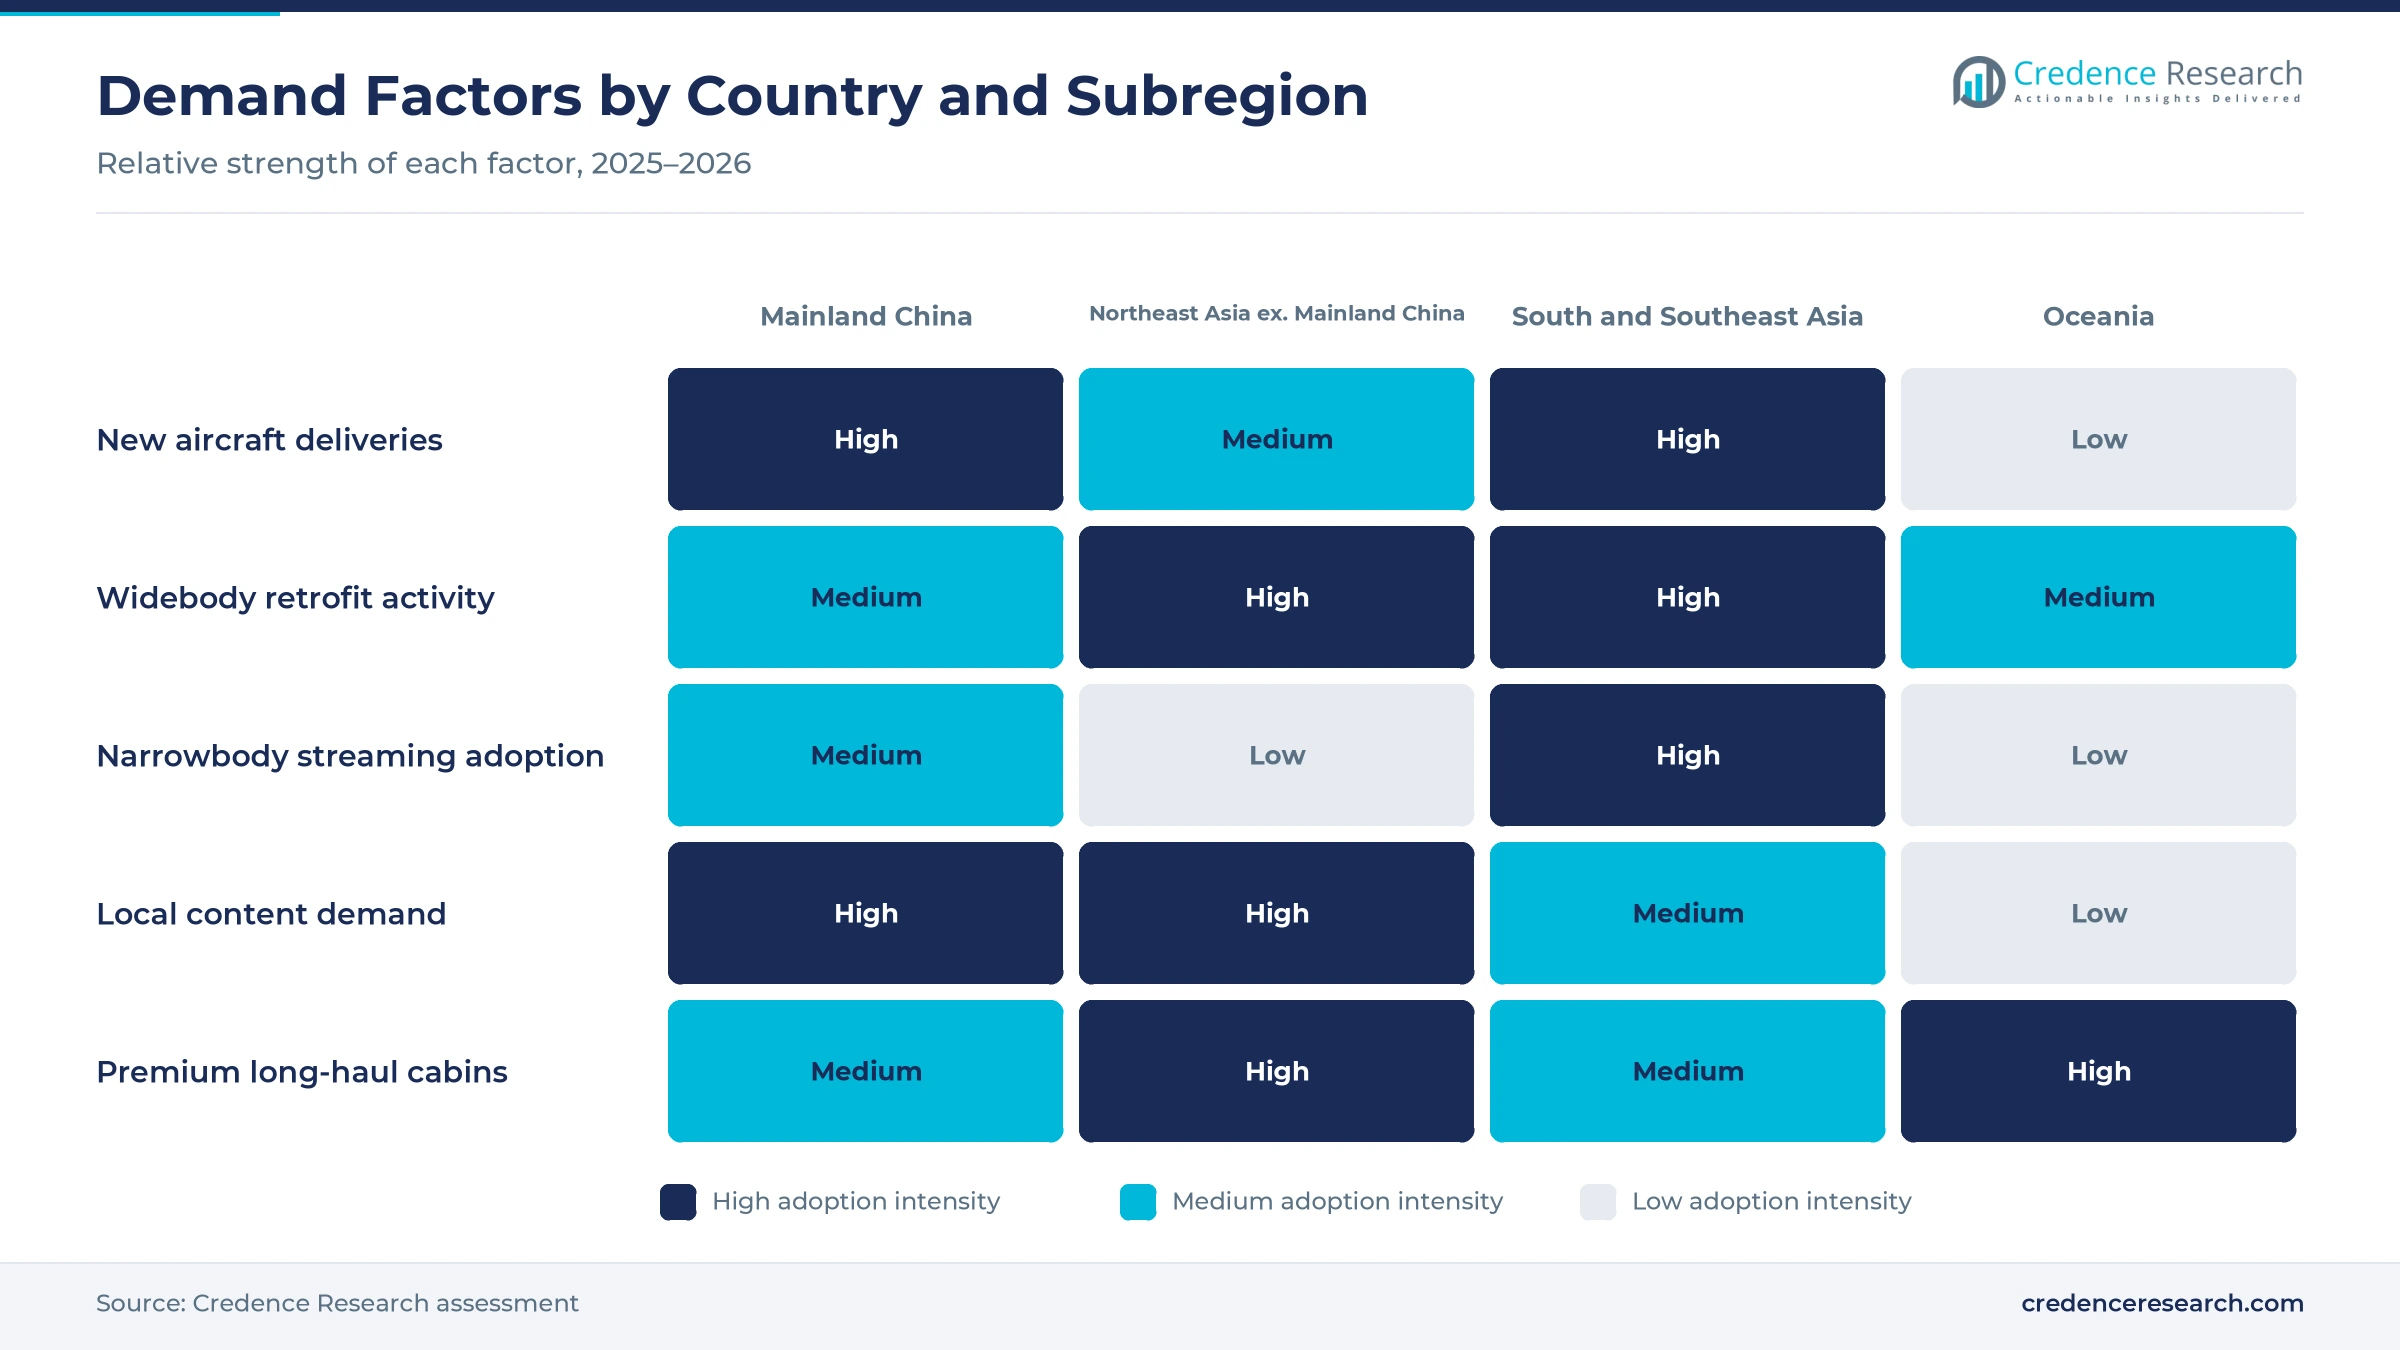
Fleet expansion and linefit demand lift orders, because every new aircraft delivered with seatback screens or a streaming server adds a complete entertainment system. Airbus expects the world passenger fleet to grow from 23,310 aircraft at the end of 2025 to 45,550 by the end of 2045, with Asia Pacific the fastest-growing region. Boeing projected in September 2024 that China would need 8,830 new airplanes through 2043, including 1,575 widebodies. Air India announced on April 9, 2025, that it selected Panasonic Avionics Astrova for 34 new widebody aircraft, according to Panasonic Avionics. As a result, OEM linefit holds 58.0% of 2025 value and grows at 8.77% a year.
Why do cabin refurbishment programs replace platforms?
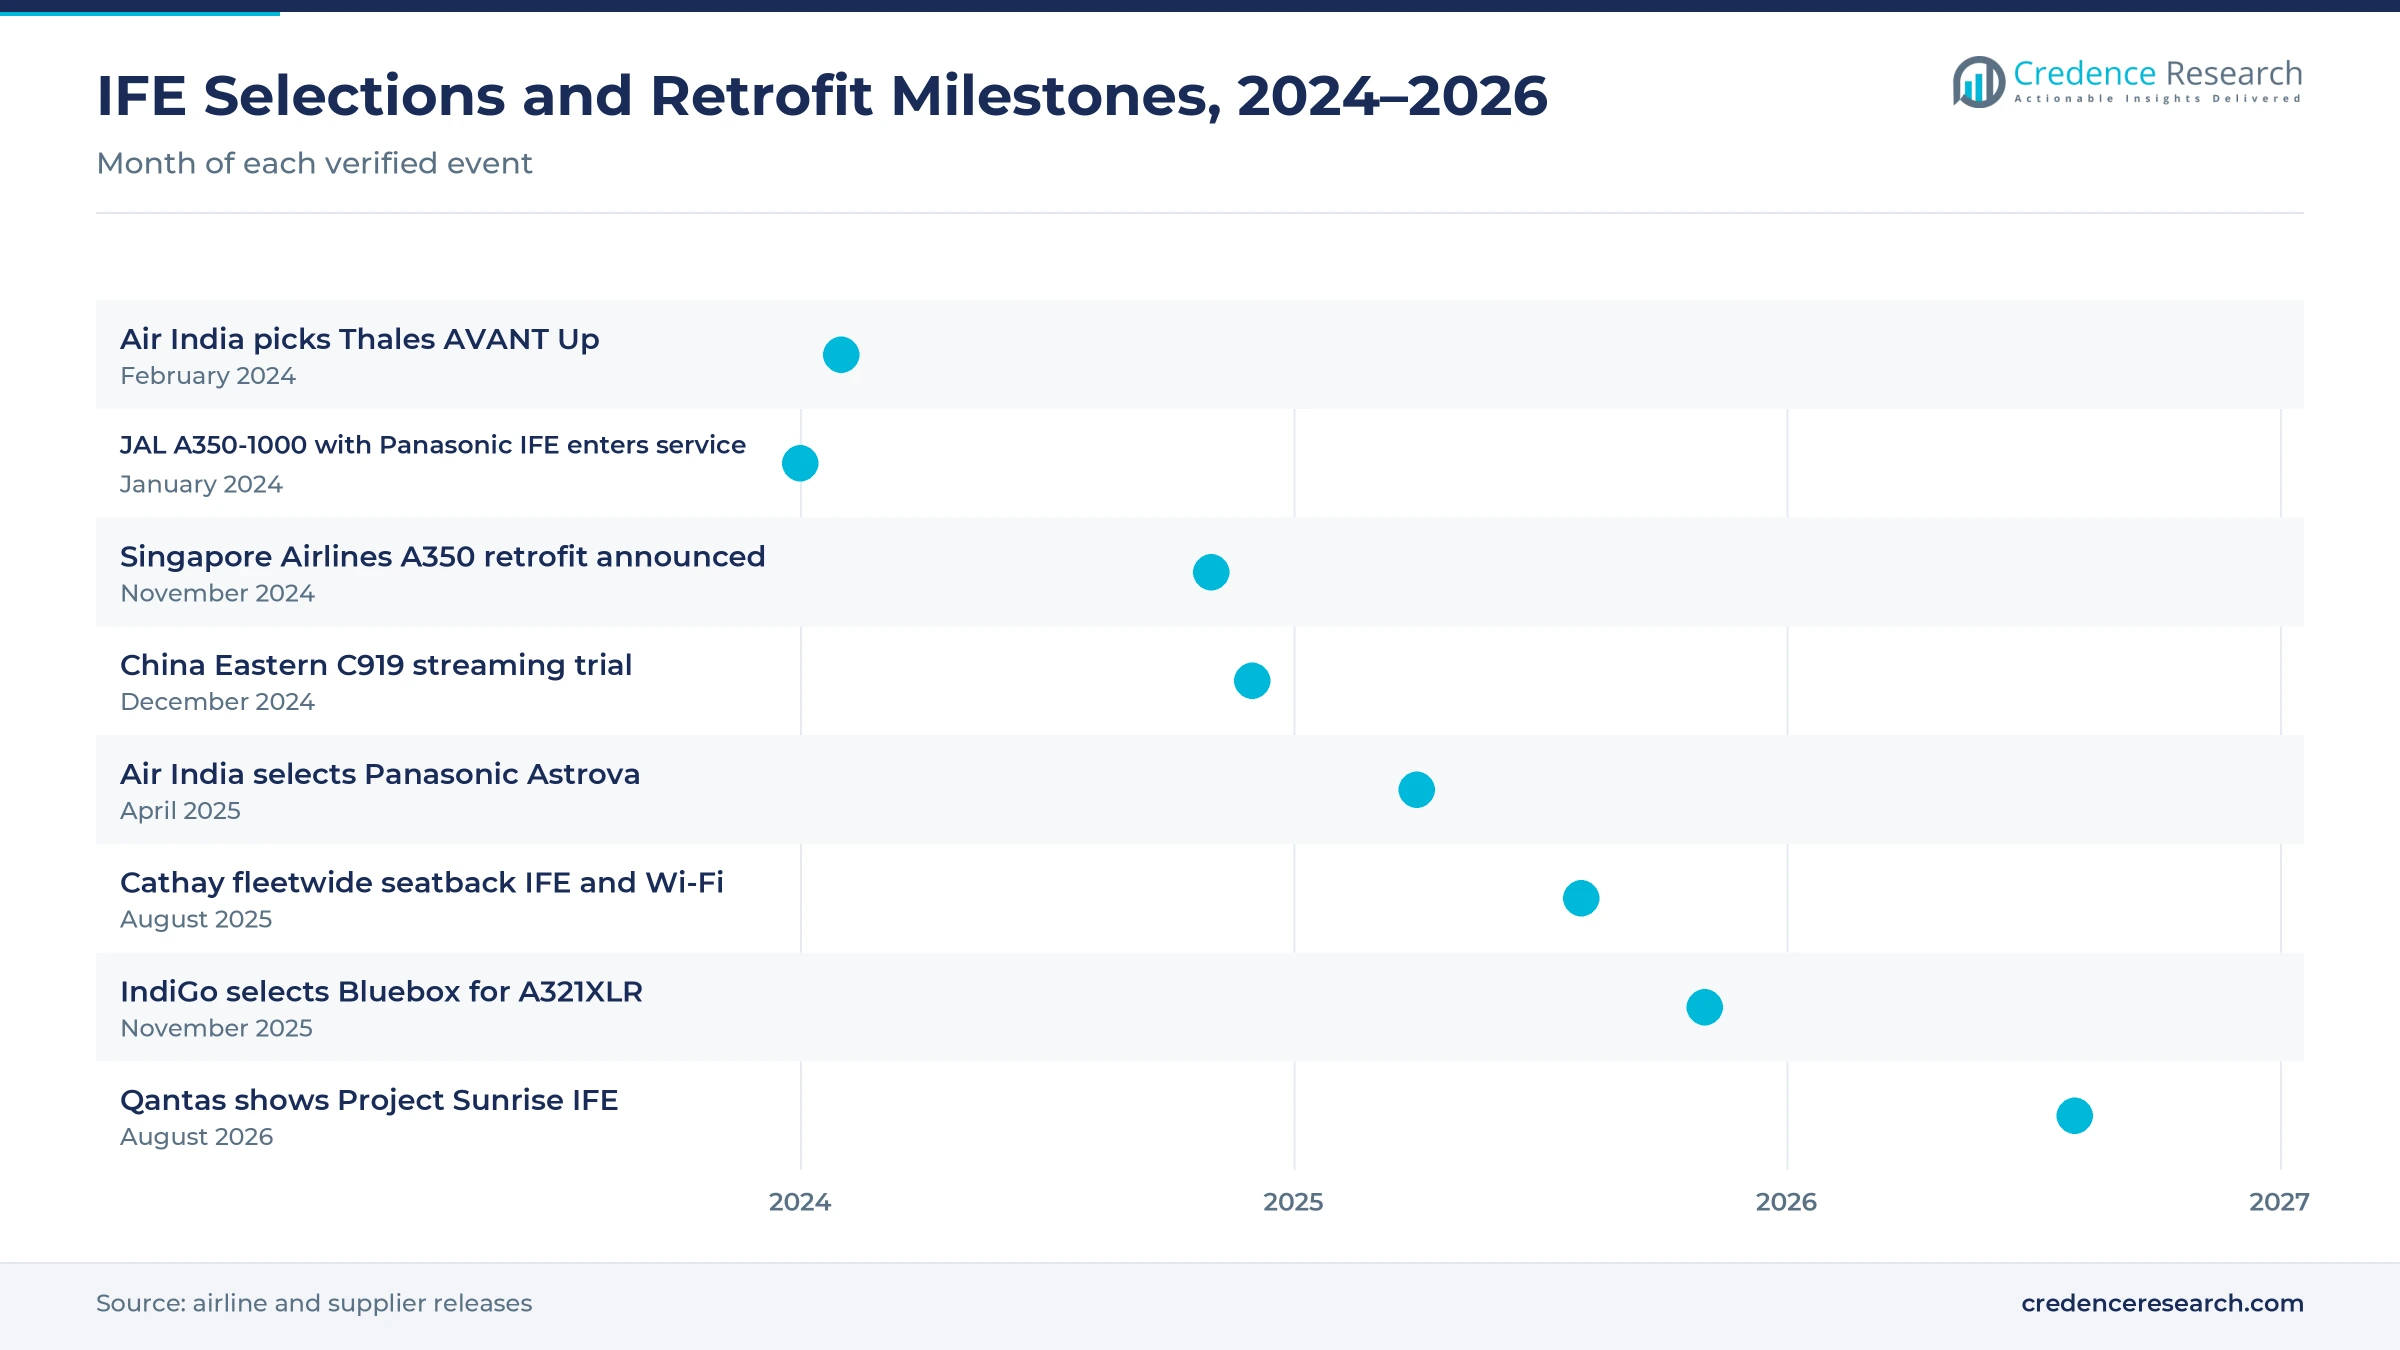
Cabin refurbishment programs replace older platforms, because airlines want new screens, power and software on aircraft that still have many years of service left. Air India chose Thales AVANT Up in February 2024 to retrofit 40 Boeing 777 and 787 aircraft and fit 11 new jets, according to Air India. Its USD 400 million retrofit program covers 27 legacy A320neo jets, 26 787-8s due by mid-2027 and 13 777-300ERs due by October 2028. Singapore Airlines announced in November 2024 a S$1.1 billion retrofit of 41 A350-900s with new screens, due by the end of 2030. In turn, permanent retrofit work keeps a large share of system value.
How do content localization and digital engagement add value?
Content localization and digital engagement add value, because airlines use entertainment screens and apps to serve many languages and to sell their own brand. Japan Airlines linked its Panasonic system on 13 new A350-1000s to its mobile app, so passengers can build favorites lists before a flight. Cathay Pacific announced on April 9, 2025, that it would offer seatback entertainment and onboard Wi-Fi on every aircraft from August 2025. China Eastern also built its own Chinese content library for the streaming system on its ninth C919 in late 2024. As a result, content and software services grow at a faster rate than display hardware.
Why does Asian traffic growth support system demand?
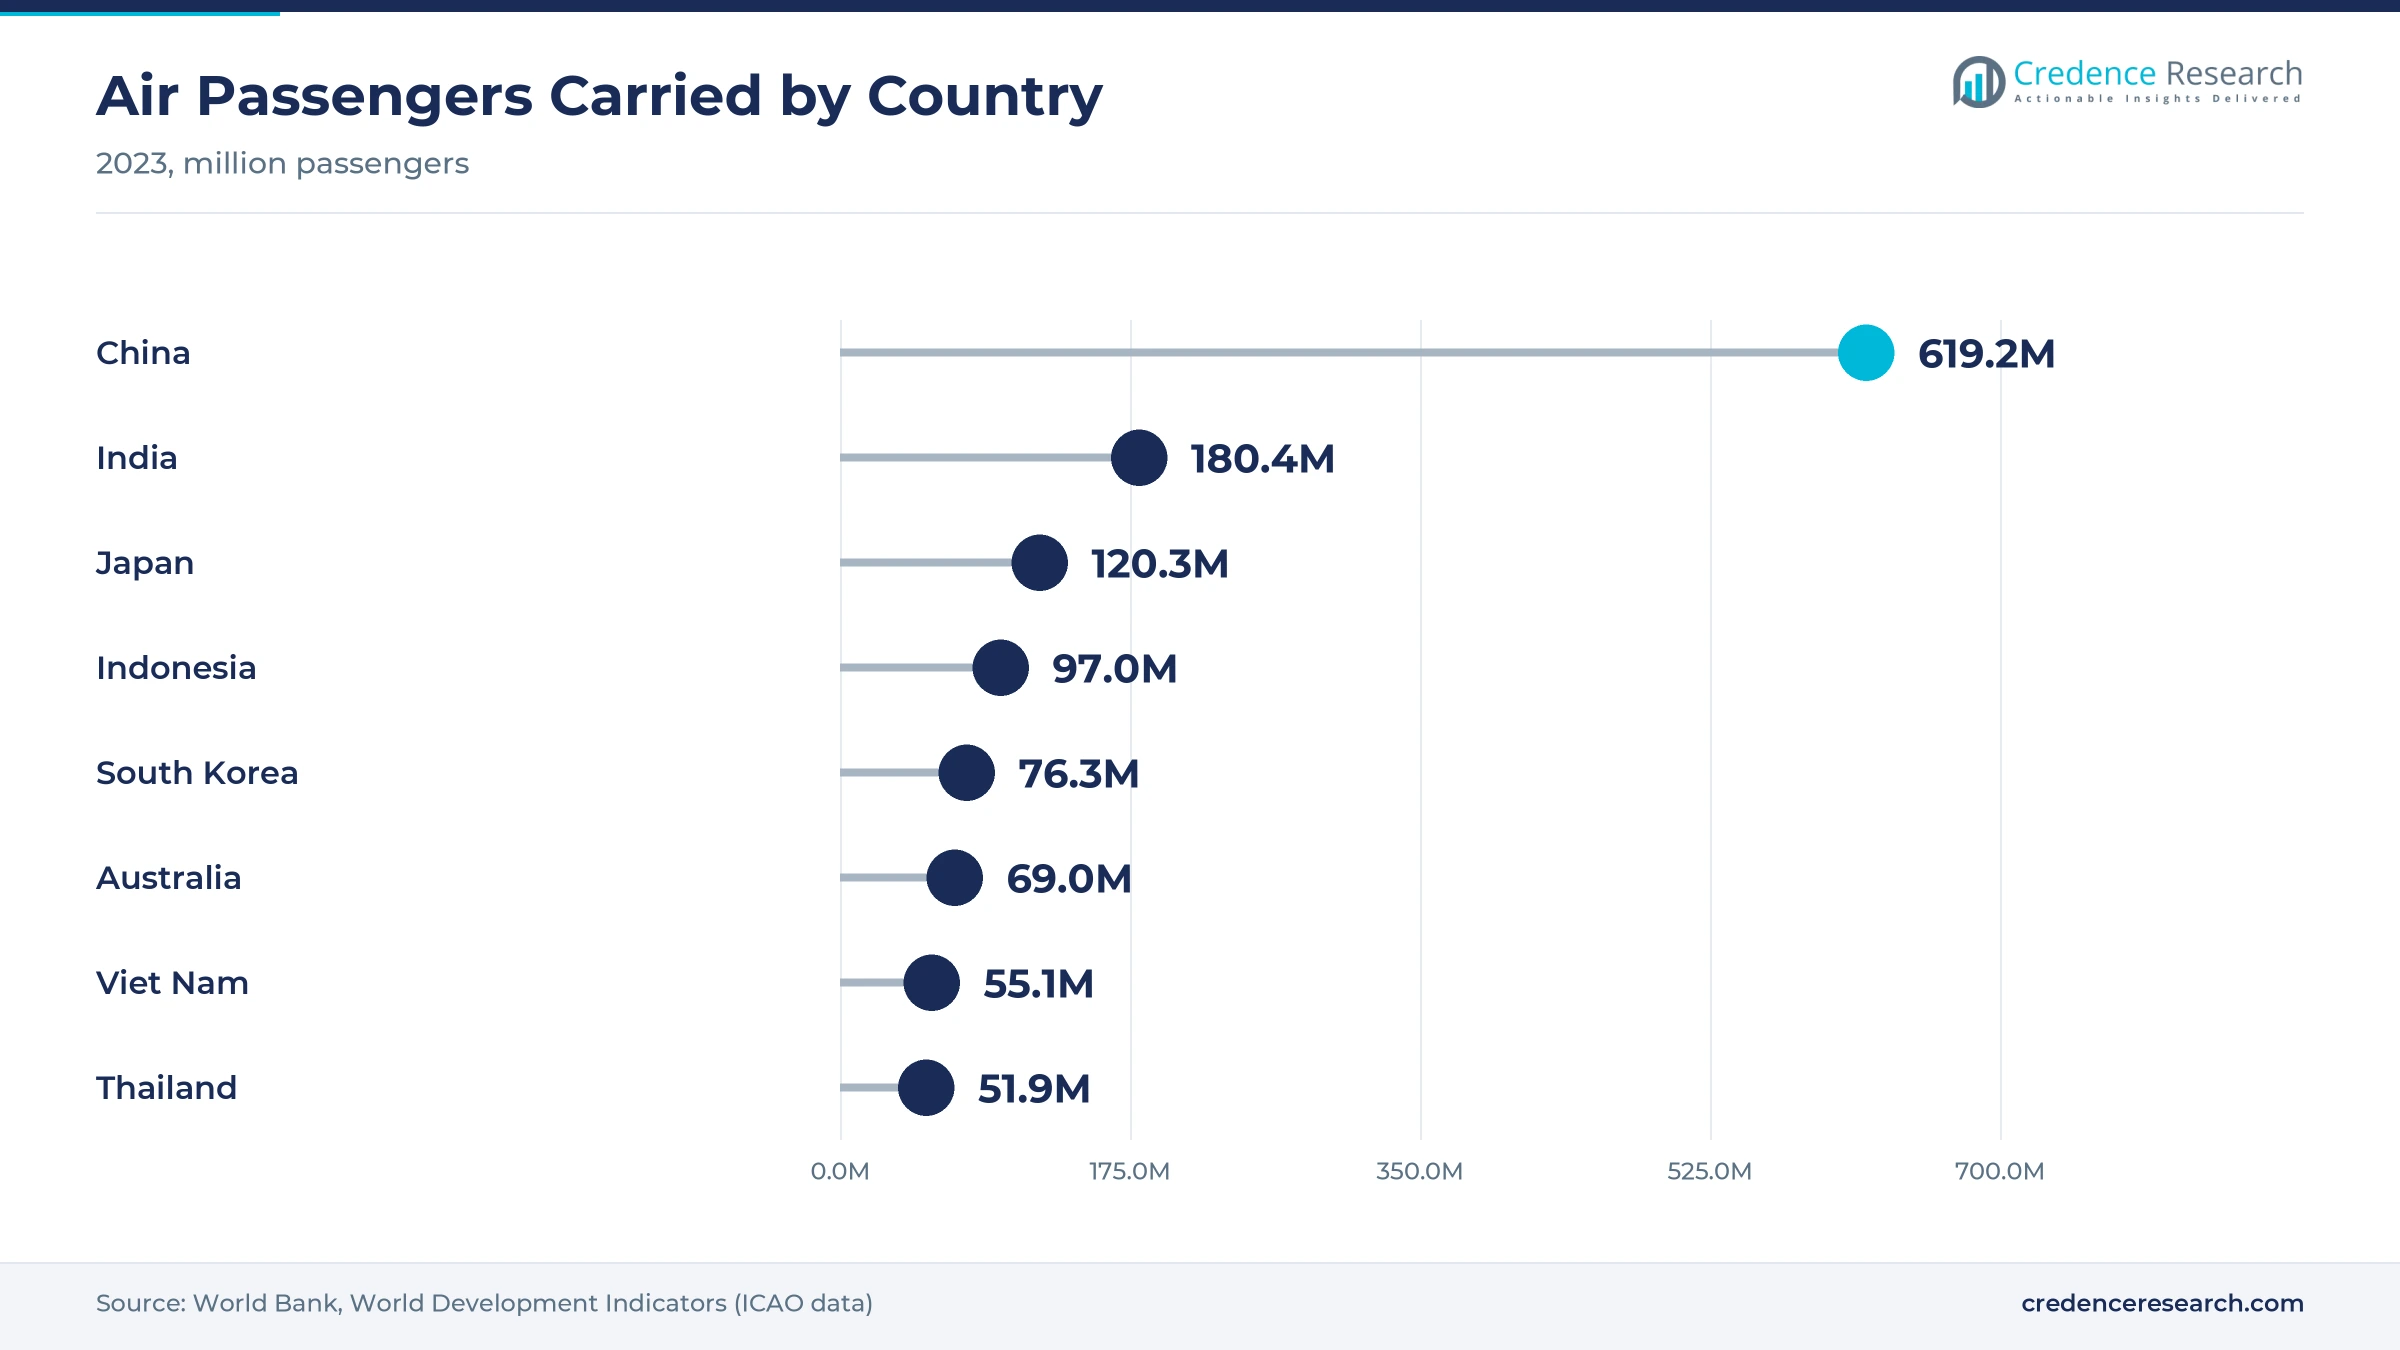
Asian traffic growth supports system demand, because more passengers and longer trips require more aircraft and more seats with entertainment. Asia Pacific airlines grew revenue passenger kilometers 7.8% in 2025, above the industry rate of 5.3%, according to IATA. Their load factor rose to 84.2% in the same year. Airports in Mainland China handled nearly 1.53 billion passenger trips in 2025, up 4.8% from 2024, while Airbus ranks domestic India as the fastest-growing traffic flow at 9.3% a year. In turn, airlines order more aircraft with seatback screens or streaming servers, and they announced several large cabin programs in 2025.
Streaming IFE, Bluetooth audio and 4K screens gain ground
How is the shift to streaming IFE changing narrowbody cabins?
The shift to streaming IFE is changing narrowbody cabins, because servers and wireless access points weigh less and cost less than a screen at every seat. IndiGo signed for the Bluebox Blueview platform for its 69 A321XLRs in November 2025, according to APEX. Passengers on the 195-seat jets will open films, games and a live map on their own devices. China Eastern began offline streaming on its ninth C919 in late 2024 and plans to extend it to its other C919s after the trial. As a result, wireless IFE infrastructure grows at 9.70% a year, the fastest solution rate, as more low-cost carriers follow the same path.
Why is the rise of Bluetooth audio and 4K screens notable?
The rise of Bluetooth audio and 4K screens is notable, because airlines now match the picture and sound passengers expect from their own phones and televisions. The Astrova system chosen by Air India uses 4K OLED HDR10+ screens, spatial audio and 67W USB-C power at each seat. Air India's Thales AVANT Up system uses 4K QLED screens with two Bluetooth links and built-in Wi-Fi. Japan Airlines also lets passengers in all cabins pair their own Bluetooth headphones on its A350-1000s. In turn, embedded display hardware keeps 46.0% of 2025 value, because premium screens, audio and power raise the value of each seat that airlines equip.
Can ultra-long-haul flying open premium system demand?
Ultra-long-haul flying opens premium system demand, because flights of up to 22 hours need larger screens, more content and better power. Qantas unveiled its new Panasonic Astrova system for Project Sunrise A350-1000ULRs on Aug. 13, 2026, according to Executive Traveller. The aircraft will carry 32-inch screens in first class, 18-inch screens in business and 13.3-inch screens in economy. They also offer up to 100W of charging per passenger and a mode that syncs films for up to four travelers. As a result, Oceania holds 6.4% of 2025 value, and suppliers with premium widebody products gain the most from these long-range cabin programs.
Will Indian fleet growth open new linefit volumes?
Indian fleet growth opens new linefit volumes, because Indian airlines have placed some of the largest aircraft orders in the industry. IndiGo's 69 A321XLRs are part of a 2023 order for 500 A320neo family aircraft. Air India is taking 34 new widebodies with Astrova and 11 new jets with Thales systems, while retrofitting its legacy fleet. Airbus ranks domestic India as the fastest-growing traffic flow in its forecast, at 9.3% a year. In turn, South and Southeast Asia holds 12.3% of 2025 value, and suppliers that win Indian linefit selections secure long production runs as these deliveries arrive through the next decade.
Weight, supply delays and content costs test airlines
How does system weight raise airline fuel costs?
System weight raises airline fuel costs, because screens, cables and seat boxes add mass to every row of an aircraft. Low-cost airlines flying short routes often decide that seatback hardware does not pay back its fuel and maintenance costs, and many prefer to sell paid onboard extras instead. As a result, many narrowbody cabins in the region still have no entertainment system. Suppliers respond with lighter screens, fewer seat boxes and streaming servers that use passenger devices.
Why do supply chain delays slow retrofit programs?
Supply chain delays slow retrofit programs, because seats, screens and certification work must arrive together for each aircraft as part of wider cabin interior upgrades. Air India moved the start of its 777-300ER retrofit to early 2027, with completion targeted for October 2028, because of supply chain delays. In turn, airlines fly older systems for longer, and suppliers wait longer for revenue. Many respond with earlier ordering and phased cabin work during heavy checks.
How do content licensing costs squeeze budgets?
Content licensing costs squeeze budgets, because airlines must license films, television and music in many languages for each route network. Carriers in the region serve Chinese, Japanese, Korean, Hindi and other audiences on the same aircraft, which raises the cost of each library. As a result, smaller airlines often limit content or choose shared packages. Content providers respond with regional catalogs, shorter licensing windows and tools that match titles to routes.
Why does platform obsolescence strand older fleets?
Platform obsolescence strands older fleets, because screens and servers age faster than the aircraft that carry them. Systems installed a decade ago often lack 4K screens, Bluetooth audio and fast USB-C power. In turn, passengers compare these cabins with newer aircraft on the same route, which pushes airlines into costly retrofits. Suppliers respond with modular screens, software updates and longer support agreements for legacy platforms.
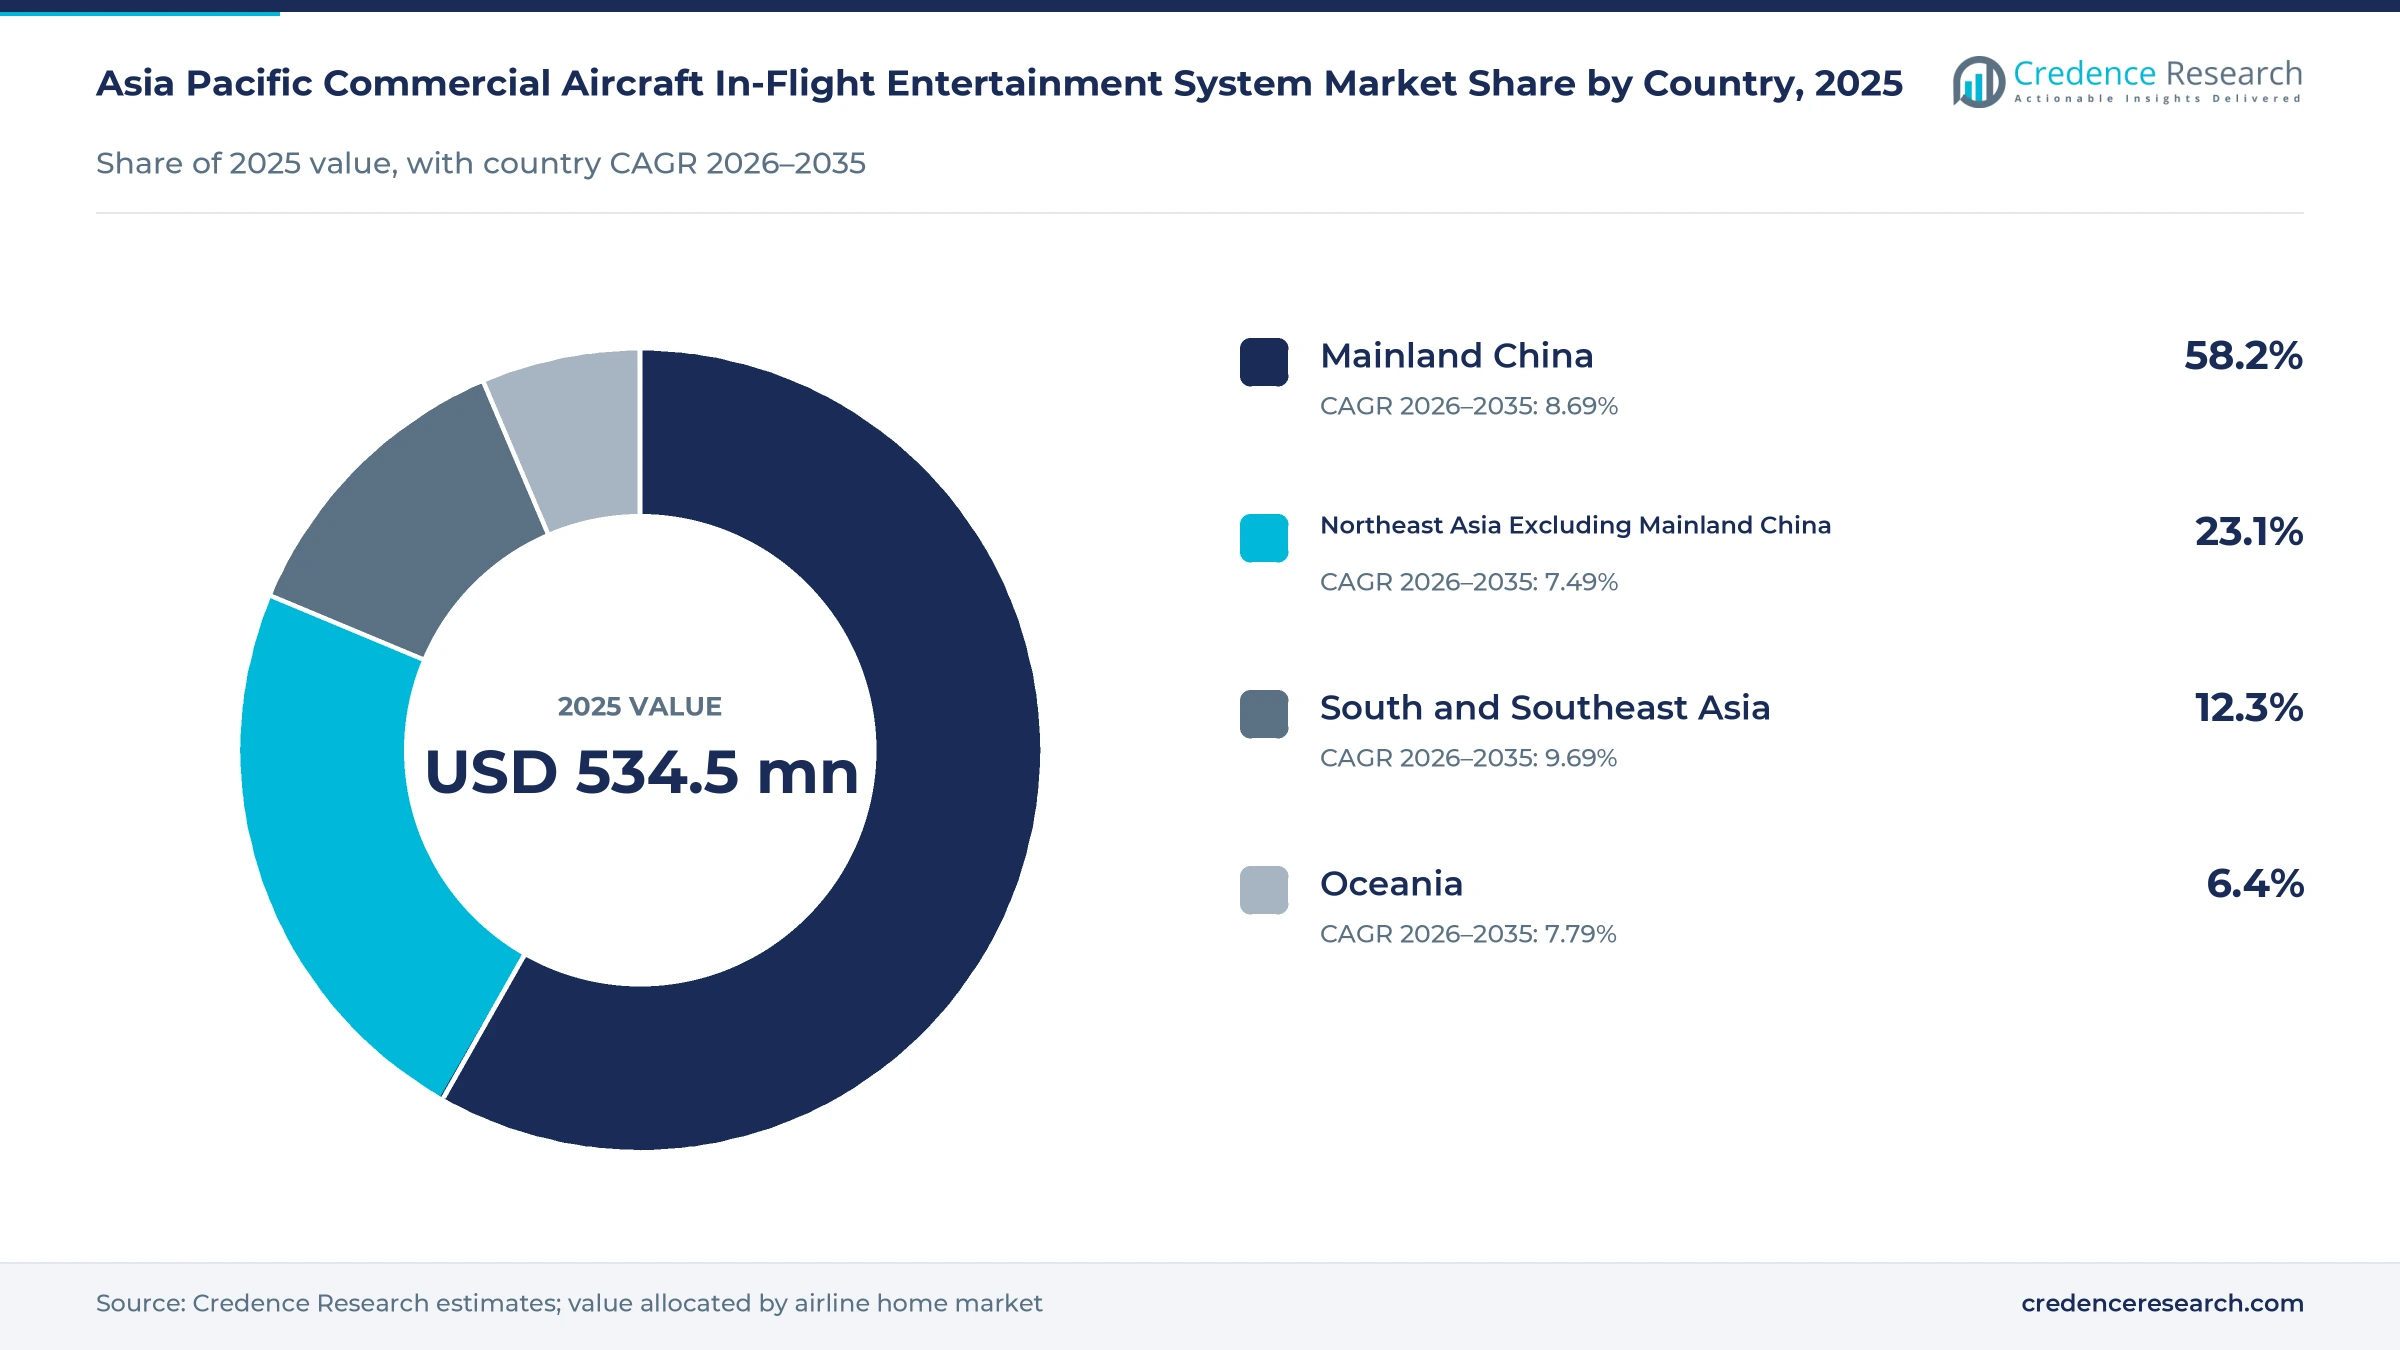
Mainland China leads while South Asia grows fastest
| Country | Value, 2025 (USD million) | Share, 2025 | CAGR, 2026–2035 |
|---|---|---|---|
| Mainland China | 311.1 | 58.2% | 8.69% |
| Northeast Asia Excluding Mainland China | 123.5 | 23.1% | 7.49% |
| South and Southeast Asia | 65.7 | 12.3% | 9.69% |
| Oceania | 34.2 | 6.4% | 7.79% |
Why does Mainland China keep the top share?
Mainland China held a 58.2% share of 2025 value and grows at 8.69% a year, because its airlines fly the largest domestic network in the region and keep adding aircraft. Airports in Mainland China handled nearly 1.53 billion passenger trips in 2025, up 4.8% from 2024. Boeing projected that the Chinese fleet would grow from 4,345 airplanes to 9,740 by 2043. China Eastern also added a streaming system to its ninth C919 in late 2024, which shows how domestic jets are adding entertainment.
How does Northeast Asia sustain premium demand?
Northeast Asia Excluding Mainland China held a 23.1% share of 2025 value and grows at 7.49% a year, because Japanese, Korean, Hong Kong and Taiwanese carriers run large long-haul fleets. Japan Airlines fitted Panasonic systems on 13 new A350-1000s from January 2024. Cathay Pacific offers seatback entertainment and Wi-Fi on every aircraft from August 2025. Growth is slower than in South Asia, because most of these fleets already have modern screens.
Why is South and Southeast Asia the fastest-growing area?
South and Southeast Asia held a 12.3% share of 2025 value and grows fastest at 9.69% a year, because Indian and Southeast Asian carriers are taking large aircraft orders. Air India is adding 34 Astrova-equipped widebodies and retrofitting its legacy fleet under a USD 400 million program. IndiGo will stream content on 69 A321XLRs, and Singapore Airlines is refitting 41 A350-900s by the end of 2030.
What role does Oceania play in premium cabins?
Oceania held a 6.4% share of 2025 value, because Qantas and other carriers fly long routes with premium cabins. Qantas will use Panasonic Astrova screens on its Project Sunrise A350-1000ULRs from late 2027 and in its new A330 economy cabin.
Linefit selections and retrofit programs from 2024 to 2026
| Development | Status and market relevance |
|---|---|
| In February 2024, Air India chose Thales AVANT Up to retrofit 40 Boeing 777 and 787 aircraft and fit 11 new jets. | Retrofit and linefit work through 2025 |
| In April 2025, Air India selected Panasonic Avionics Astrova for 34 new A350 and 787-9 aircraft. | Linefit installs on new widebody deliveries |
| In April 2025, Cathay Pacific said it would offer seatback entertainment and Wi-Fi on every aircraft from August 2025. | Fleetwide coverage in place from August 2025 |
| In November 2025, IndiGo selected the Bluebox Blueview streaming platform for its 69 A321XLRs. | Linefit through the Airbus Open Software Platform |
| In August 2026, Qantas showed its Panasonic Astrova system for Project Sunrise A350-1000ULRs. | Service planned from late 2027 |
OLED screens, streaming servers and open software spread
- 4K OLED and QLED seatback screens deliver high-contrast pictures with Bluetooth audio and USB-C power, which suit widebody cabins on Air India, Qantas and other long-haul fleets.
- Wireless streaming servers send films, games and maps to passengers' own phones and tablets, which suits low-cost and narrowbody fleets such as the IndiGo A321XLRs.
- Open software platforms let airlines load third-party entertainment applications on linefit hardware, which IndiGo uses through the Airbus Open Software Platform.
- Interactive 3D moving maps show route, places of interest and flight data on seatback and personal devices, which ANA added across its fleet with FlightPath3D.
Need a Custom Version of This Report?
Tailor the scope, geography, or segments to your exact requirements.
- Custom geography or segment scope
- Direct access to our analyst team
Seatback incumbents and streaming specialists compete
Competition is split between seatback incumbents that supply complete linefit and retrofit systems, streaming specialists that serve narrowbody fleets, and content and software firms that keep libraries and maps current. Panasonic Avionics supplies Astrova to Air India and Qantas and serves Japan Airlines on its A350-1000s. Thales supplies AVANT Up to Air India for 40 retrofits and 11 new jets. FlightPath3D supplies moving maps to ANA, its 50th airline customer, while Anuvu provides content to Asiana Airlines across Panasonic platforms. Burrana supplies in-seat power to Greater Bay Airlines in Hong Kong. Rivals compete on screen quality, weight, software openness and support. Because airlines choose systems for an entire fleet, suppliers with proven reliability and strong local content partners win the most new programs.
Companies profiled and their roles in this market
| Company | Type | Role in the market |
|---|---|---|
| Panasonic Avionics Corporation | Seatback IFE supplier | Astrova for Air India and Qantas; A350-1000 systems for Japan Airlines |
| Thales Group | Seatback IFE supplier | AVANT Up for 40 Air India retrofits and 11 new jets |
| FlightPath3D | Moving map software | Interactive 3D maps for ANA, its 50th airline customer |
| Anuvu | Content services provider | Content for Asiana Airlines across Panasonic platforms |
| Burrana | Cabin power and IFE supplier | In-seat power for Greater Bay Airlines 737-800s |
Credence Research view on regional cabin entertainment
Credence Research's view is that Asia Pacific demand for in-flight entertainment systems will grow fast because airlines in the region are adding aircraft and refitting cabins at the same time. Mainland China remains the largest buyer, while India adds the most new linefit volume. Premium widebody cabins keep seatback screens, while low-cost narrowbodies move to streaming. Suppliers of commercial aircraft entertainment that combine light hardware, open software and strong local content should gain share fastest. Supply delays and content costs remain the main risks to this view.
How the regional IFE estimate was built
The report uses 2025 as the base year on a calendar basis, and market values come from the Credence Research model. That model combines aircraft deliveries, fleet plans, retrofit programs, air traffic statistics and company announcements on system selections. Segment splits and country growth rates are Credence Research estimates, while country shares follow the client-defined split. Sources used are public reports, official statistics, trade press and company releases, and no interviews or surveys were used for this in-flight entertainment system estimate.
Widebody deliveries and Indian growth carry gains to 2035
Entertainment system value is expected to reach USD 1.24 billion by 2035, an 8.50% CAGR during 2026–2035, as new widebodies arrive and airlines refit older cabins. Growth should stay strong through 2030 while Air India, Singapore Airlines and Chinese carriers complete current programs. After that, Indian and Southeast Asian deliveries and narrowbody streaming will carry more growth. Lighter hardware and open software would support adoption, while supply delays would slow retrofits. Suppliers with strong local content and service networks are expected to gain the most.
Frequently Asked Questions
How big is the Asia Pacific commercial aircraft in-flight entertainment system market?
Which solution type leads regional demand?
Which area leads the Asia Pacific in-flight entertainment market?
Which system did Air India select for its new widebodies?
How fast did Asia Pacific air traffic grow in 2025?
Why are low-cost airlines adopting streaming entertainment?
Who are the leading companies in Asia Pacific in-flight entertainment?
What are the main challenges for airlines and suppliers?
Table of Content
Chapter 1 Market Segmentation
- 1.1 Segmentation Framework
- 1.1.1 Product and Service Classification
- 1.1.2 Application and End-Use Classification
- 1.1.3 Technology and Solution Classification
- 1.1.4 Customer and Distribution Channel Classification
- 1.1.5 Geographic Segmentation
- 1.1.6 Market Segment Definitions and Boundaries
- 1.2 By Solution Type
- 1.2.1 Embedded Display Hardware
- 1.2.2 Wireless IFE Infrastructure
- 1.2.3 Content and Software Services
- 1.2.4 Integration and Maintenance Services
- 1.3 By Deployment Model
- 1.3.1 OEM Linefit
- 1.3.2 Permanent Retrofit
- 1.3.3 Portable Deployment
- 1.4 By Customer Type
- 1.4.1 Full-Service Network Airlines
- 1.4.2 Low-Cost Airlines
- 1.4.3 Regional Airlines
- 1.4.4 Charter Airlines
- 1.5 By Application
- 1.5.1 Narrowbody Cabin Entertainment
- 1.5.2 Widebody Cabin Entertainment
- 1.5.3 Regional Aircraft Entertainment
- 1.6 By Country
- 1.6.1 Mainland China
- 1.6.2 Northeast Asia Excluding Mainland China
- 1.6.3 South and Southeast Asia
- 1.6.4 Oceania
Chapter 2 Introduction
- 2.1 Report Objectives and Scope
- 2.2 Product Definition and Industry Terminology
- 2.3 Market Inclusions and Exclusions
- 2.4 Research Process
- 2.4.1 Primary Research and Expert Interviews
- 2.4.2 Secondary Research and Source Review
- 2.4.3 Top-Down and Bottom-Up Estimation
- 2.4.4 Data Triangulation and Verification
- 2.5 Market Size Measurement Basis
- 2.5.1 2025: USD 534.5 million → 2035: USD 1.24 billion
- 2.6 Historical and Forecast Reference Periods
- 2.6.1 Historical Period: 2018-2025
- 2.6.2 Base Year: 2025
- 2.6.3 Forecast Period: 2025-2035
- 2.7 Research Assumptions and Limitations
Chapter 3 Executive Summary
- 3.1 Market Snapshot and Key Findings
- 3.2 Base-Year Market Size, 2025
- 3.3 Forecast Market Size, 2035
- 3.4 Revenue and Volume Growth Outlook
- 3.5 Key Demand and Supply Indicators
- 3.6 Leading Market Segments
- 3.7 Fastest-Growing Market Opportunities
- 3.8 Regional Performance Highlights
- 3.9 Technology and Industry Transformation
- 3.10 Competitive Landscape Summary
- 3.11 Analyst View and Strategic Implications
Chapter 4 Asia Pacific Commercial Aircraft In-Flight Entertainment System Market Trends and Developments
- 4.1 Historical Industry Development, 2018-2025
- 4.2 Recent Market Trends and Developments
- 4.3 Demand and Customer Behavior Trends
- 4.4 Technology and Product Innovation
- 4.5 Artificial Intelligence, Automation and Digitalization
- 4.6 Local Manufacturing and Supply Chain Realignment
- 4.7 Industry Partnerships, Mergers and Acquisitions
- 4.8 Sustainability and Circular Economy Developments
- 4.9 Government and Private Sector Investment Trends
- 4.10 Emerging Business Models and Commercialization
- 4.11 Industry Developments and Announcements
Chapter 5 Asia Pacific Commercial Aircraft In-Flight Entertainment System Market Production, Supply and Demand Analysis
- 5.1 Demand Trend and Consumption Analysis, 2018-2025
- 5.2 Demand Forecast, 2025-2035
- 5.3 Production and Output Trend, 2018-2025
- 5.4 Production and Output Forecast, 2025-2035
- 5.5 Installed Capacity and Capacity Utilization
- 5.6 Company-Wise Production Plants and Statistics
- 5.6.1 Installed Production Capacity
- 5.6.2 Actual Production
- 5.6.3 Planned Capacity and Expansion Targets
- 5.7 Supply Chain Structure and Procurement Trends
- 5.8 Supply-Demand Gap and Bottlenecks
- 5.9 Import Dependence and Sourcing Structure
- 5.10 Contract Manufacturing and Outsourcing
- 5.11 Regional Supply and Demand Concentration
Chapter 6 Asia Pacific Commercial Aircraft In-Flight Entertainment System Market Pricing Analysis
- 6.1 Pricing Structure and Measurement
- 6.2 Historical Pricing Trends, 2018-2025
- 6.3 Pricing Outlook, 2025-2035
- 6.4 Average Selling Price and Unit Economics
- 6.5 Pricing by Product and Market Segment
- 6.6 Geographic Pricing Differences
- 6.7 Key Input, Energy, Labor and Logistics Costs
- 6.8 Contract Pricing and Purchasing Models
- 6.9 Pricing Sensitivity and Competitive Positioning
- 6.10 Price, Margin and Profitability Implications
Chapter 7 Asia Pacific Commercial Aircraft In-Flight Entertainment System Market Dynamics
- 7.1 Market Growth Drivers
- 7.1.1 Demand-Side Drivers
- 7.1.2 Technology and Innovation Drivers
- 7.1.3 Infrastructure and Investment Drivers
- 7.1.4 Regulatory and Policy Drivers
- 7.2 Market Restraints
- 7.2.1 Cost and Affordability Constraints
- 7.2.2 Technology and Adoption Barriers
- 7.2.3 Supply Chain and Operational Constraints
- 7.3 Market Challenges
- 7.3.1 Competitive Pressure and Margin Erosion
- 7.3.2 Skills, Infrastructure and Implementation Gaps
- 7.4 Emerging Market Opportunities
- 7.5 Market Dynamics Impact and Time-Horizon Assessment
Chapter 8 Asia Pacific Commercial Aircraft In-Flight Entertainment System Value Chain Analysis
- 8.1 Industry Value Chain Overview
- 8.2 Upstream Suppliers and Critical Inputs
- 8.3 Technology and Component Providers
- 8.4 Manufacturing or Service Delivery
- 8.5 Distribution, Channel Partners and Integrators
- 8.6 Downstream Applications and End Users
- 8.7 Value Addition and Profit Pools
- 8.8 Vertical Integration and Outsourcing
- 8.9 Supplier Concentration and Risk
- 8.10 Supply Chain Localization and Resilience
Chapter 9 Asia Pacific Commercial Aircraft In-Flight Entertainment System Market Regulations and Policies
- 9.1 Relevant Laws, Standards and Compliance Frameworks
- 9.2 Product, Service, Safety and Quality Requirements
- 9.3 Government Policies, Incentives and Subsidies
- 9.4 Imports, Exports and Trade Barriers
- 9.5 Public Procurement and Local Content Requirements
- 9.6 Environmental and Sustainability Compliance
- 9.7 Upcoming Policy Changes and Market Implications
Chapter 10 Asia Pacific Commercial Aircraft In-Flight Entertainment System Market Hotspots and Opportunities
- 10.1 Market Opportunity Mapping and Growth Hotspots
- 10.2 High-Growth Applications and Customer Groups
- 10.3 Underserved Markets and White-Space Opportunities
- 10.4 Emerging Technology and Product Opportunities
- 10.5 New Capacity and Investment Hotspots
- 10.6 Market Entry and Expansion Opportunities
- 10.7 Distribution and Partnership Opportunities
- 10.8 Near-Term and Long-Term Commercial Potential
- 10.9 Opportunity Attractiveness and Execution Risks
Chapter 11 Asia Pacific Commercial Aircraft In-Flight Entertainment System Market Outlook, 2025-2035
- 11.1 Market Size and Analysis
- 11.1.1 Revenue (Market Measurement: 2025: USD 534.5 million → 2035: USD 1.24 billion)
- 11.1.2 Market Volume and Quantity Sold
- 11.1.3 Historical Market Size, 2018-2025
- 11.1.4 Base-Year Market Size, 2025
- 11.2 Market Forecast, 2025-2035
- 11.2.1 Revenue Forecast to 2035
- 11.2.2 Volume Forecast to 2035
- 11.2.3 CAGR and Year-on-Year Growth
- 11.2.4 Incremental Revenue Opportunity
- 11.3 Forecast Assumptions and Scenario Analysis
- 11.3.1 Base-Case Forecast
- 11.3.2 Optimistic and Conservative Scenarios
- 11.3.3 Technology, Pricing and Policy Sensitivities
- 11.4 Market Attractiveness and Growth Outlook
Chapter 12 Asia Pacific Commercial Aircraft In-Flight Entertainment System Market Segmentation and Outlook
- 12.1 Segmentation Summary and Market Shares, 2025
- 12.2 Largest and Fastest-Growing Segments
- 12.3 By Solution Type - Market Size and Forecast, 2025-2035
- 12.3.1 Segment Definition and Scope
- 12.3.2 Historical Market Size, 2018-2025
- 12.3.3 Revenue Forecast, 2025-2035
- 12.3.4 Volume Forecast, 2025-2035
- 12.3.5 Base-Year Market Share, 2025
- 12.3.6 Segment CAGR and Growth Drivers
- 12.3.7 Subsegment Market Size and Forecast
- 12.3.7.1 Embedded Display Hardware
- 12.3.7.2 Wireless IFE Infrastructure
- 12.3.7.3 Content and Software Services
- 12.3.7.4 Integration and Maintenance Services
- 12.3.8 Subsegment Pricing and Adoption Trends
- 12.3.9 Leading Suppliers and Competition
- 12.3.10 Regional Demand and Opportunities
- 12.4 By Deployment Model - Market Size and Forecast, 2025-2035
- 12.4.1 Segment Definition and Scope
- 12.4.2 Historical Market Size, 2018-2025
- 12.4.3 Revenue Forecast, 2025-2035
- 12.4.4 Volume Forecast, 2025-2035
- 12.4.5 Base-Year Market Share, 2025
- 12.4.6 Segment CAGR and Growth Drivers
- 12.4.7 Subsegment Market Size and Forecast
- 12.4.7.1 OEM Linefit
- 12.4.7.2 Permanent Retrofit
- 12.4.7.3 Portable Deployment
- 12.4.8 Subsegment Pricing and Adoption Trends
- 12.4.9 Leading Suppliers and Competition
- 12.4.10 Regional Demand and Opportunities
- 12.5 By Customer Type - Market Size and Forecast, 2025-2035
- 12.5.1 Segment Definition and Scope
- 12.5.2 Historical Market Size, 2018-2025
- 12.5.3 Revenue Forecast, 2025-2035
- 12.5.4 Volume Forecast, 2025-2035
- 12.5.5 Base-Year Market Share, 2025
- 12.5.6 Segment CAGR and Growth Drivers
- 12.5.7 Subsegment Market Size and Forecast
- 12.5.7.1 Full-Service Network Airlines
- 12.5.7.2 Low-Cost Airlines
- 12.5.7.3 Regional Airlines
- 12.5.7.4 Charter Airlines
- 12.5.8 Subsegment Pricing and Adoption Trends
- 12.5.9 Leading Suppliers and Competition
- 12.5.10 Regional Demand and Opportunities
- 12.6 By Application - Market Size and Forecast, 2025-2035
- 12.6.1 Segment Definition and Scope
- 12.6.2 Historical Market Size, 2018-2025
- 12.6.3 Revenue Forecast, 2025-2035
- 12.6.4 Volume Forecast, 2025-2035
- 12.6.5 Base-Year Market Share, 2025
- 12.6.6 Segment CAGR and Growth Drivers
- 12.6.7 Subsegment Market Size and Forecast
- 12.6.7.1 Narrowbody Cabin Entertainment
- 12.6.7.2 Widebody Cabin Entertainment
- 12.6.7.3 Regional Aircraft Entertainment
- 12.6.8 Subsegment Pricing and Adoption Trends
- 12.6.9 Leading Suppliers and Competition
- 12.6.10 Regional Demand and Opportunities
- 12.7 By Country - Market Size and Forecast, 2025-2035
- 12.7.1 Segment Definition and Scope
- 12.7.2 Historical Market Size, 2018-2025
- 12.7.3 Revenue Forecast, 2025-2035
- 12.7.4 Volume Forecast, 2025-2035
- 12.7.5 Base-Year Market Share, 2025
- 12.7.6 Segment CAGR and Growth Drivers
- 12.7.7 Subsegment Market Size and Forecast
- 12.7.7.1 Mainland China
- 12.7.7.2 Northeast Asia Excluding Mainland China
- 12.7.7.3 South and Southeast Asia
- 12.7.7.4 Oceania
- 12.7.8 Subsegment Pricing and Adoption Trends
- 12.7.9 Leading Suppliers and Competition
- 12.7.10 Regional Demand and Opportunities
- 12.8 Segment Growth Comparison
- 12.9 Segment Attractiveness and Priority Matrix
Chapter 13 Asia Pacific Commercial Aircraft In-Flight Entertainment System End-Use and Application Market Outlook
- 13.1 End-Use Industry and Customer Demand Structure
- 13.2 Leading Applications and Customer Groups
- 13.3 End-Use Market Size, Share and Forecast
- 13.4 Major End-Use Industry Deep Dives
- 13.4.1 Customer Requirements and Use Cases
- 13.4.2 Demand and Replacement Cycles
- 13.4.3 Technical and Regulatory Considerations
- 13.4.4 Purchasing and Procurement Models
- 13.4.5 Leading Vendors and Distribution Channels
- 13.4.6 Forecast and Commercial Opportunities
- 13.5 Emerging Applications and Cross-Segment Demand
- 13.6 End-Use Industry Investment Priorities
Chapter 14 Asia Pacific Commercial Aircraft In-Flight Entertainment System Geographic Market Outlook, 2025-2035
- 14.1 Regional Market Size and Country-Level Shares, 2025
- 14.2 Country Market Size Comparison, 2025
- 14.3 Country Market Forecasts, 2025-2035
- 14.4 Subregional Industrial and Demand Clusters
- 14.5 Intra-Regional Pricing and Cost Differences
- 14.6 Cross-Border Trade and Supply Networks
- 14.7 Regional Supply and Demand Balances
- 14.8 Country Opportunity Comparison and Prioritization
Note: Every listed country is covered on the structure shown under the first country.
Chapter 15 Asia Pacific Commercial Aircraft In-Flight Entertainment System Technology, Innovation and Sustainability Outlook
- 15.1 Technology Landscape and Maturity
- 15.2 Product, Process and Service Innovation
- 15.3 AI, Automation and Digital Tools in the Industry
- 15.4 Technology Adoption and Performance Benchmarking
- 15.5 Innovation Pipeline and R&D Investment
- 15.6 Patent and Intellectual Property Trends
- 15.7 Energy Efficiency and Resource Management
- 15.8 Sustainability, Recycling and Circularity
- 15.9 Technology Roadmap, 2025-2035
- 15.10 Risks of Obsolescence and Technology Substitution
Chapter 16 Asia Pacific Commercial Aircraft In-Flight Entertainment System Market Key Strategic Imperatives
- 16.1 Growth and Market Entry Priorities
- 16.2 High-Return Products and Segments
- 16.3 Pricing, Profitability and Cost Optimization
- 16.4 Technology Investment and Product Differentiation
- 16.5 Supply Chain Localization and Resilience
- 16.6 Distribution and Customer Acquisition
- 16.7 Partnership, Acquisition and Capacity Strategy
- 16.8 Regional Expansion Priorities
- 16.9 Short-, Medium- and Long-Term Actions
Chapter 17 Competition Outlook
- 17.1 Industry Competition Characteristics
- 17.2 Market Structure and Concentration
- 17.3 Market Share and Competitive Positioning, 2025
- 17.4 Company-Wise Revenue and Product Benchmarking
- 17.5 Production and Service Capacity Benchmarking
- 17.6 Technology, Pricing and Differentiation
- 17.7 Regional Footprint and Distribution Strength
- 17.8 Mergers, Acquisitions and Strategic Alliances
- 17.9 New Entrants and Competitive Threats
- 17.10 Porter's Five Forces and Industry Attractiveness
- 17.11 Competitive Outlook, 2025-2035
Chapter 18 Company Profiles
- 18.1 Company Coverage and Selection Criteria
- 18.2 Panasonic Avionics Corporation
- 18.2.1 Business Description
- 18.2.2 Company Ownership and Geographic Presence
- 18.2.3 Product and Service Portfolio
- 18.2.4 Manufacturing and Operating Footprint
- 18.2.5 Production Capacity and Expansion Plans
- 18.2.6 Financial Performance and Investment
- 18.2.7 Market Share and Competitive Position
- 18.2.8 Technology and Innovation Capabilities
- 18.2.9 Strategic Alliances or Partnerships
- 18.2.10 Recent Developments
- 18.2.11 Growth Strategy and Outlook
- 18.3 Thales Group
- 18.4 Anuvu
- 18.5 RAVE Aerospace
- 18.6 Burrana
- 18.7 Latecoere
- 18.8 IMAGIK International Corp.
- 18.9 Inflight Dublin
- 18.10 FlightPath3D
- 18.11 Stellar Entertainment
- 18.12 Other Relevant Market Participants
Note: Every listed company is profiled on the structure shown under the first company. The company list is preliminary and may change based on research findings, market developments, data availability and client requirements.
Chapter 19 Disclaimer
- 19.1 Research and Forecast Disclaimer
- 19.2 Data Source and Estimation Limitations
Note: The depth of individual sections depends on data availability for this market. Volume, capacity, trade and other unit-based metrics are included where applicable.

