
Aerospace and Defense 3D Printing Market: USD 2.04 billion in 2025, Rising on Engines, Space and Naval Parts
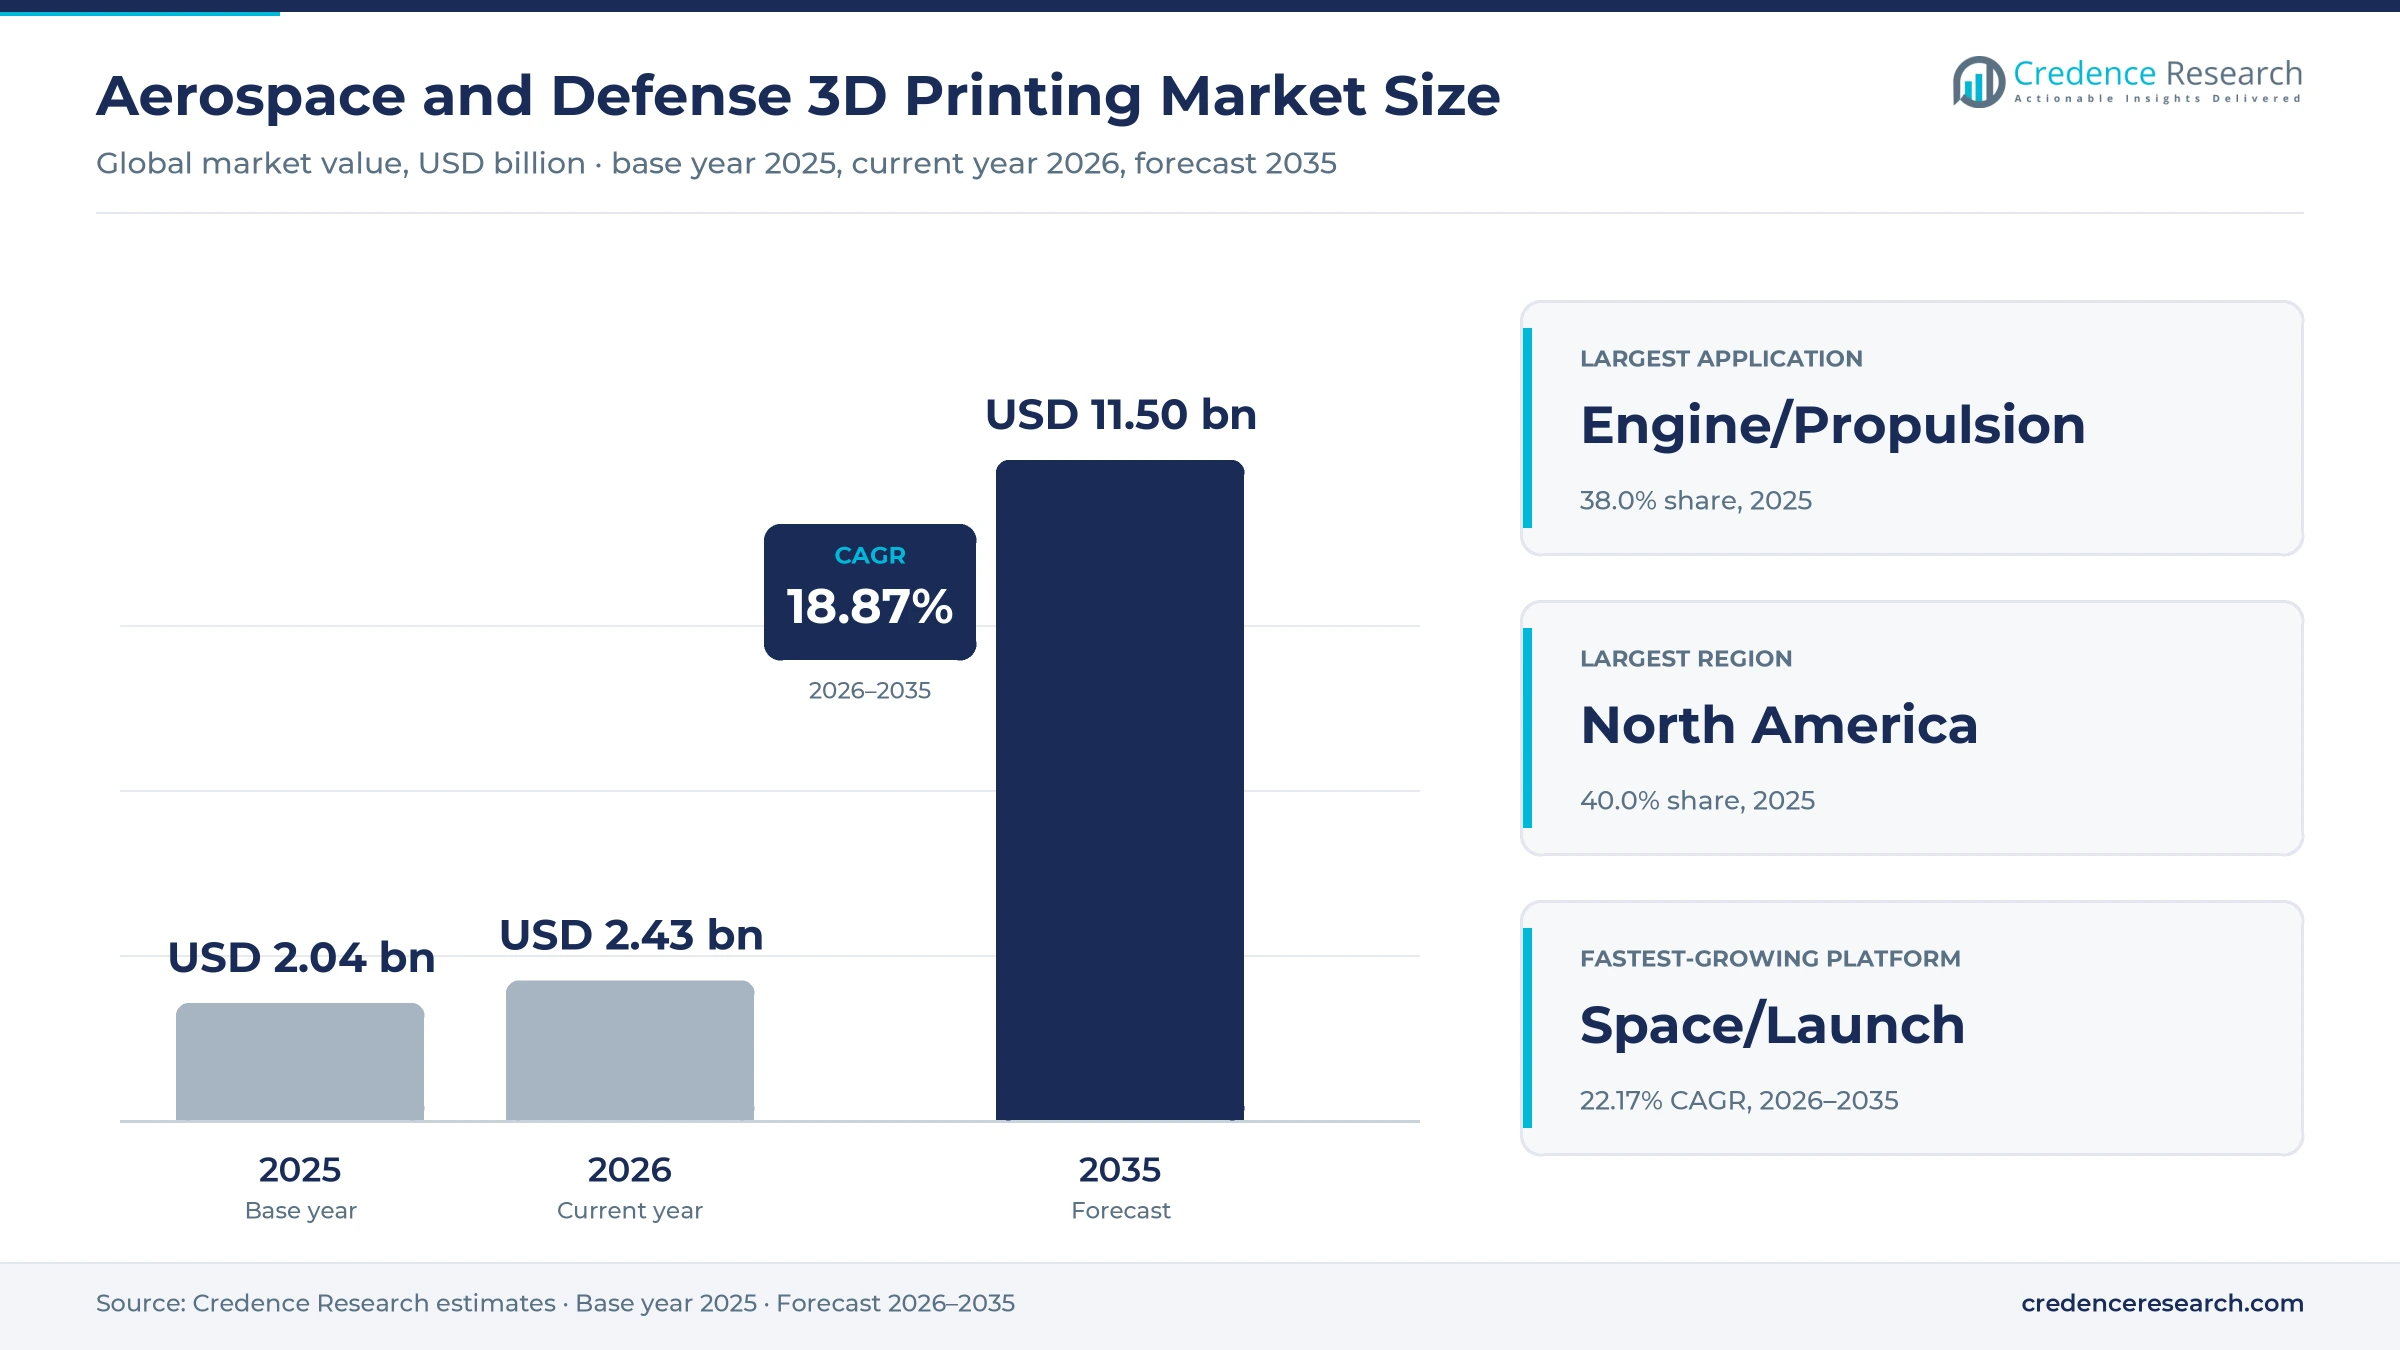
Each CFM LEAP engine carries 19 printed fuel nozzles, and the wider aerospace and defense 3D printing market reached USD 2.04 billion in 2025. Credence Research forecasts USD 11.50 billion by 2035, a 18.87% CAGR over 2026–2035, with 2026 estimated at USD 2.43 billion. Engine makers, rocket builders and defense shipyards are moving printed metal parts from trials into series production.
The market is shifting from prototypes toward certified flight and ship hardware. That shift raises spending on large metal printers, qualified powders and inspection, and it favors suppliers with aerospace quality approvals.
What does the market cover?
The market covers printers, materials, software and services used to make parts for aircraft, drones, spacecraft, launch vehicles and defense systems. The scope includes:
- Powder bed fusion, electron beam melting, directed energy deposition, binder jetting and polymer processes such as FDM, SLA and SLS.
- Titanium, nickel and aluminum alloys, high-performance polymers, composites and ceramics.
- Engine and propulsion parts, structures, cabin parts, space components, tooling and MRO parts.
The scope excludes the value of the finished aircraft or system and conventional castings and forgings. Values are in USD billion at current prices, allocated to the region of the part buyer. Commercial aviation alone is covered in the commercial aerospace 3D printing market.
How was the estimate built?
All figures are Credence Research estimates, built from printer installations at aerospace sites, material use per build, printed part counts on engine and aircraft programs, launch and defense production rates, and supplier disclosures.
Which program shows the shift to production?
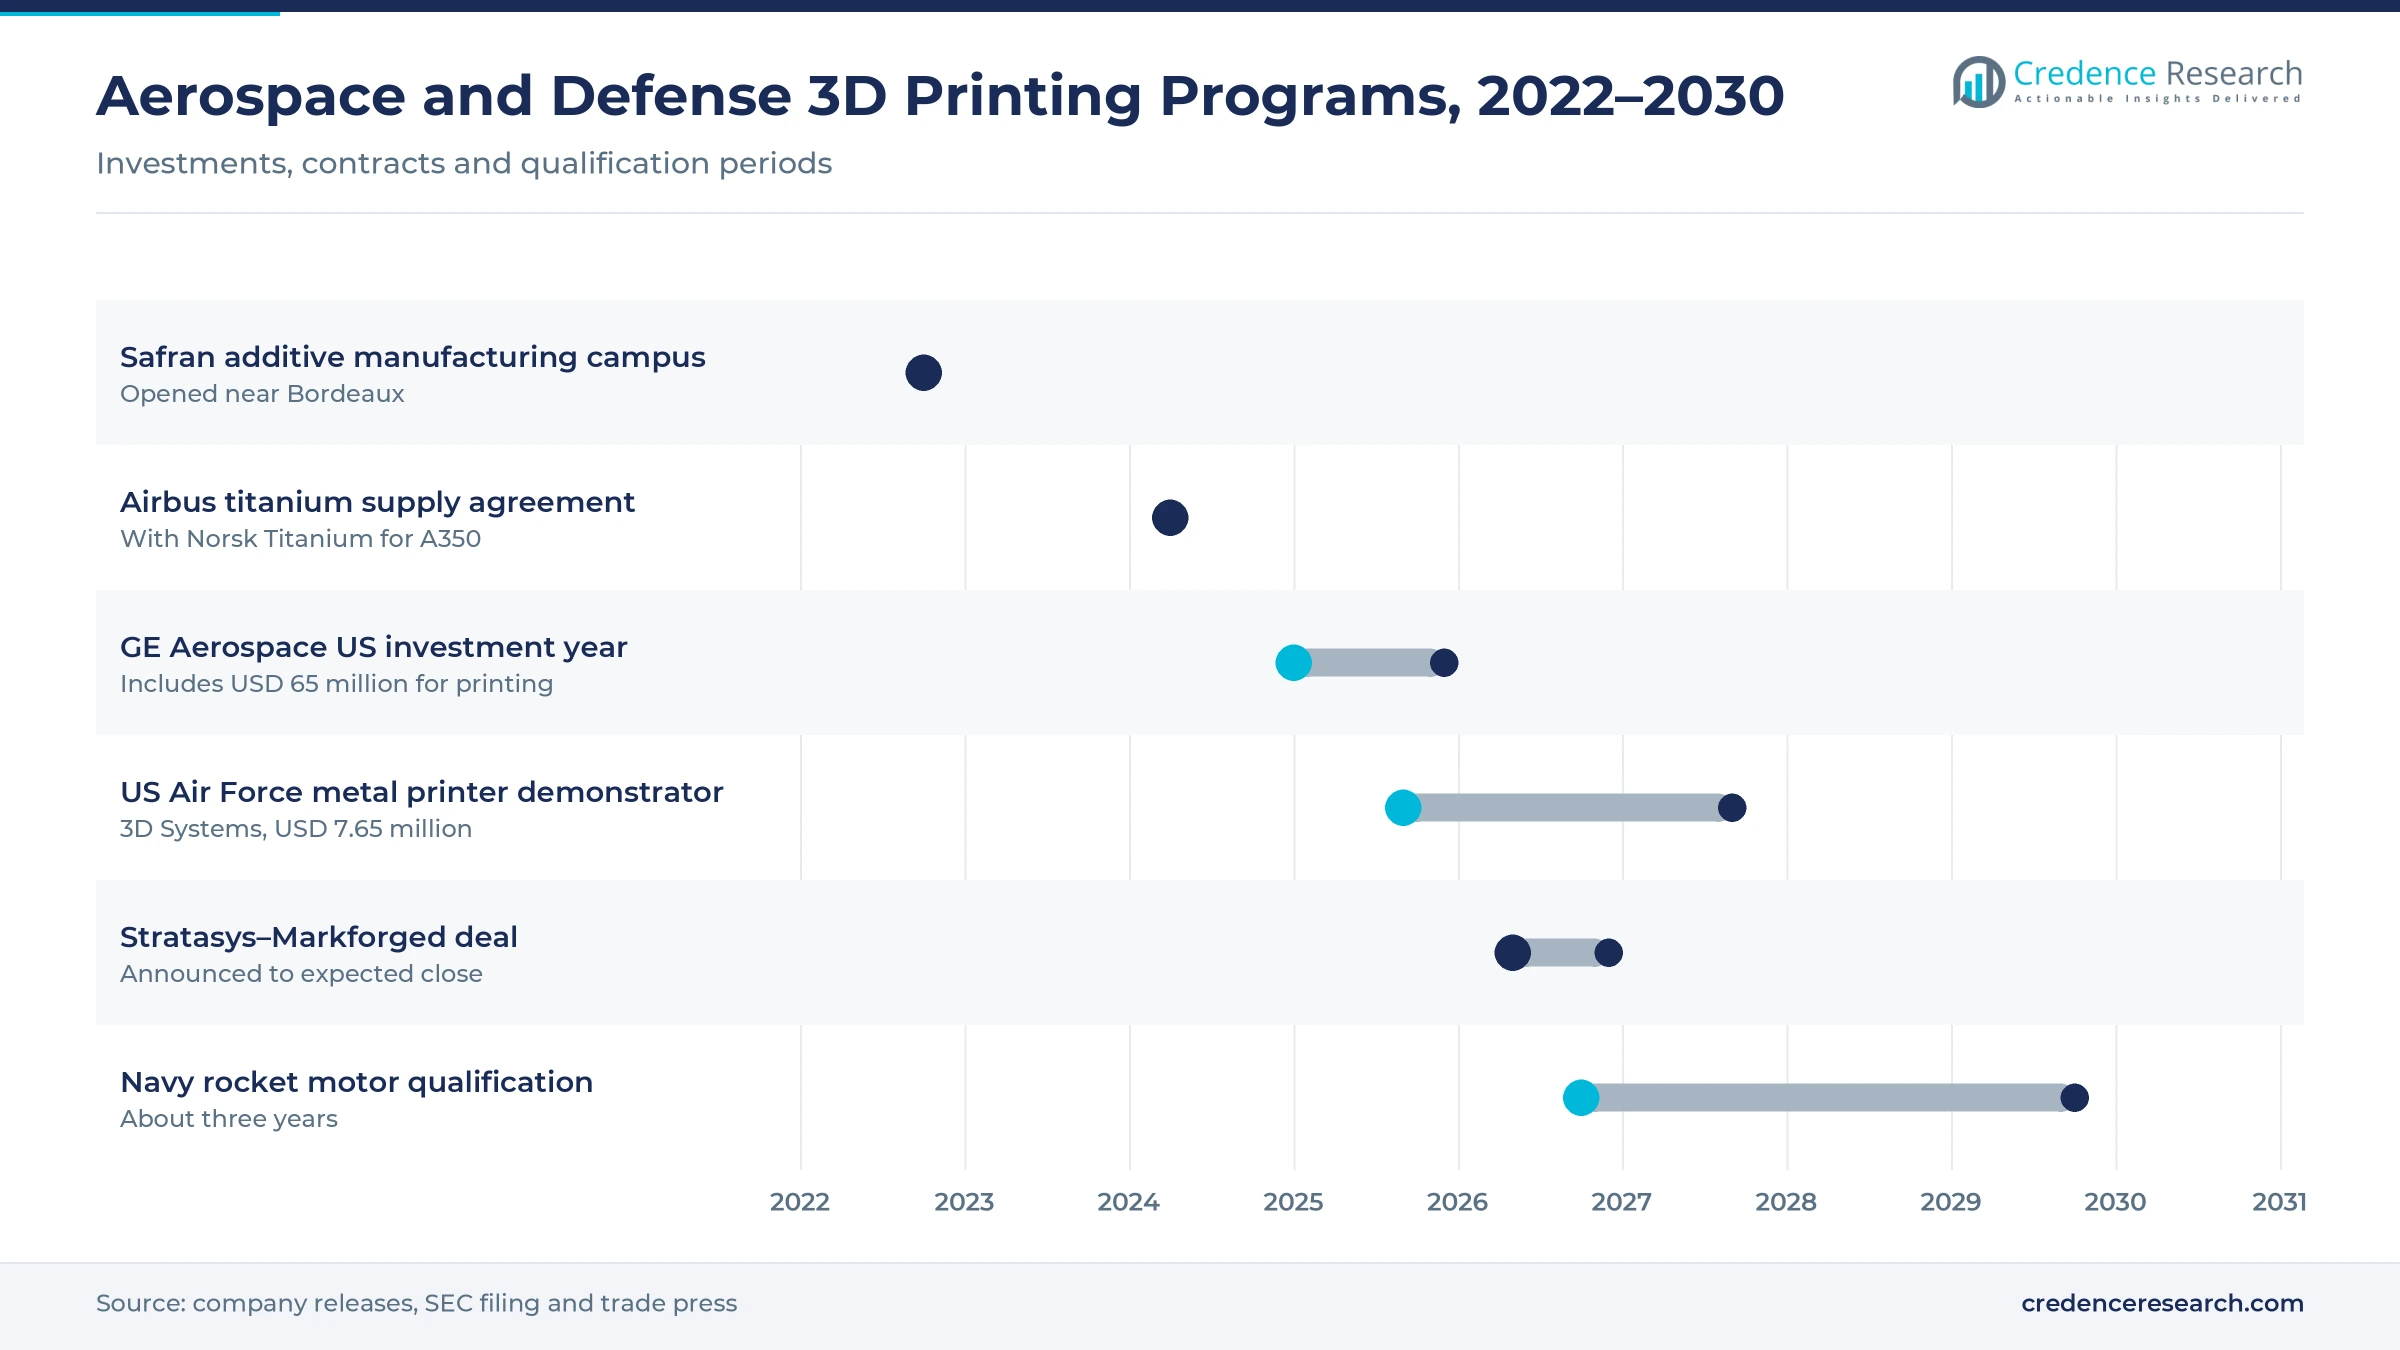
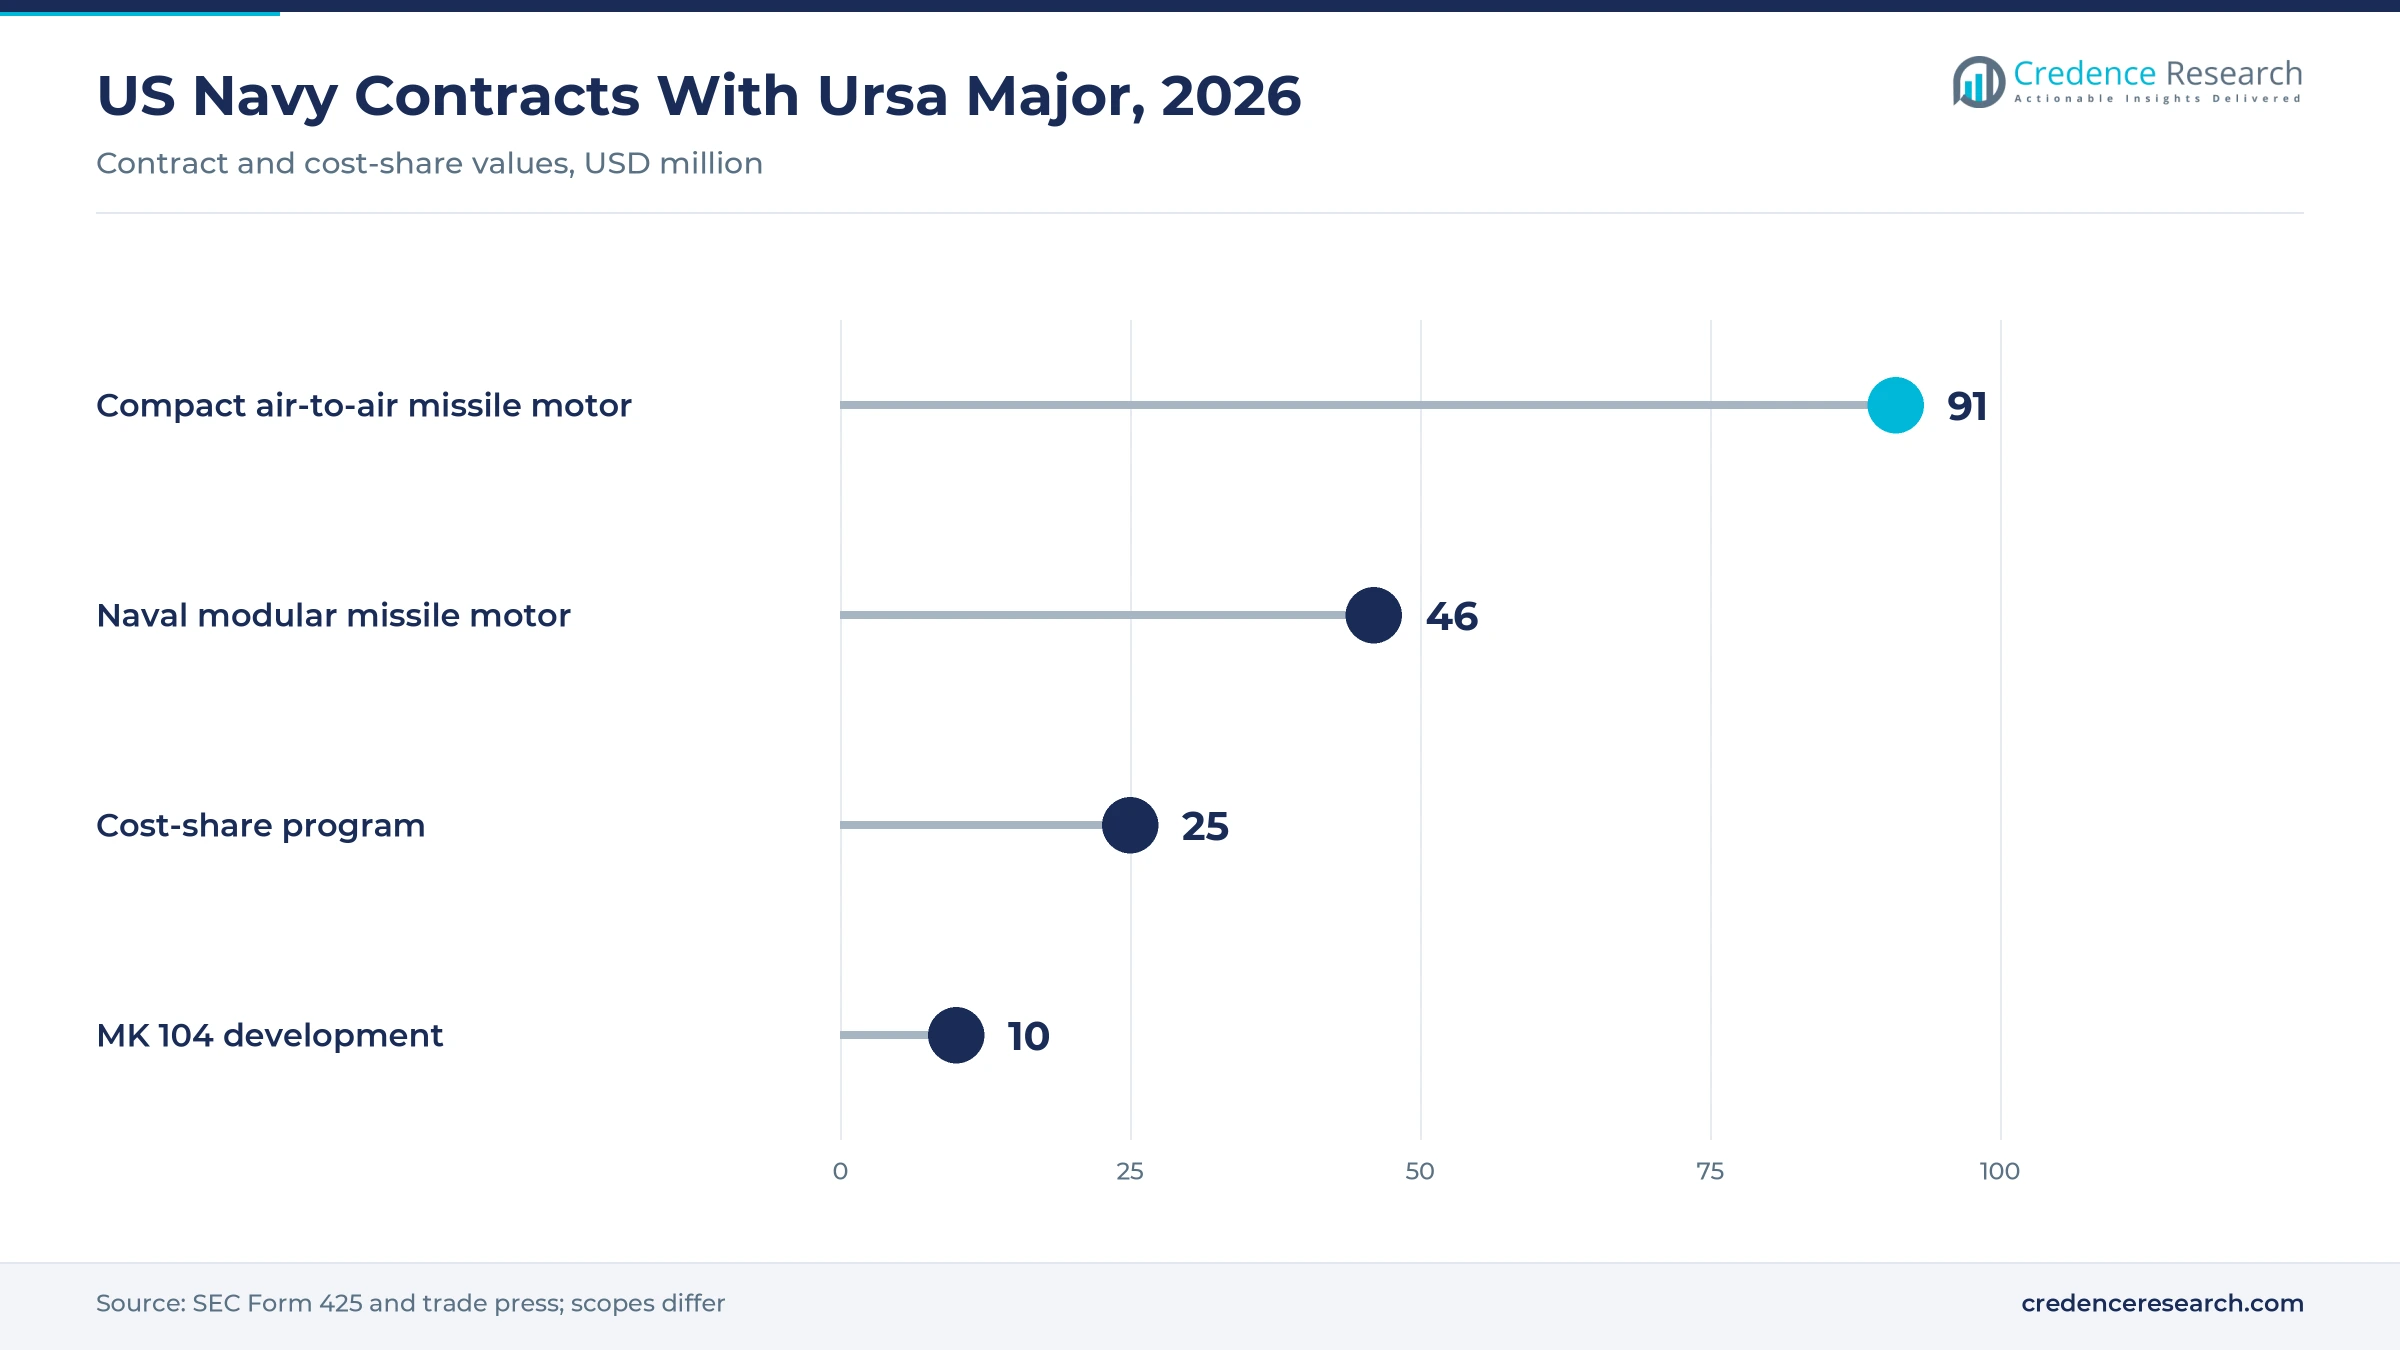
Rocket Lab completed its 1,000th Rutherford engine, whose main parts are printed, in May 2026 and plans about 200 a year. Defense is following: the US Navy awarded rocket-motor maker Ursa Major contracts worth USD 137 million in October 2026 for motors made with a process that includes additive manufacturing, as described in a filing with the SEC.
Report Attributes
| Attribute | Details |
|---|---|
| Historical Period | 2018–2024 |
| Base Year | 2025 |
| Forecast Period | 2026–2035 |
| Market Size 2025 | USD 2.04 billion |
| Market Size 2026 (estimate) | USD 2.43 billion |
| Market Size 2035 (forecast) | USD 11.50 billion |
| CAGR (2026–2035) | 18.87% |
| Segments Covered | By Offering, By Material, By Technology, By Platform, By Application, By End User |
| Regions Covered | North America, Europe, Asia Pacific, Latin America, Middle East & Africa |
| Companies Covered | Stratasys Ltd., 3D Systems Corporation, Materialise NV, EOS GmbH, Nikon SLM Solutions, GE Aerospace, Boeing, Airbus, Lockheed Martin, Safran |
Aerospace Defense 3D Printing Market Insights
- The aerospace and defense 3D printing market was worth USD 2.04 billion in 2025 and is forecast to reach USD 11.50 billion by 2035, a 18.87% CAGR over 2026–2035.
- Credence Research estimates the market at USD 2.43 billion in 2026, the current year.
- Qualification of flight-critical and propulsion parts is the strongest driver, adding about 5.2 percentage points to the forecast CAGR.
- Metals hold 62.0% of value; powder bed fusion leads technologies with 44.0%.
- Spacecraft and launch vehicles grow fastest by platform at 22.17% a year.
- North America is the largest region at 40.0%; Asia Pacific grows fastest at 20.35%.
Metal Powder Bed Fusion for Engine and Propulsion Parts Leads
Which offering leads?
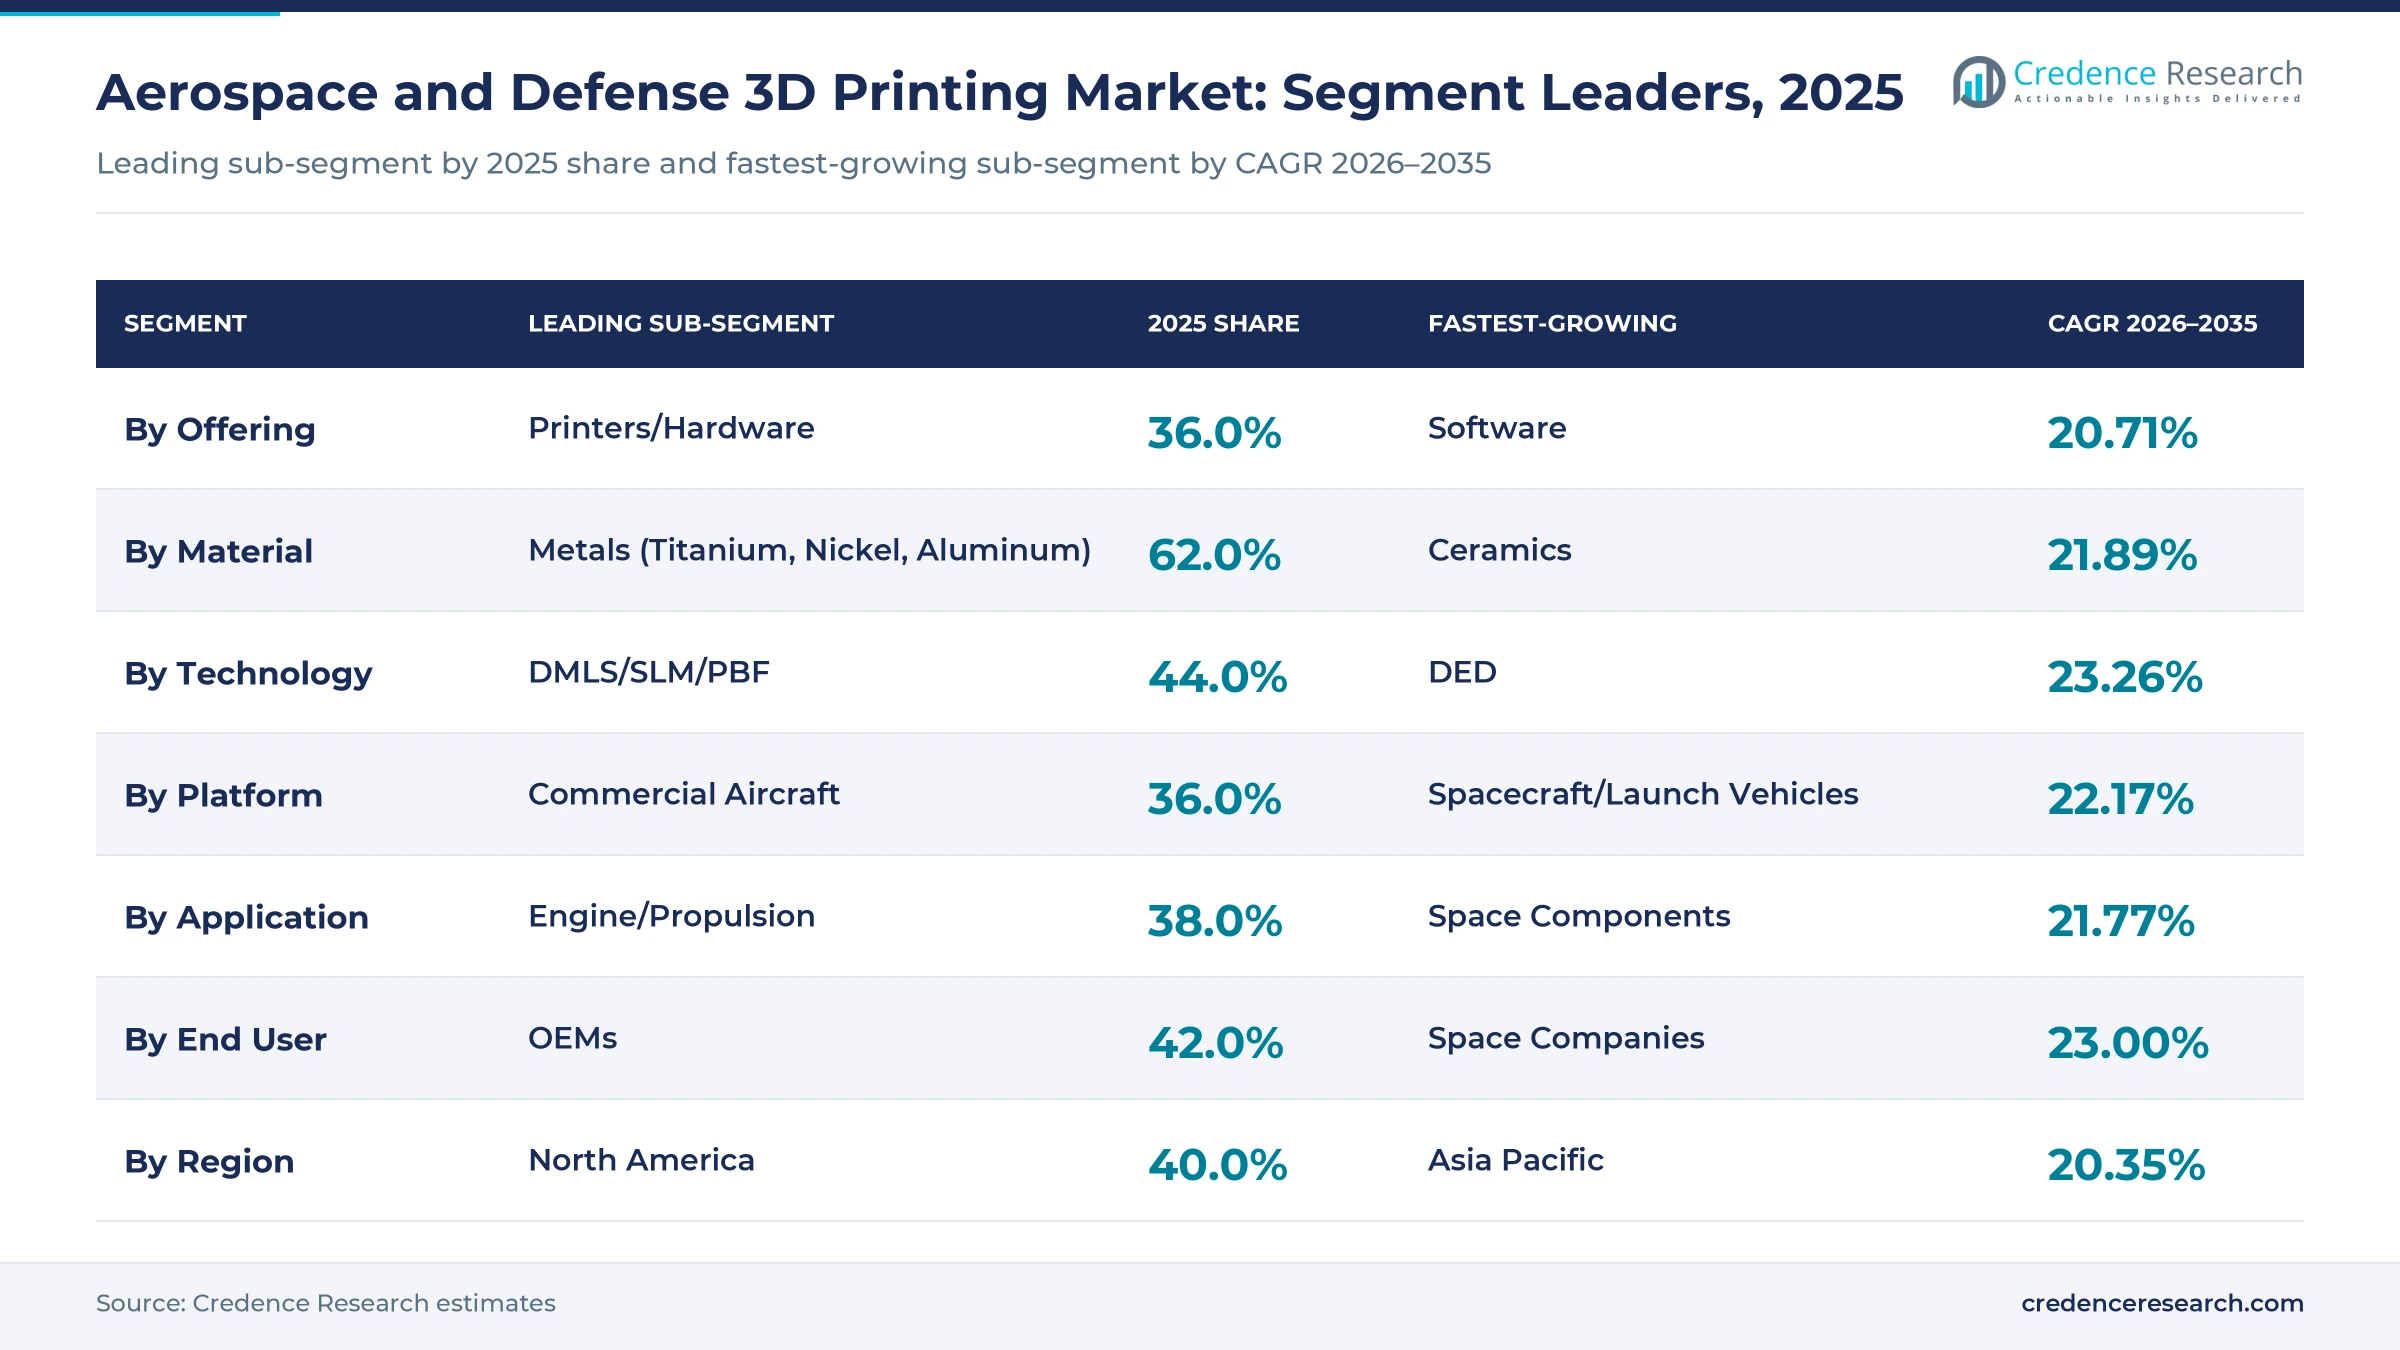
Printers and hardware lead with a 36.0% share in 2025, reflecting new large-format machines at engine, space and shipyard sites. Services follow closely as primes outsource part production. Software grows fastest at 20.71% a year.
Which material and technology lead?
Metals, mainly titanium, nickel and aluminum alloys, lead with a 62.0% share. Ceramics grow fastest at 21.89% from a small base. Powder bed fusion leads technologies with 44.0%, and directed energy deposition grows fastest at 23.26%.
Which platform leads?
Commercial aircraft lead with a 36.0% share, followed by military aircraft, spacecraft and launch vehicles, and drones. Spacecraft and launch vehicles grow fastest at 22.17% a year.
Which application and end user lead?
Engine and propulsion parts lead applications with 38.0%, and space components grow fastest at 21.77%. OEMs lead end users with 42.0%, while space companies grow fastest at 23.00%. Feedstock demand is tracked in the metal powders for additive manufacturing market.
| Segment Group | Leading Sub-segment | 2025 Share | Fastest-growing Sub-segment | CAGR 2026–2035 |
|---|---|---|---|---|
| By Offering | Printers/Hardware | 36.0% | Software | 20.71% |
| By Material | Metals (Titanium, Nickel, Aluminum) | 62.0% | Ceramics | 21.89% |
| By Technology | DMLS/SLM/PBF | 44.0% | DED | 23.26% |
| By Platform | Commercial Aircraft | 36.0% | Spacecraft/Launch Vehicles | 22.17% |
| By Application | Engine/Propulsion | 38.0% | Space Components | 21.77% |
| By End User | OEMs | 42.0% | Space Companies | 23.00% |
Request a Free Sample
Fill in your details and we'll send you a free sample report.
- Sample data tables & charts
- Research methodology
Flight-Part Qualification, Part Consolidation and Sustainment Lift Demand
Why does qualifying flight-critical parts matter? (~+5.2% impact on forecast CAGR)
Qualification of lightweight flight-critical and propulsion parts is the strongest driver, adding about 5.2 percentage points to the forecast CAGR. Once a printed engine or rocket part is approved, it is produced for the life of the program. The US Federal Aviation Administration set out testing and process-control expectations for powder bed fusion engine parts in Advisory Circular 33.15-3, giving engine makers a clearer route to approval. GE Aerospace announced in March 2025 that its nearly USD 1 billion US investment included USD 51 million for more printers at Auburn, Alabama, and USD 14 million at West Chester, Ohio, according to its press release. Engine and propulsion parts lead applications with a 38.0% share, and metals lead materials with 62.0%.
How does part consolidation help? (~+4.0% impact on forecast CAGR)
Part consolidation and shorter lead times for low-volume complex parts add about 4.0 percentage points to the forecast CAGR. The FAA has cited one manufacturer that expected to reduce 855 metal parts to 12 by using printing. Navy shipbuilders are replacing slow castings with printed nickel-aluminum bronze and copper-nickel parts, and HII's Newport News Shipbuilding ordered a second large Nikon SLM printer in February 2026 for this work. Directed energy deposition grows fastest by technology at 23.26% a year because it suits large parts. Powder bed fusion leads technologies with a 44.0% share.
What role do MRO and tooling play? (~+2.9% impact on forecast CAGR)
On-demand MRO tooling and replacement-part production add about 2.9 percentage points to the forecast CAGR. Air forces and navies keep aircraft flying for decades after original suppliers stop making parts, and printing can replace obsolete parts and tools without new molds. NAVAIR contracted Colibrium Additive in May 2026 to supply material data, design allowables and printers so naval aviation can certify printed parts faster. Space companies are the fastest-growing end users at 23.00% a year, and defense agencies are also among the faster-growing buyers. Tooling and MRO already account for a notable part of application value, and the main limit is the engineering data needed to approve each replacement part.
Space Production, Large Metal Printers and Polymer Cabin Parts
Trend 1: Is space the fastest-growing platform?
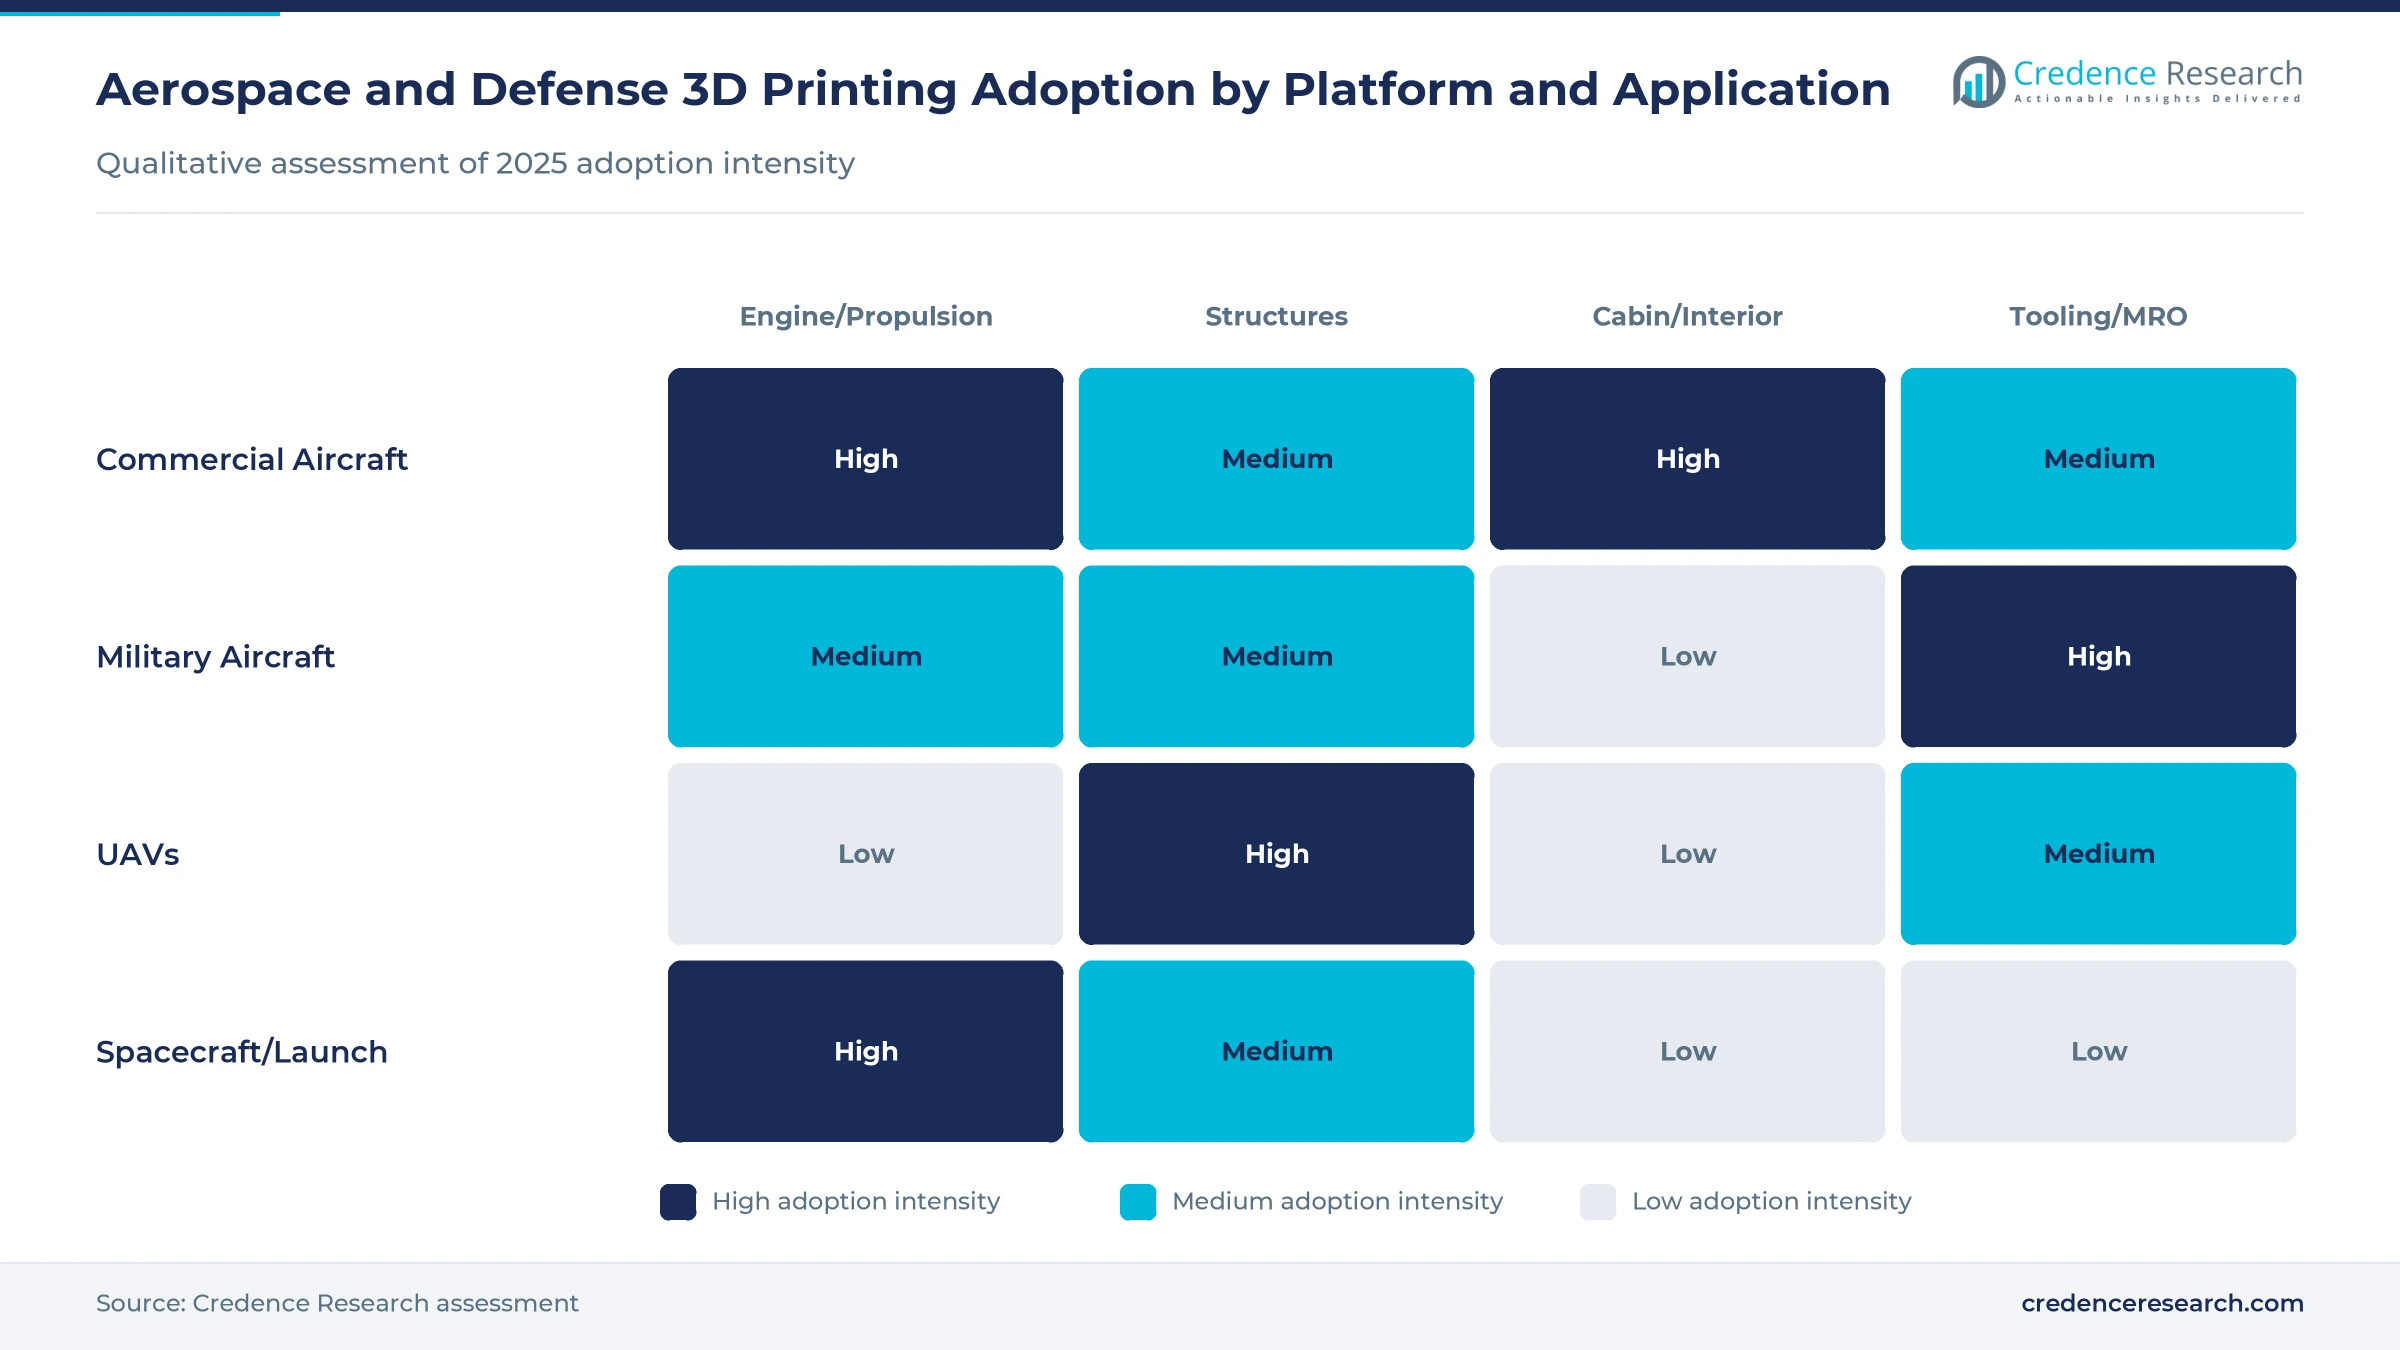
Yes. Spacecraft and launch vehicles grow fastest at 22.17% a year as engine and satellite makers print injectors, chambers and brackets. NASA reports more than 500 hot-fire tests of printed engine hardware under its RAMPT project, as stated on NASA. Printed satellite parts are tracked in the 3D printed satellite market.
Trend 2: Are printers getting larger?
Yes. Large multi-laser machines with build heights of about 1.5 meters let shipyards and space firms print parts that once needed castings. Beehive Industries ordered several such systems in July 2026 for space and defense parts.
Trend 3: Are polymer parts scaling in cabins?
Yes. Airbus produces more than 25,000 flight-ready printed polymer parts a year with Stratasys technology and has more than 200,000 certified printed parts in service, according to Stratasys.
Trend 4: Is the defense supply base growing?
Yes. The FY2026 US defense bill restricts foreign-made printers for Department of Defense programs, and printer makers are adding US capacity. Defense printing is covered in more detail in the military 3D and 4D printing market.
Certification Effort, Uneven Adoption and Customer Delays Slow Growth
Why is certification costly?
Flight parts need test data from many builds, orientations and machines, and process settings must be frozen once approved. Each new alloy or printer can restart parts of this work, which can take years.
Is adoption even across the industry?
No. GE Aerospace's 2025 shareholder letter pointed to slower adoption in parts of the additive manufacturing industry. Commercial airframe programs move cautiously, while engines, space and defense move faster.
Do customer delays affect suppliers?
Yes. Norsk Titanium said in 2025 that Boeing's restructuring limited new part transitions and that defense transitions slipped because of funding delays.
Are inspection and materials still limits?
Yes. Printed metal flaws can be thin and hard to find, so parts often need CT scanning. Qualified powders for titanium and nickel alloys come from a small number of suppliers.
Where are the opportunities?
Qualified digital spare-parts libraries for aging military fleets offer steady demand. Suppliers that bring approved materials, process data and inspection records together can shorten approval and win long-term sustainment work. The execution risk is the cost of qualifying each part family.
North America Leads on Engine, Space and Navy Programs
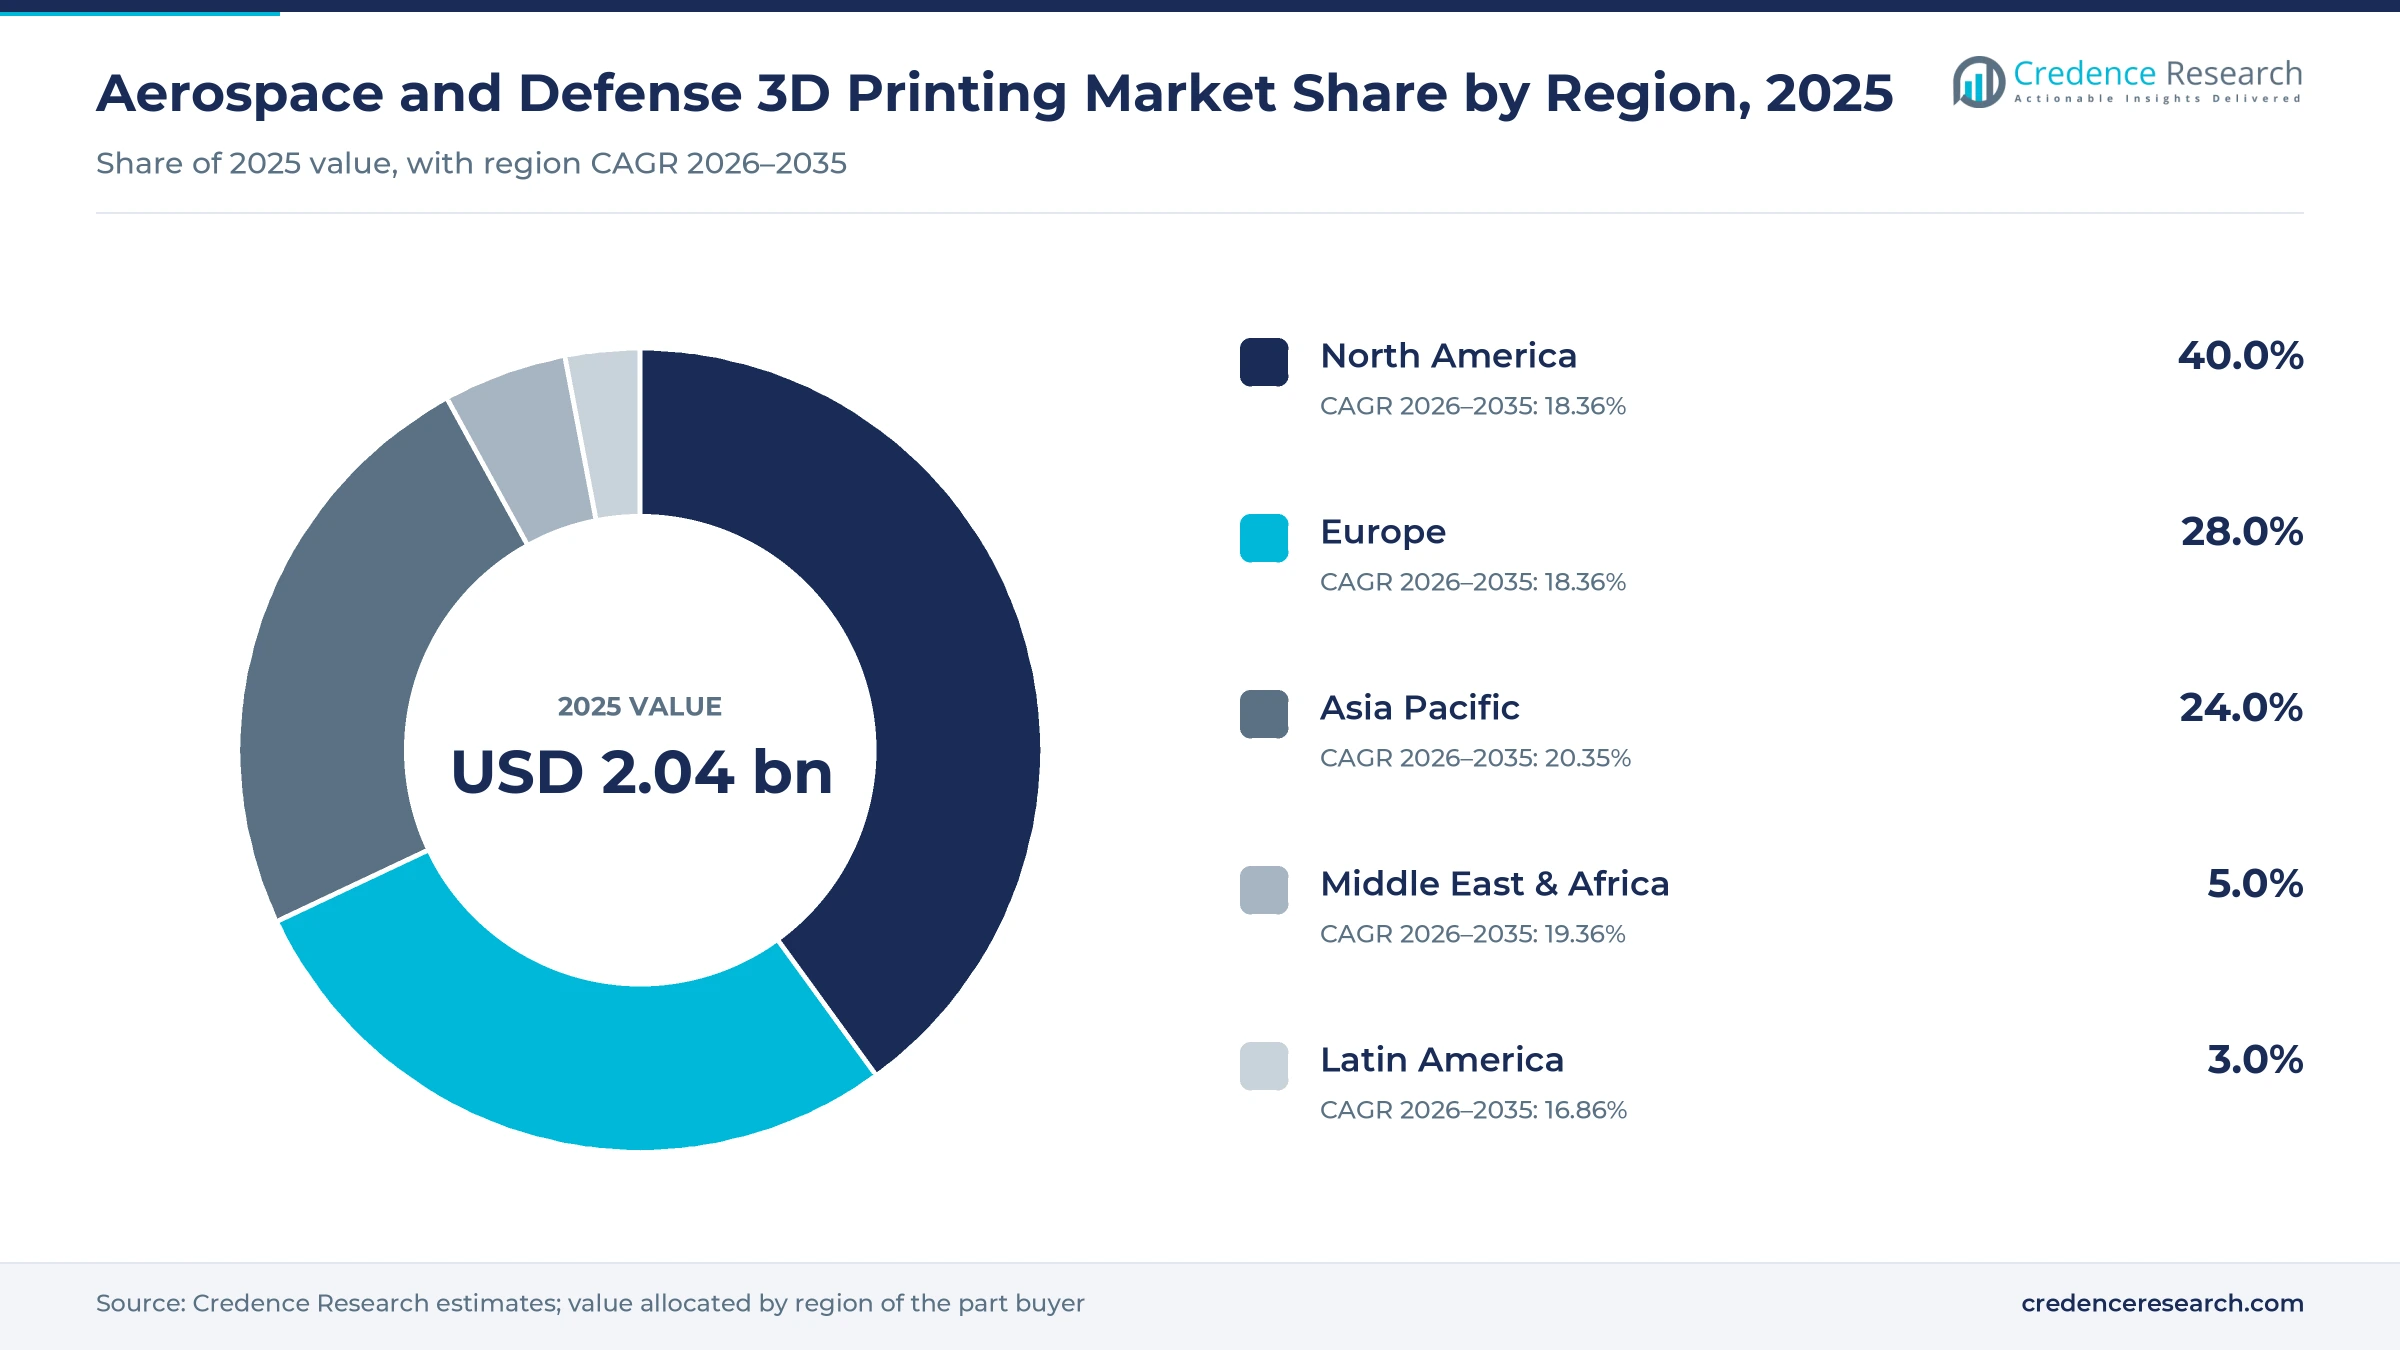
Value is allocated to the region of the part buyer.
| Region | Share 2025 | CAGR 2026–2035 |
|---|---|---|
| North America | 40.0% | 18.36% |
| Europe | 28.0% | 18.36% |
| Asia Pacific | 24.0% | 20.35% |
| Middle East & Africa | 5.0% | 19.36% |
| Latin America | 3.0% | 16.86% |
Why does North America lead?
North America holds a 40.0% share in 2025 and grows at 18.36% a year. US engine makers, launch companies and the Navy's submarine industrial base are the largest buyers, and domestic-sourcing rules favor US suppliers.
What drives Europe?
Europe holds 28.0% and grows at 18.36%. Airbus, Safran and European engine and space suppliers use printed parts at scale, and Germany hosts leading printer makers.
Why does Asia Pacific grow fastest?
Asia Pacific holds 24.0% and is the fastest-growing region at 20.35% a year. China, Japan, India and South Korea are building engine, space and defense programs, and Australian firms supply printed parts to the US Navy.
What about Latin America and the Middle East & Africa?
Latin America holds 3.0% and grows at 16.86%, supported by regional aircraft and MRO. The Middle East & Africa region holds 5.0% and grows at 19.36%, led by Saudi Arabia, where an aerospace-certified printing joint venture works with defense primes.
Contracts, Orders and Production Milestones, 2025–2026
| Development | Status and why it matters |
|---|---|
| In October 2026, the US Navy awarded Ursa Major two contracts worth USD 137 million combined for rocket motors made with a process that includes additive manufacturing. | Contracted. Moves printed propulsion into defense production. |
| In September 2026, AML3D signed an initial production order with Austal USA for three large copper-nickel parts for Navy submarines. | Ordered. Replaces castings with wire-arc printing. |
| In July 2026, Beehive Industries announced a multi-unit order for large Nikon SLM metal printers for space and defense parts. | Ordered. Adds large-format capacity. |
| In May 2026, NAVAIR signed a contract with Colibrium Additive for material data, design allowables and printers to speed part certification. | Contracted. Shortens naval aviation approvals. |
| In May 2026, Rocket Lab completed its 1,000th Rutherford engine with printed main parts. | Completed. Shows series production of printed engines. |
| In May 2026, Stratasys signed an agreement to acquire Markforged from Nano Dimension for about USD 42.5 million. | Announced. Consolidates printer supply. |
| In February 2026, HII Newport News Shipbuilding ordered a second large Nikon SLM printer for Navy parts. | Ordered. Expands shipyard printing. |
| In January 2026, 3D Systems announced an expansion of up to 80,000 square feet in Colorado for aerospace and defense. | Announced. Adds US capacity. |
| In December 2025, Stratasys announced that Airbus makes more than 25,000 printed flight parts a year with its technology. | Reported. Confirms polymer parts at scale. |
Need a Custom Version of This Report?
Tailor the scope, geography, or segments to your exact requirements.
- Custom geography or segment scope
- Direct access to our analyst team
Printer Makers, Software Firms and Aerospace Primes Shape Competition
Competition involves printer and material suppliers on one side and aerospace manufacturers that print their own parts on the other. Several primes are both buyers and producers. No share ranking is given because few firms report aerospace printing revenue separately.
Who supplies printers and software?
Stratasys Ltd. makes polymer printers and materials used for Airbus cabin parts and Air Force sustainment, and agreed in May 2026 to buy Markforged. 3D Systems Corporation makes metal and polymer printers and is expanding aerospace production in Colorado. EOS GmbH supplies laser powder bed systems and is a printing partner to Lockheed Martin. Nikon SLM Solutions makes large multi-laser metal printers ordered by Navy shipbuilders and space firms. Materialise NV supplies build-preparation software and certified polymer parts for aircraft interiors.
Which primes print their own parts?
GE Aerospace prints fuel nozzles and other engine parts and owns printer maker Colibrium Additive. Safran runs an additive manufacturing campus near Bordeaux. Airbus uses printed titanium and polymer parts on several aircraft. Lockheed Martin prints thermal-management parts at a dedicated site in Texas. Boeing buys printed titanium structures and uses printing for tooling.
How do suppliers compete?
Suppliers compete on qualified materials, machine size, process data and quality approvals such as AS9100. Firms that can supply both machines and certified parts, or that hold long-term engine and defense contracts, have the strongest position.
Is consolidation continuing?
Yes. Mergers and asset sales among printer makers have reduced the number of independent suppliers, and buyers weigh vendor stability when choosing platforms for long programs.
Frequently Asked Questions
How big is the aerospace and defense 3D printing market?
What drives the market?
Which application is largest?
Which technology leads?
Which region leads?
What holds the market back?
Table of Content
Chapter 1 Market Segmentation
- 1.1 Segmentation Framework
- 1.1.1 Product and Service Classification
- 1.1.2 Application and End-Use Classification
- 1.1.3 Technology and Solution Classification
- 1.1.4 Customer and Distribution Channel Classification
- 1.1.5 Geographic Segmentation
- 1.1.6 Market Segment Definitions and Boundaries
- 1.2 By Offering
- 1.2.1 Printers/Hardware
- 1.2.2 Materials
- 1.2.3 Software
- 1.2.4 Services
- 1.3 By Material
- 1.3.1 Metals (Titanium, Nickel, Aluminum)
- 1.3.2 Polymers
- 1.3.3 Composites
- 1.3.4 Ceramics
- 1.4 By Technology
- 1.4.1 DMLS/SLM/PBF
- 1.4.2 EBM
- 1.4.3 FDM
- 1.4.4 SLA
- 1.4.5 SLS
- 1.4.6 DED
- 1.4.7 Binder Jetting
- 1.5 By Platform
- 1.5.1 Commercial Aircraft
- 1.5.2 Military Aircraft
- 1.5.3 UAVs
- 1.5.4 Spacecraft/Launch Vehicles
- 1.6 By Application
- 1.6.1 Engine/Propulsion
- 1.6.2 Structural Parts
- 1.6.3 Cabin/Interior
- 1.6.4 Space Components
- 1.6.5 Tooling/MRO
- 1.7 By End User
- 1.7.1 OEMs
- 1.7.2 Tier Suppliers
- 1.7.3 MRO Providers
- 1.7.4 Defense Agencies
- 1.7.5 Space Companies
Chapter 2 Introduction
- 2.1 Report Objectives and Scope
- 2.2 Product Definition and Industry Terminology
- 2.3 Market Inclusions and Exclusions
- 2.4 Research Process
- 2.4.1 Primary Research and Expert Interviews
- 2.4.2 Secondary Research and Source Review
- 2.4.3 Top-Down and Bottom-Up Estimation
- 2.4.4 Data Triangulation and Verification
- 2.5 Market Size Measurement Basis
- 2.5.1 2025: USD 2.04 billion → 2035: USD 11.50 billion
- 2.6 Historical and Forecast Reference Periods
- 2.6.1 Historical Period: 2018-2025
- 2.6.2 Base Year: 2025
- 2.6.3 Forecast Period: 2025-2035
- 2.7 Research Assumptions and Limitations
Chapter 3 Executive Summary
- 3.1 Market Snapshot and Key Findings
- 3.2 Base-Year Market Size, 2025
- 3.3 Forecast Market Size, 2035
- 3.4 Revenue and Volume Growth Outlook
- 3.5 Key Demand and Supply Indicators
- 3.6 Leading Market Segments
- 3.7 Fastest-Growing Market Opportunities
- 3.8 Regional Performance Highlights
- 3.9 Technology and Industry Transformation
- 3.10 Competitive Landscape Summary
- 3.11 Analyst View and Strategic Implications
Chapter 4 Global Aerospace Defense 3D Printing Market Trends and Developments
- 4.1 Historical Industry Development, 2018-2025
- 4.2 Recent Market Trends and Developments
- 4.3 Demand and Customer Behavior Trends
- 4.4 Technology and Product Innovation
- 4.5 Artificial Intelligence, Automation and Digitalization
- 4.6 Local Manufacturing and Supply Chain Realignment
- 4.7 Industry Partnerships, Mergers and Acquisitions
- 4.8 Sustainability and Circular Economy Developments
- 4.9 Government and Private Sector Investment Trends
- 4.10 Emerging Business Models and Commercialization
- 4.11 Industry Developments and Announcements
Chapter 5 Global Aerospace Defense 3D Printing Market Production, Supply and Demand Analysis
- 5.1 Demand Trend and Consumption Analysis, 2018-2025
- 5.2 Demand Forecast, 2025-2035
- 5.3 Production and Output Trend, 2018-2025
- 5.4 Production and Output Forecast, 2025-2035
- 5.5 Installed Capacity and Capacity Utilization
- 5.6 Company-Wise Production Plants and Statistics
- 5.6.1 Installed Production Capacity
- 5.6.2 Actual Production
- 5.6.3 Planned Capacity and Expansion Targets
- 5.7 Supply Chain Structure and Procurement Trends
- 5.8 Supply-Demand Gap and Bottlenecks
- 5.9 Import Dependence and Sourcing Structure
- 5.10 Contract Manufacturing and Outsourcing
- 5.11 Regional Supply and Demand Concentration
Chapter 6 Global Aerospace Defense 3D Printing Market Pricing Analysis
- 6.1 Pricing Structure and Measurement
- 6.2 Historical Pricing Trends, 2018-2025
- 6.3 Pricing Outlook, 2025-2035
- 6.4 Average Selling Price and Unit Economics
- 6.5 Pricing by Product and Market Segment
- 6.6 Geographic Pricing Differences
- 6.7 Key Input, Energy, Labor and Logistics Costs
- 6.8 Contract Pricing and Purchasing Models
- 6.9 Pricing Sensitivity and Competitive Positioning
- 6.10 Price, Margin and Profitability Implications
Chapter 7 Global Aerospace Defense 3D Printing Market Dynamics
- 7.1 Market Growth Drivers
- 7.1.1 Demand-Side Drivers
- 7.1.2 Technology and Innovation Drivers
- 7.1.3 Infrastructure and Investment Drivers
- 7.1.4 Regulatory and Policy Drivers
- 7.2 Market Restraints
- 7.2.1 Cost and Affordability Constraints
- 7.2.2 Technology and Adoption Barriers
- 7.2.3 Supply Chain and Operational Constraints
- 7.3 Market Challenges
- 7.3.1 Competitive Pressure and Margin Erosion
- 7.3.2 Skills, Infrastructure and Implementation Gaps
- 7.4 Emerging Market Opportunities
- 7.5 Market Dynamics Impact and Time-Horizon Assessment
Chapter 8 Global Aerospace Defense 3D Printing Value Chain Analysis
- 8.1 Industry Value Chain Overview
- 8.2 Upstream Suppliers and Critical Inputs
- 8.3 Technology and Component Providers
- 8.4 Manufacturing or Service Delivery
- 8.5 Distribution, Channel Partners and Integrators
- 8.6 Downstream Applications and End Users
- 8.7 Value Addition and Profit Pools
- 8.8 Vertical Integration and Outsourcing
- 8.9 Supplier Concentration and Risk
- 8.10 Supply Chain Localization and Resilience
Chapter 9 Global Aerospace Defense 3D Printing Market Regulations and Policies
- 9.1 Relevant Laws, Standards and Compliance Frameworks
- 9.2 Product, Service, Safety and Quality Requirements
- 9.3 Government Policies, Incentives and Subsidies
- 9.4 Imports, Exports and Trade Barriers
- 9.5 Public Procurement and Local Content Requirements
- 9.6 Environmental and Sustainability Compliance
- 9.7 Upcoming Policy Changes and Market Implications
Chapter 10 Global Aerospace Defense 3D Printing Market Hotspots and Opportunities
- 10.1 Market Opportunity Mapping and Growth Hotspots
- 10.2 High-Growth Applications and Customer Groups
- 10.3 Underserved Markets and White-Space Opportunities
- 10.4 Emerging Technology and Product Opportunities
- 10.5 New Capacity and Investment Hotspots
- 10.6 Market Entry and Expansion Opportunities
- 10.7 Distribution and Partnership Opportunities
- 10.8 Near-Term and Long-Term Commercial Potential
- 10.9 Opportunity Attractiveness and Execution Risks
Chapter 11 Global Aerospace Defense 3D Printing Market Outlook, 2025-2035
- 11.1 Market Size and Analysis
- 11.1.1 Revenue (Market Measurement: 2025: USD 2.04 billion → 2035: USD 11.50 billion)
- 11.1.2 Market Volume and Quantity Sold
- 11.1.3 Historical Market Size, 2018-2025
- 11.1.4 Base-Year Market Size, 2025
- 11.2 Market Forecast, 2025-2035
- 11.2.1 Revenue Forecast to 2035
- 11.2.2 Volume Forecast to 2035
- 11.2.3 CAGR and Year-on-Year Growth
- 11.2.4 Incremental Revenue Opportunity
- 11.3 Forecast Assumptions and Scenario Analysis
- 11.3.1 Base-Case Forecast
- 11.3.2 Optimistic and Conservative Scenarios
- 11.3.3 Technology, Pricing and Policy Sensitivities
- 11.4 Market Attractiveness and Growth Outlook
Chapter 12 Global Aerospace Defense 3D Printing Market Segmentation and Outlook
- 12.1 Segmentation Summary and Market Shares, 2025
- 12.2 Largest and Fastest-Growing Segments
- 12.3 By Offering - Market Size and Forecast, 2025-2035
- 12.3.1 Segment Definition and Scope
- 12.3.2 Historical Market Size, 2018-2025
- 12.3.3 Revenue Forecast, 2025-2035
- 12.3.4 Volume Forecast, 2025-2035
- 12.3.5 Base-Year Market Share, 2025
- 12.3.6 Segment CAGR and Growth Drivers
- 12.3.7 Subsegment Market Size and Forecast
- 12.3.7.1 Printers/Hardware
- 12.3.7.2 Materials
- 12.3.7.3 Software
- 12.3.7.4 Services
- 12.3.8 Subsegment Pricing and Adoption Trends
- 12.3.9 Leading Suppliers and Competition
- 12.3.10 Regional Demand and Opportunities
- 12.4 By Material - Market Size and Forecast, 2025-2035
- 12.4.1 Segment Definition and Scope
- 12.4.2 Historical Market Size, 2018-2025
- 12.4.3 Revenue Forecast, 2025-2035
- 12.4.4 Volume Forecast, 2025-2035
- 12.4.5 Base-Year Market Share, 2025
- 12.4.6 Segment CAGR and Growth Drivers
- 12.4.7 Subsegment Market Size and Forecast
- 12.4.7.1 Metals (Titanium, Nickel, Aluminum)
- 12.4.7.2 Polymers
- 12.4.7.3 Composites
- 12.4.7.4 Ceramics
- 12.4.8 Subsegment Pricing and Adoption Trends
- 12.4.9 Leading Suppliers and Competition
- 12.4.10 Regional Demand and Opportunities
- 12.5 By Technology - Market Size and Forecast, 2025-2035
- 12.5.1 Segment Definition and Scope
- 12.5.2 Historical Market Size, 2018-2025
- 12.5.3 Revenue Forecast, 2025-2035
- 12.5.4 Volume Forecast, 2025-2035
- 12.5.5 Base-Year Market Share, 2025
- 12.5.6 Segment CAGR and Growth Drivers
- 12.5.7 Subsegment Market Size and Forecast
- 12.5.7.1 DMLS/SLM/PBF
- 12.5.7.2 EBM
- 12.5.7.3 FDM
- 12.5.7.4 SLA
- 12.5.7.5 SLS
- 12.5.7.6 DED
- 12.5.7.7 Binder Jetting
- 12.5.8 Subsegment Pricing and Adoption Trends
- 12.5.9 Leading Suppliers and Competition
- 12.5.10 Regional Demand and Opportunities
- 12.6 By Platform - Market Size and Forecast, 2025-2035
- 12.6.1 Segment Definition and Scope
- 12.6.2 Historical Market Size, 2018-2025
- 12.6.3 Revenue Forecast, 2025-2035
- 12.6.4 Volume Forecast, 2025-2035
- 12.6.5 Base-Year Market Share, 2025
- 12.6.6 Segment CAGR and Growth Drivers
- 12.6.7 Subsegment Market Size and Forecast
- 12.6.7.1 Commercial Aircraft
- 12.6.7.2 Military Aircraft
- 12.6.7.3 UAVs
- 12.6.7.4 Spacecraft/Launch Vehicles
- 12.6.8 Subsegment Pricing and Adoption Trends
- 12.6.9 Leading Suppliers and Competition
- 12.6.10 Regional Demand and Opportunities
- 12.7 By Application - Market Size and Forecast, 2025-2035
- 12.7.1 Segment Definition and Scope
- 12.7.2 Historical Market Size, 2018-2025
- 12.7.3 Revenue Forecast, 2025-2035
- 12.7.4 Volume Forecast, 2025-2035
- 12.7.5 Base-Year Market Share, 2025
- 12.7.6 Segment CAGR and Growth Drivers
- 12.7.7 Subsegment Market Size and Forecast
- 12.7.7.1 Engine/Propulsion
- 12.7.7.2 Structural Parts
- 12.7.7.3 Cabin/Interior
- 12.7.7.4 Space Components
- 12.7.7.5 Tooling/MRO
- 12.7.8 Subsegment Pricing and Adoption Trends
- 12.7.9 Leading Suppliers and Competition
- 12.7.10 Regional Demand and Opportunities
- 12.8 By End User - Market Size and Forecast, 2025-2035
- 12.8.1 Segment Definition and Scope
- 12.8.2 Historical Market Size, 2018-2025
- 12.8.3 Revenue Forecast, 2025-2035
- 12.8.4 Volume Forecast, 2025-2035
- 12.8.5 Base-Year Market Share, 2025
- 12.8.6 Segment CAGR and Growth Drivers
- 12.8.7 Subsegment Market Size and Forecast
- 12.8.7.1 OEMs
- 12.8.7.2 Tier Suppliers
- 12.8.7.3 MRO Providers
- 12.8.7.4 Defense Agencies
- 12.8.7.5 Space Companies
- 12.8.8 Subsegment Pricing and Adoption Trends
- 12.8.9 Leading Suppliers and Competition
- 12.8.10 Regional Demand and Opportunities
- 12.9 Segment Growth Comparison
- 12.10 Segment Attractiveness and Priority Matrix
Chapter 13 Global Aerospace Defense 3D Printing End-Use and Application Market Outlook
- 13.1 End-Use Industry and Customer Demand Structure
- 13.2 Leading Applications and Customer Groups
- 13.3 End-Use Market Size, Share and Forecast
- 13.4 Major End-Use Industry Deep Dives
- 13.4.1 Customer Requirements and Use Cases
- 13.4.2 Demand and Replacement Cycles
- 13.4.3 Technical and Regulatory Considerations
- 13.4.4 Purchasing and Procurement Models
- 13.4.5 Leading Vendors and Distribution Channels
- 13.4.6 Forecast and Commercial Opportunities
- 13.5 Emerging Applications and Cross-Segment Demand
- 13.6 End-Use Industry Investment Priorities
Chapter 14 Global Aerospace Defense 3D Printing Geographic Market Outlook, 2025-2035
- 14.1 Regional Market Size and Share, 2025
- 14.2 Regional Market Forecast, 2025-2035
- 14.3 Regional Pricing, Production and Demand Differences
- 14.4 North America
- 14.4.1 United States
- 14.4.2 Canada
- 14.4.3 Mexico
- 14.5 Europe
- 14.5.1 Germany
- 14.5.2 France
- 14.5.3 Italy
- 14.5.4 United Kingdom
- 14.5.5 Spain
- 14.5.6 Poland
- 14.5.7 Russia
- 14.5.8 Netherlands
- 14.5.9 Belgium
- 14.5.10 Sweden
- 14.5.11 Denmark
- 14.5.12 Norway
- 14.5.13 Rest of Europe
- 14.6 Asia Pacific
- 14.6.1 China
- 14.6.2 India
- 14.6.3 Japan
- 14.6.4 South Korea
- 14.6.5 Thailand
- 14.6.6 Indonesia
- 14.6.7 Vietnam
- 14.6.8 Malaysia
- 14.6.9 Australia
- 14.6.10 Rest of Asia Pacific
- 14.7 Latin America
- 14.7.1 Brazil
- 14.7.2 Argentina
- 14.7.3 Colombia
- 14.7.4 Chile
- 14.7.5 Rest of Latin America
- 14.8 Middle East
- 14.8.1 Saudi Arabia
- 14.8.2 United Arab Emirates
- 14.8.3 Turkey
- 14.8.4 Israel
- 14.8.5 Iran
- 14.8.6 Rest of the Middle East
- 14.9 Africa
- 14.9.1 South Africa
- 14.9.2 Egypt
- 14.9.3 Nigeria
- 14.9.4 Morocco
- 14.9.5 Rest of Africa
- 14.10 Regional Investment, Policy and Supply Chain Differences
- 14.11 Regional Competitive Landscape
- 14.12 Geographic Growth Hotspots
Chapter 15 Global Aerospace Defense 3D Printing Technology, Innovation and Sustainability Outlook
- 15.1 Technology Landscape and Maturity
- 15.2 Product, Process and Service Innovation
- 15.3 AI, Automation and Digital Tools in the Industry
- 15.4 Technology Adoption and Performance Benchmarking
- 15.5 Innovation Pipeline and R&D Investment
- 15.6 Patent and Intellectual Property Trends
- 15.7 Energy Efficiency and Resource Management
- 15.8 Sustainability, Recycling and Circularity
- 15.9 Technology Roadmap, 2025-2035
- 15.10 Risks of Obsolescence and Technology Substitution
Chapter 16 Global Aerospace Defense 3D Printing Market Key Strategic Imperatives
- 16.1 Growth and Market Entry Priorities
- 16.2 High-Return Products and Segments
- 16.3 Pricing, Profitability and Cost Optimization
- 16.4 Technology Investment and Product Differentiation
- 16.5 Supply Chain Localization and Resilience
- 16.6 Distribution and Customer Acquisition
- 16.7 Partnership, Acquisition and Capacity Strategy
- 16.8 Regional Expansion Priorities
- 16.9 Short-, Medium- and Long-Term Actions
Chapter 17 Competition Outlook
- 17.1 Industry Competition Characteristics
- 17.2 Market Structure and Concentration
- 17.3 Market Share and Competitive Positioning, 2025
- 17.4 Company-Wise Revenue and Product Benchmarking
- 17.5 Production and Service Capacity Benchmarking
- 17.6 Technology, Pricing and Differentiation
- 17.7 Regional Footprint and Distribution Strength
- 17.8 Mergers, Acquisitions and Strategic Alliances
- 17.9 New Entrants and Competitive Threats
- 17.10 Porter's Five Forces and Industry Attractiveness
- 17.11 Competitive Outlook, 2025-2035
Chapter 18 Company Profiles
- 18.1 Company Coverage and Selection Criteria
- 18.2 Stratasys Ltd.
- 18.2.1 Business Description
- 18.2.2 Company Ownership and Geographic Presence
- 18.2.3 Product and Service Portfolio
- 18.2.4 Manufacturing and Operating Footprint
- 18.2.5 Production Capacity and Expansion Plans
- 18.2.6 Financial Performance and Investment
- 18.2.7 Market Share and Competitive Position
- 18.2.8 Technology and Innovation Capabilities
- 18.2.9 Strategic Alliances or Partnerships
- 18.2.10 Recent Developments
- 18.2.11 Growth Strategy and Outlook
- 18.3 3D Systems Corporation
- 18.4 Materialise NV
- 18.5 EOS GmbH
- 18.6 Nikon SLM Solutions
- 18.7 GE Aerospace
- 18.8 Boeing
- 18.9 Airbus
- 18.10 Lockheed Martin
- 18.11 Safran
- 18.12 Other Relevant Market Participants
Note: Every listed company is profiled on the structure shown under the first company. The company list is preliminary and may change based on research findings, market developments, data availability and client requirements.
Chapter 19 Disclaimer
- 19.1 Research and Forecast Disclaimer
- 19.2 Data Source and Estimation Limitations
Note: The depth of individual sections depends on data availability for this market. Volume, capacity, trade and other unit-based metrics are included where applicable.

