
Higher jet output and Chinese programs lift airframe work
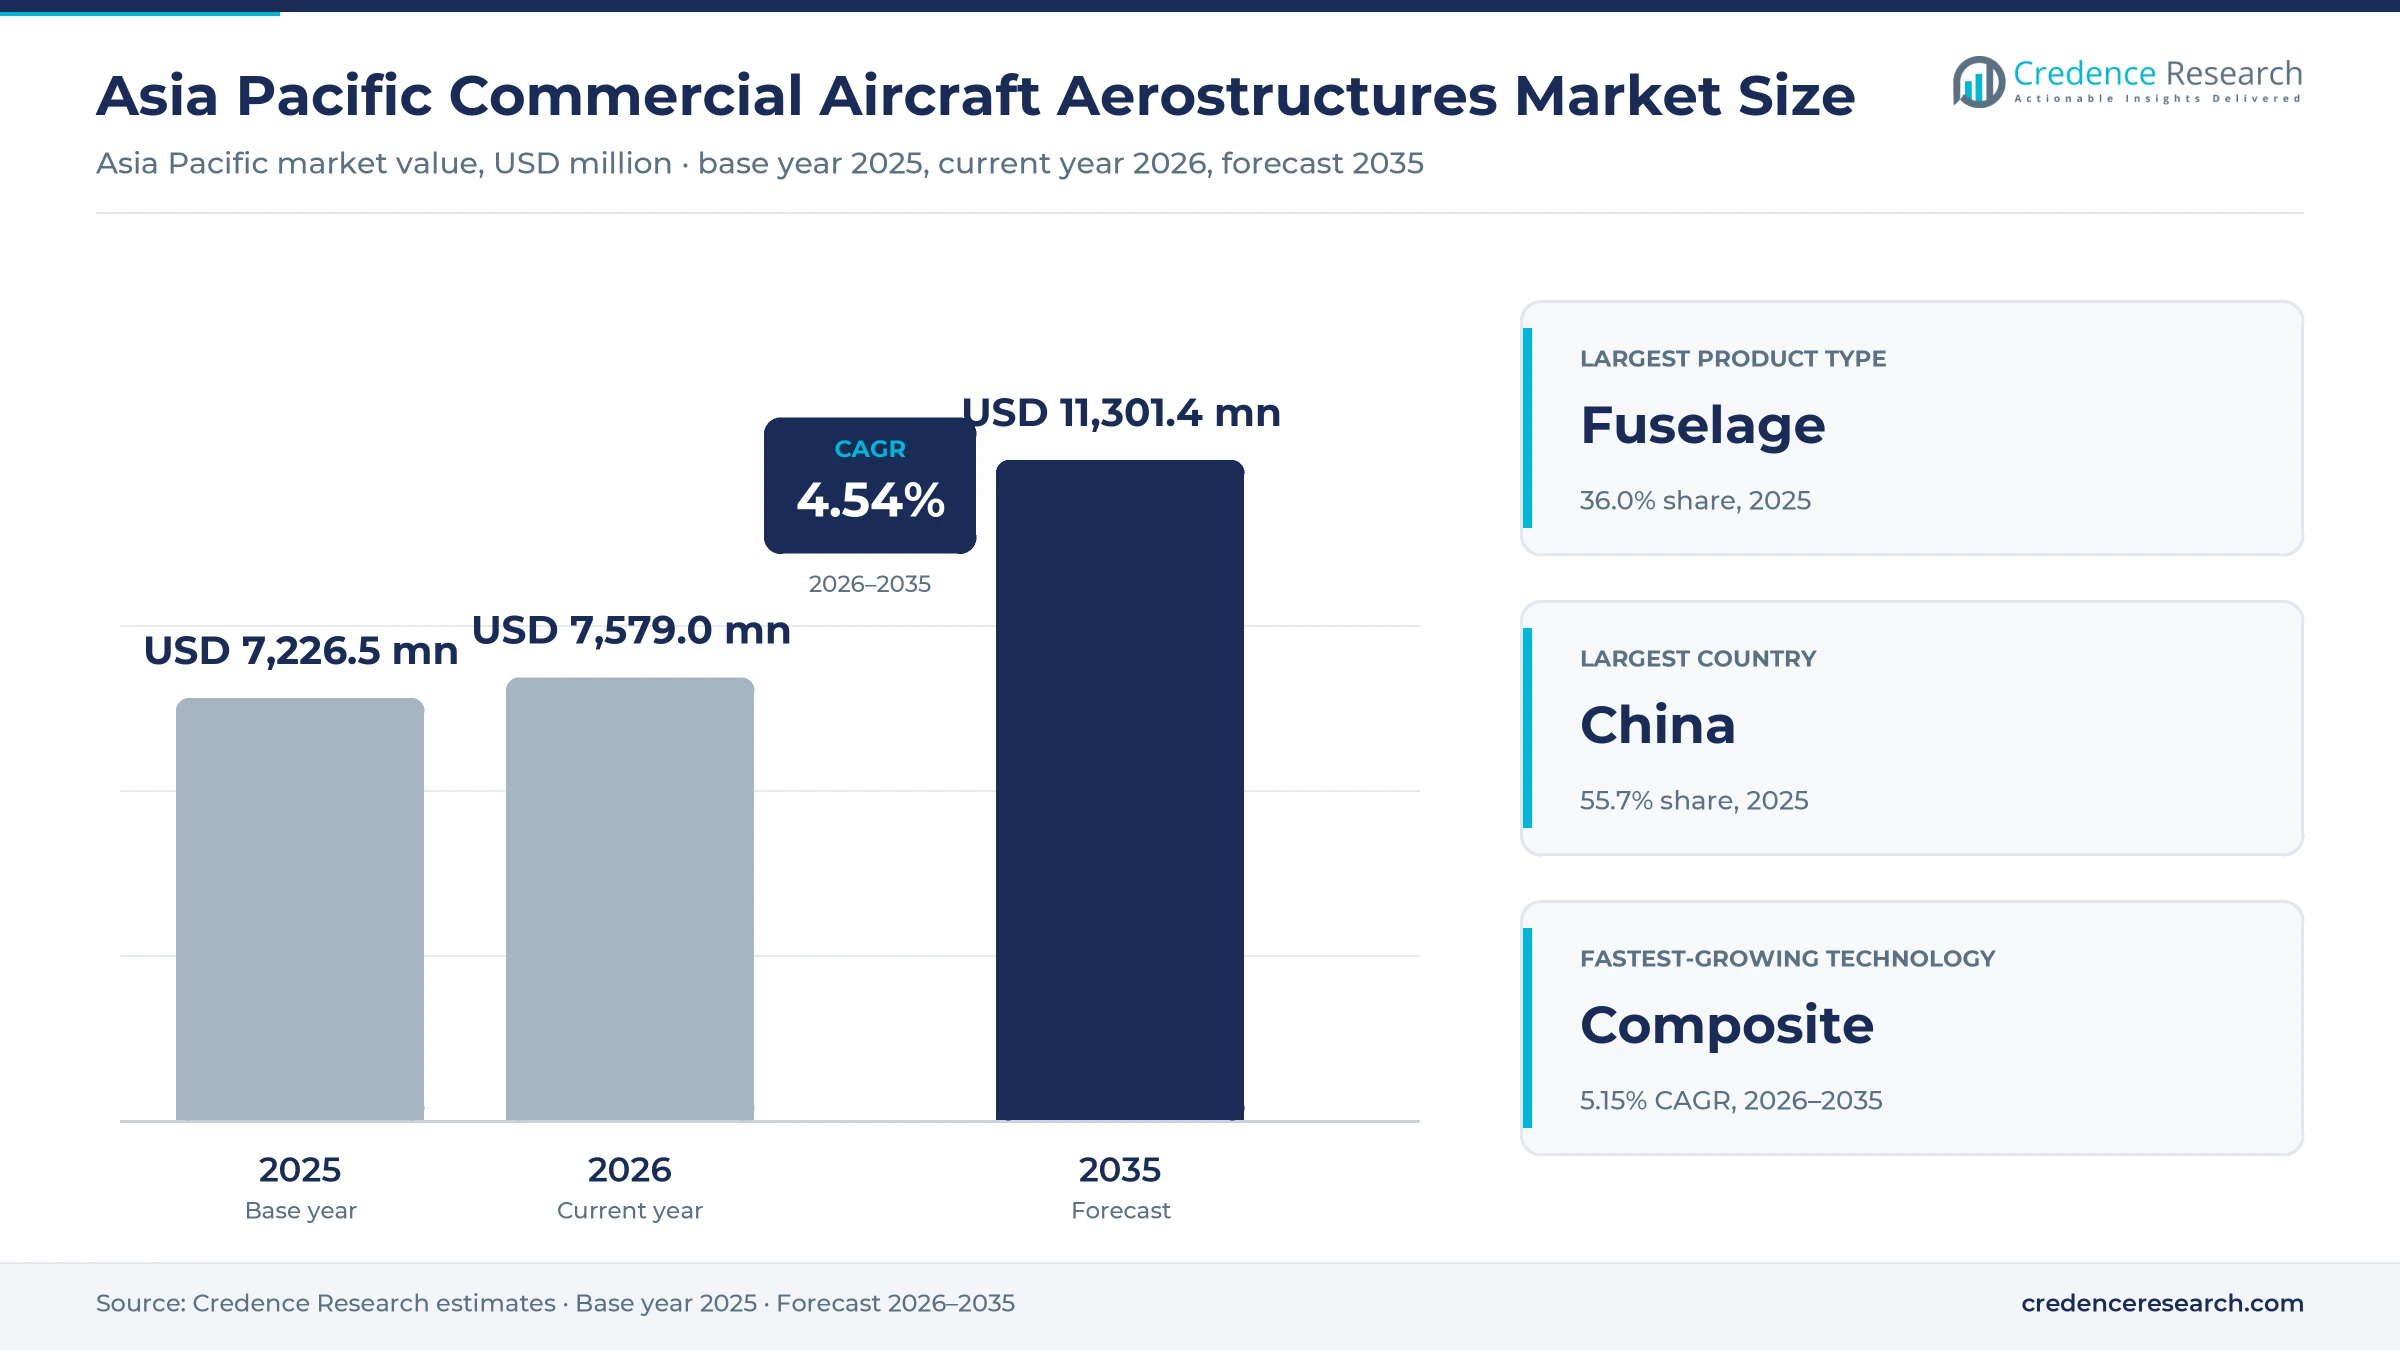
The Asia Pacific commercial aircraft aerostructures market was valued at USD 7.23 billion in 2025 and is projected to increase from USD 7.58 billion in 2026 to USD 11.30 billion by 2035, registering a CAGR of 4.54% during 2026–2035. Demand comes from fuselage sections, wing boxes, tail parts and nacelle structures that suppliers in Japan, China, South Korea and India build for Boeing, Airbus and COMAC jets. China held the largest regional share, 55.7% in 2025, because it hosts Airbus final assembly in Tianjin and builds most C919 airframe sections. China is also the fastest-growing country at 4.92% a year, as domestic jet output rises. In turn, higher single-aisle production rates at Boeing and Airbus and a recovery in 787 output are lifting orders for Japanese composite wing and fuselage work, while Airbus is buying more metallic parts from Indian suppliers.
Which airframe sections and parts does the estimate cover?
The estimate measures the value of fuselage, wing, empennage and flight-control, and nacelle and pylon structures made in Asia Pacific for passenger jets, factory-built freighters and civil special-mission aircraft. It covers metallic, composite and hybrid structures supplied under direct contracts, subcontracts and intragroup agreements.
The estimate excludes engines, avionics, interiors, landing gear and aftermarket repairs. The value chain runs from aluminum, titanium and carbon fiber suppliers through detail-part makers and aerostructure integrators to airframe makers and their final assembly lines in China, Japan, South Korea, India and the rest of the region.
Asia Pacific Commercial Aircraft Aerostructures Market Insights
- The Asia Pacific commercial aircraft aerostructures market was valued at USD 7.23 billion in 2025 and is projected to reach USD 11.30 billion by 2035, registering a CAGR of 4.54% during 2026–2035.
- China held a 55.7% share of 2025 value, because it hosts two Airbus A320 Family final assembly lines and the C919 program.
- Fuselage structures led with a 36.0% share of 2025 value, because fuselage barrels and panels carry the most material and labor.
- Boeing was building 787s at eight a month in January 2026, up from five a year earlier, which lifts Japanese wing and fuselage work.
- Composite structures grow fastest by technology at 5.15% a year during 2026–2035, as wide-body wing and fuselage work rises.
Fuselage work leads while composite structures rise
Why do fuselage structures lead product demand?
Based on product type, the market is categorized into fuselage structures, wing structures, empennage and flight-control structures, and nacelle and pylon structures. Fuselage structures led with a 36.0% share of 2025 value, because fuselage barrels, panels and doors carry the most material and labor per aircraft. Wing structures grow fastest at 4.80% a year, as 787 and C919 wing box output rises.
How do single-aisle and twin-aisle jets split demand?
Based on aircraft type, the market is categorized into single-aisle aircraft, twin-aisle aircraft and regional aircraft. Single-aisle aircraft led with a 56.0% share of 2025 value, because the A320 Family, 737 and C919 are built in the largest numbers. Single-aisle aircraft also grow fastest at 4.85% a year, as Airbus and Boeing raise narrowbody rates and COMAC adds output.
Why do airframe makers lead customer demand?
Based on customer type, the market is categorized into airframe OEMs, aerostructure integrators and captive manufacturing entities. Airframe OEMs led with a 52.0% share of 2025 value, because Boeing and Airbus buy major sections directly from Japanese and Korean suppliers. Captive manufacturing entities grow fastest at 5.11% a year, as state-owned plants build more C919 sections.
How fast are composite structures gaining value?
Based on technology, the market is categorized into metallic structures, composite structures and hybrid structures. Metallic structures led with 50.0% of 2025 value, because single-aisle fuselages and many detail parts still use aluminum and titanium. Composite structures grow fastest at 5.15% a year, as 787 wing boxes and fuselage sections built in Japan use carbon fiber.
| Segment Group | Leading Sub-segment | Share, 2025 | Fastest-growing Sub-segment | CAGR, 2026–2035 |
|---|---|---|---|---|
| By Product Type | Fuselage structures | 36.0% | Wing structures | 4.80% |
| By Aircraft Type | Single-aisle aircraft | 56.0% | Single-aisle aircraft | 4.85% |
| By Customer Type | Airframe OEMs | 52.0% | Captive manufacturing entities | 5.11% |
| By Technology | Metallic structures | 50.0% | Composite structures | 5.15% |
Request a Free Sample
Fill in your details and we'll send you a free sample report.
- Sample data tables & charts
- Research methodology
Narrowbody rates, 787 content and the C919 lift demand
How does single-aisle production expansion lift orders?
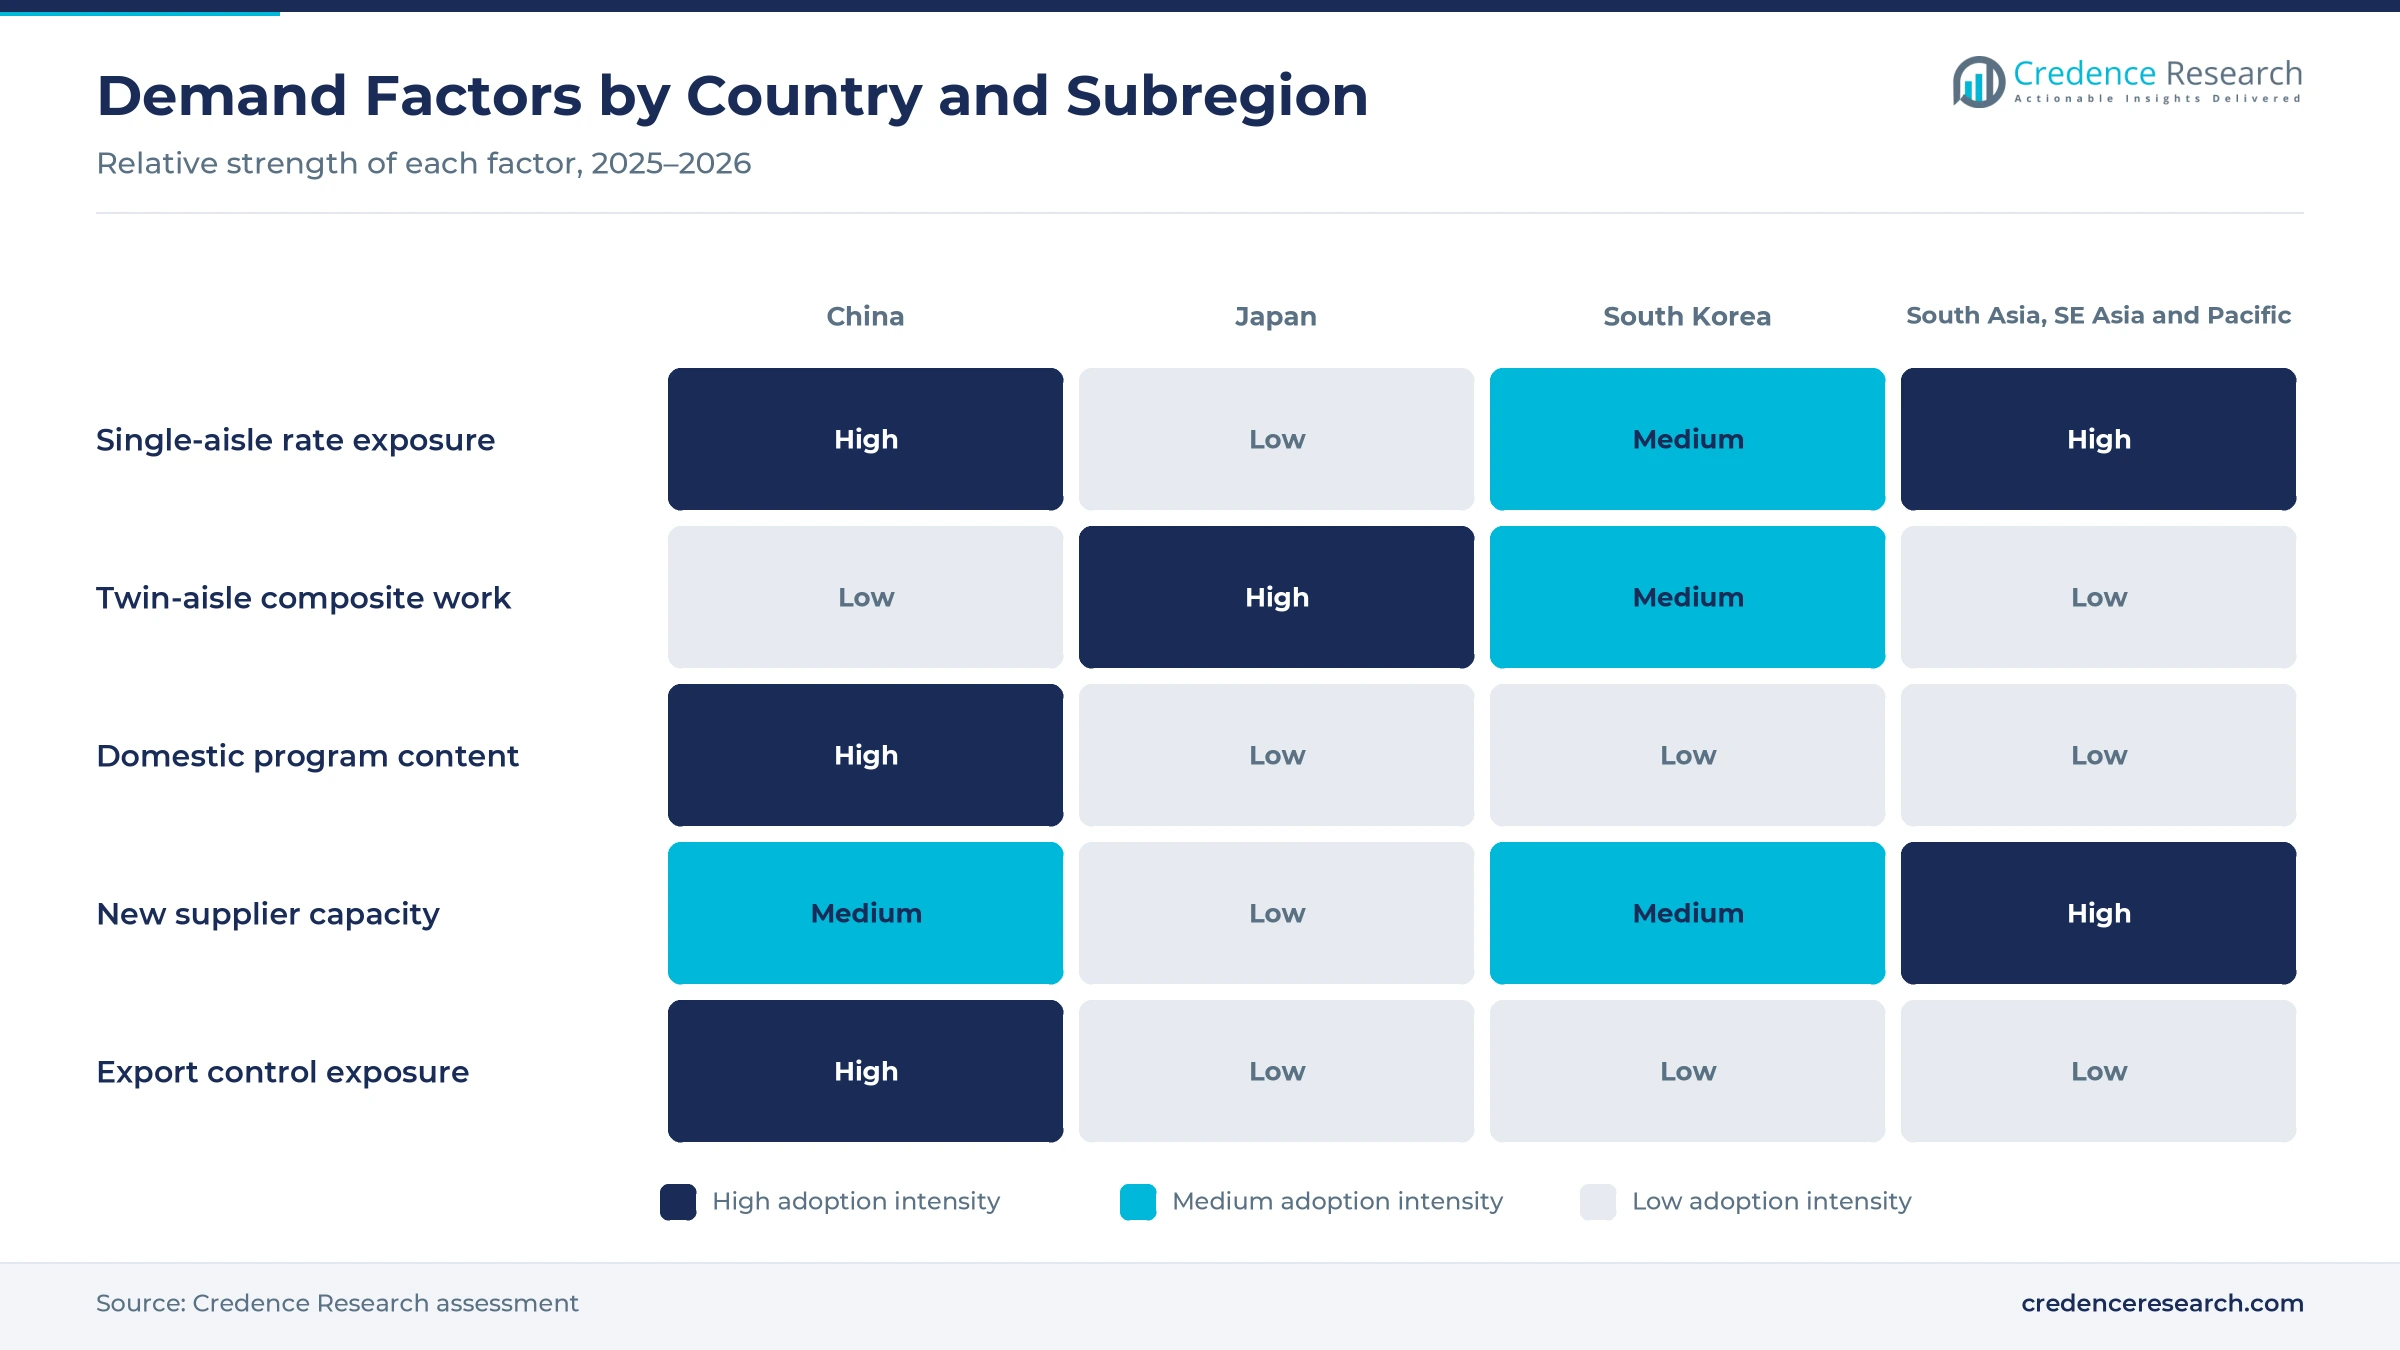
Single-aisle production expansion lifts orders, because every extra narrowbody built each month needs another set of fuselage panels, wing parts, doors and tail structures. The FAA approved a rise in Boeing 737 output from 38 to 42 a month on Oct. 17, 2025, and Boeing plans further steps of five at roughly six-month intervals. Airbus opened a second A320 Family final assembly line in Tianjin on Oct. 22, 2025, according to Anadolu Agency. The company plans to assemble 75 A320 Family aircraft a month in 2027, and Tianjin is expected to provide about 20% of its global capacity. As a result, single-aisle aircraft keep 56.0% of 2025 value.
Why does twin-aisle composite content favor Japanese suppliers?
Twin-aisle composite content favors Japanese suppliers, because they build large carbon fiber sections for Boeing wide-body jets. Mitsubishi Heavy Industries, Kawasaki Heavy Industries and SUBARU supply about 35% of the content of the 787, including wings, center wings and the front fuselage, according to the U.S. International Trade Administration. They also supply about 21% of the content of the Boeing 777 widebody. Boeing was building 787s at eight a month in January 2026, up from five a year earlier, and is targeting 10, according to the SC Daily Gazette. In turn, composite structures grow at 5.15% a year, as Japanese plants buy more aerospace-grade carbon fiber.
How does domestic Chinese program development add work?
Domestic Chinese program development adds work, because the C919 airframe is largely built by state-owned plants in China. COMAC delivered 13 C919s in 2024 and 15 in 2025, and it delivered 11 more through September 2026, according to AirData News. The fleet has carried more than 8.4 million passengers across 27 cities since commercial service began in May 2023. The wing boxes and flaps are made in Xi'an, while center fuselage sections come from Hongdu. Firm orders from the three major state-owned carriers also exceed 300 aircraft, which gives these plants a long production runway. As a result, captive manufacturing entities grow at 5.11% a year, the fastest customer rate, as COMAC raises C919 output.
Why does Asian air traffic growth support backlogs?
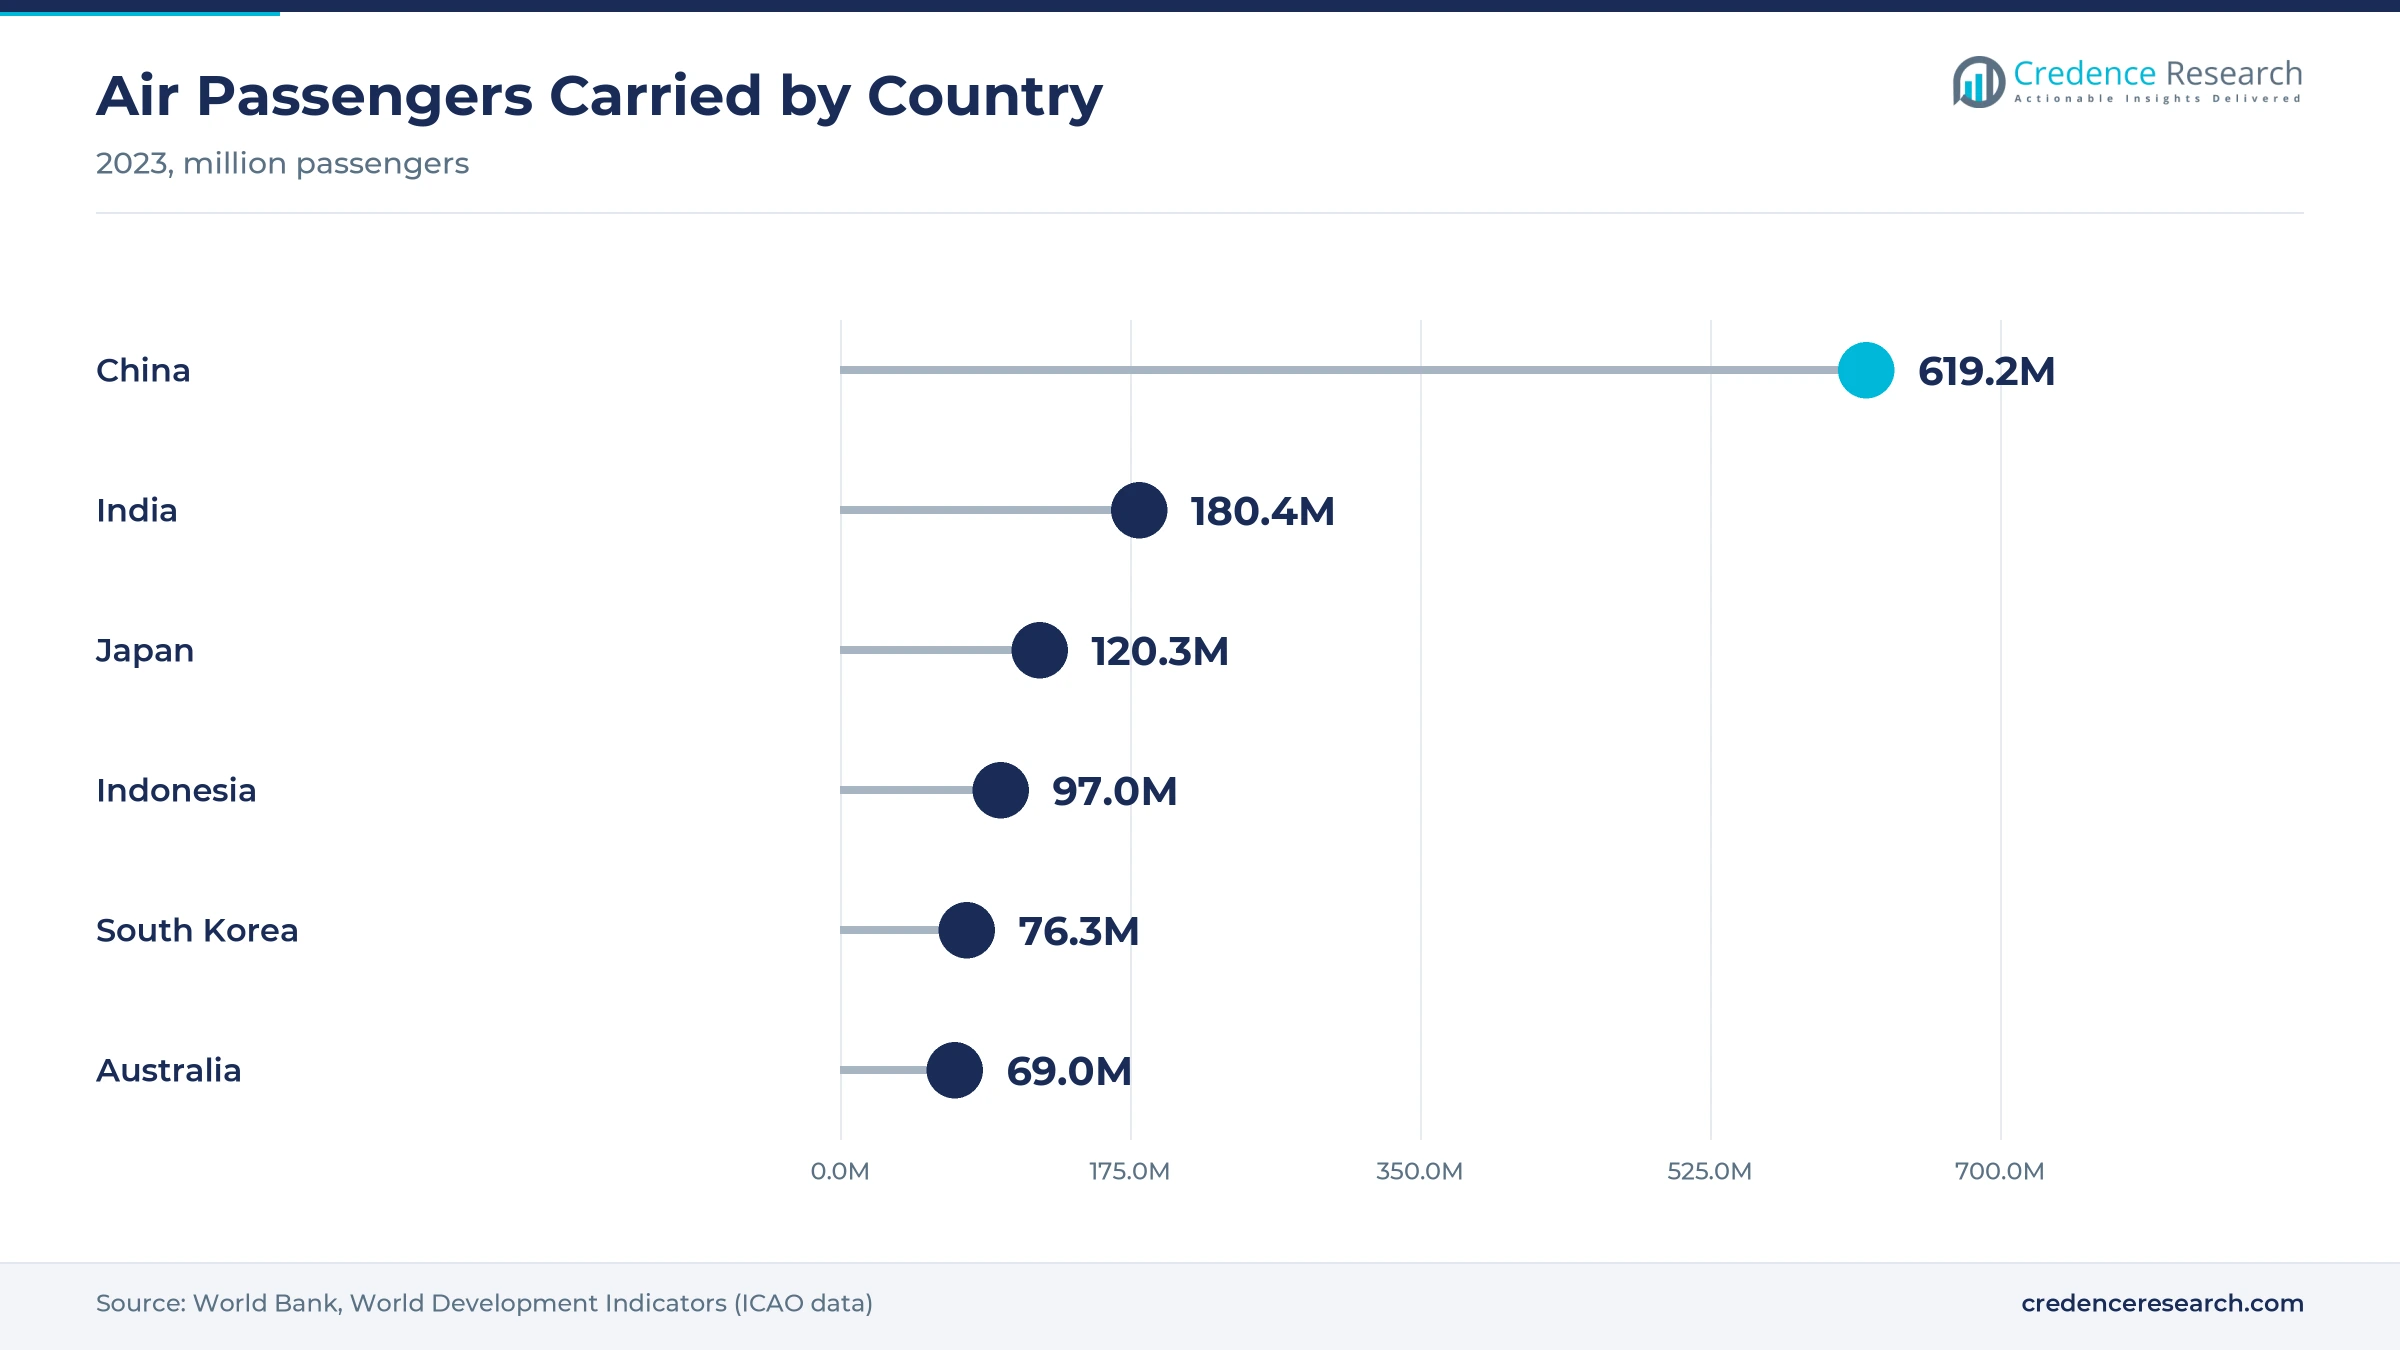
Asian air traffic growth supports backlogs, because airlines in the region need more jets to carry rising passenger numbers. Asia Pacific airlines grew revenue passenger kilometers 7.8% in 2025, faster than the 5.3% industry average, according to IATA. China's airlines carried 619.2 million passengers in 2023 and India's carried 180.4 million, according to World Bank data. Japan's airlines carried 120.3 million passengers in the same year, while Indonesian airlines carried 97.0 million and South Korean airlines carried 76.3 million. As a result, Airbus, Boeing and COMAC keep large orders from Asian carriers, which supports long-term structure contracts across the region through 2035.
Indian sourcing and Korean diversification gain ground
How is the shift of Airbus sourcing to India changing supply?
The shift of Airbus sourcing to India is changing supply, because Indian suppliers now win larger metallic part and fuselage packages. In January 2024, Airbus awarded Tata Advanced Systems and Mahindra Aerostructures contracts for metallic detail parts and assemblies for the A320neo, A330neo and A350. At that time, Airbus bought about USD 750 million of components and services from India each year. By August 2026, that figure had passed USD 1.6 billion, and Airbus expects it to exceed USD 2 billion before the end of the decade. Mahindra will also make A320neo fuselage skins for Sections 18 and 19, with first deliveries in 2028.
Why is the rise of Korean diversification notable?
The rise of Korean diversification is notable, because suppliers are adding new customers beyond Boeing and Airbus. Korea Aerospace Industries makes aircraft doors, fuselage components, wing ribs, wing tips and winglets for Airbus and Boeing. In April 2024, the company signed a structural supply contract with Eve Air Mobility, an Embraer subsidiary, for electric vertical takeoff and landing aircraft. Korean Air also supplies five key structural parts, including wingtips, for the 787, and its parts are installed on over 1,200 787s. In turn, South Korea holds 5.4% of 2025 value and grows at 4.02% a year, as its suppliers spread work across programs.
Can the 787 rate recovery open new Japanese capacity?
The 787 rate recovery opens new Japanese capacity, because suppliers built plants for higher rates than Boeing has flown in recent years. Japanese 787 suppliers have capacity for 10 aircraft a month and an internal target of 14, while output recovered to about seven a month in 2025. SUBARU builds center wing boxes for the 777, 787 and 777X at its Handa plant in Aichi Prefecture. Japan's aircraft industry produced USD 12,007 million of output in 2023. As a result, Japan holds 13.2% of 2025 value, and suppliers that also make composite materials and parts gain the most from higher rates.
Will new C919 variants open fresh structure packages?
New C919 variants open fresh structure packages, because shortened and stretched models need new fuselage plugs, wing changes and tail tooling. The C919-600 prototype first flew on July 29, 2026, and remains in flight testing, while the stretched C919-800 is also in development. COMAC announced in March 2025 a target of 75 commercial aircraft for that year, including 50 C919s, but it delivered only 15 C919s in 2025. That gap shows how much unmet demand remains for wing, fuselage and tail sections from Chinese plants. The three state carriers had also planned 33 deliveries in 2026. In turn, Chinese plants that can add capacity and quality controls will win the extra work as the program grows.
Export controls, quality oversight and costs test makers
How do export controls slow Chinese programs?
Export controls slow Chinese programs, because the C919 depends on Western engines and systems that need licenses. The aircraft uses CFM LEAP-1C jet engines, and the U.S. Commerce Department said some strategic items were under export review in 2025. As a result, completed airframes can wait for engines and systems, which slows orders for new sections. COMAC and its suppliers respond with domestic alternatives, earlier ordering and larger safety stocks of key parts. Chinese airlines, in turn, wait longer for new jets, which delays their fleet plans.
Why does quality oversight limit rate increases?
Quality oversight limits rate increases, because regulators now review supplier quality before approving higher output. The FAA kept Boeing 737 output at 38 a month for more than 20 months after the January 2024 door plug incident. In turn, suppliers in Japan and Korea had to hold rates and inventory longer than planned. This delay also left some suppliers holding finished sections while they waited for Boeing to raise its rate. Many respond with added inspection, digital records and closer work with Boeing quality teams.
How do metal and fiber costs squeeze supplier margins?
Metal and fiber costs squeeze supplier margins, because aerostructures use large amounts of aluminum, titanium alloys and carbon fiber with long qualification times. Price rises are hard to pass on, because long-term contracts with airframe makers fix many prices for years. As a result, smaller suppliers face cash pressure when input costs rise faster than contract prices. Many respond with buy-to-fly improvements, scrap recycling and shared material buying.
Why do skilled labor shortages delay output?
Skilled labor shortages delay output, because riveting, composite layup and inspection work need trained staff. COMAC has faced labor shortages that slowed C919 deliveries in 2026, and Japanese suppliers face an aging workforce. In turn, plants cannot reach full rates even when orders rise. Many respond with automated drilling, robotic layup and training programs with local colleges. Indian suppliers also hire and train new staff ahead of contracts, such as the A320neo fuselage skin work due in 2028.
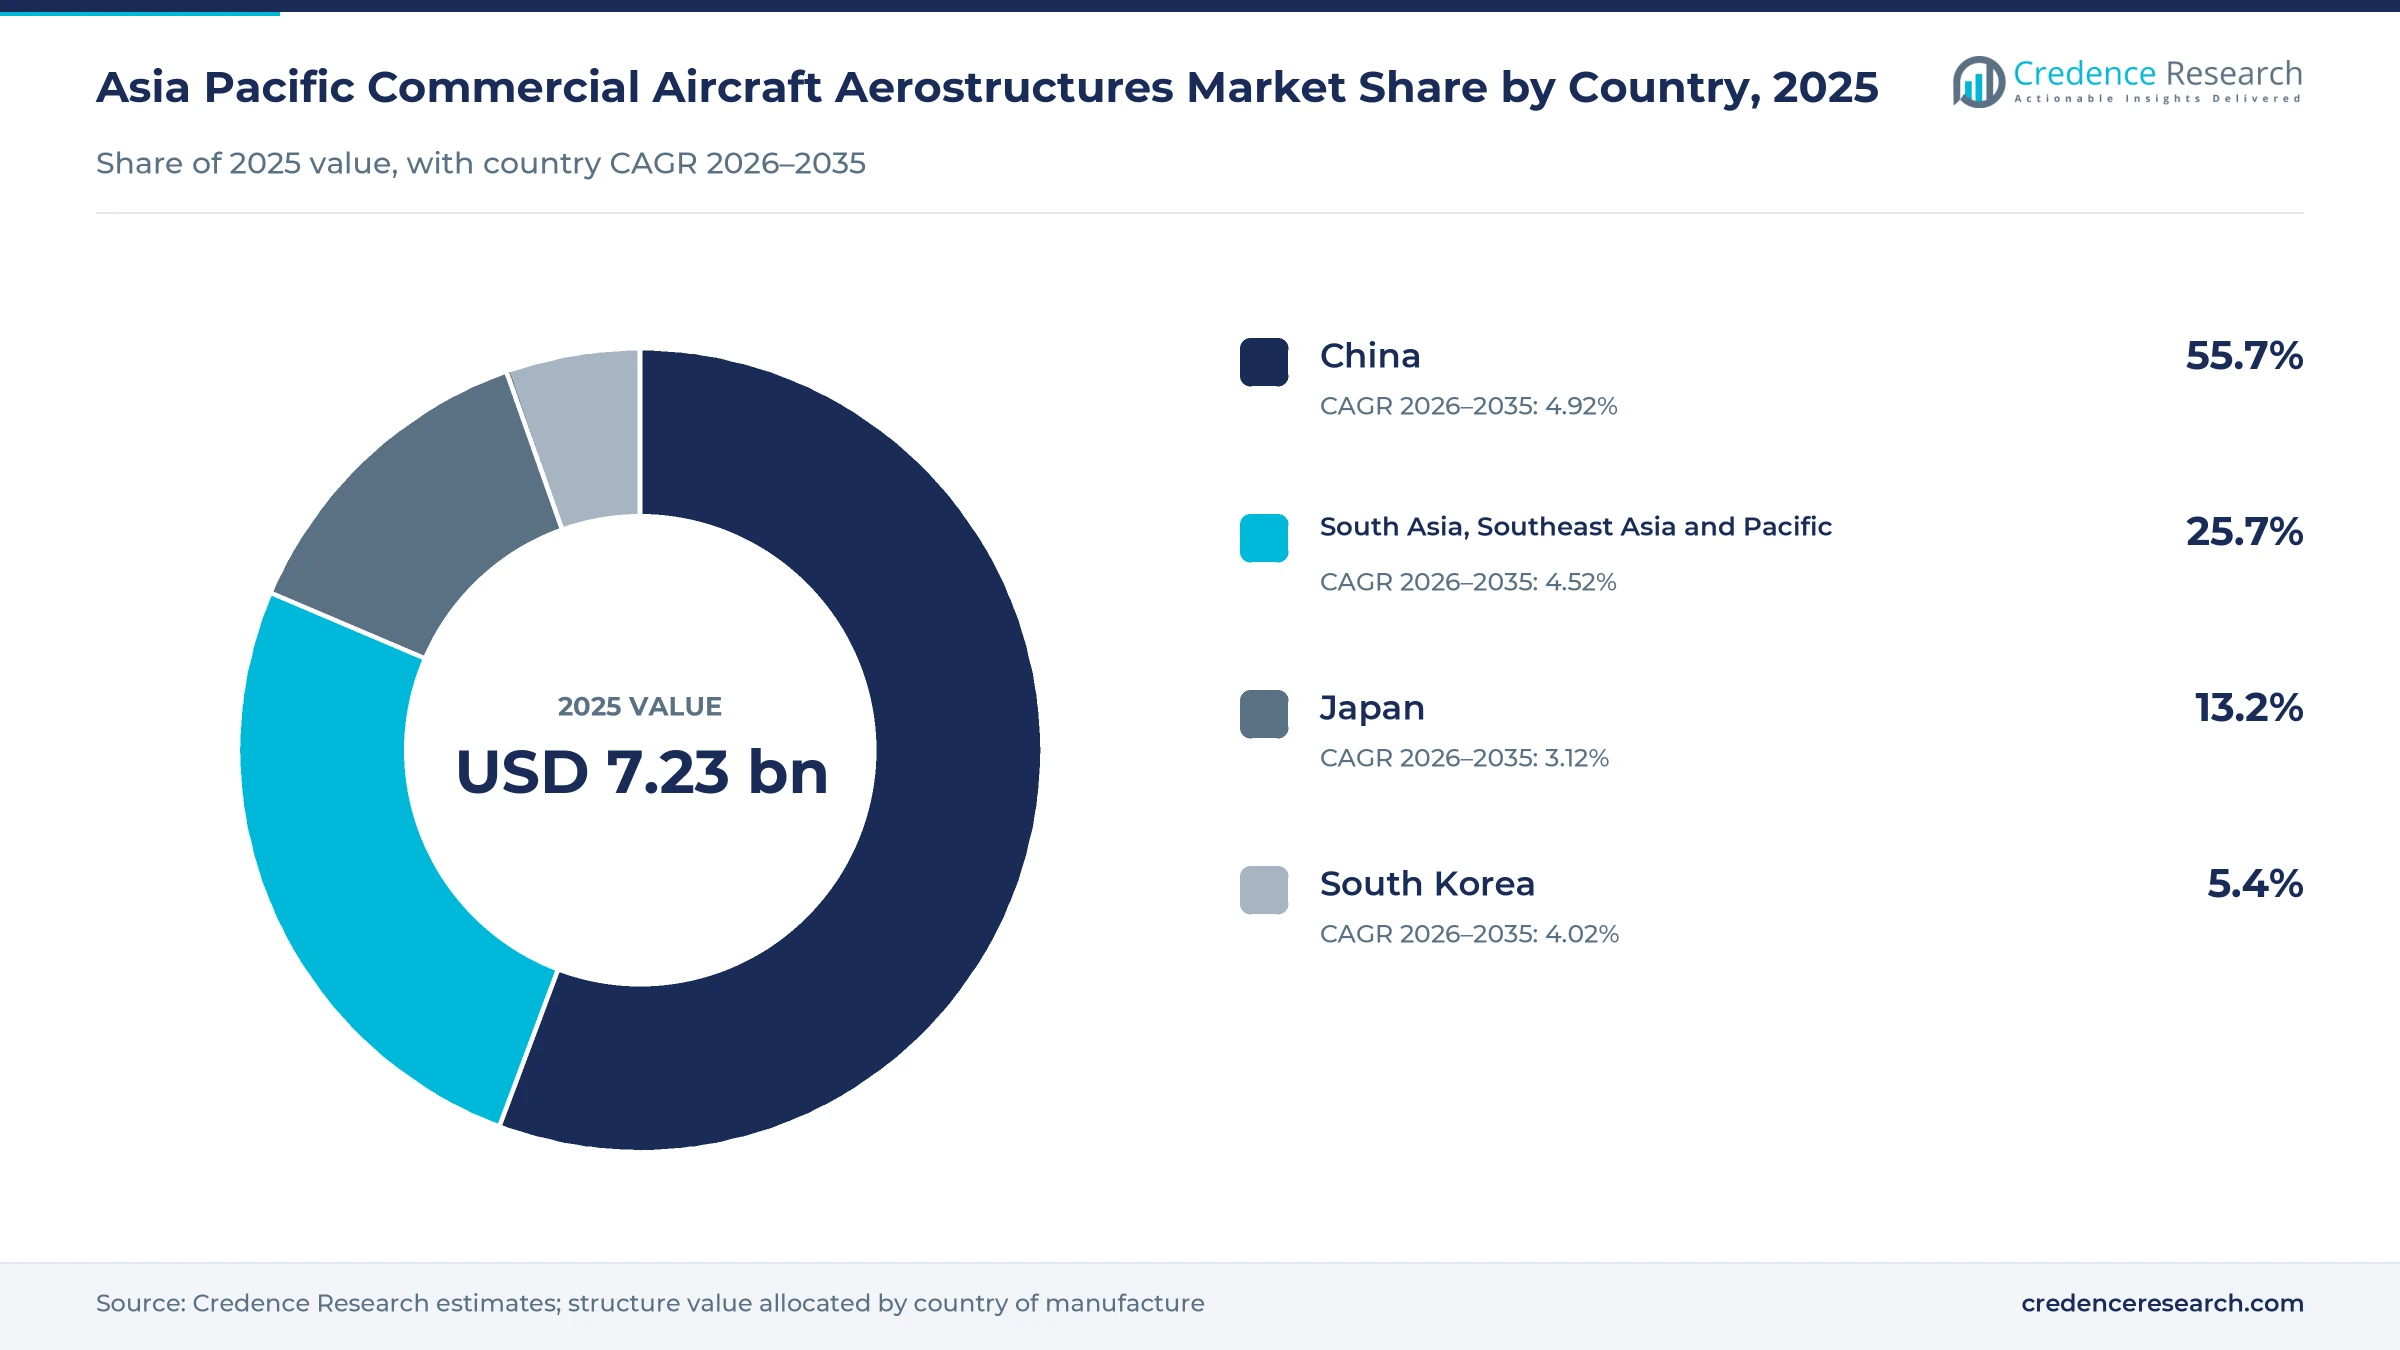
Chinese assembly leads as Japan holds wide-body share
| Country | Value, 2025 (USD billion) | Share, 2025 | CAGR, 2026–2035 |
|---|---|---|---|
| China | 4.03 | 55.7% | 4.92% |
| South Asia, Southeast Asia and Pacific | 1.86 | 25.7% | 4.52% |
| Japan | 0.95 | 13.2% | 3.12% |
| South Korea | 0.39 | 5.4% | 4.02% |
Why does Chinese assembly scale keep the top share?
China held a 55.7% share of 2025 value and grows fastest at 4.92% a year, because it builds C919 airframe sections and hosts two Airbus A320 Family final assembly lines in Tianjin. The Tianjin site has delivered more than 780 A320 Family aircraft since 2008. Airbus opened that second line on Oct. 22, 2025, and expects the site to provide about 20% of its global capacity. However, export reviews on Western systems and labor shortages can slow C919 output in some years.
How does South Asia, Southeast Asia and Pacific add supply?
South Asia, Southeast Asia and Pacific held a 25.7% share of 2025 value and grows at 4.52% a year, because India, Malaysia, Singapore and Australia host growing parts and assembly plants. Airbus buys more than USD 1.6 billion of components and services a year from India, and Mahindra will make A320neo fuselage skins from 2028. Airbus signed contracts with Tata Advanced Systems and Mahindra Aerostructures in January 2024 for A320neo, A330neo and A350 parts.
How does Japan hold its wide-body share?
Japan held a 13.2% share of 2025 value and grows at 3.12% a year, because Mitsubishi Heavy Industries, Kawasaki Heavy Industries and SUBARU build major 787 and 777 sections. Growth is slower than in China, because Japanese work depends on twin-aisle rates, which recovered only to about seven 787s a month in 2025. Boeing broke ground in November 2025 on a second 787 assembly building in South Carolina, part of a USD 1 billion plan to expand capacity.
What role does South Korea play in regional supply?
South Korea held a 5.4% share of 2025 value, because Korea Aerospace Industries and Korean Air build doors, wing parts and wingtips for Airbus and Boeing. Both suppliers are also adding new customers in advanced air mobility and defense programs.
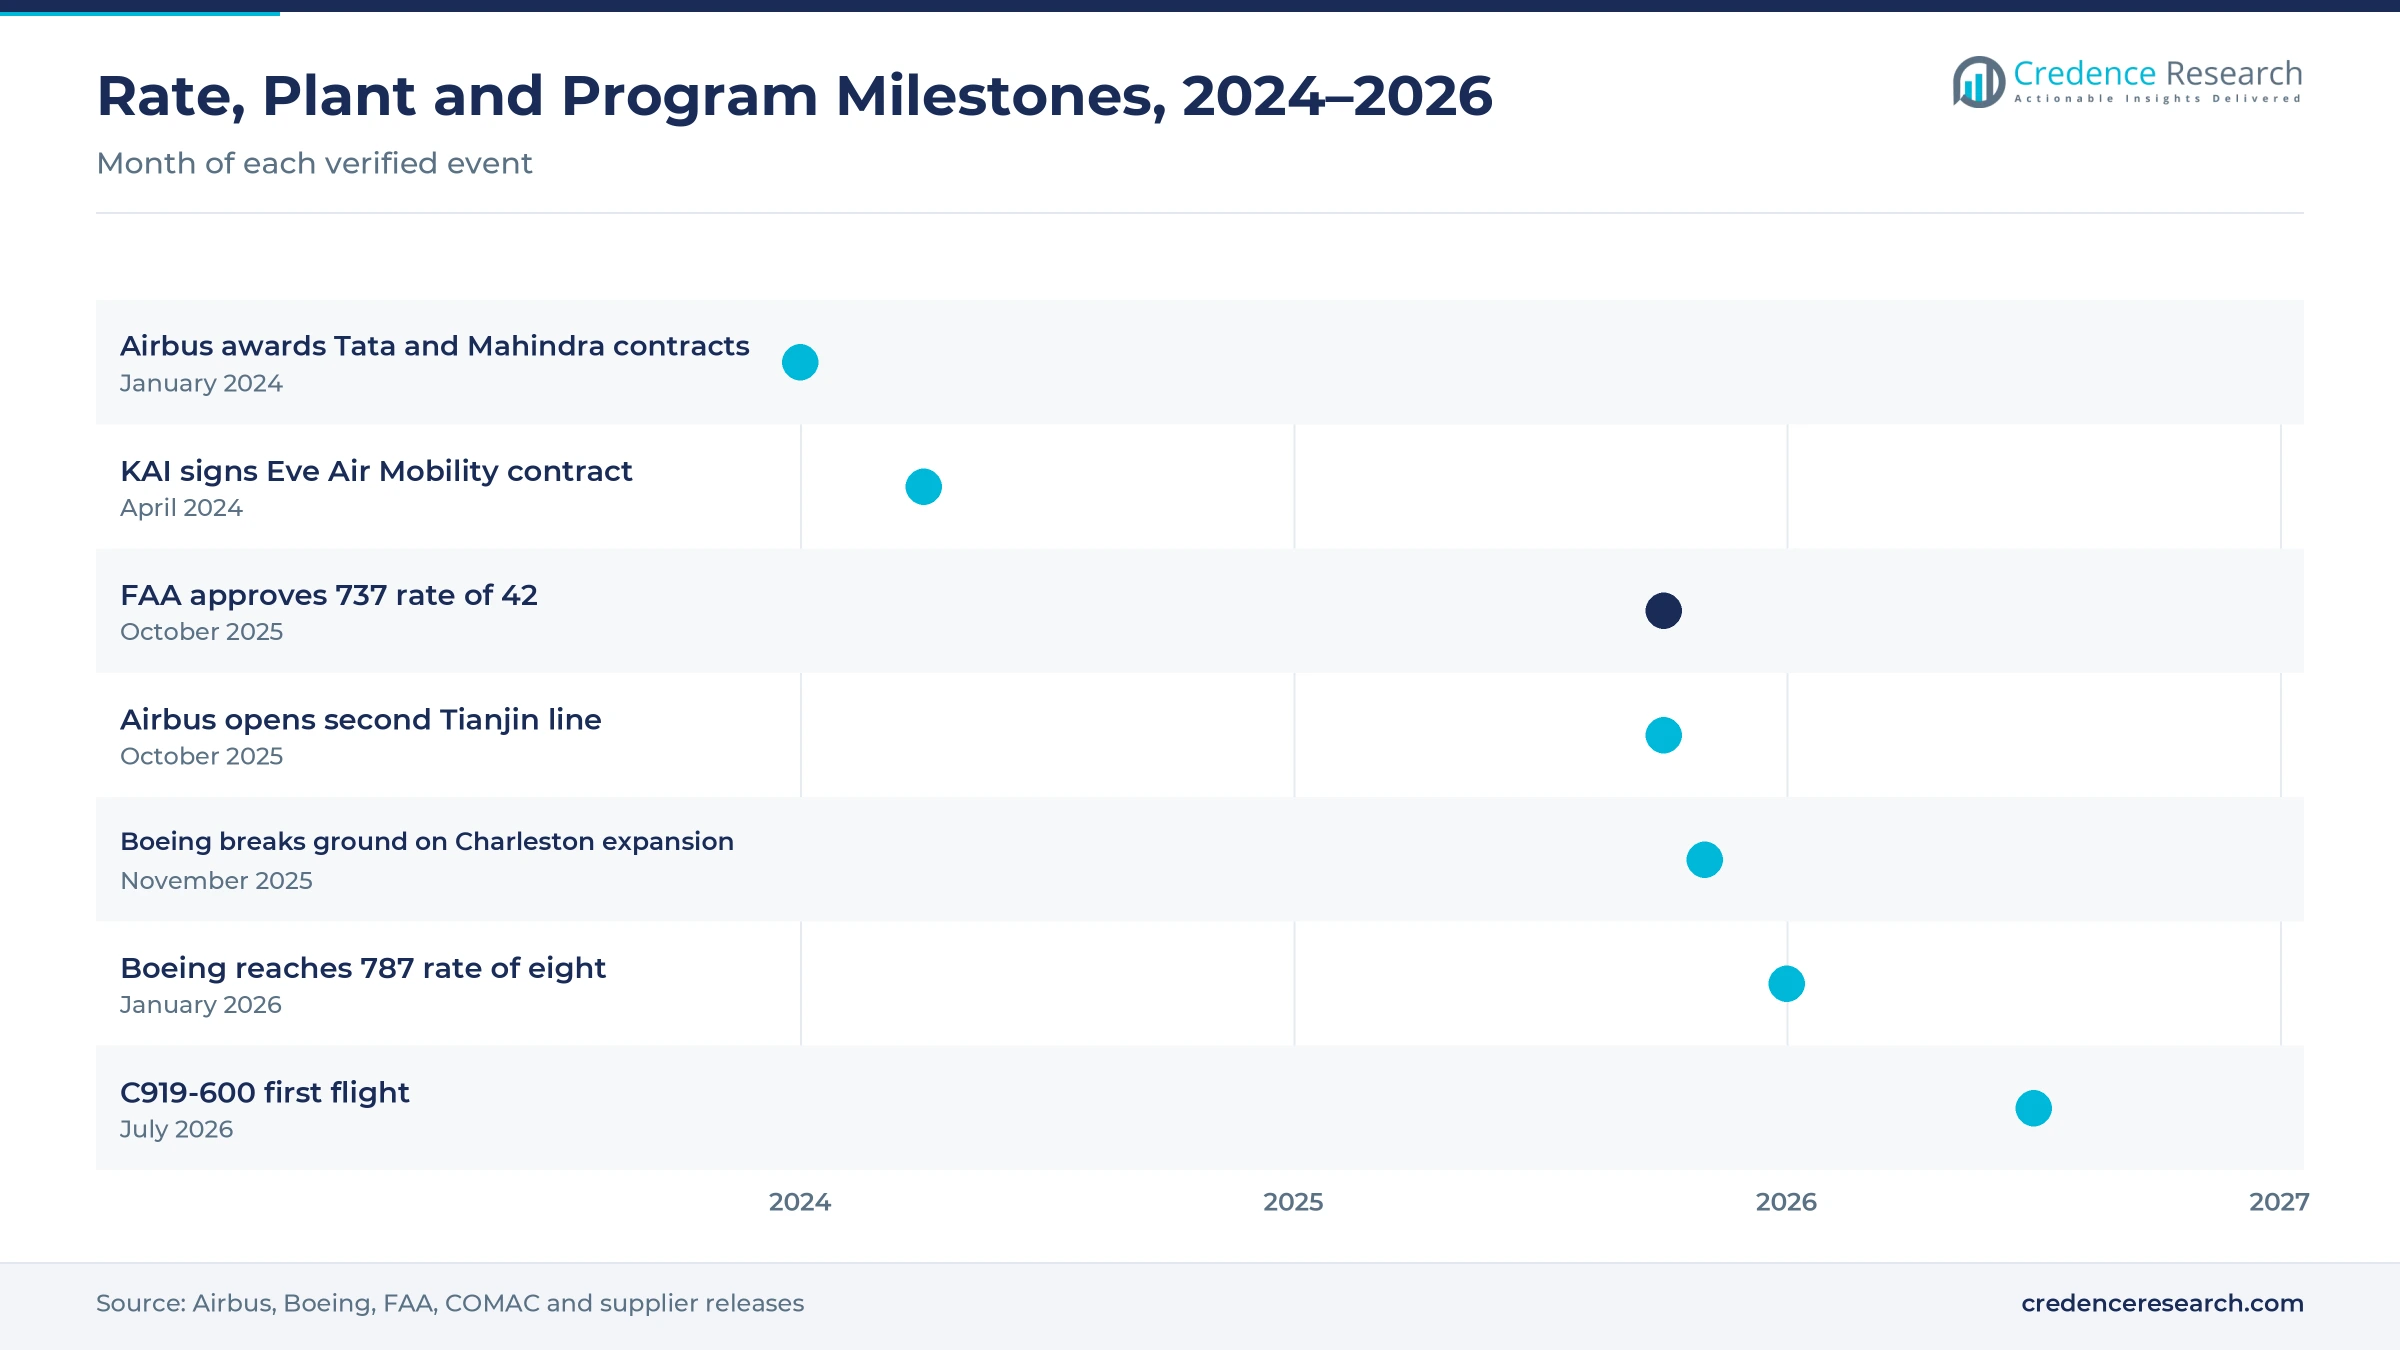
Rate approvals, plants and first flights from 2024 to 2026
| Development | Status and market relevance |
|---|---|
| In January 2024, Airbus awarded Tata Advanced Systems and Mahindra Aerostructures contracts for A320neo, A330neo and A350 parts. | Expands Indian metallic detail part supply |
| In April 2024, Korea Aerospace Industries signed a structural supply contract with Eve Air Mobility. | Adds an eVTOL customer to Airbus and Boeing work |
| In October 2025, the FAA approved a rise in Boeing 737 output to 42 a month. | Lifts narrowbody structure demand after 20 months at 38 |
| In October 2025, Airbus opened its second A320 Family final assembly line in Tianjin. | Supports the plan for 75 A320 Family aircraft a month in 2027 |
| In July 2026, the C919-600 prototype made its first flight. | Remains in flight testing; adds a shortened variant |
Composite and hybrid builds reshape airframe work
- Metallic structures use aluminum and titanium skins, frames and stringers joined by rivets, which suit single-aisle fuselages and many detail parts made in India, China and Korea.
- Composite structures use carbon fiber layup cured in large autoclaves, which suits 787 wing boxes and fuselage sections built by Japanese suppliers.
- Hybrid structures combine composite skins with metallic frames and fittings, which suits center wing boxes, tail sections and newer variants of existing jets.
Need a Custom Version of This Report?
Tailor the scope, geography, or segments to your exact requirements.
- Custom geography or segment scope
- Direct access to our analyst team
Japanese heavies and Korean suppliers compete for packages
Competition is split between Japanese heavy industry groups that build large composite sections for Boeing, Korean suppliers that make doors and wing parts for both Western airframe makers, and Chinese state-owned plants that build C919 sections. Mitsubishi Heavy Industries, Kawasaki Heavy Industries and SUBARU together supply about 35% of 787 content. SUBARU makes center wing boxes for the 777, 787 and 777X at Handa. Korea Aerospace Industries makes doors, fuselage components and wing parts for Airbus and Boeing, while Tata Advanced Systems and Mahindra Aerostructures supply Airbus from India. Rivals compete on composite know-how, rate readiness, quality records and cost. Because airframe makers sign long-term contracts by program, suppliers with proven quality and spare capacity win the new packages that follow rate increases.
Companies profiled and their roles in this market
| Company | Type | Role in the market |
|---|---|---|
| Mitsubishi Heavy Industries | Japanese heavy industry group | Part of the Japanese group supplying about 35% of 787 content |
| Kawasaki Heavy Industries | Japanese heavy industry group | Part of the Japanese group supplying 787 and 777 sections |
| SUBARU | Japanese aerospace and automotive group | Center wing boxes for the 777, 787 and 777X at Handa |
| Korea Aerospace Industries | Korean aerospace maker | Doors, fuselage components and wing parts for Airbus and Boeing |
Credence Research view on regional airframe supply
Credence Research's view is that Asia Pacific demand for commercial aerostructures will grow steadily because Boeing, Airbus and COMAC are all raising output from a low base. China remains the core of the market, while India adds the most new supplier capacity. Japanese suppliers depend on 787 and 777X rates, which should improve through 2030. Suppliers of commercial aircraft aerostructures that combine composite skills, proven quality records and spare capacity should gain share fastest as rate increases continue. Export controls and quality oversight remain the main risks to this view.
How the regional airframe structures estimate was built
The report uses 2025 as the base year on a calendar basis, and market values come from the Credence Research model. That model combines aircraft production rates, delivery data, supplier content shares, air traffic statistics and company announcements on contracts and plants. Segment splits and country growth rates are Credence Research estimates, while country shares follow the client-defined split. Sources used are public reports, official statistics, trade press and company releases, and no interviews or surveys were used for this commercial aircraft aerostructures estimate.
Narrowbody rates and C919 output carry growth to 2035
Structure value is expected to reach USD 11.30 billion by 2035, a 4.54% CAGR during 2026–2035, as narrowbody rates rise and the C919 program grows. Growth should stay steady through 2030 while Boeing and Airbus lift output and Indian suppliers add capacity. After that, new C919 variants and wide-body rate gains will carry more growth. Stable supply chains would support margins, while export controls or quality problems would slow output. Suppliers with composite skills and spare capacity are expected to gain the most.
Frequently Asked Questions
How big is the Asia Pacific commercial aircraft aerostructures market?
Which product type leads regional demand?
Which country leads the Asia Pacific aerostructures market?
How much of the Boeing 787 is built in Japan?
How many C919s has COMAC delivered?
Which technology is growing fastest?
Who are the leading companies in Asia Pacific aerostructures?
What are the main challenges for suppliers?
Table of Content
Chapter 1 Market Segmentation
- 1.1 Segmentation Framework
- 1.1.1 Product and Service Classification
- 1.1.2 Application and End-Use Classification
- 1.1.3 Technology and Solution Classification
- 1.1.4 Customer and Distribution Channel Classification
- 1.1.5 Geographic Segmentation
- 1.1.6 Market Segment Definitions and Boundaries
- 1.2 By Product Type
- 1.2.1 Fuselage structures
- 1.2.2 Wing structures
- 1.2.3 Empennage and flight-control structures
- 1.2.4 Nacelle and pylon structures
- 1.3 By Aircraft Type
- 1.3.1 Single-aisle aircraft
- 1.3.2 Twin-aisle aircraft
- 1.3.3 Regional aircraft
- 1.4 By Customer Type
- 1.4.1 Airframe OEMs
- 1.4.2 Aerostructure integrators
- 1.4.3 Captive manufacturing entities
- 1.5 By Technology
- 1.5.1 Metallic structures
- 1.5.2 Composite structures
- 1.5.3 Hybrid structures
- 1.6 By Country
- 1.6.1 Japan
- 1.6.2 China
- 1.6.3 South Korea
- 1.6.4 South Asia, Southeast Asia and Pacific
Chapter 2 Introduction
- 2.1 Report Objectives and Scope
- 2.2 Product Definition and Industry Terminology
- 2.3 Market Inclusions and Exclusions
- 2.4 Research Process
- 2.4.1 Primary Research and Expert Interviews
- 2.4.2 Secondary Research and Source Review
- 2.4.3 Top-Down and Bottom-Up Estimation
- 2.4.4 Data Triangulation and Verification
- 2.5 Market Size Measurement Basis
- 2.5.1 2025: USD 7.23 billion → 2035: USD 11.30 billion
- 2.6 Historical and Forecast Reference Periods
- 2.6.1 Historical Period: 2018-2025
- 2.6.2 Base Year: 2025
- 2.6.3 Forecast Period: 2025-2035
- 2.7 Research Assumptions and Limitations
Chapter 3 Executive Summary
- 3.1 Market Snapshot and Key Findings
- 3.2 Base-Year Market Size, 2025
- 3.3 Forecast Market Size, 2035
- 3.4 Revenue and Volume Growth Outlook
- 3.5 Key Demand and Supply Indicators
- 3.6 Leading Market Segments
- 3.7 Fastest-Growing Market Opportunities
- 3.8 Regional Performance Highlights
- 3.9 Technology and Industry Transformation
- 3.10 Competitive Landscape Summary
- 3.11 Analyst View and Strategic Implications
Chapter 4 Asia Pacific Commercial Aircraft Aerostructures Market Trends and Developments
- 4.1 Historical Industry Development, 2018-2025
- 4.2 Recent Market Trends and Developments
- 4.3 Demand and Customer Behavior Trends
- 4.4 Technology and Product Innovation
- 4.5 Artificial Intelligence, Automation and Digitalization
- 4.6 Local Manufacturing and Supply Chain Realignment
- 4.7 Industry Partnerships, Mergers and Acquisitions
- 4.8 Sustainability and Circular Economy Developments
- 4.9 Government and Private Sector Investment Trends
- 4.10 Emerging Business Models and Commercialization
- 4.11 Industry Developments and Announcements
Chapter 5 Asia Pacific Commercial Aircraft Aerostructures Market Production, Supply and Demand Analysis
- 5.1 Demand Trend and Consumption Analysis, 2018-2025
- 5.2 Demand Forecast, 2025-2035
- 5.3 Production and Output Trend, 2018-2025
- 5.4 Production and Output Forecast, 2025-2035
- 5.5 Installed Capacity and Capacity Utilization
- 5.6 Company-Wise Production Plants and Statistics
- 5.6.1 Installed Production Capacity
- 5.6.2 Actual Production
- 5.6.3 Planned Capacity and Expansion Targets
- 5.7 Supply Chain Structure and Procurement Trends
- 5.8 Supply-Demand Gap and Bottlenecks
- 5.9 Import Dependence and Sourcing Structure
- 5.10 Contract Manufacturing and Outsourcing
- 5.11 Regional Supply and Demand Concentration
Chapter 6 Asia Pacific Commercial Aircraft Aerostructures Market Pricing Analysis
- 6.1 Pricing Structure and Measurement
- 6.2 Historical Pricing Trends, 2018-2025
- 6.3 Pricing Outlook, 2025-2035
- 6.4 Average Selling Price and Unit Economics
- 6.5 Pricing by Product and Market Segment
- 6.6 Geographic Pricing Differences
- 6.7 Key Input, Energy, Labor and Logistics Costs
- 6.8 Contract Pricing and Purchasing Models
- 6.9 Pricing Sensitivity and Competitive Positioning
- 6.10 Price, Margin and Profitability Implications
Chapter 7 Asia Pacific Commercial Aircraft Aerostructures Market Dynamics
- 7.1 Market Growth Drivers
- 7.1.1 Demand-Side Drivers
- 7.1.2 Technology and Innovation Drivers
- 7.1.3 Infrastructure and Investment Drivers
- 7.1.4 Regulatory and Policy Drivers
- 7.2 Market Restraints
- 7.2.1 Cost and Affordability Constraints
- 7.2.2 Technology and Adoption Barriers
- 7.2.3 Supply Chain and Operational Constraints
- 7.3 Market Challenges
- 7.3.1 Competitive Pressure and Margin Erosion
- 7.3.2 Skills, Infrastructure and Implementation Gaps
- 7.4 Emerging Market Opportunities
- 7.5 Market Dynamics Impact and Time-Horizon Assessment
Chapter 8 Asia Pacific Commercial Aircraft Aerostructures Value Chain Analysis
- 8.1 Industry Value Chain Overview
- 8.2 Upstream Suppliers and Critical Inputs
- 8.3 Technology and Component Providers
- 8.4 Manufacturing or Service Delivery
- 8.5 Distribution, Channel Partners and Integrators
- 8.6 Downstream Applications and End Users
- 8.7 Value Addition and Profit Pools
- 8.8 Vertical Integration and Outsourcing
- 8.9 Supplier Concentration and Risk
- 8.10 Supply Chain Localization and Resilience
Chapter 9 Asia Pacific Commercial Aircraft Aerostructures Market Regulations and Policies
- 9.1 Relevant Laws, Standards and Compliance Frameworks
- 9.2 Product, Service, Safety and Quality Requirements
- 9.3 Government Policies, Incentives and Subsidies
- 9.4 Imports, Exports and Trade Barriers
- 9.5 Public Procurement and Local Content Requirements
- 9.6 Environmental and Sustainability Compliance
- 9.7 Upcoming Policy Changes and Market Implications
Chapter 10 Asia Pacific Commercial Aircraft Aerostructures Market Hotspots and Opportunities
- 10.1 Market Opportunity Mapping and Growth Hotspots
- 10.2 High-Growth Applications and Customer Groups
- 10.3 Underserved Markets and White-Space Opportunities
- 10.4 Emerging Technology and Product Opportunities
- 10.5 New Capacity and Investment Hotspots
- 10.6 Market Entry and Expansion Opportunities
- 10.7 Distribution and Partnership Opportunities
- 10.8 Near-Term and Long-Term Commercial Potential
- 10.9 Opportunity Attractiveness and Execution Risks
Chapter 11 Asia Pacific Commercial Aircraft Aerostructures Market Outlook, 2025-2035
- 11.1 Market Size and Analysis
- 11.1.1 Revenue (Market Measurement: 2025: USD 7.23 billion → 2035: USD 11.30 billion)
- 11.1.2 Market Volume and Quantity Sold
- 11.1.3 Historical Market Size, 2018-2025
- 11.1.4 Base-Year Market Size, 2025
- 11.2 Market Forecast, 2025-2035
- 11.2.1 Revenue Forecast to 2035
- 11.2.2 Volume Forecast to 2035
- 11.2.3 CAGR and Year-on-Year Growth
- 11.2.4 Incremental Revenue Opportunity
- 11.3 Forecast Assumptions and Scenario Analysis
- 11.3.1 Base-Case Forecast
- 11.3.2 Optimistic and Conservative Scenarios
- 11.3.3 Technology, Pricing and Policy Sensitivities
- 11.4 Market Attractiveness and Growth Outlook
Chapter 12 Asia Pacific Commercial Aircraft Aerostructures Market Segmentation and Outlook
- 12.1 Segmentation Summary and Market Shares, 2025
- 12.2 Largest and Fastest-Growing Segments
- 12.3 By Product Type - Market Size and Forecast, 2025-2035
- 12.3.1 Segment Definition and Scope
- 12.3.2 Historical Market Size, 2018-2025
- 12.3.3 Revenue Forecast, 2025-2035
- 12.3.4 Volume Forecast, 2025-2035
- 12.3.5 Base-Year Market Share, 2025
- 12.3.6 Segment CAGR and Growth Drivers
- 12.3.7 Subsegment Market Size and Forecast
- 12.3.7.1 Fuselage structures
- 12.3.7.2 Wing structures
- 12.3.7.3 Empennage and flight-control structures
- 12.3.7.4 Nacelle and pylon structures
- 12.3.8 Subsegment Pricing and Adoption Trends
- 12.3.9 Leading Suppliers and Competition
- 12.3.10 Regional Demand and Opportunities
- 12.4 By Aircraft Type - Market Size and Forecast, 2025-2035
- 12.4.1 Segment Definition and Scope
- 12.4.2 Historical Market Size, 2018-2025
- 12.4.3 Revenue Forecast, 2025-2035
- 12.4.4 Volume Forecast, 2025-2035
- 12.4.5 Base-Year Market Share, 2025
- 12.4.6 Segment CAGR and Growth Drivers
- 12.4.7 Subsegment Market Size and Forecast
- 12.4.7.1 Single-aisle aircraft
- 12.4.7.2 Twin-aisle aircraft
- 12.4.7.3 Regional aircraft
- 12.4.8 Subsegment Pricing and Adoption Trends
- 12.4.9 Leading Suppliers and Competition
- 12.4.10 Regional Demand and Opportunities
- 12.5 By Customer Type - Market Size and Forecast, 2025-2035
- 12.5.1 Segment Definition and Scope
- 12.5.2 Historical Market Size, 2018-2025
- 12.5.3 Revenue Forecast, 2025-2035
- 12.5.4 Volume Forecast, 2025-2035
- 12.5.5 Base-Year Market Share, 2025
- 12.5.6 Segment CAGR and Growth Drivers
- 12.5.7 Subsegment Market Size and Forecast
- 12.5.7.1 Airframe OEMs
- 12.5.7.2 Aerostructure integrators
- 12.5.7.3 Captive manufacturing entities
- 12.5.8 Subsegment Pricing and Adoption Trends
- 12.5.9 Leading Suppliers and Competition
- 12.5.10 Regional Demand and Opportunities
- 12.6 By Technology - Market Size and Forecast, 2025-2035
- 12.6.1 Segment Definition and Scope
- 12.6.2 Historical Market Size, 2018-2025
- 12.6.3 Revenue Forecast, 2025-2035
- 12.6.4 Volume Forecast, 2025-2035
- 12.6.5 Base-Year Market Share, 2025
- 12.6.6 Segment CAGR and Growth Drivers
- 12.6.7 Subsegment Market Size and Forecast
- 12.6.7.1 Metallic structures
- 12.6.7.2 Composite structures
- 12.6.7.3 Hybrid structures
- 12.6.8 Subsegment Pricing and Adoption Trends
- 12.6.9 Leading Suppliers and Competition
- 12.6.10 Regional Demand and Opportunities
- 12.7 By Country - Market Size and Forecast, 2025-2035
- 12.7.1 Segment Definition and Scope
- 12.7.2 Historical Market Size, 2018-2025
- 12.7.3 Revenue Forecast, 2025-2035
- 12.7.4 Volume Forecast, 2025-2035
- 12.7.5 Base-Year Market Share, 2025
- 12.7.6 Segment CAGR and Growth Drivers
- 12.7.7 Subsegment Market Size and Forecast
- 12.7.7.1 Japan
- 12.7.7.2 China
- 12.7.7.3 South Korea
- 12.7.7.4 South Asia, Southeast Asia and Pacific
- 12.7.8 Subsegment Pricing and Adoption Trends
- 12.7.9 Leading Suppliers and Competition
- 12.7.10 Regional Demand and Opportunities
- 12.8 Segment Growth Comparison
- 12.9 Segment Attractiveness and Priority Matrix
Chapter 13 Asia Pacific Commercial Aircraft Aerostructures End-Use and Application Market Outlook
- 13.1 End-Use Industry and Customer Demand Structure
- 13.2 Leading Applications and Customer Groups
- 13.3 End-Use Market Size, Share and Forecast
- 13.4 Major End-Use Industry Deep Dives
- 13.4.1 Customer Requirements and Use Cases
- 13.4.2 Demand and Replacement Cycles
- 13.4.3 Technical and Regulatory Considerations
- 13.4.4 Purchasing and Procurement Models
- 13.4.5 Leading Vendors and Distribution Channels
- 13.4.6 Forecast and Commercial Opportunities
- 13.5 Emerging Applications and Cross-Segment Demand
- 13.6 End-Use Industry Investment Priorities
Chapter 14 Asia Pacific Commercial Aircraft Aerostructures Geographic Market Outlook, 2025-2035
- 14.1 Regional Market Size and Country-Level Shares, 2025
- 14.2 Country Market Size Comparison, 2025
- 14.3 Country Market Forecasts, 2025-2035
- 14.4 Subregional Industrial and Demand Clusters
- 14.5 Intra-Regional Pricing and Cost Differences
- 14.6 Cross-Border Trade and Supply Networks
- 14.7 Regional Supply and Demand Balances
- 14.8 Country Opportunity Comparison and Prioritization
Note: Every listed country is covered on the structure shown under the first country.
Chapter 15 Asia Pacific Commercial Aircraft Aerostructures Technology, Innovation and Sustainability Outlook
- 15.1 Technology Landscape and Maturity
- 15.2 Product, Process and Service Innovation
- 15.3 AI, Automation and Digital Tools in the Industry
- 15.4 Technology Adoption and Performance Benchmarking
- 15.5 Innovation Pipeline and R&D Investment
- 15.6 Patent and Intellectual Property Trends
- 15.7 Energy Efficiency and Resource Management
- 15.8 Sustainability, Recycling and Circularity
- 15.9 Technology Roadmap, 2025-2035
- 15.10 Risks of Obsolescence and Technology Substitution
Chapter 16 Asia Pacific Commercial Aircraft Aerostructures Market Key Strategic Imperatives
- 16.1 Growth and Market Entry Priorities
- 16.2 High-Return Products and Segments
- 16.3 Pricing, Profitability and Cost Optimization
- 16.4 Technology Investment and Product Differentiation
- 16.5 Supply Chain Localization and Resilience
- 16.6 Distribution and Customer Acquisition
- 16.7 Partnership, Acquisition and Capacity Strategy
- 16.8 Regional Expansion Priorities
- 16.9 Short-, Medium- and Long-Term Actions
Chapter 17 Competition Outlook
- 17.1 Industry Competition Characteristics
- 17.2 Market Structure and Concentration
- 17.3 Market Share and Competitive Positioning, 2025
- 17.4 Company-Wise Revenue and Product Benchmarking
- 17.5 Production and Service Capacity Benchmarking
- 17.6 Technology, Pricing and Differentiation
- 17.7 Regional Footprint and Distribution Strength
- 17.8 Mergers, Acquisitions and Strategic Alliances
- 17.9 New Entrants and Competitive Threats
- 17.10 Porter's Five Forces and Industry Attractiveness
- 17.11 Competitive Outlook, 2025-2035
Chapter 18 Company Profiles
- 18.1 Company Coverage and Selection Criteria
- 18.2 Kawasaki Heavy Industries
- 18.2.1 Business Description
- 18.2.2 Company Ownership and Geographic Presence
- 18.2.3 Product and Service Portfolio
- 18.2.4 Manufacturing and Operating Footprint
- 18.2.5 Production Capacity and Expansion Plans
- 18.2.6 Financial Performance and Investment
- 18.2.7 Market Share and Competitive Position
- 18.2.8 Technology and Innovation Capabilities
- 18.2.9 Strategic Alliances or Partnerships
- 18.2.10 Recent Developments
- 18.2.11 Growth Strategy and Outlook
- 18.3 Mitsubishi Heavy Industries
- 18.4 Korea Aerospace Industries
- 18.5 SUBARU
- 18.6 ShinMaywa Industries
- 18.7 Other Relevant Market Participants
Note: Every listed company is profiled on the structure shown under the first company. The company list is preliminary and may change based on research findings, market developments, data availability and client requirements.
Chapter 19 Disclaimer
- 19.1 Research and Forecast Disclaimer
- 19.2 Data Source and Estimation Limitations
Note: The depth of individual sections depends on data availability for this market. Volume, capacity, trade and other unit-based metrics are included where applicable.

