
3D Printed Unmanned Aerial Systems Market: USD 156.0 million in 2025, Driven by Defense Buyers
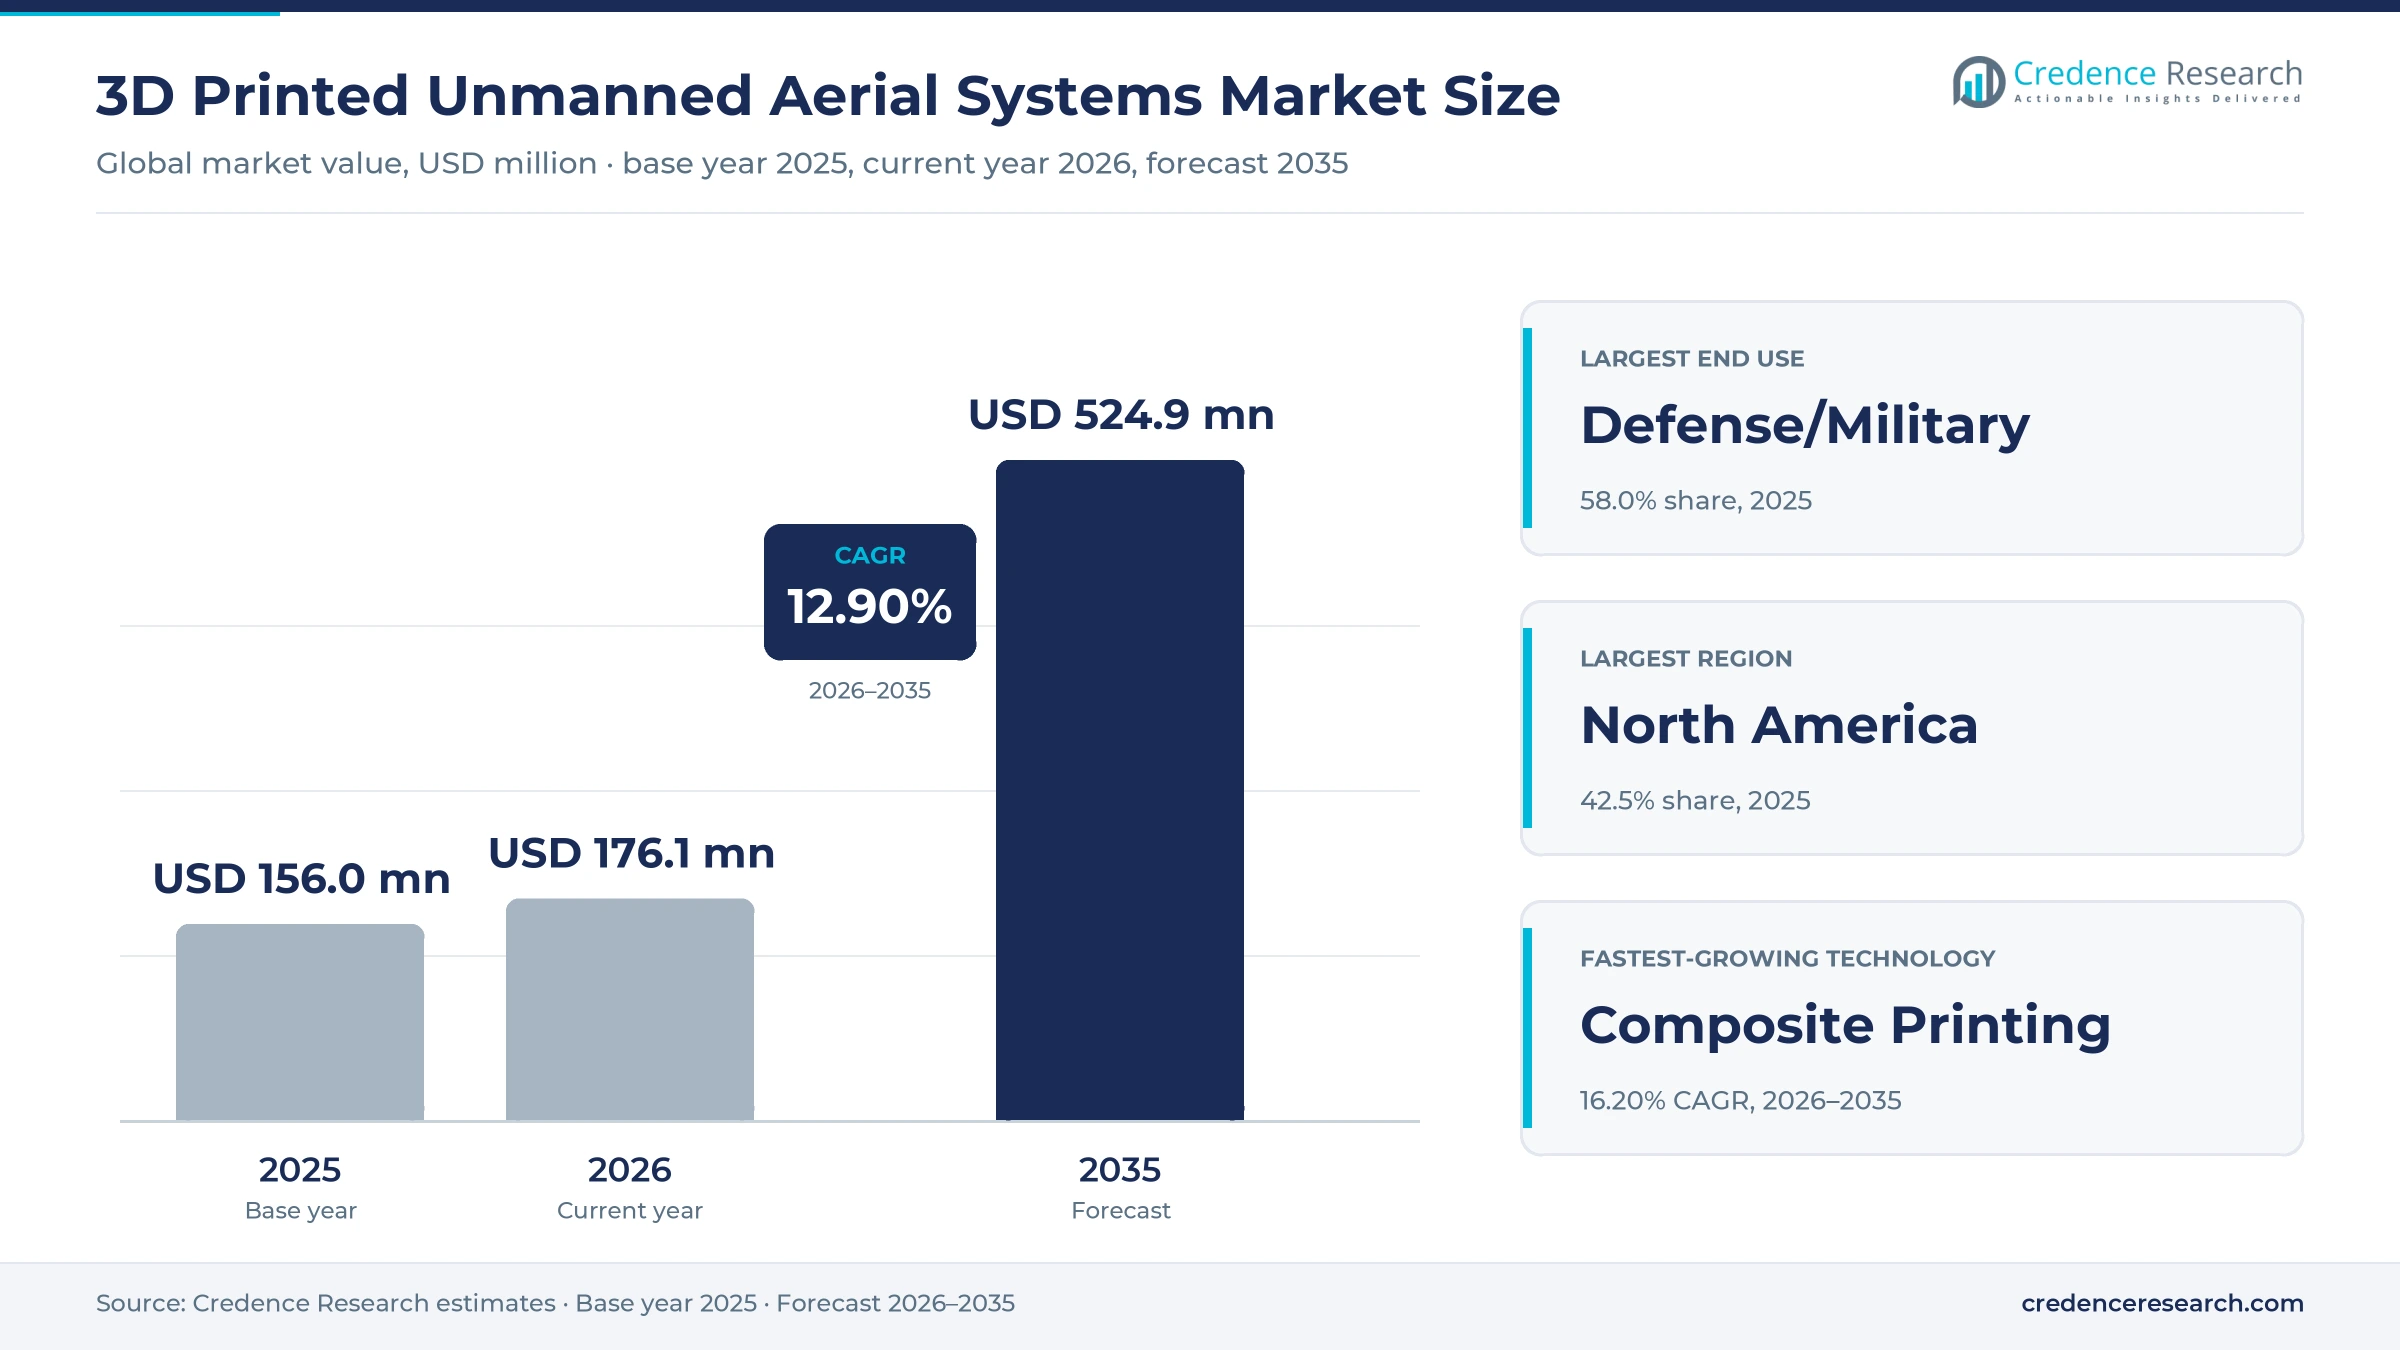
Defense buyers accounted for 58.0% of the USD 156.0 million spent on 3D printed unmanned aerial systems in 2025. Credence Research projects the market to reach USD 524.9 million by 2035, a 12.90% CAGR over 2026–2035, from an estimated USD 176.1 million in 2026. Armed forces want large numbers of low-cost drones that can be redesigned in weeks, and printing airframes and parts close to where they are used makes that possible.
The value measured here is the printed content of drones, not the full aircraft. Electronics, motors, batteries and sensors are bought separately and fall outside the market.
What does the market cover?
The market covers additively manufactured parts for unmanned aircraft and the printing services that produce them. The scope includes:
- Printed airframes, propulsion housings, payload mounts, landing gear and other structural parts.
- Material extrusion, selective laser sintering, stereolithography, metal powder bed fusion and composite printing in thermoplastics, fiber-reinforced composites, metals and photopolymers.
- Fixed-wing, multirotor and hybrid VTOL drones in nano, small tactical and medium or large sizes.
The scope excludes printers sold to forces, which are covered in the military 3D and 4D printing market, and any payload or weapon. Values are in USD million at current prices, allocated to the region of the drone buyer.
How was the estimate built?
All figures are Credence Research estimates, built from drone production volumes by size class, the printed share of each airframe, typical material and machine-time costs, and announced contracts for printed drones.
Why does procurement policy matter so much?
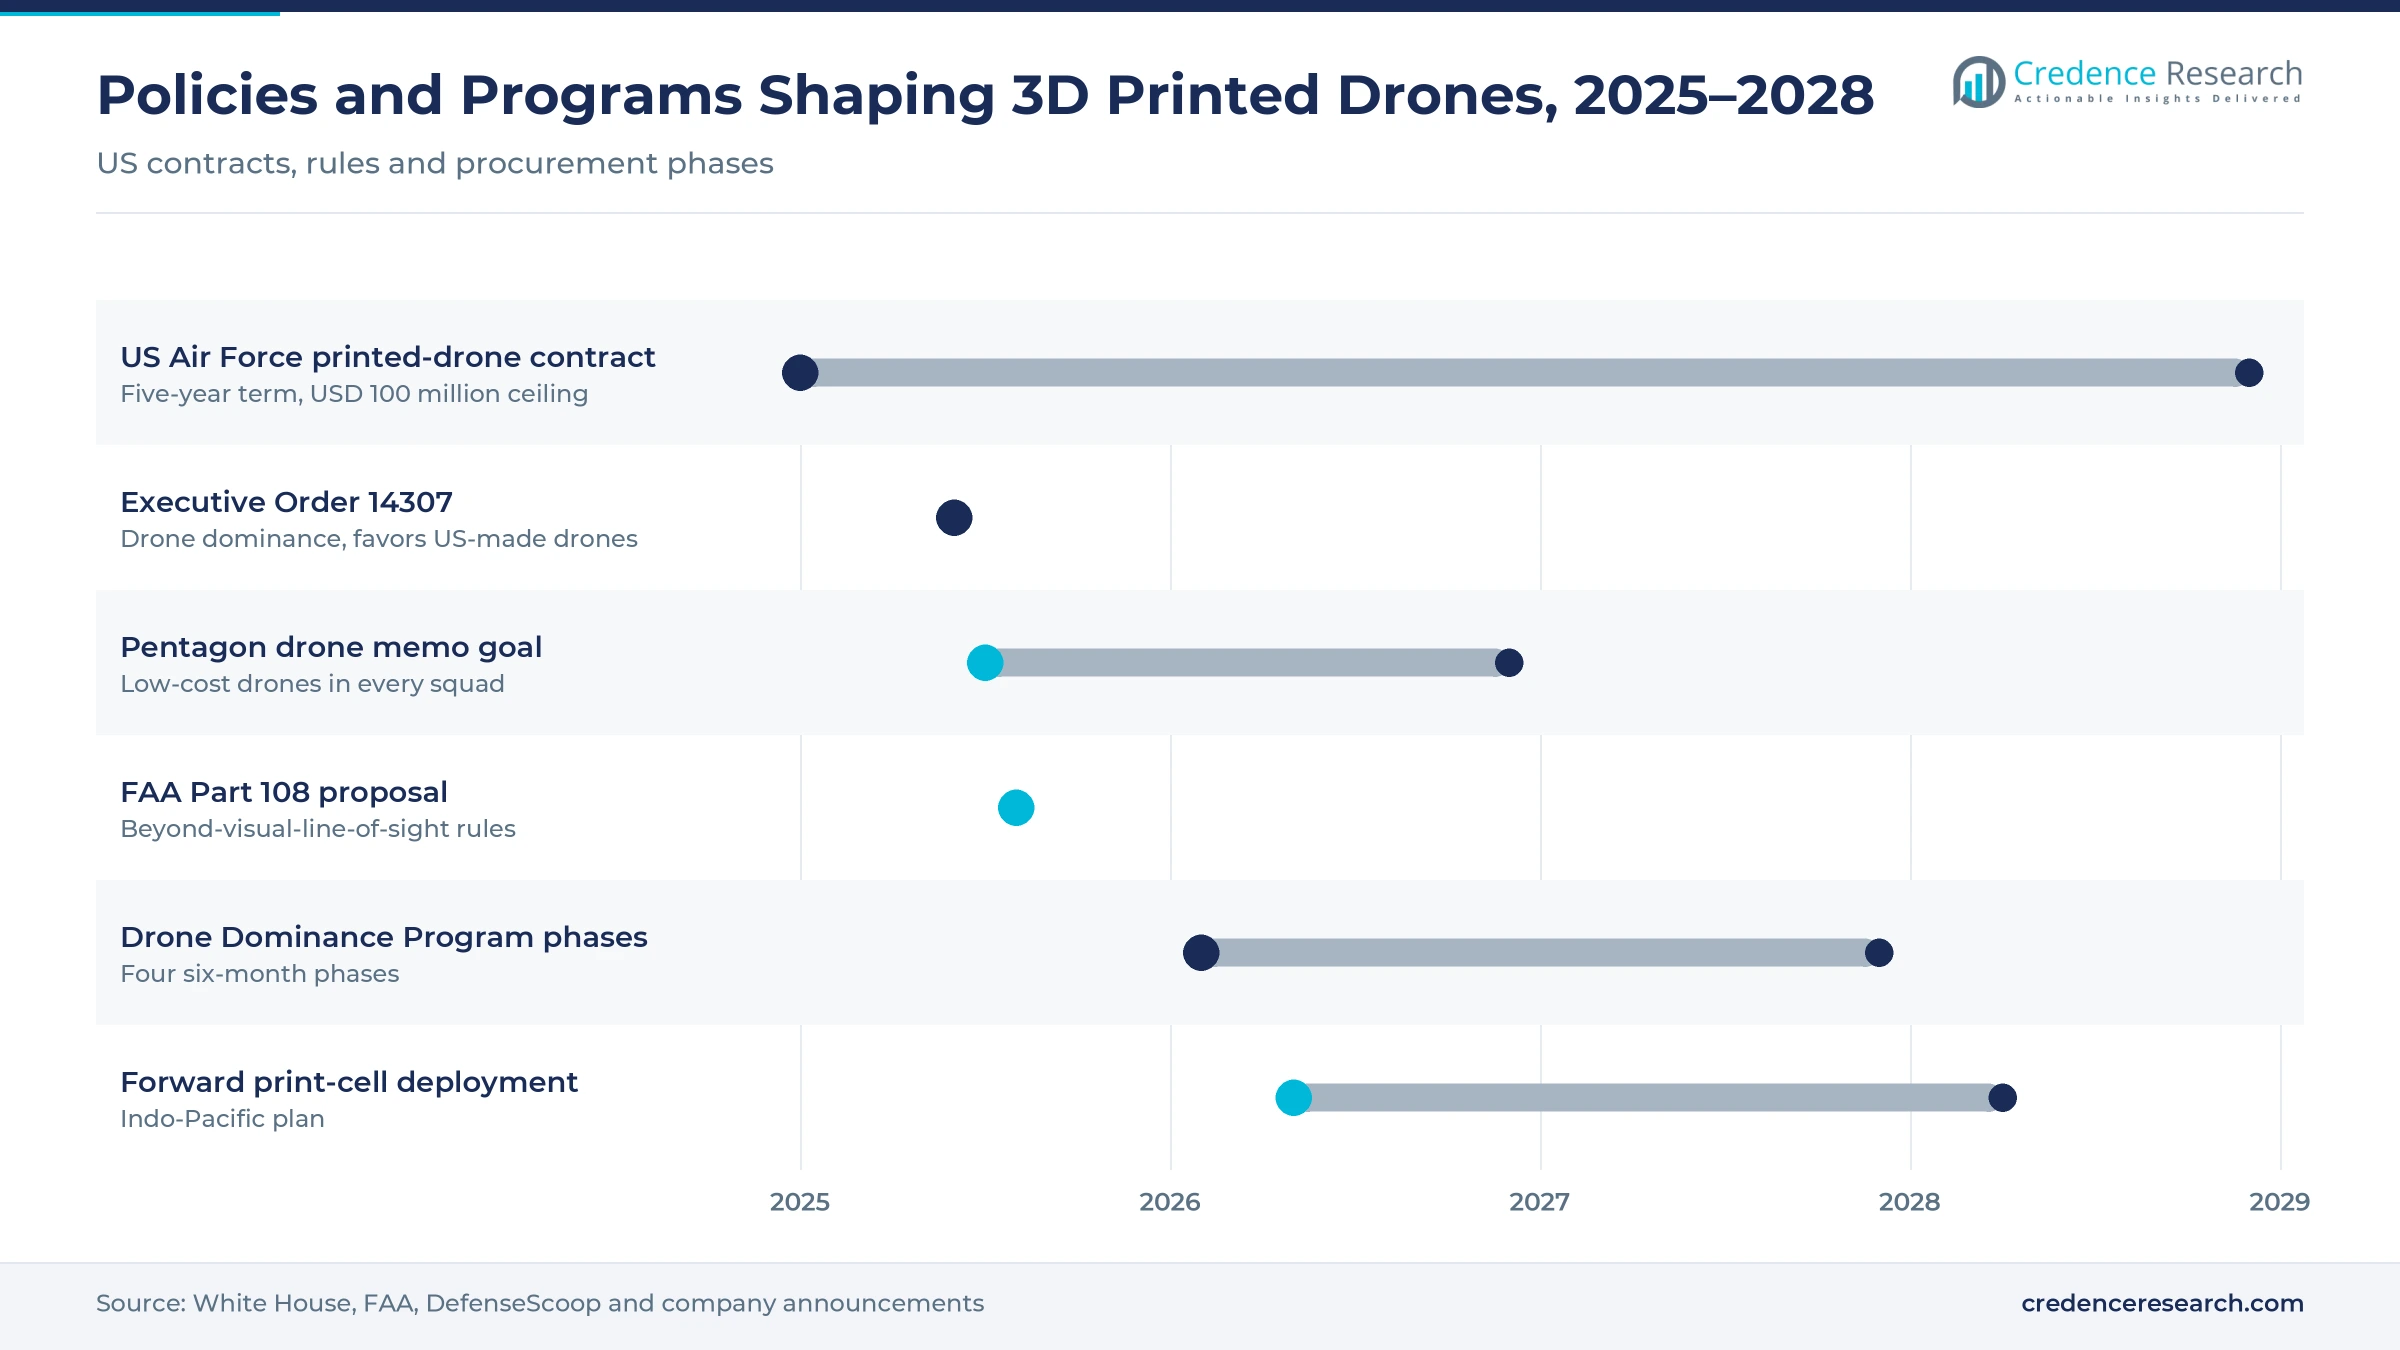
US policy now favors cheap, expendable drones. A July 2025 Pentagon memo called for low-cost drones in every squad by the end of 2026, according to DefenseScoop, and printed airframes are among the fastest ways to meet that volume.
Report Attributes
| Attribute | Details |
|---|---|
| Historical Period | 2018–2024 |
| Base Year | 2025 |
| Forecast Period | 2026–2035 |
| Market Size 2025 | USD 156.0 million |
| Market Size 2026 (estimate) | USD 176.1 million |
| Market Size 2035 (forecast) | USD 524.9 million |
| CAGR (2026–2035) | 12.90% |
| Segments Covered | By Platform, By Component, By Printing Technology, By Material, By End Use, By Size |
| Regions Covered | North America, Europe, Asia Pacific, Latin America, Middle East & Africa |
| Companies Covered | 3D Systems Corporation, AeroVironment, Inc., General Atomics Aeronautical Systems, Northrop Grumman, The Boeing Company, Lockheed Martin, Airbus, Stratasys Ltd., Kratos Defense & Security Solutions |
3D Printed Unmanned Aerial Systems Market Insights
- The 3D printed unmanned aerial systems market was worth USD 156.0 million in 2025 and is forecast to reach USD 524.9 million by 2035, a 12.90% CAGR over 2026–2035.
- Credence Research estimates the market at USD 176.1 million in 2026, the current year.
- Defense demand for customizable drones is the strongest driver, adding about 3.6 percentage points to the forecast CAGR.
- Defense and military use holds 58.0% of value and grows fastest at 13.73% a year.
- Airframes lead components with 42.0%; composite printing grows fastest at 16.20%.
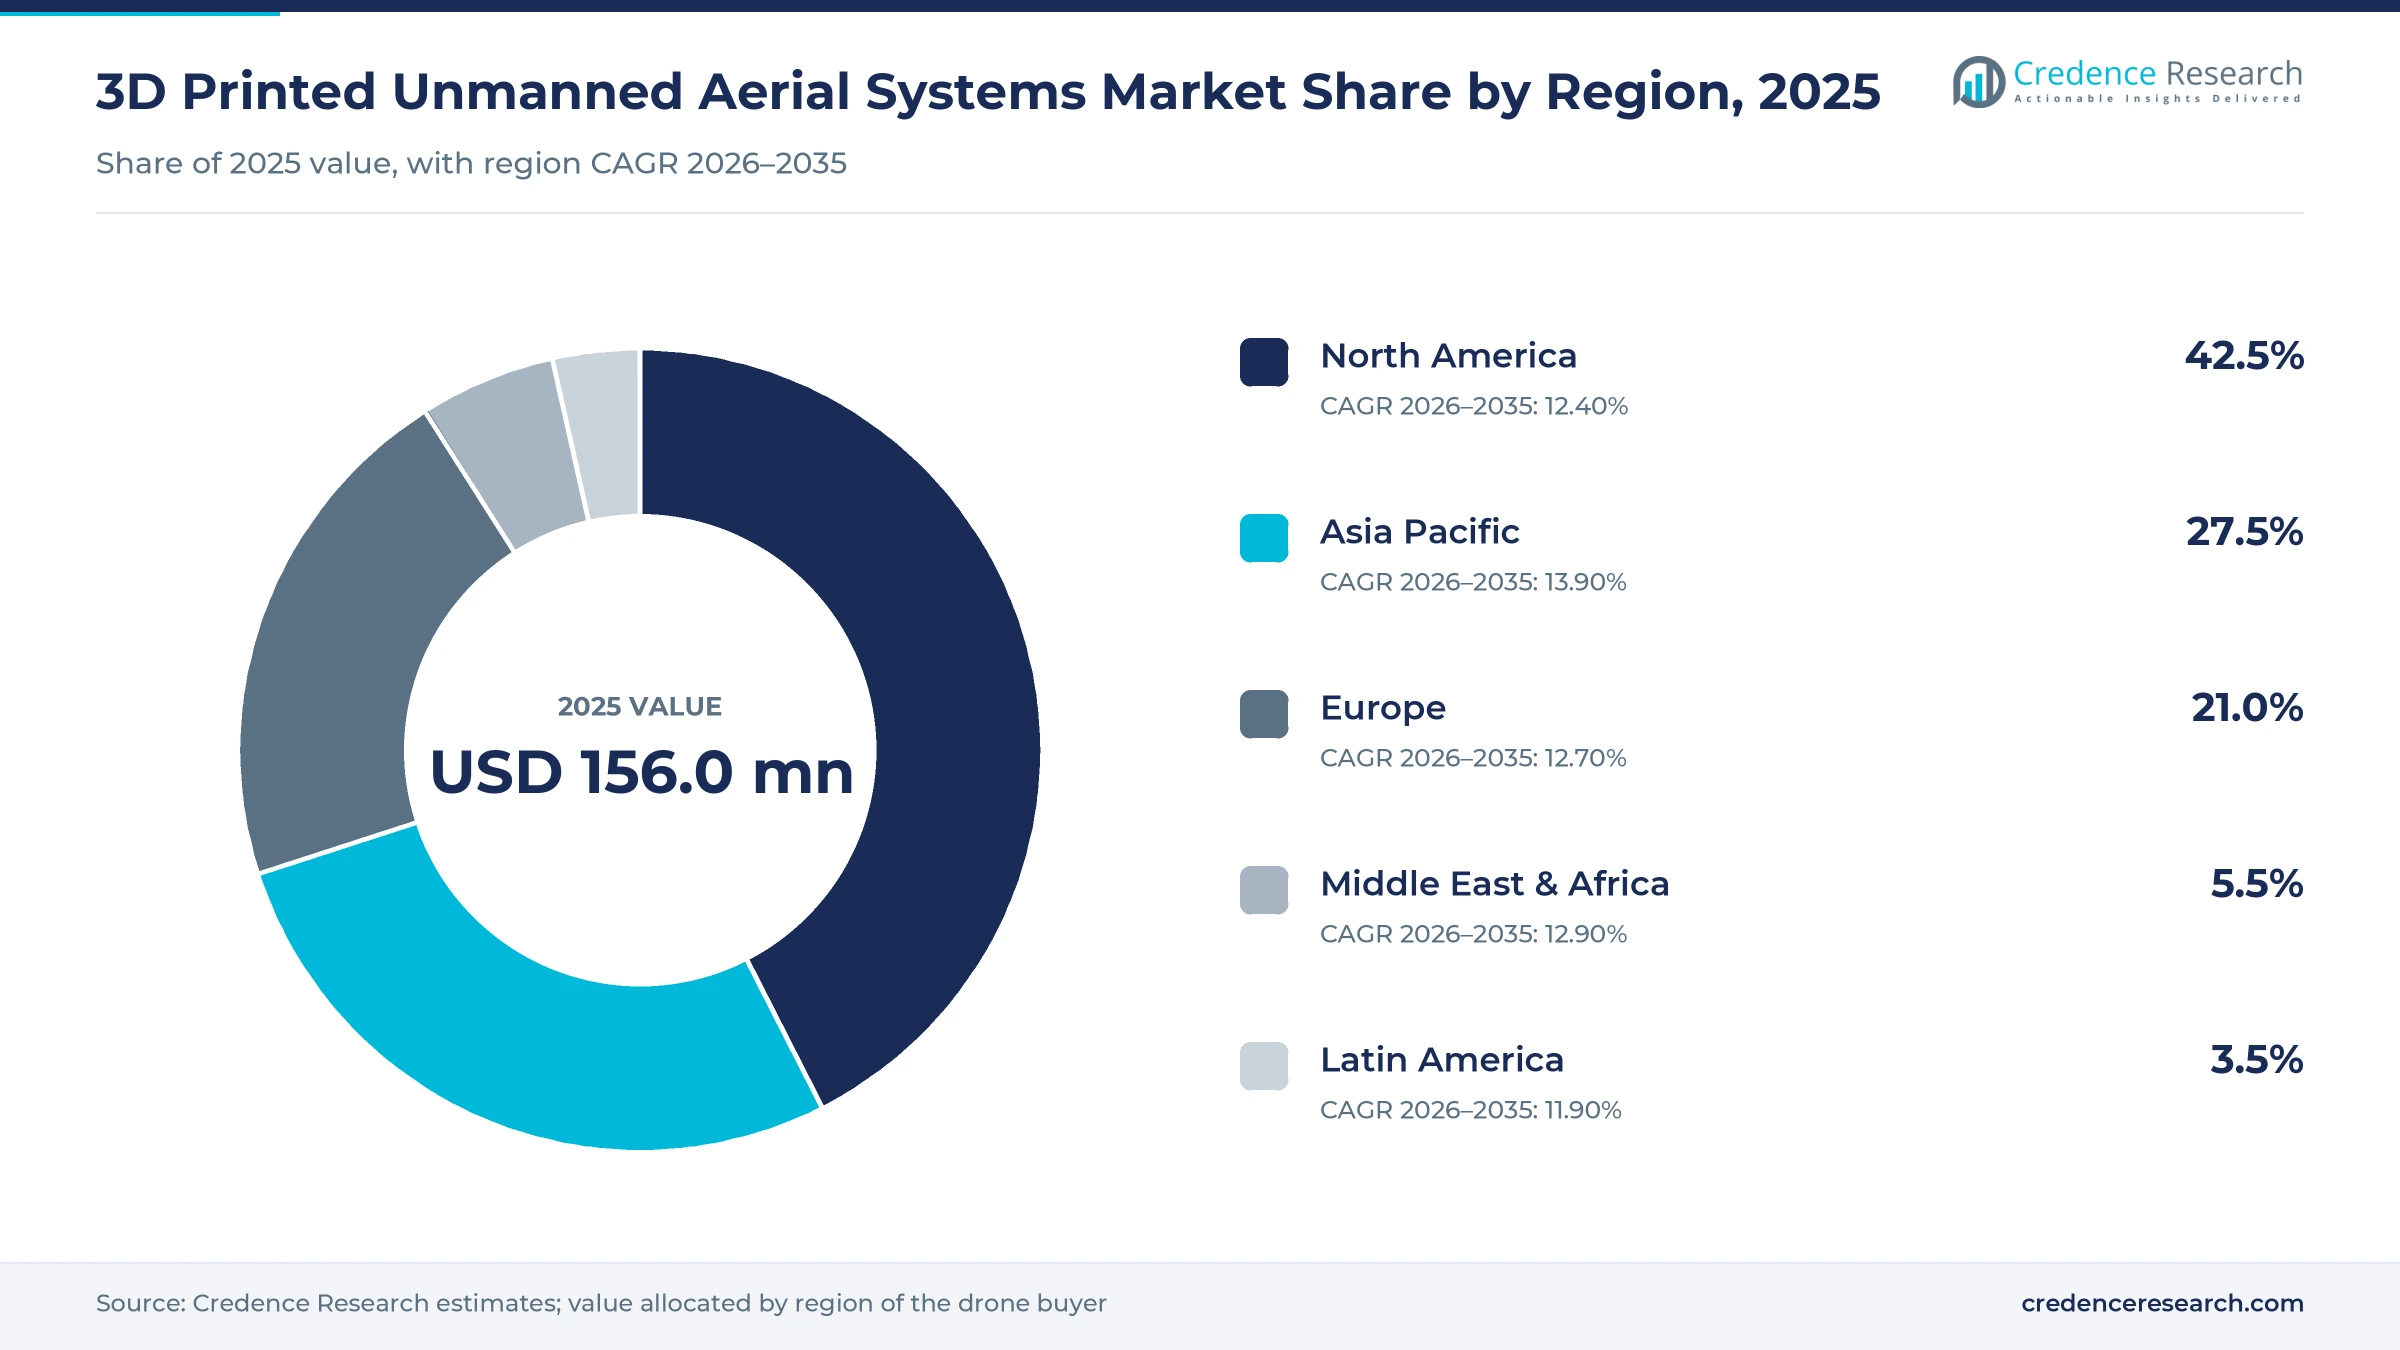
- North America is the largest region at 42.5%; Asia Pacific grows fastest at 13.90%.
Printed Multirotor Airframes for Defense Users Hold the Largest Share
Which platform and size lead?
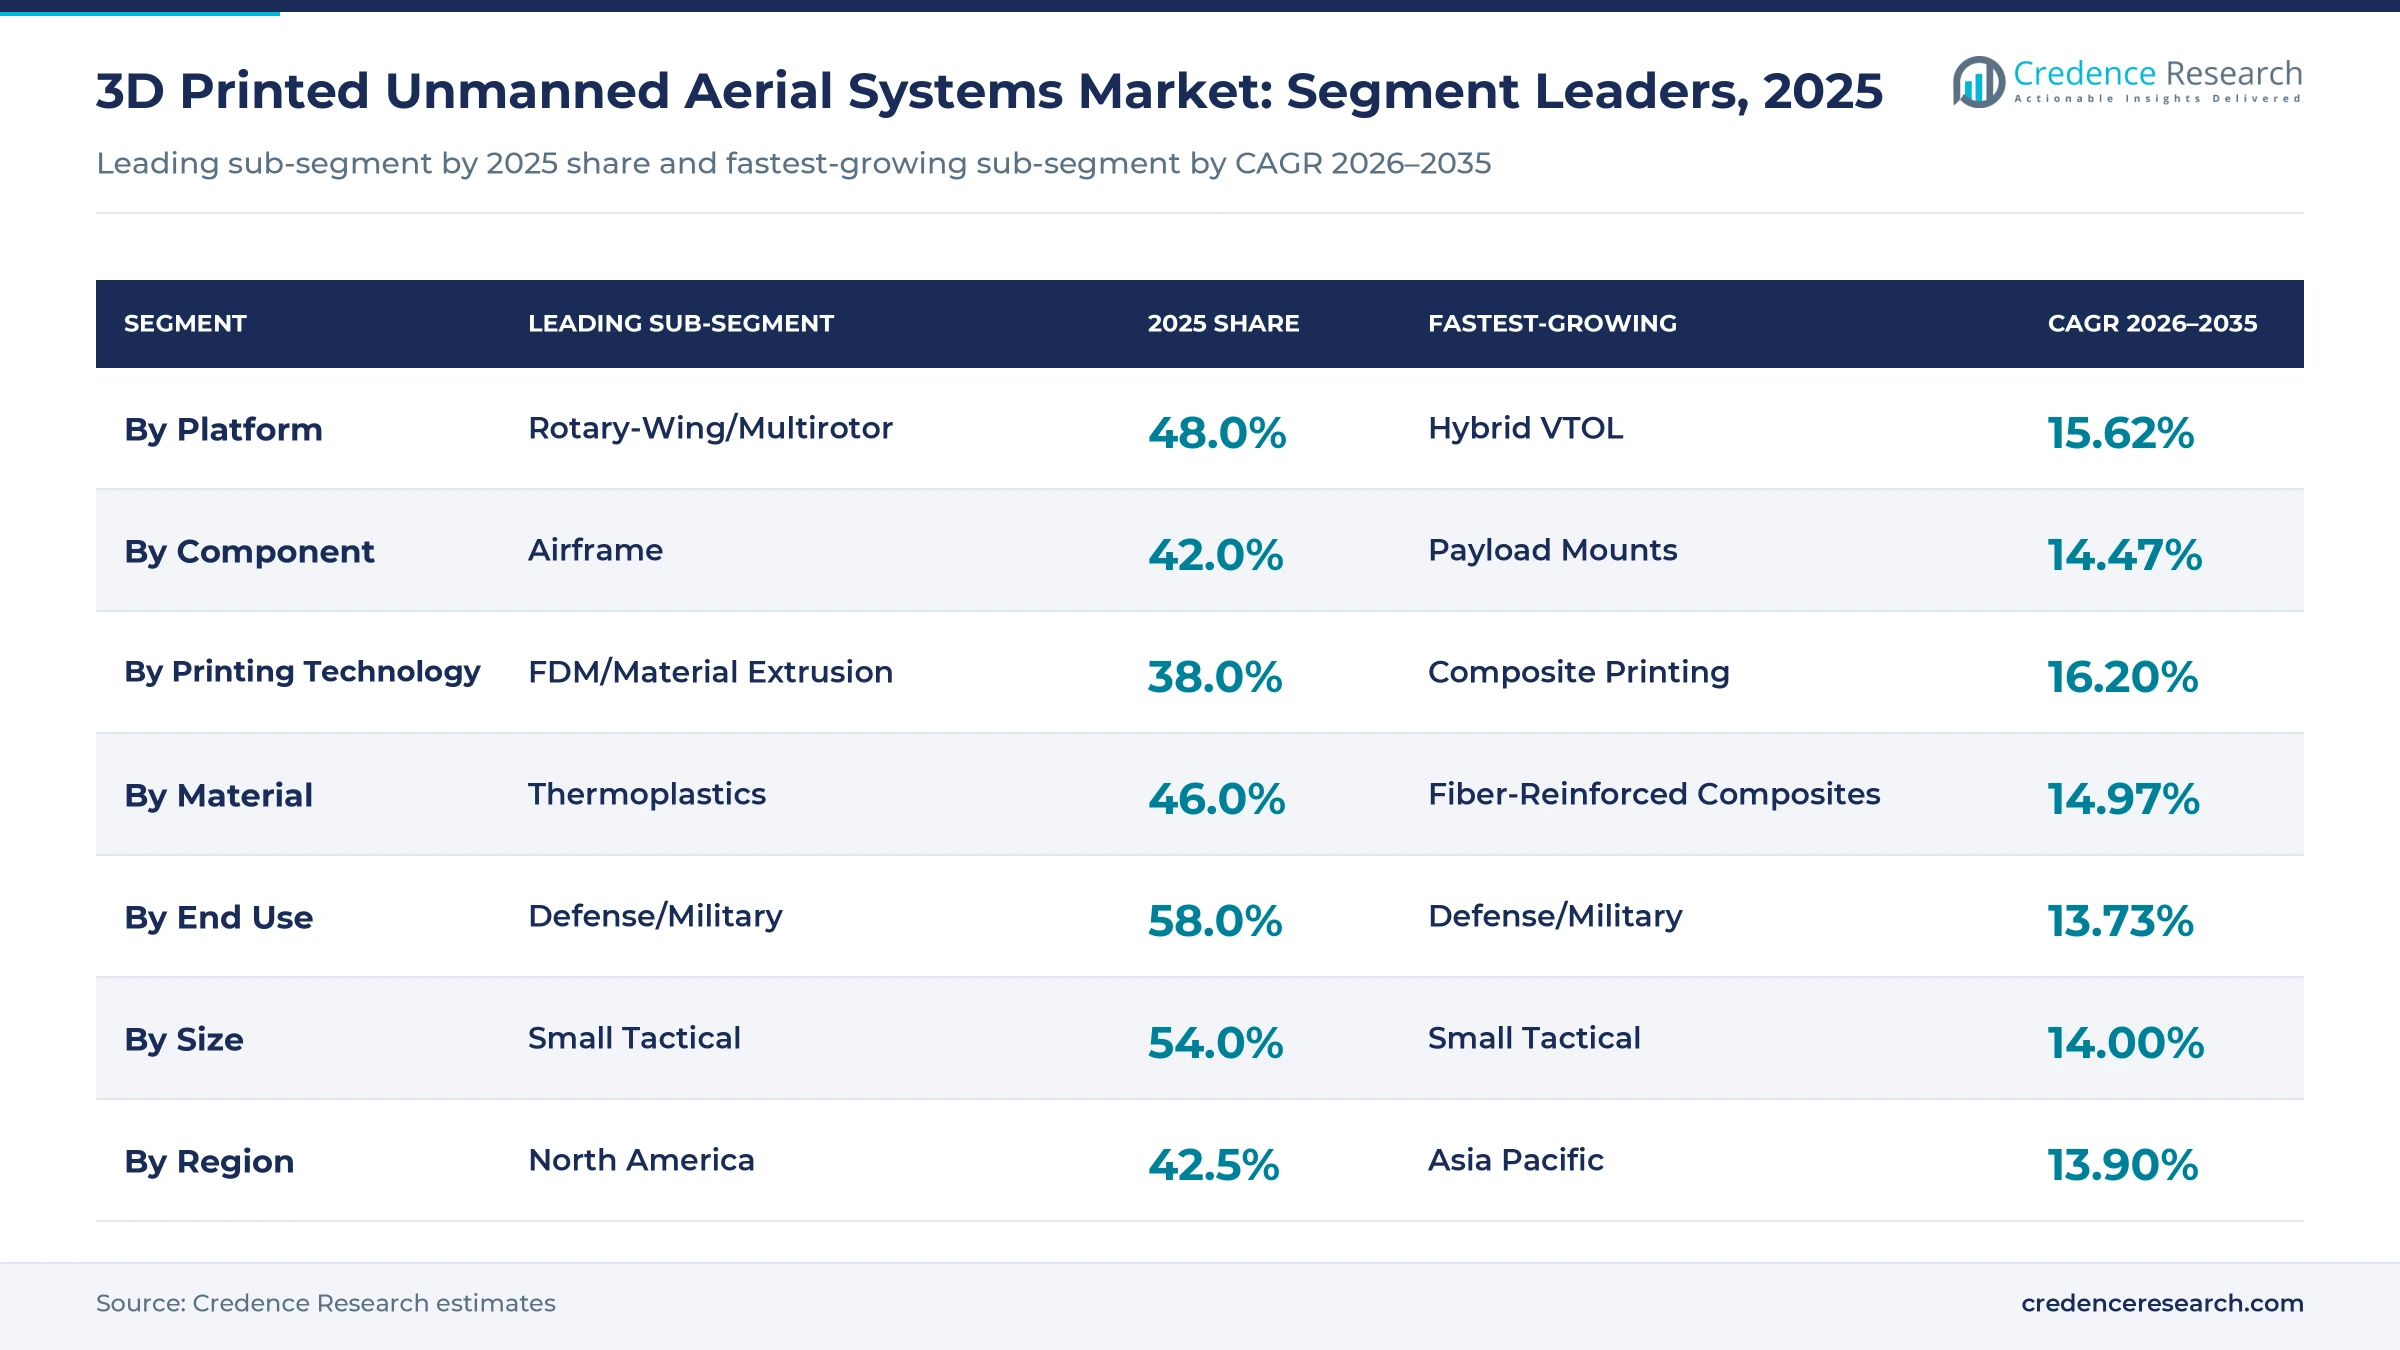
Rotary-wing and multirotor drones lead with a 48.0% share in 2025, and hybrid VTOL grows fastest at 15.62% a year. Small tactical drones lead sizes with 54.0% and grow fastest at 14.00%.
Which component leads?
Airframes lead with a 42.0% share because they are the largest printed part in most drones. Payload mounts grow fastest at 14.47% a year as forces swap sensors for each mission.
Which technology and material lead?
Material extrusion leads technologies with a 38.0% share, and composite printing grows fastest at 16.20%. Thermoplastics lead materials with 46.0%, while fiber-reinforced composites grow fastest at 14.97%.
Which end use leads?
Defense and military use leads with a 58.0% share and grows fastest at 13.73% a year. Commercial inspection, mapping, agriculture and emergency response make up the rest. Military platforms are covered in the military drones market.
| Segment Group | Leading Sub-segment | 2025 Share | Fastest-growing Sub-segment | CAGR 2026–2035 |
|---|---|---|---|---|
| By Platform | Rotary-Wing/Multirotor | 48.0% | Hybrid VTOL | 15.62% |
| By Component | Airframe | 42.0% | Payload Mounts | 14.47% |
| By Printing Technology | FDM/Material Extrusion | 38.0% | Composite Printing | 16.20% |
| By Material | Thermoplastics | 46.0% | Fiber-Reinforced Composites | 14.97% |
| By End Use | Defense/Military | 58.0% | Defense/Military | 13.73% |
| By Size | Small Tactical | 54.0% | Small Tactical | 14.00% |
Request a Free Sample
Fill in your details and we'll send you a free sample report.
- Sample data tables & charts
- Research methodology
Defense Customization, Lighter Structures and Commercial Inspection Drive Growth
Why do defense buyers want printed drones? (~+3.6% impact on forecast CAGR)
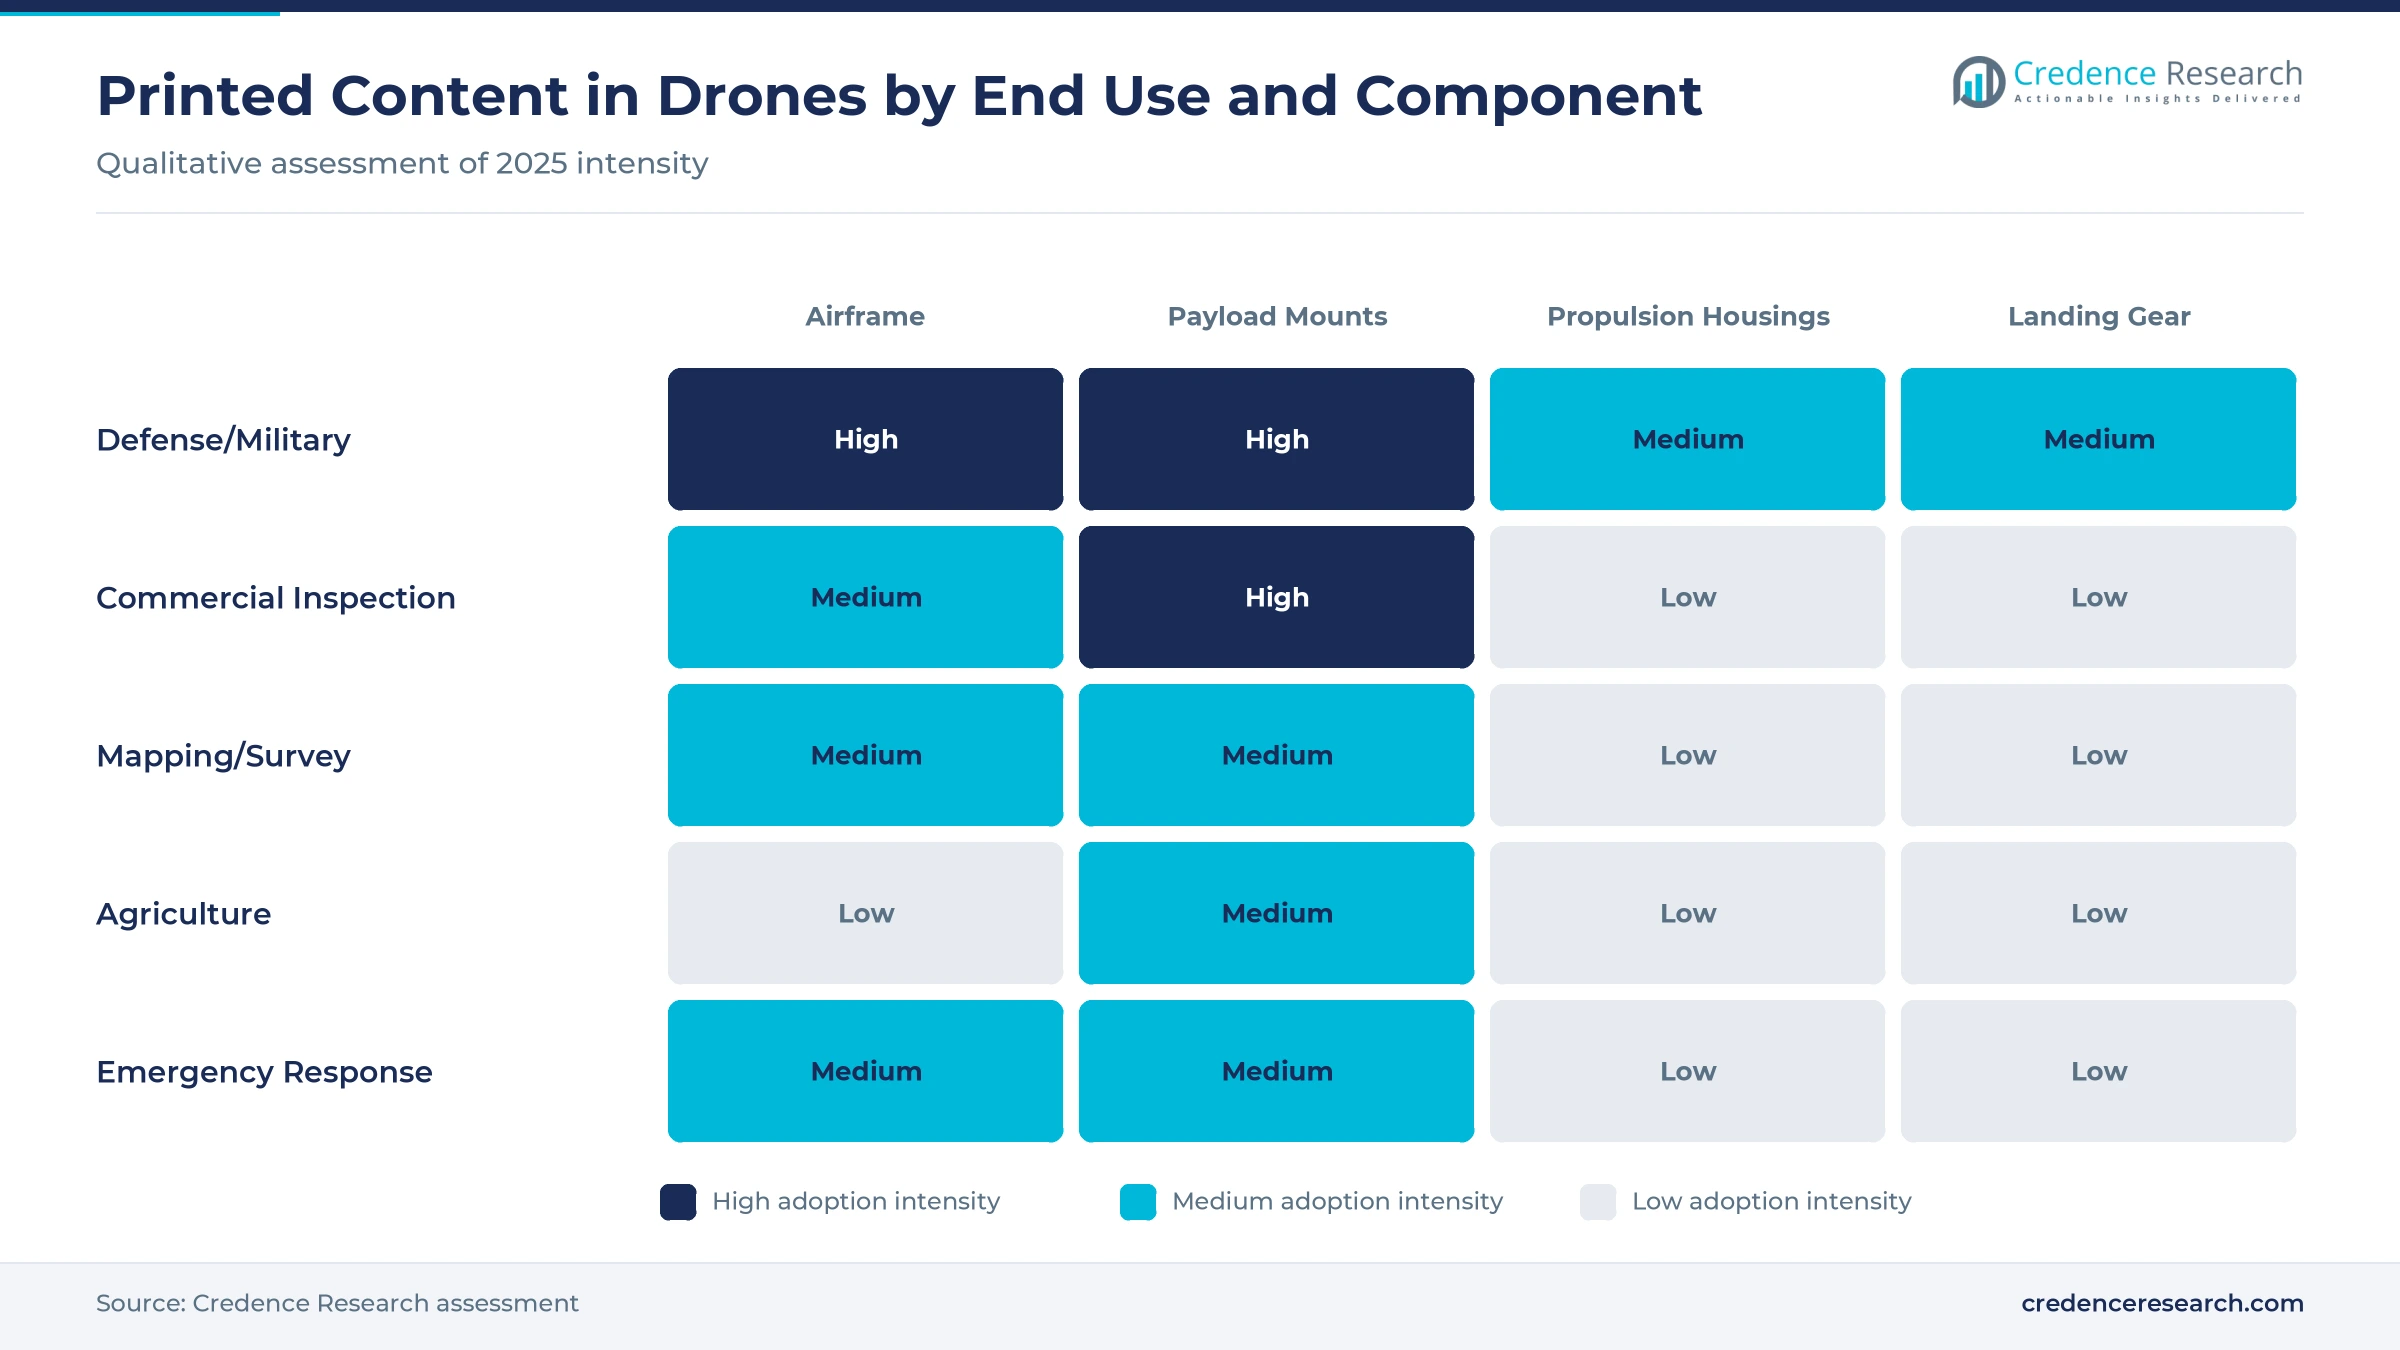
Defense demand for mission-specific and rapidly customizable drones is the strongest driver, adding about 3.6 percentage points to the forecast CAGR. Drones used in current conflicts are changed every few weeks as countermeasures evolve, and printing lets designers update an airframe without new tooling. The Pentagon's Drone Dominance Program, launched in December 2025 with about USD 1 billion of funding, plans to buy hundreds of thousands of small drones over two years at unit prices falling from about USD 5,000 toward USD 2,300. Defense and military use holds a 58.0% share in 2025 and grows fastest at 13.73% a year. Small tactical drones lead sizes with 54.0% and also grow fastest at 14.00%. The risk is that falling unit prices squeeze margins for printed parts.
How does printing help structures and prototyping? (~+2.8% impact on forecast CAGR)
Lightweight structures and rapid prototyping add about 2.8 percentage points to the forecast CAGR. Printing produces hollow, lattice and single-piece parts that are lighter than molded or machined versions, which extends flight time. Firestorm Labs, a US drone maker, holds a US Air Force contract with a ceiling of USD 100 million for drones that can be printed in containerized factories and raised USD 82 million in April 2026, as reported by TechCrunch. Composite printing is the fastest-growing technology at 16.20% a year and fiber-reinforced composites the fastest material at 14.97%, because they add stiffness without weight.
What role does commercial inspection play? (~+2.0% impact on forecast CAGR)
The expansion of commercial drone inspection, mapping and industrial uses adds about 2.0 percentage points to the forecast CAGR. Utilities, energy companies and surveyors use small numbers of drones fitted with custom sensor mounts, and printing suits these low-volume parts. The US Federal Aviation Administration proposed Part 108 rules for beyond-visual-line-of-sight flights in August 2025, covering aircraft up to 1,320 pounds below 400 feet, as set out in the FAA proposal. Final rules would widen commercial demand. Commercial inspection holds the second-largest end-use share.
Field Factories, Multirotor Volume and Onshore Supply Chains
Trend 1: Are drone factories moving to the field?
Yes. Container-sized print cells can produce dozens of larger drones or thousands of small frames a month near the front. In August 2026, Marines printed 12 small quadcopters and other drone parts aboard USS Essex during Pacific exercises, as reported by USNI News.
Trend 2: Do multirotors set the volume?
Yes. Rotary-wing and multirotor drones lead platforms with a 48.0% share because small quadcopter frames are simple to print. Hybrid VTOL designs grow fastest at 15.62% a year, combining vertical take-off with fixed-wing range.
Trend 3: Is supply moving onshore?
Yes. A June 2025 executive order on drone dominance directed agencies to favor US-made drones, and the FY2026 defense bill limits purchases of printers from covered foreign countries. Printed parts made locally reduce reliance on imported frames.
Trend 4: Are printer makers focusing on drones?
Yes. Stratasys reported that its parts service produced more than 12,000 aerospace and defense parts in the second quarter of 2026, mostly for drones. Related platforms are tracked in the small UAV market.
Falling Unit Prices, Rule Delays and Part Quality Limit Growth
Why are prices a concern?
Buyers want very cheap drones. Target unit prices of a few thousand dollars leave little room for printed parts that cost more than molded ones at high volume, so injection molding may take over once designs settle.
Are civil rules ready?
Not yet. Part 108 was still a proposal at the last public update, and commercial operators need waivers for many beyond-visual-line-of-sight flights. Similar rule changes are slow in Europe and Asia.
Is part quality consistent?
Not always. Printed polymer parts can vary in strength depending on print direction, humidity and machine settings. Larger drones need qualified materials and inspection, which adds cost.
Do supply chains still depend on imports?
Partly. Motors, batteries and electronics often come from overseas even when frames are printed locally, which limits the supply-chain benefit.
Where are the opportunities?
Composite and metal printing for larger fixed-wing and hybrid drones offers higher value per aircraft than polymer frames. Suppliers that qualify materials for these designs and supply printed spare parts to deployed units can capture steady demand. The execution risk is meeting defense quality standards at low cost.
North America Leads, Asia Pacific Grows Fastest
Value is allocated to the region of the drone buyer.
| Region | Share 2025 | CAGR 2026–2035 |
|---|---|---|
| North America | 42.5% | 12.40% |
| Asia Pacific | 27.5% | 13.90% |
| Europe | 21.0% | 12.70% |
| Middle East & Africa | 5.5% | 12.90% |
| Latin America | 3.5% | 11.90% |
Why does North America lead?
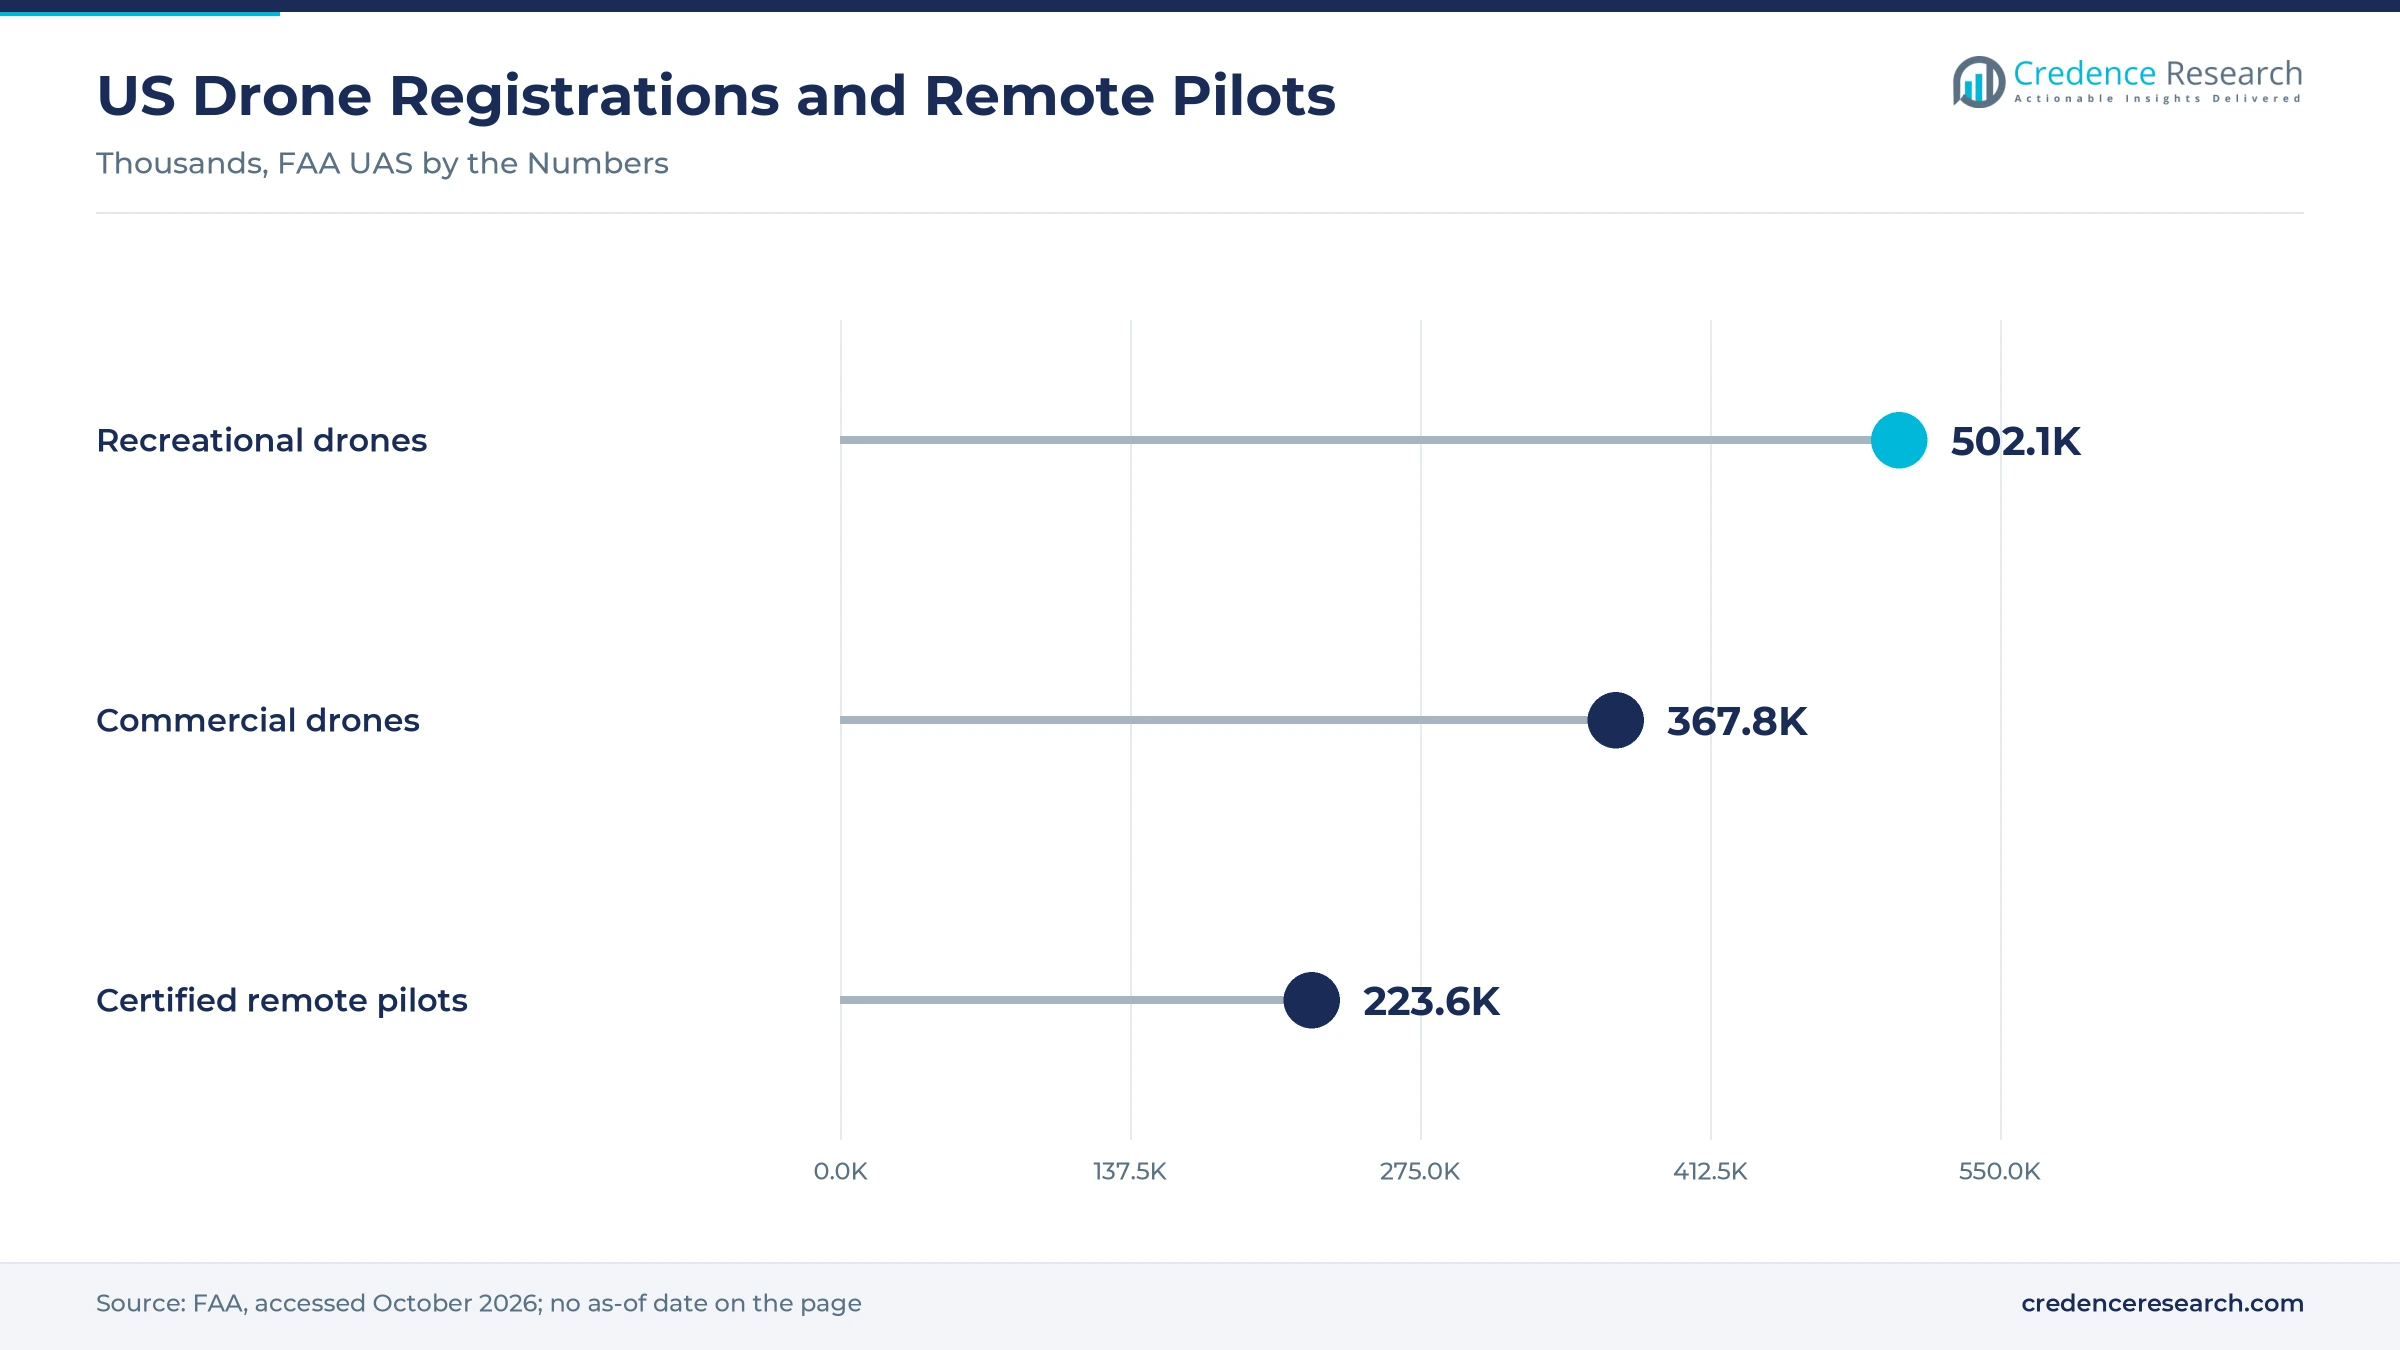
North America holds a 42.5% share in 2025 and grows at 12.40% a year. The US Air Force, Army and Marine Corps fund printed-drone programs, and the Drone Dominance Program adds volume orders. The FAA lists more than 870,000 registered drones in the United States, a large base for commercial printed parts.
Why does Asia Pacific grow fastest?
Asia Pacific holds 27.5% and is the fastest-growing region at 13.90% a year. Large drone manufacturing bases, rising defense budgets and US plans to place printing cells in the Indo-Pacific support demand.
What shapes Europe?
Europe holds 21.0% and grows at 12.70%. Ukraine's very large drone output, much of it from small workshops using printed parts, and new European drone funding drive demand.
What about Latin America and the Middle East & Africa?
Latin America holds 3.5% and grows at 11.90%, led by agricultural and mapping drones. The Middle East & Africa region holds 5.5% and grows at 12.90%, supported by Gulf defense spending.
Contracts, Programs and Rule Changes, 2025–2026
| Development | Status and why it matters |
|---|---|
| In August 2026, US Marines announced that they had printed 12 small quadcopters and other drone parts aboard USS Essex. | Completed. Shows drone printing at sea. |
| In May 2026, Firestorm Labs signed an award of up to USD 30 million for drone production and forward deployment of its print cells. | Contracted. Moves production toward users. |
| In April 2026, Firestorm Labs announced an USD 82 million funding round, with Lockheed Martin among investors. | Funded. Expands printed-drone capacity. |
| In February 2026, the Pentagon announced 25 firms, including Kratos SRE, for the first phase of the Drone Dominance Program. | Launched. Starts volume buying. |
| In February 2026, Norsk Titanium announced serial production of titanium parts for General Atomics Aeronautical. | Production. Adds printed metal to large drones. |
| In December 2025, the Pentagon launched the Drone Dominance Program with about USD 1 billion of funding. | Launched. Sets demand for low-cost drones. |
| In August 2025, the FAA introduced its Part 108 proposal for beyond-visual-line-of-sight drone flights. | Proposed. Would widen commercial use. |
| In June 2025, the White House signed an executive order to expand US drone production and use. | Issued. Favors US-made drones. |
| In January 2025, the US Air Force signed a USD 100 million, five-year contract with Firestorm Labs for printable drones. | Contracted. Anchors printed-drone demand. |
Need a Custom Version of This Report?
Tailor the scope, geography, or segments to your exact requirements.
- Custom geography or segment scope
- Direct access to our analyst team
Drone Primes, Printer Makers and Start-ups Share the Market
The market includes large drone and aerospace makers, printer suppliers and newer firms that design drones around printing. Public disclosures of printed content are limited, so no share ranking is given.
Which drone makers participate?
General Atomics Aeronautical Systems builds large unmanned aircraft and moved titanium parts made by Norsk Titanium into serial production in February 2026. Kratos Defense & Security Solutions makes jet-powered target and collaborative drones, and its SRE unit was among 25 firms picked in February 2026 for the first phase of the Drone Dominance Program. AeroVironment, Inc. makes small tactical drones for US and allied forces. Northrop Grumman builds high-altitude unmanned aircraft. The Boeing Company makes unmanned aircraft through its Insitu unit and other programs. Airbus develops military and high-altitude drones in Europe. For these primes, the use of printed parts in specific drones could not be confirmed from public sources.
Which printer makers participate?
Stratasys Ltd. supplies polymer printers and a parts service whose largest customers include military drone suppliers. 3D Systems Corporation supplies polymer and metal printers and part production for aerospace and defense.
Which newer firms stand out?
Firestorm Labs, not on the company list, builds drones designed for printing in container-sized factories and counts Lockheed Martin among its investors. Lockheed Martin also makes its own small drones.
How do suppliers compete?
Suppliers compete on design speed, unit cost, part strength and the ability to print near the user. Firms that combine drone design with printing capacity have an edge in fast-changing defense programs.
Frequently Asked Questions
How big is the 3D printed unmanned aerial systems market?
What does the market measure?
What drives the market?
Which end use is largest?
Which region leads?
What holds the market back?
Table of Content
Chapter 1 Market Segmentation
- 1.1 Segmentation Framework
- 1.1.1 Product and Service Classification
- 1.1.2 Application and End-Use Classification
- 1.1.3 Technology and Solution Classification
- 1.1.4 Customer and Distribution Channel Classification
- 1.1.5 Geographic Segmentation
- 1.1.6 Market Segment Definitions and Boundaries
- 1.2 By Platform
- 1.2.1 Fixed-Wing
- 1.2.2 Rotary-Wing/Multirotor
- 1.2.3 Hybrid VTOL
- 1.3 By Component
- 1.3.1 Airframe
- 1.3.2 Propulsion Housings
- 1.3.3 Payload Mounts
- 1.3.4 Landing Gear
- 1.3.5 Other Printed Parts
- 1.4 By Printing Technology
- 1.4.1 FDM/Material Extrusion
- 1.4.2 SLS
- 1.4.3 SLA
- 1.4.4 Metal Powder Bed Fusion
- 1.4.5 Composite Printing
- 1.5 By Material
- 1.5.1 Thermoplastics
- 1.5.2 Fiber-Reinforced Composites
- 1.5.3 Metals
- 1.5.4 Photopolymers
- 1.6 By End Use
- 1.6.1 Defense/Military
- 1.6.2 Commercial Inspection
- 1.6.3 Agriculture
- 1.6.4 Mapping/Survey
- 1.6.5 Emergency Response
- 1.7 By Size
- 1.7.1 Nano/Micro
- 1.7.2 Small Tactical
- 1.7.3 Medium/Large
Chapter 2 Introduction
- 2.1 Report Objectives and Scope
- 2.2 Product Definition and Industry Terminology
- 2.3 Market Inclusions and Exclusions
- 2.4 Research Process
- 2.4.1 Primary Research and Expert Interviews
- 2.4.2 Secondary Research and Source Review
- 2.4.3 Top-Down and Bottom-Up Estimation
- 2.4.4 Data Triangulation and Verification
- 2.5 Market Size Measurement Basis
- 2.5.1 2025: USD 156.0 million → 2035: USD 524.9 million
- 2.6 Historical and Forecast Reference Periods
- 2.6.1 Historical Period: 2018-2025
- 2.6.2 Base Year: 2025
- 2.6.3 Forecast Period: 2025-2035
- 2.7 Research Assumptions and Limitations
Chapter 3 Executive Summary
- 3.1 Market Snapshot and Key Findings
- 3.2 Base-Year Market Size, 2025
- 3.3 Forecast Market Size, 2035
- 3.4 Revenue and Volume Growth Outlook
- 3.5 Key Demand and Supply Indicators
- 3.6 Leading Market Segments
- 3.7 Fastest-Growing Market Opportunities
- 3.8 Regional Performance Highlights
- 3.9 Technology and Industry Transformation
- 3.10 Competitive Landscape Summary
- 3.11 Analyst View and Strategic Implications
Chapter 4 Global 3D Printed Unmanned Aerial Systems Market Trends and Developments
- 4.1 Historical Industry Development, 2018-2025
- 4.2 Recent Market Trends and Developments
- 4.3 Demand and Customer Behavior Trends
- 4.4 Technology and Product Innovation
- 4.5 Artificial Intelligence, Automation and Digitalization
- 4.6 Local Manufacturing and Supply Chain Realignment
- 4.7 Industry Partnerships, Mergers and Acquisitions
- 4.8 Sustainability and Circular Economy Developments
- 4.9 Government and Private Sector Investment Trends
- 4.10 Emerging Business Models and Commercialization
- 4.11 Industry Developments and Announcements
Chapter 5 Global 3D Printed Unmanned Aerial Systems Market Production, Supply and Demand Analysis
- 5.1 Demand Trend and Consumption Analysis, 2018-2025
- 5.2 Demand Forecast, 2025-2035
- 5.3 Production and Output Trend, 2018-2025
- 5.4 Production and Output Forecast, 2025-2035
- 5.5 Installed Capacity and Capacity Utilization
- 5.6 Company-Wise Production Plants and Statistics
- 5.6.1 Installed Production Capacity
- 5.6.2 Actual Production
- 5.6.3 Planned Capacity and Expansion Targets
- 5.7 Supply Chain Structure and Procurement Trends
- 5.8 Supply-Demand Gap and Bottlenecks
- 5.9 Import Dependence and Sourcing Structure
- 5.10 Contract Manufacturing and Outsourcing
- 5.11 Regional Supply and Demand Concentration
Chapter 6 Global 3D Printed Unmanned Aerial Systems Market Pricing Analysis
- 6.1 Pricing Structure and Measurement
- 6.2 Historical Pricing Trends, 2018-2025
- 6.3 Pricing Outlook, 2025-2035
- 6.4 Average Selling Price and Unit Economics
- 6.5 Pricing by Product and Market Segment
- 6.6 Geographic Pricing Differences
- 6.7 Key Input, Energy, Labor and Logistics Costs
- 6.8 Contract Pricing and Purchasing Models
- 6.9 Pricing Sensitivity and Competitive Positioning
- 6.10 Price, Margin and Profitability Implications
Chapter 7 Global 3D Printed Unmanned Aerial Systems Market Dynamics
- 7.1 Market Growth Drivers
- 7.1.1 Demand-Side Drivers
- 7.1.2 Technology and Innovation Drivers
- 7.1.3 Infrastructure and Investment Drivers
- 7.1.4 Regulatory and Policy Drivers
- 7.2 Market Restraints
- 7.2.1 Cost and Affordability Constraints
- 7.2.2 Technology and Adoption Barriers
- 7.2.3 Supply Chain and Operational Constraints
- 7.3 Market Challenges
- 7.3.1 Competitive Pressure and Margin Erosion
- 7.3.2 Skills, Infrastructure and Implementation Gaps
- 7.4 Emerging Market Opportunities
- 7.5 Market Dynamics Impact and Time-Horizon Assessment
Chapter 8 Global 3D Printed Unmanned Aerial Systems Value Chain Analysis
- 8.1 Industry Value Chain Overview
- 8.2 Upstream Suppliers and Critical Inputs
- 8.3 Technology and Component Providers
- 8.4 Manufacturing or Service Delivery
- 8.5 Distribution, Channel Partners and Integrators
- 8.6 Downstream Applications and End Users
- 8.7 Value Addition and Profit Pools
- 8.8 Vertical Integration and Outsourcing
- 8.9 Supplier Concentration and Risk
- 8.10 Supply Chain Localization and Resilience
Chapter 9 Global 3D Printed Unmanned Aerial Systems Market Regulations and Policies
- 9.1 Relevant Laws, Standards and Compliance Frameworks
- 9.2 Product, Service, Safety and Quality Requirements
- 9.3 Government Policies, Incentives and Subsidies
- 9.4 Imports, Exports and Trade Barriers
- 9.5 Public Procurement and Local Content Requirements
- 9.6 Environmental and Sustainability Compliance
- 9.7 Upcoming Policy Changes and Market Implications
Chapter 10 Global 3D Printed Unmanned Aerial Systems Market Hotspots and Opportunities
- 10.1 Market Opportunity Mapping and Growth Hotspots
- 10.2 High-Growth Applications and Customer Groups
- 10.3 Underserved Markets and White-Space Opportunities
- 10.4 Emerging Technology and Product Opportunities
- 10.5 New Capacity and Investment Hotspots
- 10.6 Market Entry and Expansion Opportunities
- 10.7 Distribution and Partnership Opportunities
- 10.8 Near-Term and Long-Term Commercial Potential
- 10.9 Opportunity Attractiveness and Execution Risks
Chapter 11 Global 3D Printed Unmanned Aerial Systems Market Outlook, 2025-2035
- 11.1 Market Size and Analysis
- 11.1.1 Revenue (Market Measurement: 2025: USD 156.0 million → 2035: USD 524.9 million)
- 11.1.2 Market Volume and Quantity Sold
- 11.1.3 Historical Market Size, 2018-2025
- 11.1.4 Base-Year Market Size, 2025
- 11.2 Market Forecast, 2025-2035
- 11.2.1 Revenue Forecast to 2035
- 11.2.2 Volume Forecast to 2035
- 11.2.3 CAGR and Year-on-Year Growth
- 11.2.4 Incremental Revenue Opportunity
- 11.3 Forecast Assumptions and Scenario Analysis
- 11.3.1 Base-Case Forecast
- 11.3.2 Optimistic and Conservative Scenarios
- 11.3.3 Technology, Pricing and Policy Sensitivities
- 11.4 Market Attractiveness and Growth Outlook
Chapter 12 Global 3D Printed Unmanned Aerial Systems Market Segmentation and Outlook
- 12.1 Segmentation Summary and Market Shares, 2025
- 12.2 Largest and Fastest-Growing Segments
- 12.3 By Platform - Market Size and Forecast, 2025-2035
- 12.3.1 Segment Definition and Scope
- 12.3.2 Historical Market Size, 2018-2025
- 12.3.3 Revenue Forecast, 2025-2035
- 12.3.4 Volume Forecast, 2025-2035
- 12.3.5 Base-Year Market Share, 2025
- 12.3.6 Segment CAGR and Growth Drivers
- 12.3.7 Subsegment Market Size and Forecast
- 12.3.7.1 Fixed-Wing
- 12.3.7.2 Rotary-Wing/Multirotor
- 12.3.7.3 Hybrid VTOL
- 12.3.8 Subsegment Pricing and Adoption Trends
- 12.3.9 Leading Suppliers and Competition
- 12.3.10 Regional Demand and Opportunities
- 12.4 By Component - Market Size and Forecast, 2025-2035
- 12.4.1 Segment Definition and Scope
- 12.4.2 Historical Market Size, 2018-2025
- 12.4.3 Revenue Forecast, 2025-2035
- 12.4.4 Volume Forecast, 2025-2035
- 12.4.5 Base-Year Market Share, 2025
- 12.4.6 Segment CAGR and Growth Drivers
- 12.4.7 Subsegment Market Size and Forecast
- 12.4.7.1 Airframe
- 12.4.7.2 Propulsion Housings
- 12.4.7.3 Payload Mounts
- 12.4.7.4 Landing Gear
- 12.4.7.5 Other Printed Parts
- 12.4.8 Subsegment Pricing and Adoption Trends
- 12.4.9 Leading Suppliers and Competition
- 12.4.10 Regional Demand and Opportunities
- 12.5 By Printing Technology - Market Size and Forecast, 2025-2035
- 12.5.1 Segment Definition and Scope
- 12.5.2 Historical Market Size, 2018-2025
- 12.5.3 Revenue Forecast, 2025-2035
- 12.5.4 Volume Forecast, 2025-2035
- 12.5.5 Base-Year Market Share, 2025
- 12.5.6 Segment CAGR and Growth Drivers
- 12.5.7 Subsegment Market Size and Forecast
- 12.5.7.1 FDM/Material Extrusion
- 12.5.7.2 SLS
- 12.5.7.3 SLA
- 12.5.7.4 Metal Powder Bed Fusion
- 12.5.7.5 Composite Printing
- 12.5.8 Subsegment Pricing and Adoption Trends
- 12.5.9 Leading Suppliers and Competition
- 12.5.10 Regional Demand and Opportunities
- 12.6 By Material - Market Size and Forecast, 2025-2035
- 12.6.1 Segment Definition and Scope
- 12.6.2 Historical Market Size, 2018-2025
- 12.6.3 Revenue Forecast, 2025-2035
- 12.6.4 Volume Forecast, 2025-2035
- 12.6.5 Base-Year Market Share, 2025
- 12.6.6 Segment CAGR and Growth Drivers
- 12.6.7 Subsegment Market Size and Forecast
- 12.6.7.1 Thermoplastics
- 12.6.7.2 Fiber-Reinforced Composites
- 12.6.7.3 Metals
- 12.6.7.4 Photopolymers
- 12.6.8 Subsegment Pricing and Adoption Trends
- 12.6.9 Leading Suppliers and Competition
- 12.6.10 Regional Demand and Opportunities
- 12.7 By End Use - Market Size and Forecast, 2025-2035
- 12.7.1 Segment Definition and Scope
- 12.7.2 Historical Market Size, 2018-2025
- 12.7.3 Revenue Forecast, 2025-2035
- 12.7.4 Volume Forecast, 2025-2035
- 12.7.5 Base-Year Market Share, 2025
- 12.7.6 Segment CAGR and Growth Drivers
- 12.7.7 Subsegment Market Size and Forecast
- 12.7.7.1 Defense/Military
- 12.7.7.2 Commercial Inspection
- 12.7.7.3 Agriculture
- 12.7.7.4 Mapping/Survey
- 12.7.7.5 Emergency Response
- 12.7.8 Subsegment Pricing and Adoption Trends
- 12.7.9 Leading Suppliers and Competition
- 12.7.10 Regional Demand and Opportunities
- 12.8 By Size - Market Size and Forecast, 2025-2035
- 12.8.1 Segment Definition and Scope
- 12.8.2 Historical Market Size, 2018-2025
- 12.8.3 Revenue Forecast, 2025-2035
- 12.8.4 Volume Forecast, 2025-2035
- 12.8.5 Base-Year Market Share, 2025
- 12.8.6 Segment CAGR and Growth Drivers
- 12.8.7 Subsegment Market Size and Forecast
- 12.8.7.1 Nano/Micro
- 12.8.7.2 Small Tactical
- 12.8.7.3 Medium/Large
- 12.8.8 Subsegment Pricing and Adoption Trends
- 12.8.9 Leading Suppliers and Competition
- 12.8.10 Regional Demand and Opportunities
- 12.9 Segment Growth Comparison
- 12.10 Segment Attractiveness and Priority Matrix
Chapter 13 Global 3D Printed Unmanned Aerial Systems End-Use and Application Market Outlook
- 13.1 End-Use Industry and Customer Demand Structure
- 13.2 Leading Applications and Customer Groups
- 13.3 End-Use Market Size, Share and Forecast
- 13.4 Major End-Use Industry Deep Dives
- 13.4.1 Customer Requirements and Use Cases
- 13.4.2 Demand and Replacement Cycles
- 13.4.3 Technical and Regulatory Considerations
- 13.4.4 Purchasing and Procurement Models
- 13.4.5 Leading Vendors and Distribution Channels
- 13.4.6 Forecast and Commercial Opportunities
- 13.5 Emerging Applications and Cross-Segment Demand
- 13.6 End-Use Industry Investment Priorities
Chapter 14 Global 3D Printed Unmanned Aerial Systems Geographic Market Outlook, 2025-2035
- 14.1 Regional Market Size and Share, 2025
- 14.2 Regional Market Forecast, 2025-2035
- 14.3 Regional Pricing, Production and Demand Differences
- 14.4 North America
- 14.4.1 United States
- 14.4.2 Canada
- 14.4.3 Mexico
- 14.5 Europe
- 14.5.1 Germany
- 14.5.2 France
- 14.5.3 Italy
- 14.5.4 United Kingdom
- 14.5.5 Spain
- 14.5.6 Poland
- 14.5.7 Russia
- 14.5.8 Netherlands
- 14.5.9 Belgium
- 14.5.10 Sweden
- 14.5.11 Denmark
- 14.5.12 Norway
- 14.5.13 Rest of Europe
- 14.6 Asia Pacific
- 14.6.1 China
- 14.6.2 India
- 14.6.3 Japan
- 14.6.4 South Korea
- 14.6.5 Thailand
- 14.6.6 Indonesia
- 14.6.7 Vietnam
- 14.6.8 Malaysia
- 14.6.9 Australia
- 14.6.10 Rest of Asia Pacific
- 14.7 Latin America
- 14.7.1 Brazil
- 14.7.2 Argentina
- 14.7.3 Colombia
- 14.7.4 Chile
- 14.7.5 Rest of Latin America
- 14.8 Middle East
- 14.8.1 Saudi Arabia
- 14.8.2 United Arab Emirates
- 14.8.3 Turkey
- 14.8.4 Israel
- 14.8.5 Iran
- 14.8.6 Rest of the Middle East
- 14.9 Africa
- 14.9.1 South Africa
- 14.9.2 Egypt
- 14.9.3 Nigeria
- 14.9.4 Morocco
- 14.9.5 Rest of Africa
- 14.10 Regional Investment, Policy and Supply Chain Differences
- 14.11 Regional Competitive Landscape
- 14.12 Geographic Growth Hotspots
Chapter 15 Global 3D Printed Unmanned Aerial Systems Technology, Innovation and Sustainability Outlook
- 15.1 Technology Landscape and Maturity
- 15.2 Product, Process and Service Innovation
- 15.3 AI, Automation and Digital Tools in the Industry
- 15.4 Technology Adoption and Performance Benchmarking
- 15.5 Innovation Pipeline and R&D Investment
- 15.6 Patent and Intellectual Property Trends
- 15.7 Energy Efficiency and Resource Management
- 15.8 Sustainability, Recycling and Circularity
- 15.9 Technology Roadmap, 2025-2035
- 15.10 Risks of Obsolescence and Technology Substitution
Chapter 16 Global 3D Printed Unmanned Aerial Systems Market Key Strategic Imperatives
- 16.1 Growth and Market Entry Priorities
- 16.2 High-Return Products and Segments
- 16.3 Pricing, Profitability and Cost Optimization
- 16.4 Technology Investment and Product Differentiation
- 16.5 Supply Chain Localization and Resilience
- 16.6 Distribution and Customer Acquisition
- 16.7 Partnership, Acquisition and Capacity Strategy
- 16.8 Regional Expansion Priorities
- 16.9 Short-, Medium- and Long-Term Actions
Chapter 17 Competition Outlook
- 17.1 Industry Competition Characteristics
- 17.2 Market Structure and Concentration
- 17.3 Market Share and Competitive Positioning, 2025
- 17.4 Company-Wise Revenue and Product Benchmarking
- 17.5 Production and Service Capacity Benchmarking
- 17.6 Technology, Pricing and Differentiation
- 17.7 Regional Footprint and Distribution Strength
- 17.8 Mergers, Acquisitions and Strategic Alliances
- 17.9 New Entrants and Competitive Threats
- 17.10 Porter's Five Forces and Industry Attractiveness
- 17.11 Competitive Outlook, 2025-2035
Chapter 18 Company Profiles
- 18.1 Company Coverage and Selection Criteria
- 18.2 3D Systems Corporation
- 18.2.1 Business Description
- 18.2.2 Company Ownership and Geographic Presence
- 18.2.3 Product and Service Portfolio
- 18.2.4 Manufacturing and Operating Footprint
- 18.2.5 Production Capacity and Expansion Plans
- 18.2.6 Financial Performance and Investment
- 18.2.7 Market Share and Competitive Position
- 18.2.8 Technology and Innovation Capabilities
- 18.2.9 Strategic Alliances or Partnerships
- 18.2.10 Recent Developments
- 18.2.11 Growth Strategy and Outlook
- 18.3 AeroVironment, Inc.
- 18.4 General Atomics Aeronautical Systems
- 18.5 Northrop Grumman
- 18.6 The Boeing Company
- 18.7 Lockheed Martin
- 18.8 Airbus
- 18.9 Stratasys Ltd.
- 18.10 Kratos Defense & Security Solutions
- 18.11 Other Relevant Market Participants
Note: Every listed company is profiled on the structure shown under the first company. The company list is preliminary and may change based on research findings, market developments, data availability and client requirements.
Chapter 19 Disclaimer
- 19.1 Research and Forecast Disclaimer
- 19.2 Data Source and Estimation Limitations
Note: The depth of individual sections depends on data availability for this market. Volume, capacity, trade and other unit-based metrics are included where applicable.

