
New lanes and replacements lift checkpoint arch spending
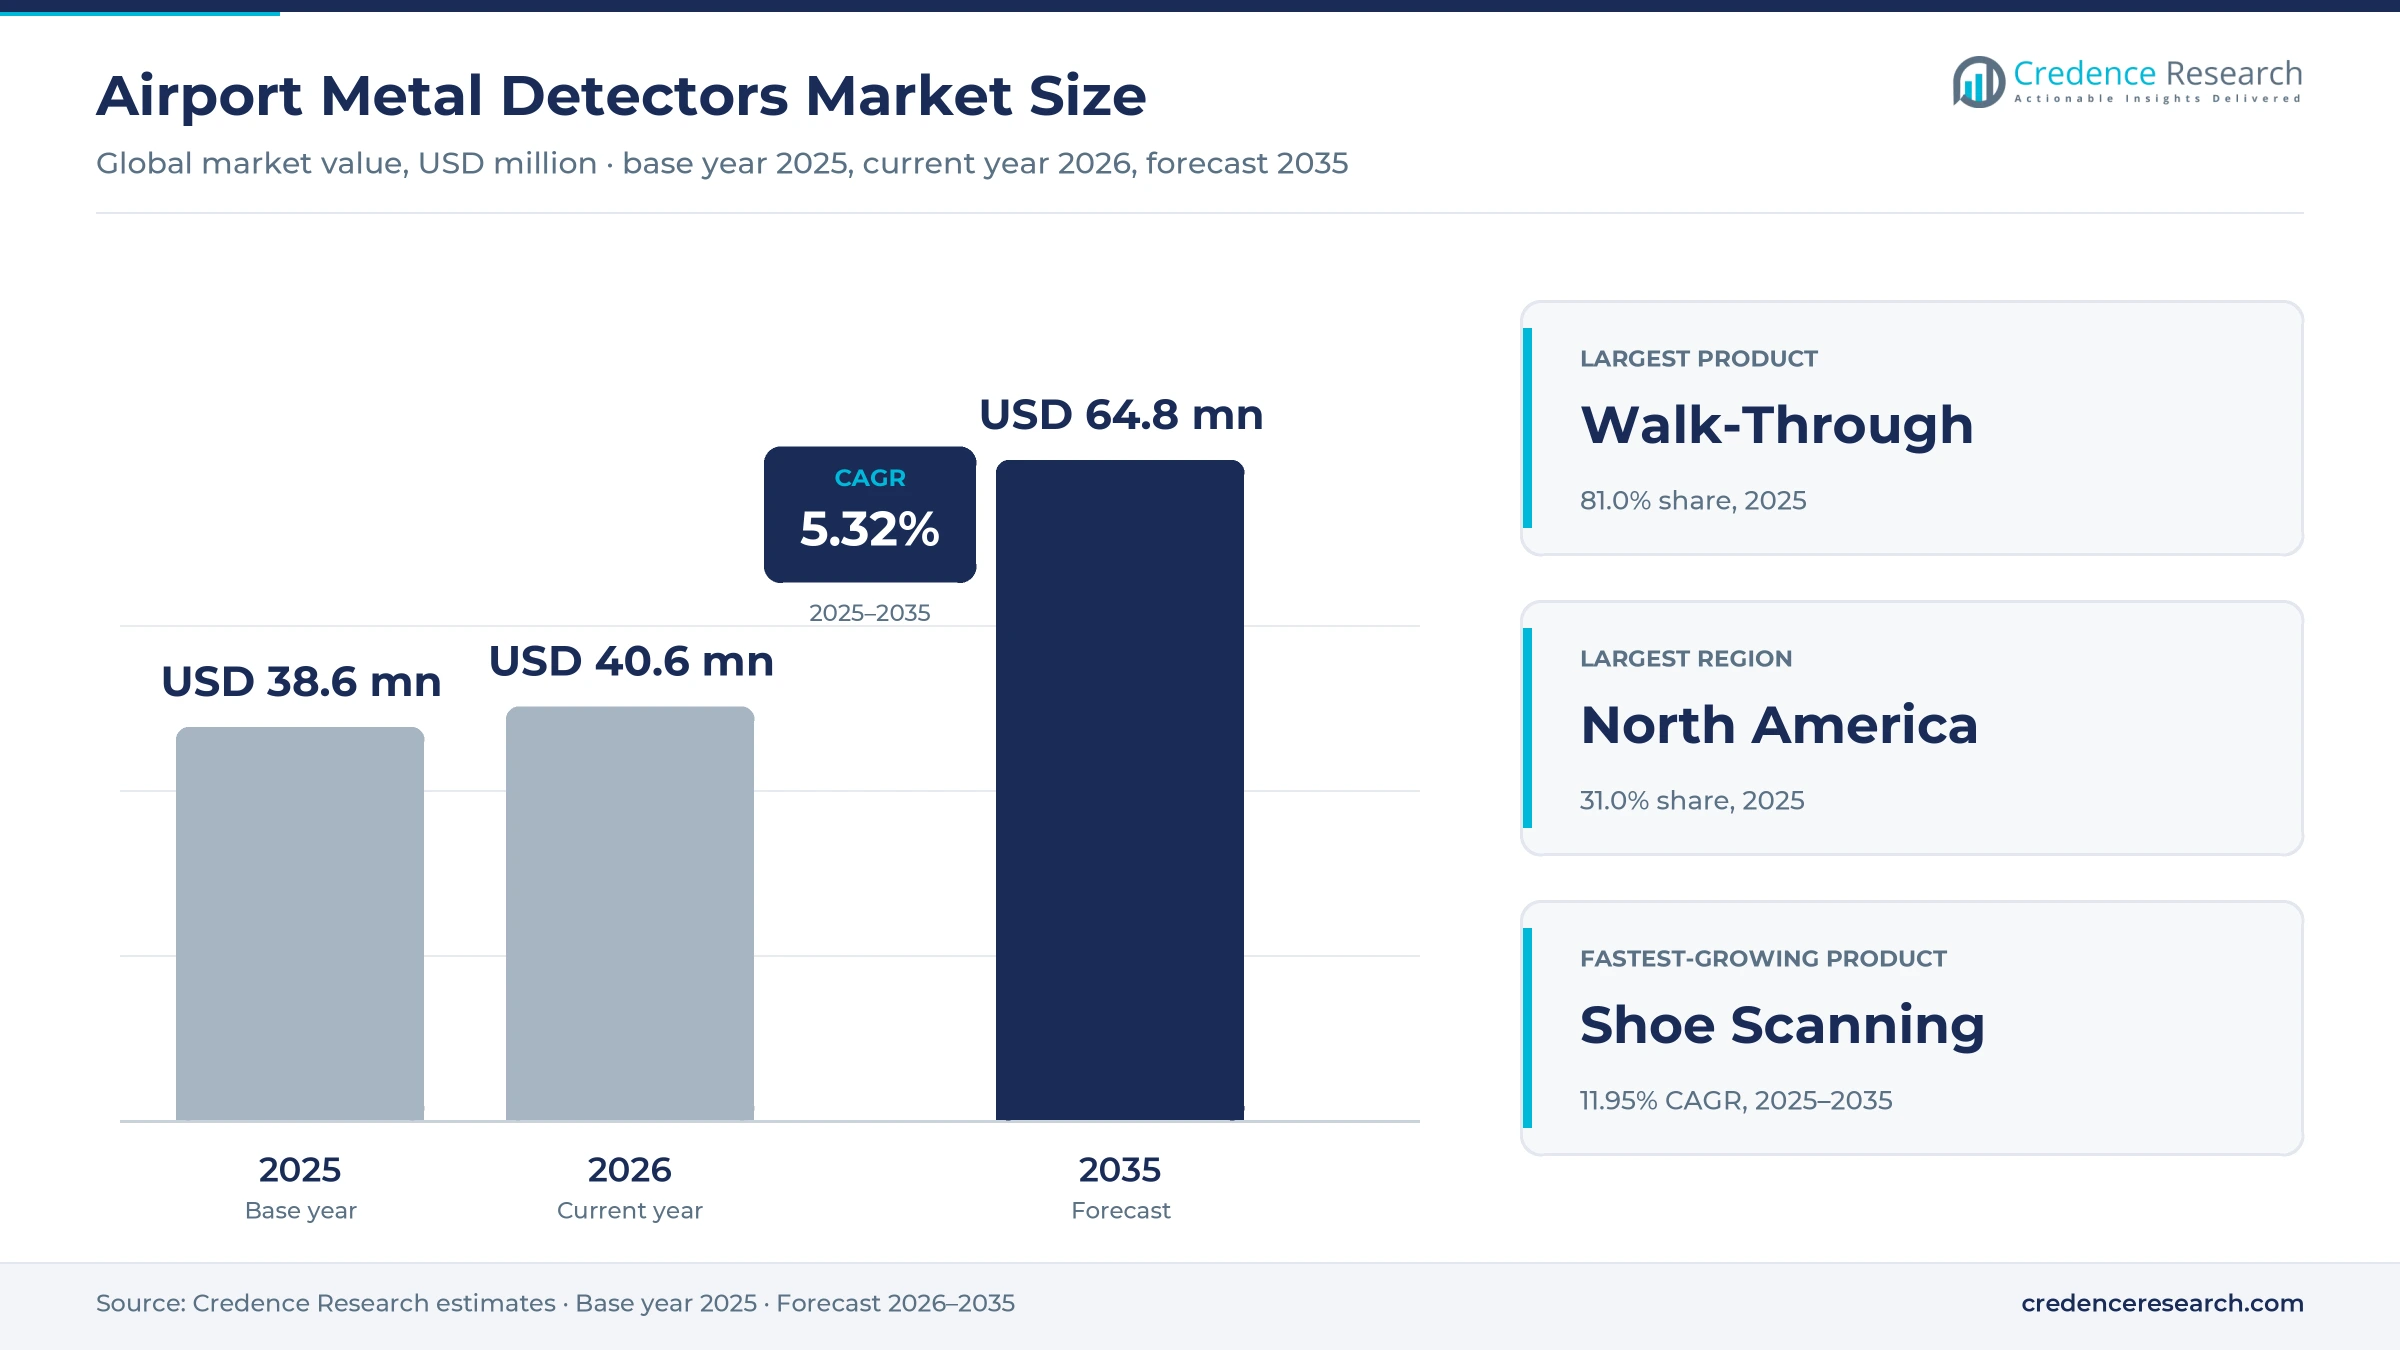
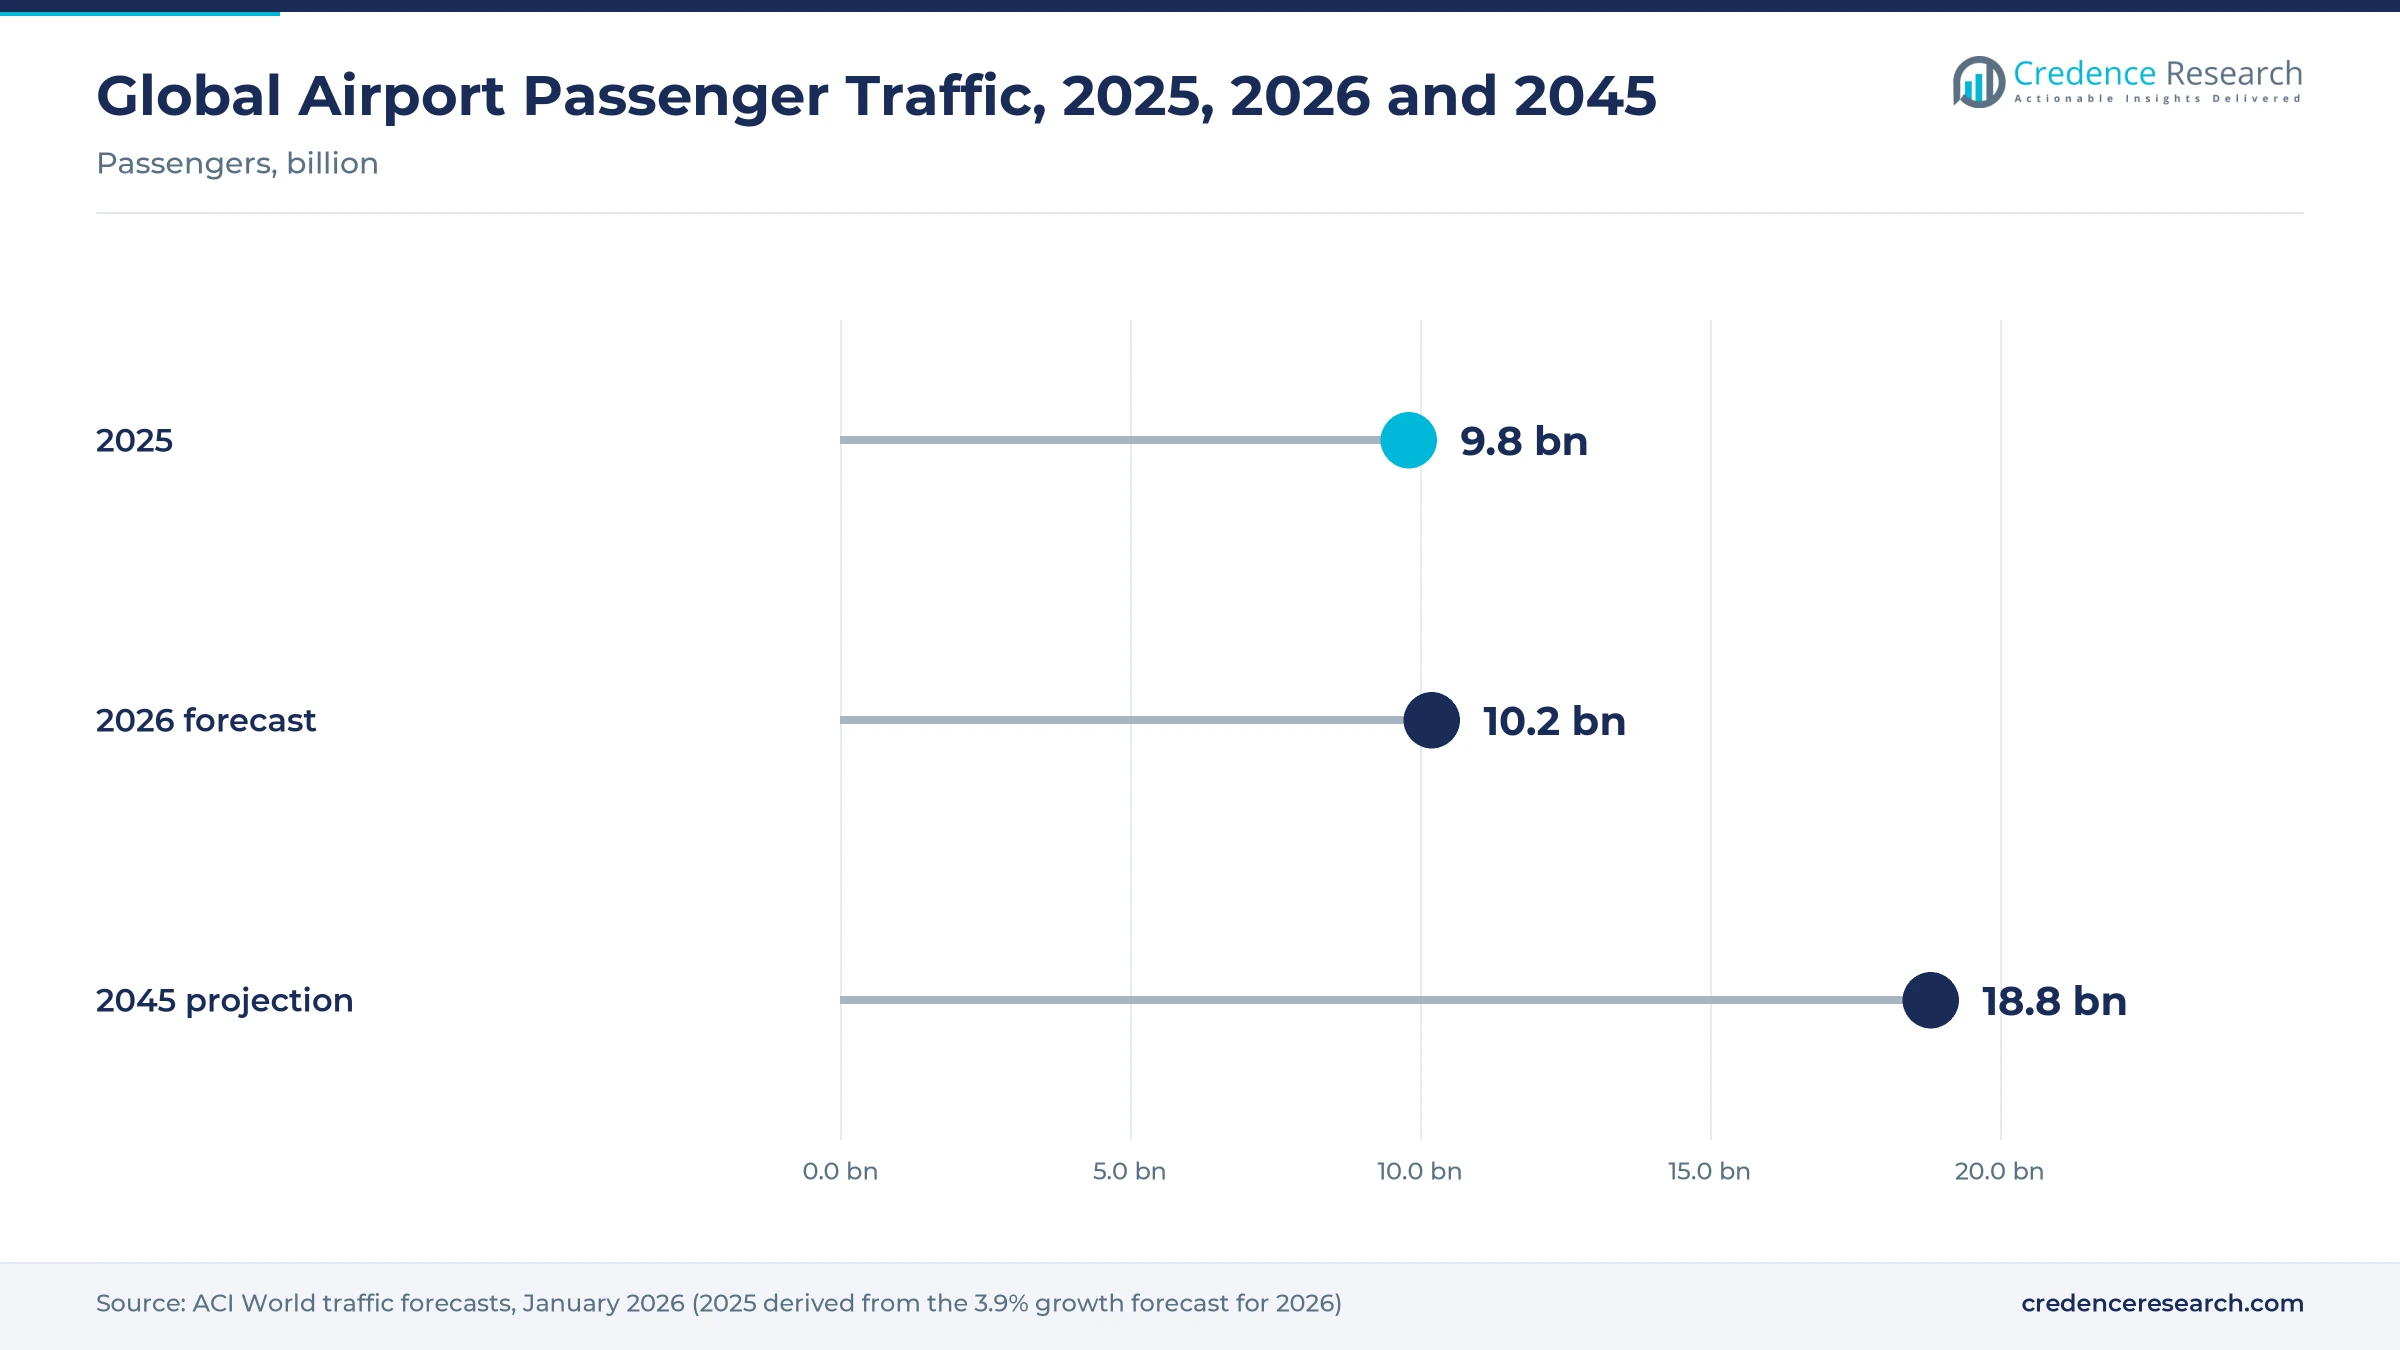
The airport metal detectors market was valued at USD 38.6 million in 2025 and is projected to increase from USD 40.6 million in 2026 to USD 64.8 million by 2035, registering a CAGR of 5.32% during 2025–2035. Demand follows two clocks, the replacement of arches already installed at checkpoint lanes, which most airports swap about once a decade, and the new lanes that terminals add as passenger traffic grows. ACI World expects global traffic to reach 10.2 billion passengers in 2026 and 18.8 billion by 2045. North America held the largest regional share, 31.0% in 2025, because U.S. airports run more than 2,000 checkpoint lanes. Rules that widen staff screening add orders at employee entrances. The main commercial change is the U.S. move to shoes-on screening in July 2025, which lifts interest in shoe scanning detectors and in multi-zone arches that locate an alarm on the body.
Why does a small equipment category carry so much operational weight?
A metal detector costs little next to a computed tomography scanner, but a checkpoint lane cannot open without one, and certification lists decide which models an airport may buy. Airports, national security agencies and their deployment contractors buy detectors through public tenders and framework agreements, then keep them under service contracts for about 10 years. Demand therefore tracks the number of screening positions and the age of the installed base, not ticket prices or airline profits.
The scope covers walk-through arches at passenger, staff and crew checkpoints, handheld wands for secondary screening and shoe scanning detectors that check footwear without removal. It excludes millimeter-wave body scanners, X-ray and computed tomography baggage screening, trace detection and detectors at stadiums, prisons and courts. These boundaries keep the estimate small in value, with 3 product types and three applications across five regions.
Airport Metal Detectors Market Insights
- The airport metal detectors market is projected to rise from USD 40.6 million in 2026 to USD 64.8 million by 2035, a 5.32% CAGR, as new lanes and replacements compound.
- North America held 31.0% of 2025 value, the largest regional share, because more than 2,000 U.S. checkpoint lanes need arches, wands and periodic replacement.
- Walk-through metal detectors accounted for 81.0% of 2025 value, the largest product, since every passenger, staff and crew lane needs at least one certified arch.
- The U.S. end of routine shoe removal in July 2025 shifts lane design toward footwear screening, and shoe scanning detectors grow fastest at 11.95% a year.
- In September 2026, the TSA re-awarded Leidos its checkpoint equipment deployment contract for up to eight years, which keeps U.S. detector installation and relocation work flowing.
Walk-through arches carry value as shoe scanners grow
Walk-through arches lead products while shoe scanning detectors grow fastest
Based on product, the market is categorized into walk-through metal detectors, handheld metal detectors and shoe scanning metal detectors. Walk-through detectors led with 81.0% of 2025 value, because every passenger, staff and crew lane needs at least one certified arch, and these units carry the highest unit value and most service contracts. Shoe scanning detectors grow fastest at 11.95% a year, as passengers keep footwear on and airports test pads that clear shoes without removal.
Passenger lanes lead applications while staff and crew entrances grow fastest
Based on application, the market is categorized into passenger screening, staff and crew screening, and cargo and perimeter access points. Passenger screening led with 72.0% of 2025 value, since passenger lanes are the most numerous and run the longest shifts. Staff and crew screening grows fastest at 5.76% a year, as regulators widen insider-risk rules and airports add detectors at employee entrances. That shift favors suppliers with compact arches, handheld units and service teams able to cover many small access points.
| Segment Group | Leading Sub-segment | Share, 2025 | Fastest-growing Sub-segment | CAGR, 2025–2035 |
|---|---|---|---|---|
| By Product | Walk-Through Metal Detectors | 81.0% | Shoe Scanning Metal Detectors | 11.95% |
| By Application | Passenger Screening | 72.0% | Staff & Crew Screening | 5.76% |
Request a Free Sample
Fill in your details and we'll send you a free sample report.
- Sample data tables & charts
- Research methodology
Traffic, replacement cycles and test standards drive demand
Passenger traffic heading for 18.8 billion by 2045 forces airports to add lanes
In January 2026, ACI World announced that global passenger traffic should reach 10.2 billion in 2026, up 3.9%, and double to 18.8 billion by 2045, a 3.4% annual rate. Airports add lanes when queues lengthen, and each new passenger lane needs a walk-through arch and handheld wands. In the U.S., the FAA passenger boarding statistics for calendar 2025 show how boardings spread across hundreds of commercial service airports. The effect is long term and strongest where terminals are being built, led by Asia Pacific at 6.95% a year.
Decade-long replacement cycles form the base load of demand
Walk-through detectors run long shifts every day, and their coils, electronics and software age. Most airports replace them about once every 10 years, or sooner when a regulator raises the detection standard. Replacement makes up most of yearly demand where the installed base is oldest. North America grows at 4.15% a year on that basis. Europe grows at 3.95% a year for the same reason. Replacement buyers are airport operators and national agencies, and they favor suppliers already certified at their checkpoints.
Common test standards turn certification updates into buying waves
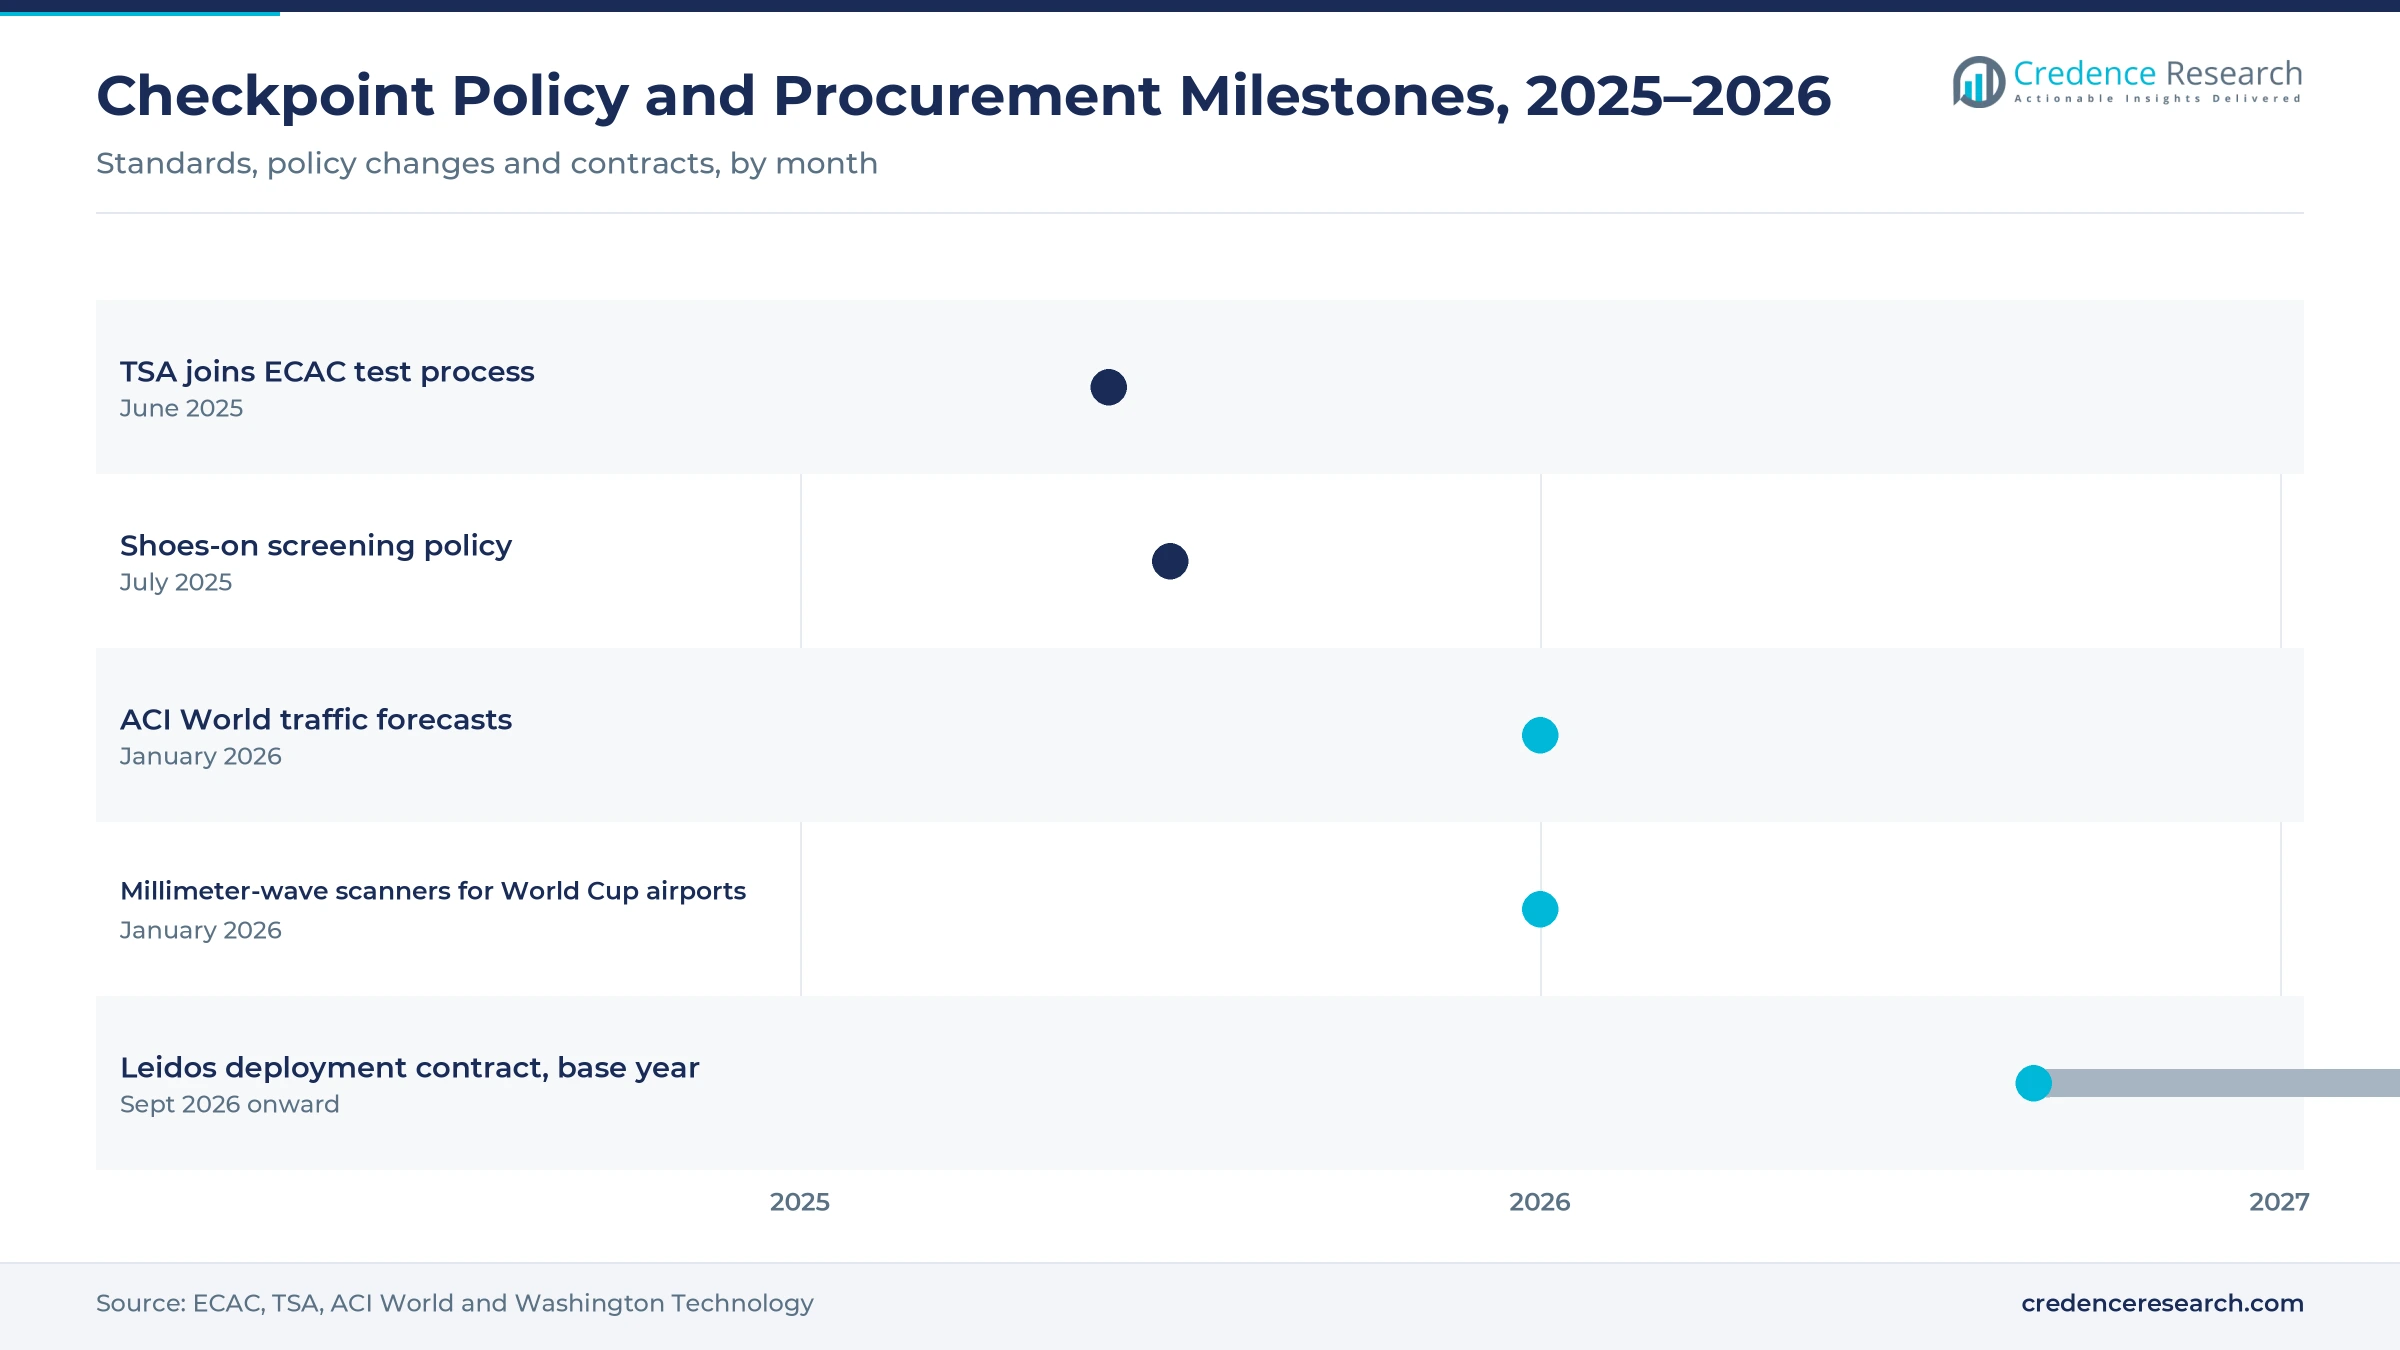
In Europe, security equipment must meet ECAC/EU performance standards, and the ECAC Common Evaluation Process tests walk-through detectors at participating laboratories. Since January 2020, the European Commission has treated a passing result as a precondition for EU approval. In June 2025, the U.S. TSA signed a memorandum of understanding and joined the process as an associated authority, moving test methods toward a shared reference. When a required standard rises, airports must replace older configurations, which creates buying waves that last several years.
Shoes-on screening and insider-risk rules open new detector positions
In July 2025, the TSA announced that most passengers no longer had to remove shoes at checkpoints. Shoe removal is one of the slowest steps in a lane, and footwear often triggers arch alarms, so airports now test detectors that clear shoes while the passenger stands on a pad, which is why shoe scanning detectors grow fastest at 11.95% a year. Insider-risk rules add a parallel source of orders, and staff and crew screening grows fastest among applications at 5.76% a year.
Multi-zone arches and lifecycle contracts shift buying
A shift to multi-zone arches replaces single-zone units
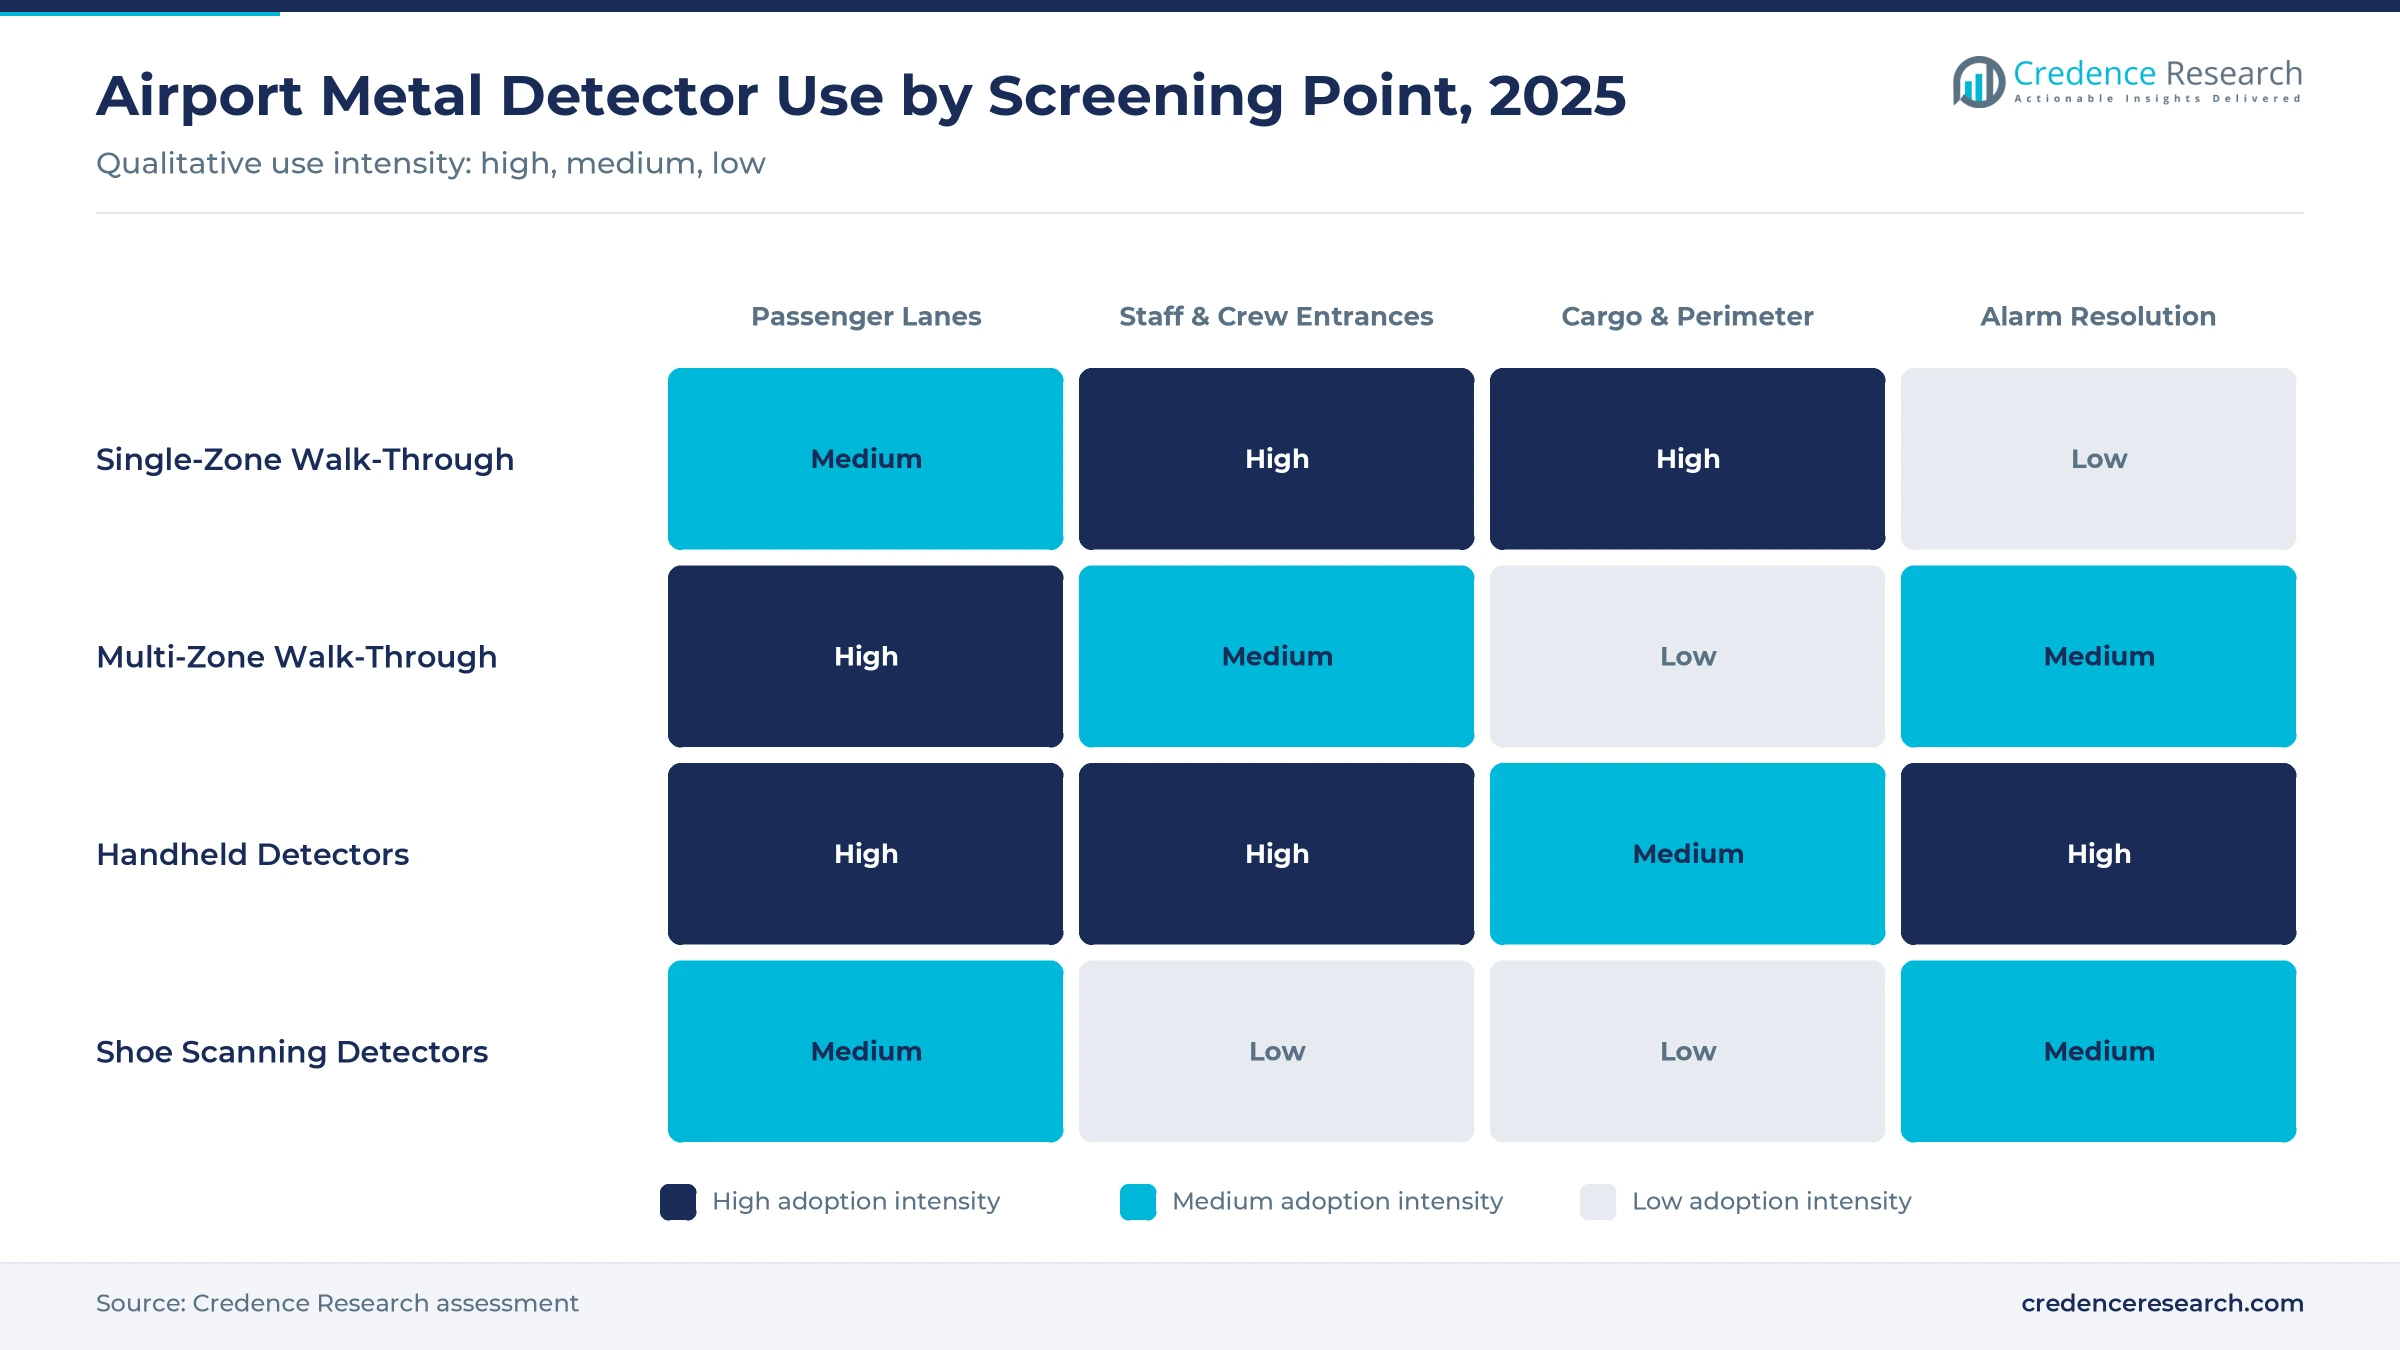
Older arches only signaled whether metal was present, while multi-zone models show where on the body the alarm came from, which shortens pat-downs and keeps lanes moving. Airports pay more for these units, which lifts average selling values even when unit counts grow slowly. The shift favors suppliers with certified multi-zone ranges and adds to the walk-through segment's 81.0% share of 2025 value. Upgrades also give suppliers a reason to return to airports between full replacement cycles, which smooths order books.
Imaging takes the primary role as arches move to alarm resolution
Many airports now run a body scanner and a walk-through detector side by side and send each passenger to one or the other. In January 2026, the TSA contracted Rohde & Schwarz to deploy millimeter-wave scanners at airports in 2026 FIFA World Cup host cities, a sign that imaging takes the lead role at new U.S. lanes. The detector stays in the lane plan for alarm resolution and for passengers who cannot use a scanner, which keeps replacement demand steady.
New terminals in Asia Pacific and the Gulf open an opportunity
New airports and terminal expansions in China, India, Southeast Asia and the Gulf add the most new screening positions. Asia Pacific grows quickly on this build-out, and the Middle East & Africa grows faster still, at 7.35% a year, the highest regional rate. Suppliers that pair certified arches with local installation can win full checkpoint packages. Tender cycles of 12 months or more remain the main constraint.
Lifecycle deployment and service contracts offer an opportunity
Maintenance, calibration, recertification and relocation add recurring revenue for each installed unit. The TSA's Security Equipment Deployment Services contract, re-awarded to Leidos in September 2026 after three bids, runs for 1 base year and up to 7 option years, according to Washington Technology. It covers walk-through detectors alongside imaging, X-ray, explosive trace and computed tomography systems, so integrators that bundle service can hold airports through the next replacement. Networked detectors also need software support, which extends each service relationship.
Long asset lives, imaging budgets and slow tenders
Durable arches let budget-pressed airports delay replacement
Walk-through detectors are durable, and a stretch of the replacement interval from 10 years to 12 cuts yearly unit demand by roughly one sixth. Public airport operators under budget pressure often make that choice, which hits suppliers in North America and Europe hardest because replacement dominates their order books. Suppliers respond with service contracts, software upgrades and trade-in offers that turn a deferred purchase into recurring revenue and keep their models on the certified list.
Body scanners absorb a larger share of new checkpoint budgets
Where body scanners become the primary tool, the arch moves to a backup role, and lanes built around walk-through imaging can need fewer detectors. The trend is the main risk to North America, where the TSA expanded millimeter-wave scanning in January 2026. Detector makers mitigate the risk by selling multi-zone and shoe scanning units that resolve scanner alarms quickly, so the detector keeps earning a place in imaging-first lanes at busy hubs.
Tender, testing and certification steps stretch sales cycles
Airport detectors are usually bought through public tenders, framework contracts or national security agencies. Laboratory testing, certification listing and tender evaluation can take 12 months or more, which delays revenue even when the need is clear. Smaller suppliers feel the cost most, because each new model must pass testing before it can bid. Leading suppliers cope by keeping several certified configurations on file and by signing multi-year framework agreements that cover later orders.
Low-cost single-zone models pressure prices in emerging markets
Basic single-zone detectors face competition from lower-cost suppliers, especially at airports in Latin America, Africa and parts of Asia that buy on price. That pressure caps average selling values in the regions that grow fastest. Latin America grows at 5.55% a year with tight airport budgets. Leading suppliers defend value through certification, local service networks and multi-zone features that cut pat-down time, which matters more to a busy hub than a lower purchase price.
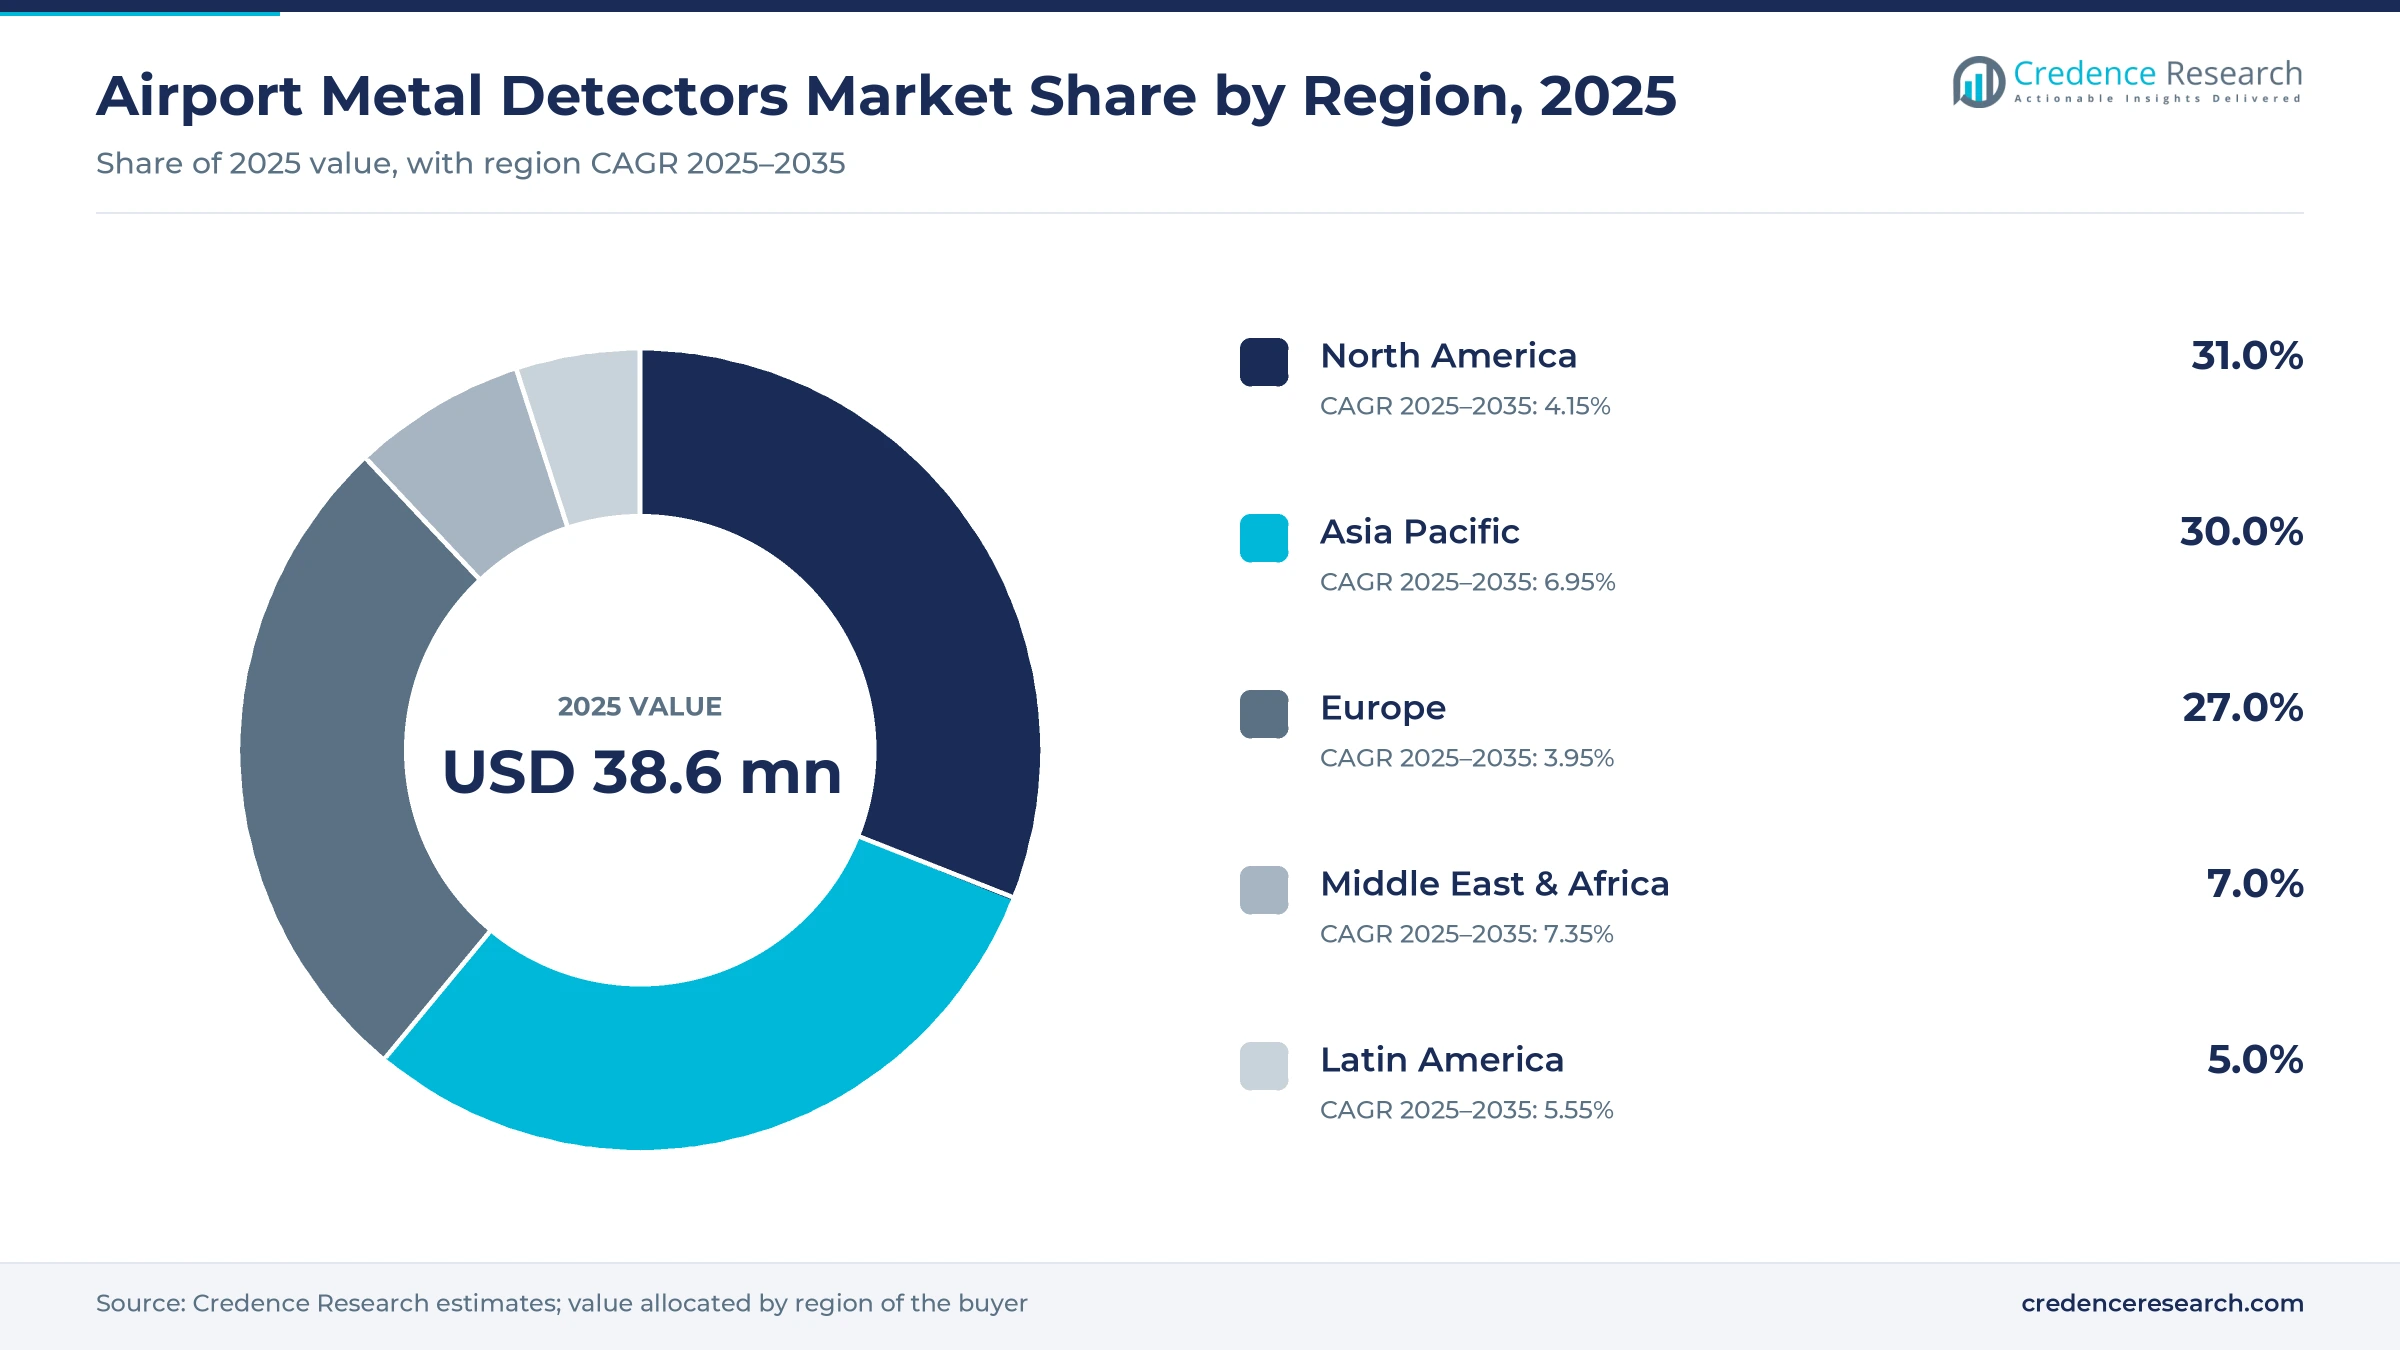
U.S. lanes lead value while Asian and Gulf terminals grow
| Region | Share, 2025 | CAGR, 2025–2035 |
|---|---|---|
| North America | 31.0% | 4.15% |
| Asia Pacific | 30.0% | 6.95% |
| Europe | 27.0% | 3.95% |
| Middle East & Africa | 7.0% | 7.35% |
| Latin America | 5.0% | 5.55% |
North America keeps replacement steady across more than 2,000 U.S. lanes
North America held 31.0% of 2025 value and grows at 4.15% a year. The U.S. runs more than 2,000 checkpoint lanes at over 400 federalized airports, so replacement purchases dominate. The September 2026 deployment award to Leidos secures installation and relocation capacity for those units, while the shoes-on policy and wider staff screening add upgrade demand for footwear and employee-entrance detectors. Imaging expansion at World Cup host-city airports is the main restraint, because it moves new budgets toward scanners.
Asia Pacific adds screening positions at new airports every year
Asia Pacific held 30.0% of 2025 value and grows at 6.95% a year. New airports and terminals in China, India and Southeast Asia add screening positions each year, and many lanes run more detectors per passenger than U.S. lanes do. Nuctech, in turn, supplies checkpoints across China and many emerging markets. Australia runs its own equipment testing program and takes part in ECAC technical meetings, which pulls Australian standards toward European ones and favors suppliers with European test results.
Europe sees upgrade waves driven by shared test standards
Europe held 27.0% of 2025 value and grows at 3.95% a year, the slowest regional rate. EU aviation security law and the common evaluation process set the standards, so upgrade waves follow rule changes. The walk-through detector list was last updated in September 2025. Body scanners and computed tomography for cabin bags take most new checkpoint budgets, which keeps detector growth modest, but Italian specialist CEIA and other certified suppliers hold a large installed base that must be replaced.
Middle East & Africa and Latin America rely on Gulf hubs and concession upgrades
The Middle East & Africa held 7.0% of 2025 value and grows at 7.35% a year, the fastest regional rate. Gulf hubs are building large new terminals, and African airports are upgrading checkpoints to meet international audits. Latin America held 5.0% of 2025 value and grows at 5.55% a year, as airport concession programs in Brazil, Mexico and Colombia bring terminal upgrades that include new screening lanes.
A test-standard pact, shoes-on screening and a recompete
| Development | Status and market relevance |
|---|---|
| In September 2026, the TSA re-awarded Leidos the Security Equipment Deployment Services Checkpoint contract, covering walk-through metal detectors, for 1 base year and up to 7 option years. | Awarded. Secures installation and relocation capacity for U.S. detector replacements. |
| In January 2026, ACI World announced forecasts of 10.2 billion passengers in 2026 and 18.8 billion by 2045, a 3.4% annual rate. | Published. Sets the long-run lane-growth outlook behind new detector demand. |
| In January 2026, the TSA contracted Rohde & Schwarz to deploy millimeter-wave scanners at 2026 FIFA World Cup host-city airports. | Contracted. Shows imaging taking the lead role at new U.S. lanes, with detectors kept for alarm resolution. |
| In July 2025, the TSA announced the end of the general requirement for passengers to remove shoes at checkpoints. | In force. Raises interest in shoe scanning and ankle-level detection. |
| In June 2025, the TSA signed a memorandum of understanding and joined the ECAC Common Evaluation Process as an associated authority. | In force. Moves U.S. and European detector test methods toward a shared reference. |
Zone location, footwear clearance and connected arches
- Zone location in multi-zone arches shows where on the body an alarm came from, which shortens pat-downs and raises lane throughput.
- Footwear clearance through shoe scanning pads and better ankle-level sensitivity lets passengers keep shoes on, following the July 2025 U.S. policy change.
- Connectivity lets networked detectors send alarm data, passenger counts and fault alerts to central systems and accept remote software updates when standards change.
- Lane integration pairs detectors with body scanners and trace detection at one point.
Need a Custom Version of This Report?
Tailor the scope, geography, or segments to your exact requirements.
- Custom geography or segment scope
- Direct access to our analyst team
Detection specialists and checkpoint integrators compete
Competition splits into three groups, the first being metal detection specialists, led by CEIA in Italy and Garrett Metal Detectors in the U.S., which focus on walk-through, handheld and shoe scanning detectors and hold long lists of certified configurations. Security system majors, including Rapiscan Systems of OSI Systems, Smiths Detection and Nuctech, sell detectors inside complete checkpoints that combine X-ray or computed tomography and body scanners, and pitch one contract and one service team for the whole lane. Leidos competes as an integrator and deployer rather than a detector maker. Fisher Labs and Ranger Security Detectors make metal detectors, though their current airport role is not confirmed. Certification is the main entry barrier, because an unlisted model cannot be bought for a checkpoint. No supplier publishes airport detector sales separately, so no share ranking is given.
Companies profiled and their roles
| Company | Type | Role in the market |
|---|---|---|
| CEIA | Detection specialist | Walk-through, handheld and shoe scanning detectors for airports |
| Garrett Metal Detectors | Detection specialist | Handheld units and walk-through models for airports and secure sites |
| Rapiscan Systems (OSI Systems) | Security system major | Checkpoint X-ray, computed tomography and detection packages |
| Smiths Detection | Security system major | Complete checkpoint screening systems |
| Nuctech | Security system major | Checkpoint systems across China and emerging markets |
| Leidos | Integrator and deployer | Lead deployer of TSA checkpoint equipment, including walk-through detectors |
| Fisher Labs | Metal detector maker | Metal detectors; airport role not confirmed |
| Ranger Security Detectors | Metal detector maker | Security detectors; airport role not confirmed |
Arches stay in every lane even as imaging takes headlines
Credence Research's view is that airport metal detectors are a mature, steady market rather than a fading one. Body scanners and computed tomography take the headlines, but the arch remains the primary or alarm-resolution tool at almost every checkpoint, and multi-zone and shoe scanning designs keep average selling values rising. The largest new revenue lies in footwear screening, staff entrances and terminals in Asia and the Gulf. The main strategic risk is imaging-first lane design in North America. Buyers and suppliers should watch certification updates and TSA deployment orders.
Lanes, replacement timing and traffic behind the estimate
The report uses 2025 as the base year and forecasts to 2035, with CAGR calculated over 2025–2035. Market values come from Credence Research's market model, built from the installed base of screening positions, replacement cycles and new-lane additions, scaled from U.S. checkpoint counts and global traffic data; segment and regional splits are Credence Research estimates. Supporting evidence comes from aviation authority traffic data, certification lists, public procurement records and supplier disclosures.
Footwear screening and new terminals lift a mature base
Through 2035, airport metal detector demand will stay anchored in replacement, with growth added by footwear screening, staff entrances and new terminals. Multi-zone arches will become the standard specification at busy hubs, and connected units will make remote updates routine. Asia Pacific and the Middle East & Africa will gain share, while North America remains the largest region. The pace will depend on how far imaging-first lane design spreads and on whether test standards tighten again. Suppliers with certified multi-zone and footwear ranges and dense service networks are best placed to capture that demand.
Frequently Asked Questions
What was the size of the airport metal detectors market in 2025?
What is the forecast value and CAGR of the airport metal detectors market?
What drives demand for airport metal detectors?
Which region holds the largest share of the airport metal detectors market?
Which product leads the airport metal detectors market?
Who are the major companies in the airport metal detectors market?
Are body scanners replacing airport metal detectors?
What technologies are shaping airport metal detectors?
Table of Content
Chapter 1 Market Segmentation
- 1.1 Segmentation Framework
- 1.1.1 Product and Service Classification
- 1.1.2 Application and End-Use Classification
- 1.1.3 Technology and Solution Classification
- 1.1.4 Customer and Distribution Channel Classification
- 1.1.5 Geographic Segmentation
- 1.1.6 Market Segment Definitions and Boundaries
- 1.2 By Product
- 1.2.1 Walk-Through Metal Detectors
- 1.2.2 Handheld Metal Detectors
- 1.2.3 Shoe Scanning Metal Detectors
- 1.3 By Application
- 1.3.1 Passenger Screening
- 1.3.2 Staff & Crew Screening
- 1.3.3 Cargo & Perimeter Access Points
Chapter 2 Introduction
- 2.1 Report Objectives and Scope
- 2.2 Product Definition and Industry Terminology
- 2.3 Market Inclusions and Exclusions
- 2.4 Research Process
- 2.4.1 Primary Research and Expert Interviews
- 2.4.2 Secondary Research and Source Review
- 2.4.3 Top-Down and Bottom-Up Estimation
- 2.4.4 Data Triangulation and Verification
- 2.5 Market Size Measurement Basis
- 2.5.1 2025: USD 38.6 million → 2035: USD 64.8 million
- 2.6 Historical and Forecast Reference Periods
- 2.6.1 Historical Period: 2018-2025
- 2.6.2 Base Year: 2025
- 2.6.3 Forecast Period: 2025-2035
- 2.7 Research Assumptions and Limitations
Chapter 3 Executive Summary
- 3.1 Market Snapshot and Key Findings
- 3.2 Base-Year Market Size, 2025
- 3.3 Forecast Market Size, 2035
- 3.4 Revenue and Volume Growth Outlook
- 3.5 Key Demand and Supply Indicators
- 3.6 Leading Market Segments
- 3.7 Fastest-Growing Market Opportunities
- 3.8 Regional Performance Highlights
- 3.9 Technology and Industry Transformation
- 3.10 Competitive Landscape Summary
- 3.11 Analyst View and Strategic Implications
Chapter 4 Global Airport Metal Detectors Market Trends and Developments
- 4.1 Historical Industry Development, 2018-2025
- 4.2 Recent Market Trends and Developments
- 4.3 Demand and Customer Behavior Trends
- 4.4 Technology and Product Innovation
- 4.5 Artificial Intelligence, Automation and Digitalization
- 4.6 Local Manufacturing and Supply Chain Realignment
- 4.7 Industry Partnerships, Mergers and Acquisitions
- 4.8 Sustainability and Circular Economy Developments
- 4.9 Government and Private Sector Investment Trends
- 4.10 Emerging Business Models and Commercialization
- 4.11 Industry Developments and Announcements
Chapter 5 Global Airport Metal Detectors Market Production, Supply and Demand Analysis
- 5.1 Demand Trend and Consumption Analysis, 2018-2025
- 5.2 Demand Forecast, 2025-2035
- 5.3 Production and Output Trend, 2018-2025
- 5.4 Production and Output Forecast, 2025-2035
- 5.5 Installed Capacity and Capacity Utilization
- 5.6 Company-Wise Production Plants and Statistics
- 5.6.1 Installed Production Capacity
- 5.6.2 Actual Production
- 5.6.3 Planned Capacity and Expansion Targets
- 5.7 Supply Chain Structure and Procurement Trends
- 5.8 Supply-Demand Gap and Bottlenecks
- 5.9 Import Dependence and Sourcing Structure
- 5.10 Contract Manufacturing and Outsourcing
- 5.11 Regional Supply and Demand Concentration
Chapter 6 Global Airport Metal Detectors Market Pricing Analysis
- 6.1 Pricing Structure and Measurement
- 6.2 Historical Pricing Trends, 2018-2025
- 6.3 Pricing Outlook, 2025-2035
- 6.4 Average Selling Price and Unit Economics
- 6.5 Pricing by Product and Market Segment
- 6.6 Geographic Pricing Differences
- 6.7 Key Input, Energy, Labor and Logistics Costs
- 6.8 Contract Pricing and Purchasing Models
- 6.9 Pricing Sensitivity and Competitive Positioning
- 6.10 Price, Margin and Profitability Implications
Chapter 7 Global Airport Metal Detectors Market Dynamics
- 7.1 Market Growth Drivers
- 7.1.1 Demand-Side Drivers
- 7.1.2 Technology and Innovation Drivers
- 7.1.3 Infrastructure and Investment Drivers
- 7.1.4 Regulatory and Policy Drivers
- 7.2 Market Restraints
- 7.2.1 Cost and Affordability Constraints
- 7.2.2 Technology and Adoption Barriers
- 7.2.3 Supply Chain and Operational Constraints
- 7.3 Market Challenges
- 7.3.1 Competitive Pressure and Margin Erosion
- 7.3.2 Skills, Infrastructure and Implementation Gaps
- 7.4 Emerging Market Opportunities
- 7.5 Market Dynamics Impact and Time-Horizon Assessment
Chapter 8 Global Airport Metal Detectors Value Chain Analysis
- 8.1 Industry Value Chain Overview
- 8.2 Upstream Suppliers and Critical Inputs
- 8.3 Technology and Component Providers
- 8.4 Manufacturing or Service Delivery
- 8.5 Distribution, Channel Partners and Integrators
- 8.6 Downstream Applications and End Users
- 8.7 Value Addition and Profit Pools
- 8.8 Vertical Integration and Outsourcing
- 8.9 Supplier Concentration and Risk
- 8.10 Supply Chain Localization and Resilience
Chapter 9 Global Airport Metal Detectors Market Regulations and Policies
- 9.1 Relevant Laws, Standards and Compliance Frameworks
- 9.2 Product, Service, Safety and Quality Requirements
- 9.3 Government Policies, Incentives and Subsidies
- 9.4 Imports, Exports and Trade Barriers
- 9.5 Public Procurement and Local Content Requirements
- 9.6 Environmental and Sustainability Compliance
- 9.7 Upcoming Policy Changes and Market Implications
Chapter 10 Global Airport Metal Detectors Market Hotspots and Opportunities
- 10.1 Market Opportunity Mapping and Growth Hotspots
- 10.2 High-Growth Applications and Customer Groups
- 10.3 Underserved Markets and White-Space Opportunities
- 10.4 Emerging Technology and Product Opportunities
- 10.5 New Capacity and Investment Hotspots
- 10.6 Market Entry and Expansion Opportunities
- 10.7 Distribution and Partnership Opportunities
- 10.8 Near-Term and Long-Term Commercial Potential
- 10.9 Opportunity Attractiveness and Execution Risks
Chapter 11 Global Airport Metal Detectors Market Outlook, 2025-2035
- 11.1 Market Size and Analysis
- 11.1.1 Revenue (Market Measurement: 2025: USD 38.6 million → 2035: USD 64.8 million)
- 11.1.2 Market Volume and Quantity Sold
- 11.1.3 Historical Market Size, 2018-2025
- 11.1.4 Base-Year Market Size, 2025
- 11.2 Market Forecast, 2025-2035
- 11.2.1 Revenue Forecast to 2035
- 11.2.2 Volume Forecast to 2035
- 11.2.3 CAGR and Year-on-Year Growth
- 11.2.4 Incremental Revenue Opportunity
- 11.3 Forecast Assumptions and Scenario Analysis
- 11.3.1 Base-Case Forecast
- 11.3.2 Optimistic and Conservative Scenarios
- 11.3.3 Technology, Pricing and Policy Sensitivities
- 11.4 Market Attractiveness and Growth Outlook
Chapter 12 Global Airport Metal Detectors Market Segmentation and Outlook
- 12.1 Segmentation Summary and Market Shares, 2025
- 12.2 Largest and Fastest-Growing Segments
- 12.3 By Product - Market Size and Forecast, 2025-2035
- 12.3.1 Segment Definition and Scope
- 12.3.2 Historical Market Size, 2018-2025
- 12.3.3 Revenue Forecast, 2025-2035
- 12.3.4 Volume Forecast, 2025-2035
- 12.3.5 Base-Year Market Share, 2025
- 12.3.6 Segment CAGR and Growth Drivers
- 12.3.7 Subsegment Market Size and Forecast
- 12.3.7.1 Walk-Through Metal Detectors
- 12.3.7.2 Handheld Metal Detectors
- 12.3.7.3 Shoe Scanning Metal Detectors
- 12.3.8 Subsegment Pricing and Adoption Trends
- 12.3.9 Leading Suppliers and Competition
- 12.3.10 Regional Demand and Opportunities
- 12.4 By Application - Market Size and Forecast, 2025-2035
- 12.4.1 Segment Definition and Scope
- 12.4.2 Historical Market Size, 2018-2025
- 12.4.3 Revenue Forecast, 2025-2035
- 12.4.4 Volume Forecast, 2025-2035
- 12.4.5 Base-Year Market Share, 2025
- 12.4.6 Segment CAGR and Growth Drivers
- 12.4.7 Subsegment Market Size and Forecast
- 12.4.7.1 Passenger Screening
- 12.4.7.2 Staff & Crew Screening
- 12.4.7.3 Cargo & Perimeter Access Points
- 12.4.8 Subsegment Pricing and Adoption Trends
- 12.4.9 Leading Suppliers and Competition
- 12.4.10 Regional Demand and Opportunities
- 12.5 Segment Growth Comparison
- 12.6 Segment Attractiveness and Priority Matrix
Chapter 13 Global Airport Metal Detectors End-Use and Application Market Outlook
- 13.1 End-Use Industry and Customer Demand Structure
- 13.2 Leading Applications and Customer Groups
- 13.3 End-Use Market Size, Share and Forecast
- 13.4 Major End-Use Industry Deep Dives
- 13.4.1 Customer Requirements and Use Cases
- 13.4.2 Demand and Replacement Cycles
- 13.4.3 Technical and Regulatory Considerations
- 13.4.4 Purchasing and Procurement Models
- 13.4.5 Leading Vendors and Distribution Channels
- 13.4.6 Forecast and Commercial Opportunities
- 13.5 Emerging Applications and Cross-Segment Demand
- 13.6 End-Use Industry Investment Priorities
Chapter 14 Global Airport Metal Detectors Geographic Market Outlook, 2025-2035
- 14.1 Regional Market Size and Share, 2025
- 14.2 Regional Market Forecast, 2025-2035
- 14.3 Regional Pricing, Production and Demand Differences
- 14.4 North America
- 14.4.1 United States
- 14.4.2 Canada
- 14.4.3 Mexico
- 14.5 Europe
- 14.5.1 Germany
- 14.5.2 France
- 14.5.3 Italy
- 14.5.4 United Kingdom
- 14.5.5 Spain
- 14.5.6 Poland
- 14.5.7 Russia
- 14.5.8 Netherlands
- 14.5.9 Belgium
- 14.5.10 Sweden
- 14.5.11 Denmark
- 14.5.12 Norway
- 14.5.13 Rest of Europe
- 14.6 Asia Pacific
- 14.6.1 China
- 14.6.2 India
- 14.6.3 Japan
- 14.6.4 South Korea
- 14.6.5 Thailand
- 14.6.6 Indonesia
- 14.6.7 Vietnam
- 14.6.8 Malaysia
- 14.6.9 Australia
- 14.6.10 Rest of Asia Pacific
- 14.7 Latin America
- 14.7.1 Brazil
- 14.7.2 Argentina
- 14.7.3 Colombia
- 14.7.4 Chile
- 14.7.5 Rest of Latin America
- 14.8 Middle East
- 14.8.1 Saudi Arabia
- 14.8.2 United Arab Emirates
- 14.8.3 Turkey
- 14.8.4 Israel
- 14.8.5 Iran
- 14.8.6 Rest of the Middle East
- 14.9 Africa
- 14.9.1 South Africa
- 14.9.2 Egypt
- 14.9.3 Nigeria
- 14.9.4 Morocco
- 14.9.5 Rest of Africa
- 14.10 Regional Investment, Policy and Supply Chain Differences
- 14.11 Regional Competitive Landscape
- 14.12 Geographic Growth Hotspots
Chapter 15 Global Airport Metal Detectors Technology, Innovation and Sustainability Outlook
- 15.1 Technology Landscape and Maturity
- 15.2 Product, Process and Service Innovation
- 15.3 AI, Automation and Digital Tools in the Industry
- 15.4 Technology Adoption and Performance Benchmarking
- 15.5 Innovation Pipeline and R&D Investment
- 15.6 Patent and Intellectual Property Trends
- 15.7 Energy Efficiency and Resource Management
- 15.8 Sustainability, Recycling and Circularity
- 15.9 Technology Roadmap, 2025-2035
- 15.10 Risks of Obsolescence and Technology Substitution
Chapter 16 Global Airport Metal Detectors Market Key Strategic Imperatives
- 16.1 Growth and Market Entry Priorities
- 16.2 High-Return Products and Segments
- 16.3 Pricing, Profitability and Cost Optimization
- 16.4 Technology Investment and Product Differentiation
- 16.5 Supply Chain Localization and Resilience
- 16.6 Distribution and Customer Acquisition
- 16.7 Partnership, Acquisition and Capacity Strategy
- 16.8 Regional Expansion Priorities
- 16.9 Short-, Medium- and Long-Term Actions
Chapter 17 Competition Outlook
- 17.1 Industry Competition Characteristics
- 17.2 Market Structure and Concentration
- 17.3 Market Share and Competitive Positioning, 2025
- 17.4 Company-Wise Revenue and Product Benchmarking
- 17.5 Production and Service Capacity Benchmarking
- 17.6 Technology, Pricing and Differentiation
- 17.7 Regional Footprint and Distribution Strength
- 17.8 Mergers, Acquisitions and Strategic Alliances
- 17.9 New Entrants and Competitive Threats
- 17.10 Porter's Five Forces and Industry Attractiveness
- 17.11 Competitive Outlook, 2025-2035
Chapter 18 Company Profiles
- 18.1 Company Coverage and Selection Criteria
- 18.2 CEIA
- 18.2.1 Business Description
- 18.2.2 Company Ownership and Geographic Presence
- 18.2.3 Product and Service Portfolio
- 18.2.4 Manufacturing and Operating Footprint
- 18.2.5 Production Capacity and Expansion Plans
- 18.2.6 Financial Performance and Investment
- 18.2.7 Market Share and Competitive Position
- 18.2.8 Technology and Innovation Capabilities
- 18.2.9 Strategic Alliances or Partnerships
- 18.2.10 Recent Developments
- 18.2.11 Growth Strategy and Outlook
- 18.3 Garrett Metal Detectors
- 18.4 Rapiscan Systems (OSI Systems)
- 18.5 Smiths Detection
- 18.6 Leidos
- 18.7 Nuctech
- 18.8 Fisher Labs
- 18.9 Ranger Security Detectors
- 18.10 Other Relevant Market Participants
Note: Every listed company is profiled on the structure shown under the first company. The company list is preliminary and may change based on research findings, market developments, data availability and client requirements.
Chapter 19 Disclaimer
- 19.1 Research and Forecast Disclaimer
- 19.2 Data Source and Estimation Limitations
Note: The depth of individual sections depends on data availability for this market. Volume, capacity, trade and other unit-based metrics are included where applicable.

