
Asia-Pacific data center substation demand follows AI load
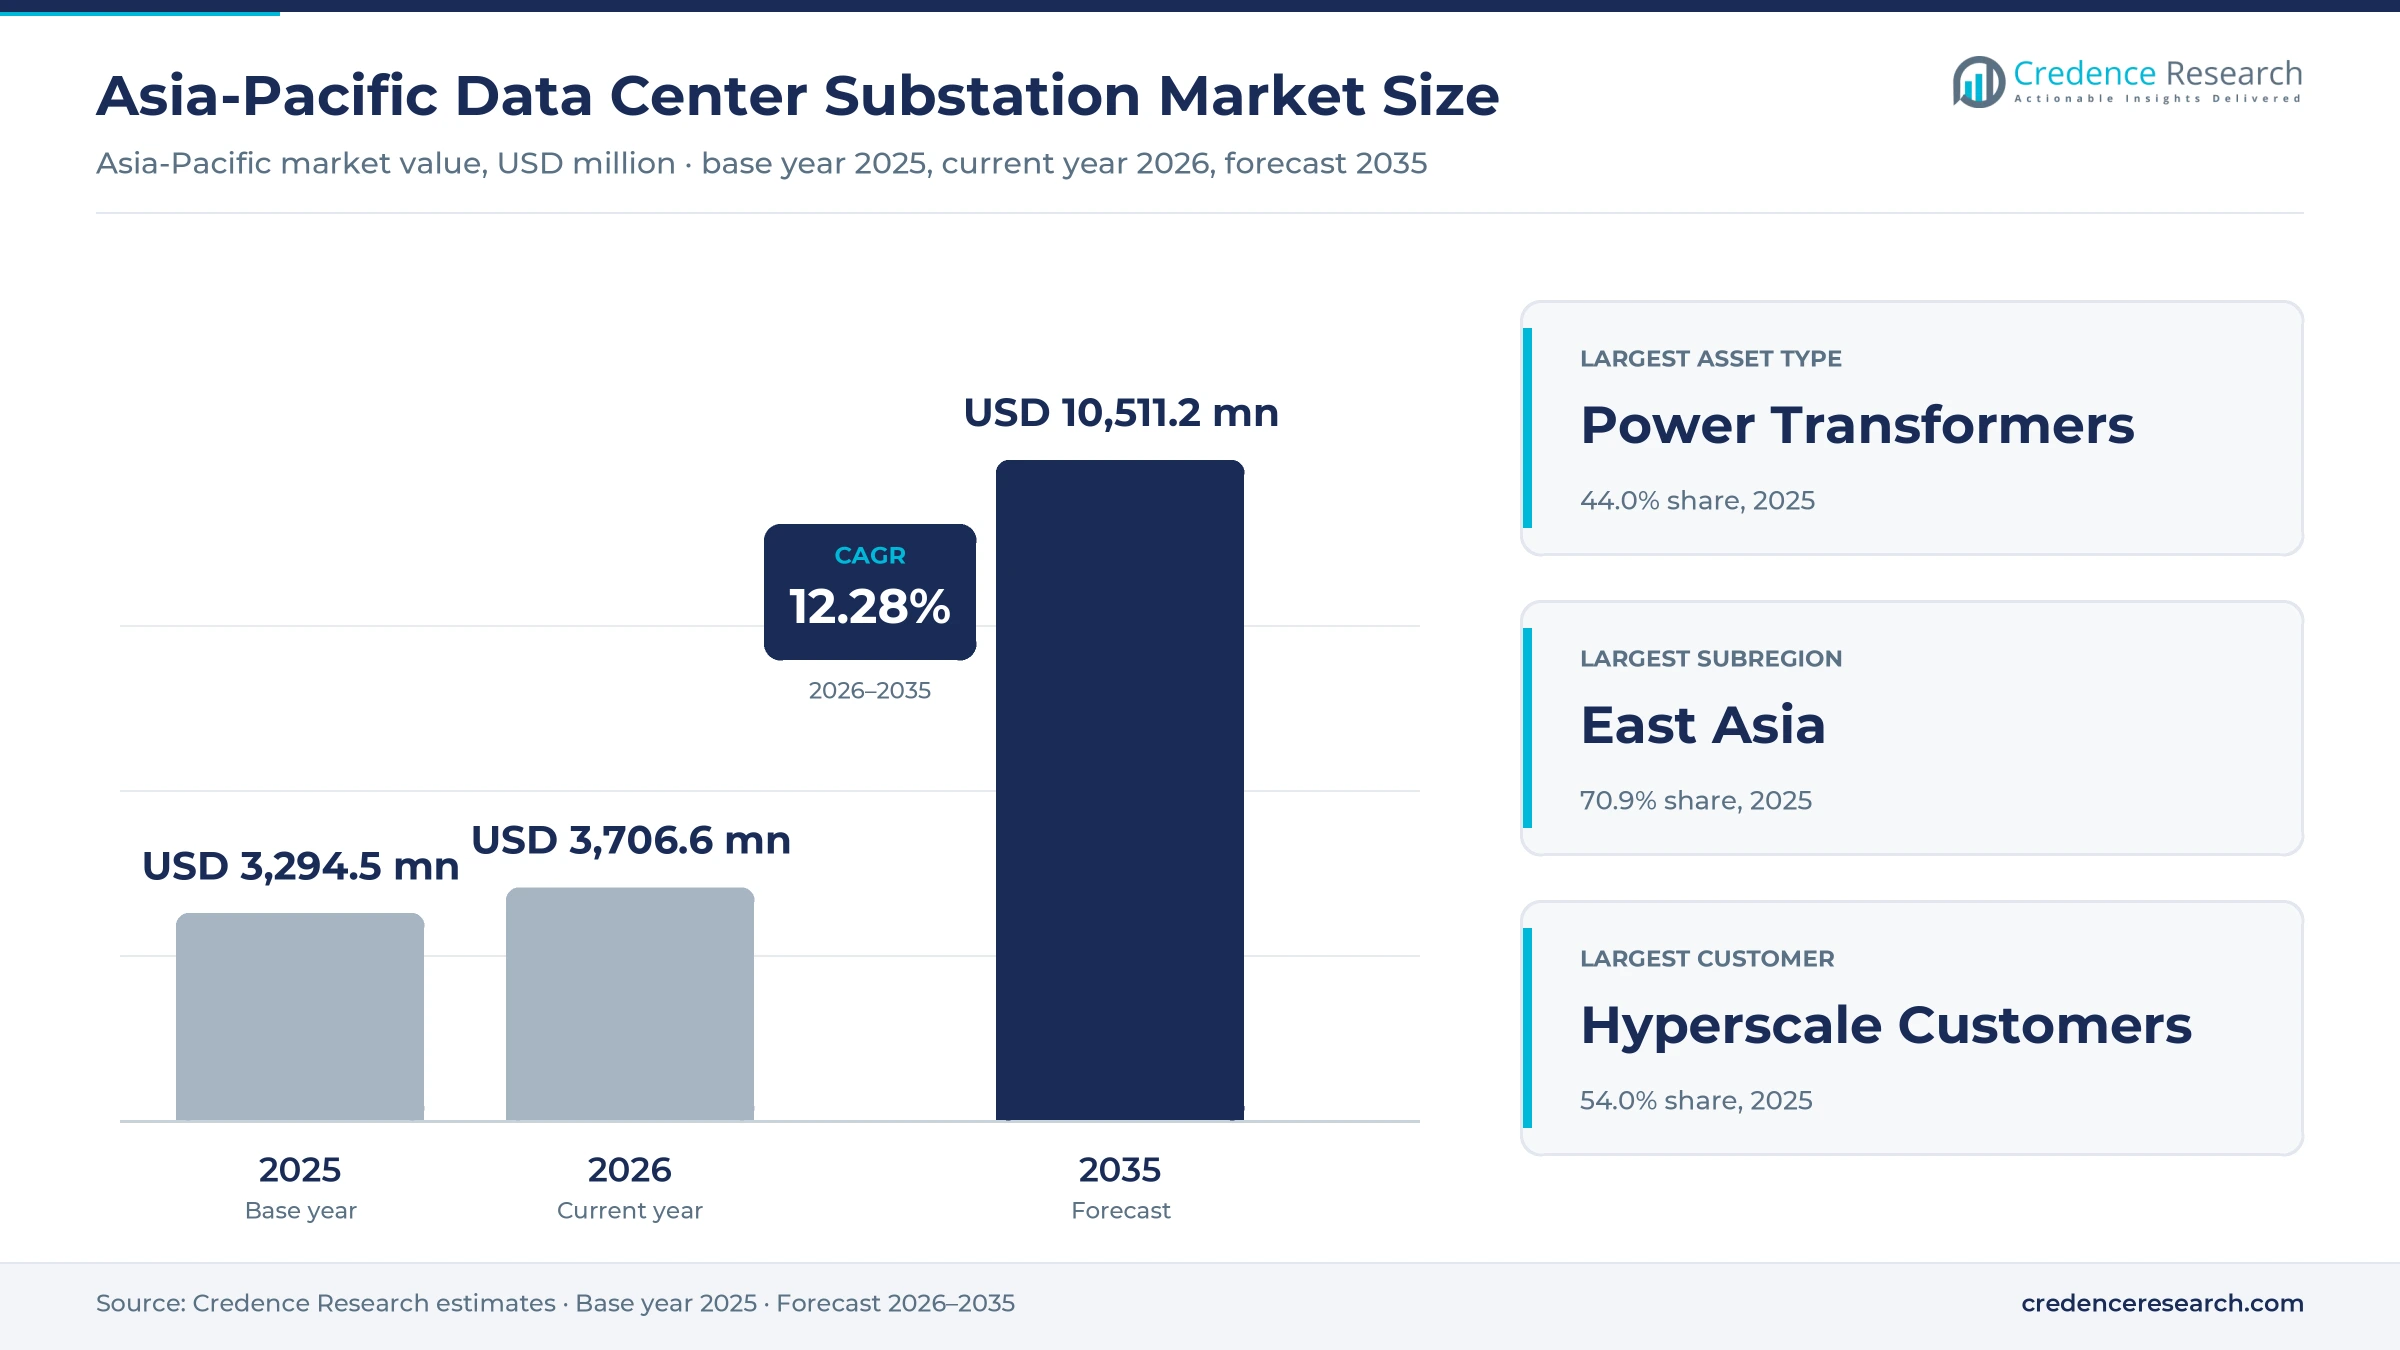
The Asia-Pacific data center substation market was valued at USD 3.29 billion in 2025 and is projected to increase from USD 3.71 billion in 2026 to USD 10.51 billion by 2035, registering a CAGR of 12.28% during 2026–2035. Demand comes from AI and cloud campuses that need dedicated high-voltage connections, plus utilities that are reinforcing grids around dense computing clusters. East Asia held the largest share, 70.9% in 2025, because China anchors regional capacity and State Grid expects to invest up to 4 trillion yuan during 2026 to 2030. South Asia is the fastest-growing subregion at 14.33% a year, supported by Indian government estimates of 13.56 GW of data center demand by 2031–32. On the regulatory side, Malaysia applied an ultra-high-voltage tariff to data centers from July 1, 2025, and that step shows how governments are shifting connection costs toward large computing loads. Buyers increasingly treat power delivery as the first site decision.
What does a data center substation package include?
The market counts spending on substations that serve data center campuses, including power transformers, switchgear, protection, control and ancillary systems. It also counts engineering, installation, expansion and lifecycle support where a substation is dedicated to a data center load. Buyers include hyperscale, colocation, enterprise, edge and carrier operators, along with utilities or third parties that own a dedicated connection.
The scope excludes general transmission lines, shared utility substations with no dedicated data center load, generators, batteries, uninterruptible power supplies and low-voltage racks inside the data hall. The value chain runs from equipment makers and panel builders through engineering contractors and transmission utilities to the operators that energize each campus.
Asia-Pacific Data Center Substation Market Insights
- The market rises from USD 3.29 billion in 2025 to USD 10.51 billion by 2035, a 12.28% CAGR during 2026–2035, as AI campuses move onto dedicated high-voltage connections.
- East Asia held 70.9% of 2025 value, because China reached 166 TWh of data center electricity use in 2024, according to CAICT figures.
- Power Transformers led asset spending with 44.0% in 2025, since large units carry long delivery times and the highest value per project.
- Malaysia applied its ultra-high-voltage tariff to data centers from July 1, 2025, showing a regional move toward charging connection costs to large loads.
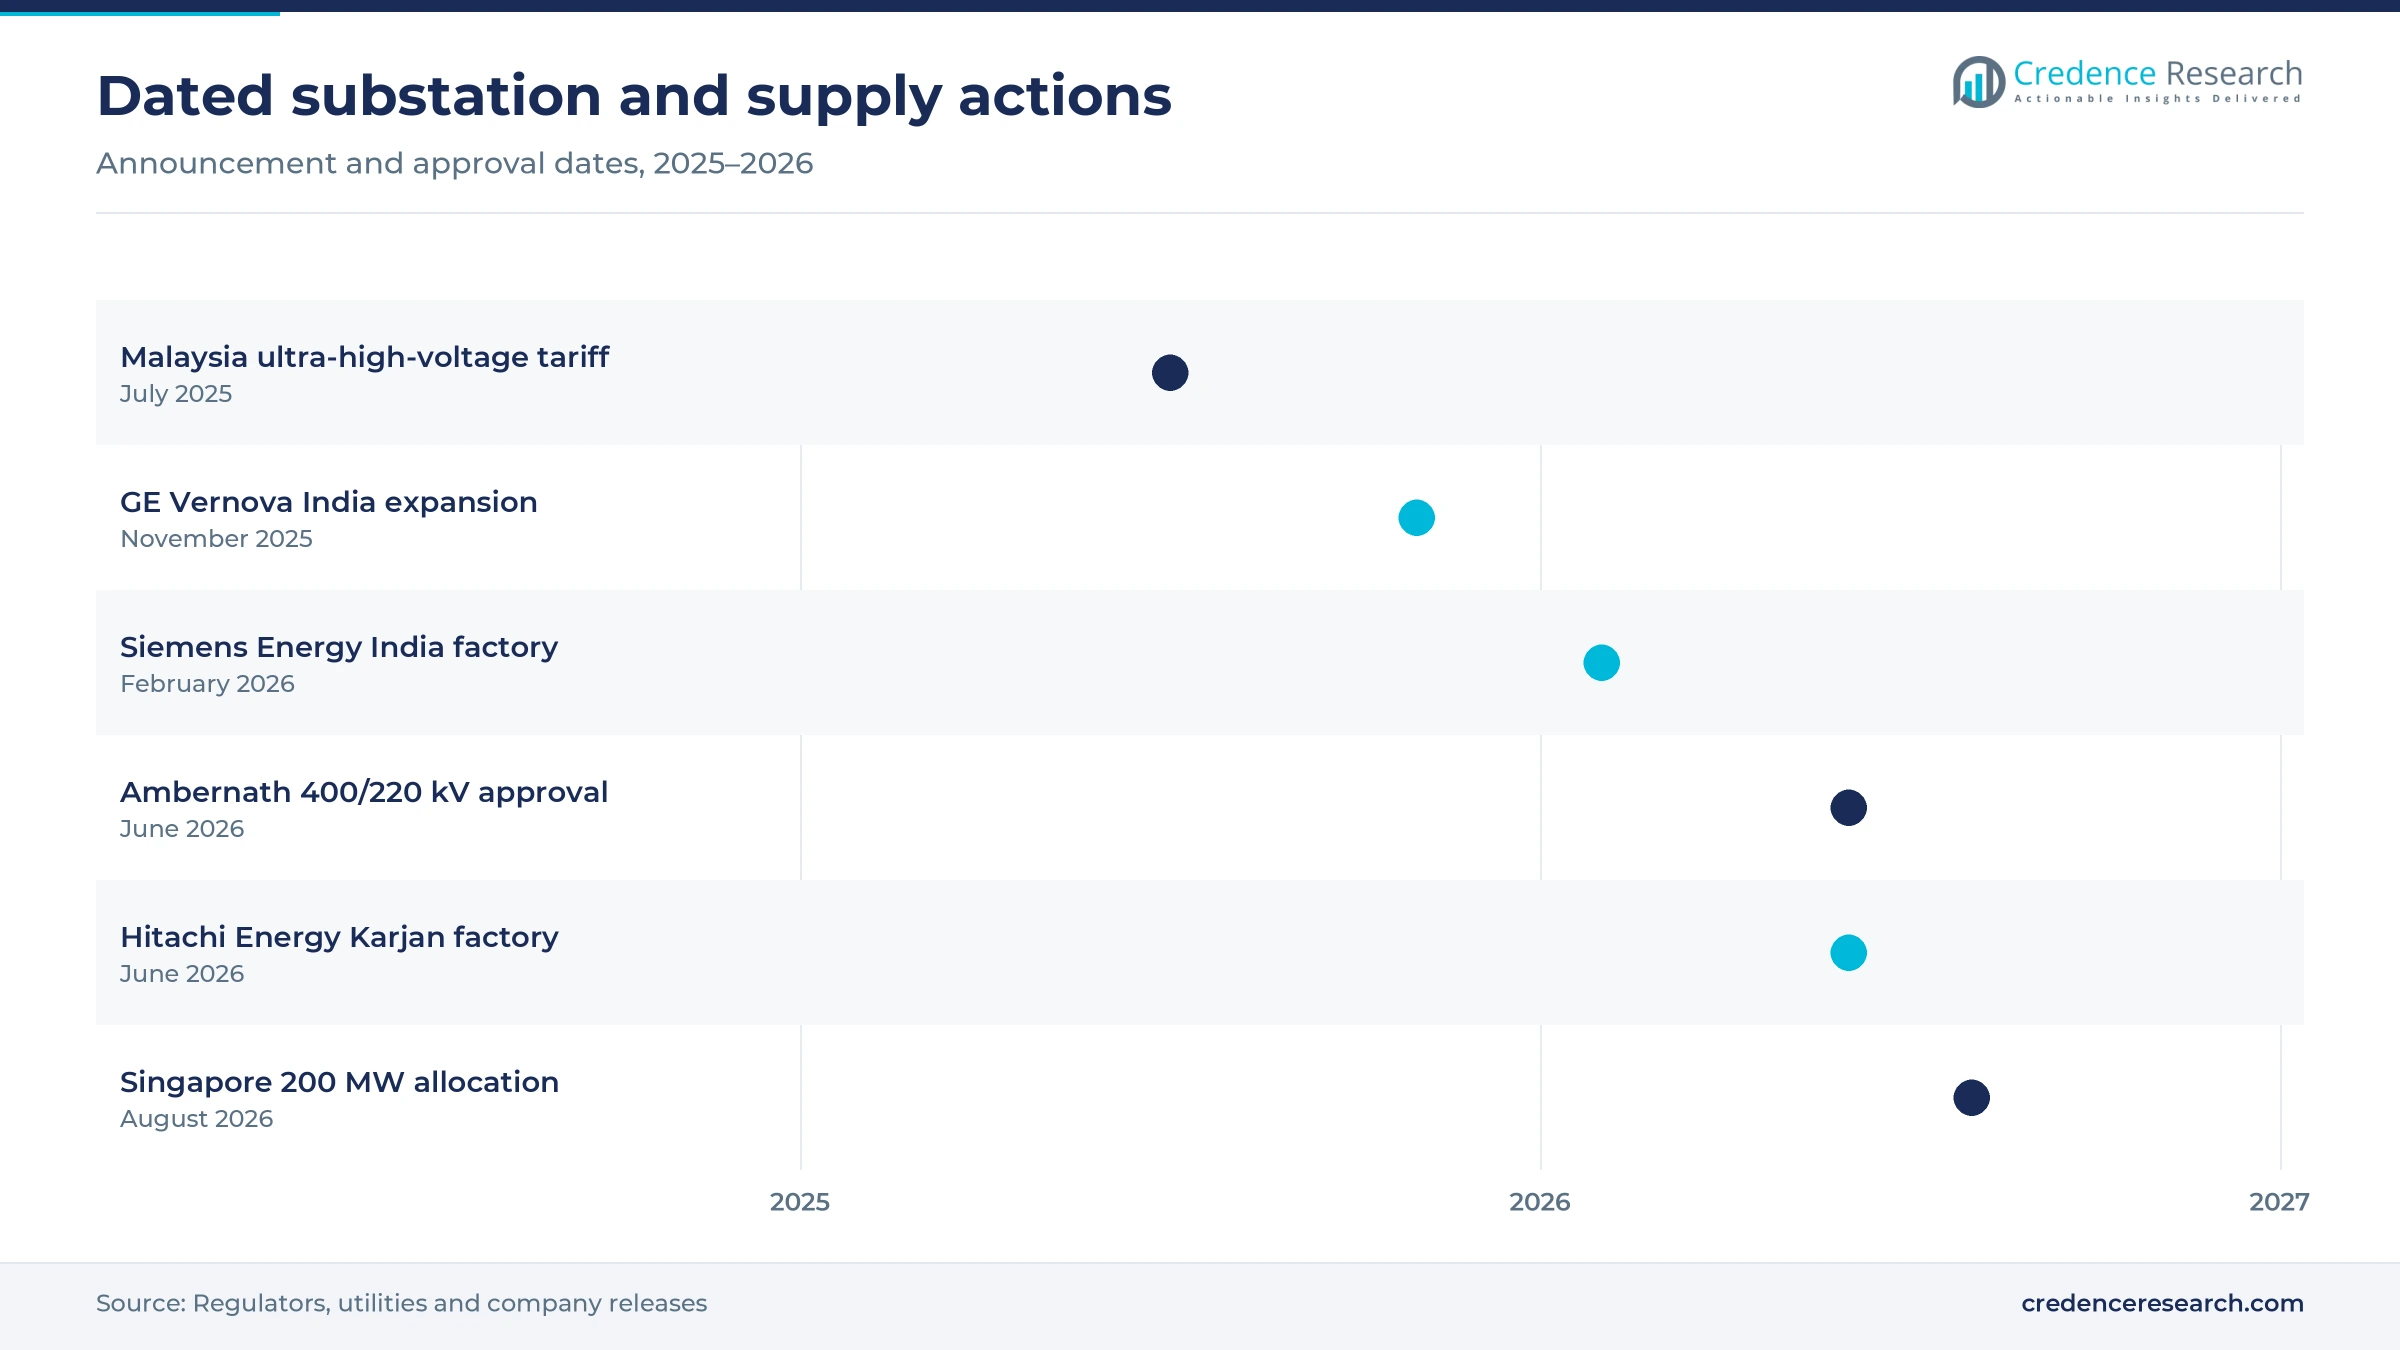
- Hitachi Energy, Siemens Energy and GE Vernova all approved new Indian factory capacity between November 2025 and June 2026, ahead of expected grid orders.
Transformers and greenfield builds hold the largest budgets
Why do greenfield substations take most project budgets?
Based on project type, the market is categorized into greenfield substations, capacity expansion and modernization and lifecycle support. Greenfield Substations led with 62.0% of 2025 value because new campuses need new grid nodes, as the Maharashtra regulator showed in June 2026 by approving a 400/220 kV Ambernath substation for a data center load, due by 2027, according to Mercom India. Modernization and Lifecycle Support grows fastest at 13.37% a year as older sites adapt to AI racks. BW Engineering, for example, reports a Singapore colocation retrofit of more than 20 MW that moved supply from 22 kV to 66 kV with a new substation.
Why do power transformers carry the largest asset share?
Based on asset type, the market is categorized into power transformers, switchgear and protection and ancillary systems. Power Transformers led with 44.0% of 2025 value because each campus connection depends on large units, and Siemens Energy India approved about INR 2,060 crore in February 2026 to add 30,000 MVA of capacity. Compact sites also favor gas-insulated switchgear, which Power Line magazine says uses about 35% less space than air-insulated designs. Protection and Ancillary Systems grows fastest at 13.12% a year as digital schemes spread, and Adani Electricity reported in May 2025 that process bus technology cut copper cabling by 92% in Mumbai.
Why do hyperscale customers lead substation spending?
Based on customer type, the market is categorized into hyperscale customers, colocation operators, enterprise operators and edge and carrier operators. Hyperscale Customers led with 54.0% of 2025 value and also grow fastest at 12.74% a year because their single sites are the largest loads, as with the USD 15 billion Google campus begun at Visakhapatnam in April 2026. Colocation demand is also firm, since Singapore provisionally allocated Digital Realty, Equinix, Keppel Data Centres and ST Telemedia Global Data Centres 50 MW each in August 2026. Smaller sites spread load more thinly, with TelecomTalk reporting more than 120 Nxtra edge locations in June 2025.
Why do conventional designs still lead while digital grows faster?
Based on technology, the market is categorized into conventional substations, digital substations and hybrid substations. Conventional Substations held 52.0% of 2025 value because utility practice changes slowly, and Odisha only commissioned its first process bus grid substation at Agalpur in September 2025, according to Power Peak Digest. Digital Substations grows fastest at 14.11% a year as operators seek less cabling, a benefit Adani Electricity reported with its digital 220 kV Bandra Kurla Complex substation in May 2025. Hybrid designs keep a practical niche, since Power Line magazine reports that POWERGRID favors them where added bays must fit limited space.
| Segment Group | Leading Sub-segment | Share, 2025 | Fastest-growing Sub-segment | CAGR, 2026–2035 |
|---|---|---|---|---|
| By Project Type | Greenfield Substations | 62.0% | Modernization and Lifecycle Support | 13.37% |
| By Asset Type | Power Transformers | 44.0% | Protection and Ancillary Systems | 13.12% |
| By Customer Type | Hyperscale Customers | 54.0% | Hyperscale Customers | 12.74% |
| By Technology | Conventional Substations | 52.0% | Digital Substations | 14.11% |
Request a Free Sample
Fill in your details and we'll send you a free sample report.
- Sample data tables & charts
- Research methodology
Campus scale and grid queues set the pace of orders
AI campus power concentration raises connection voltage
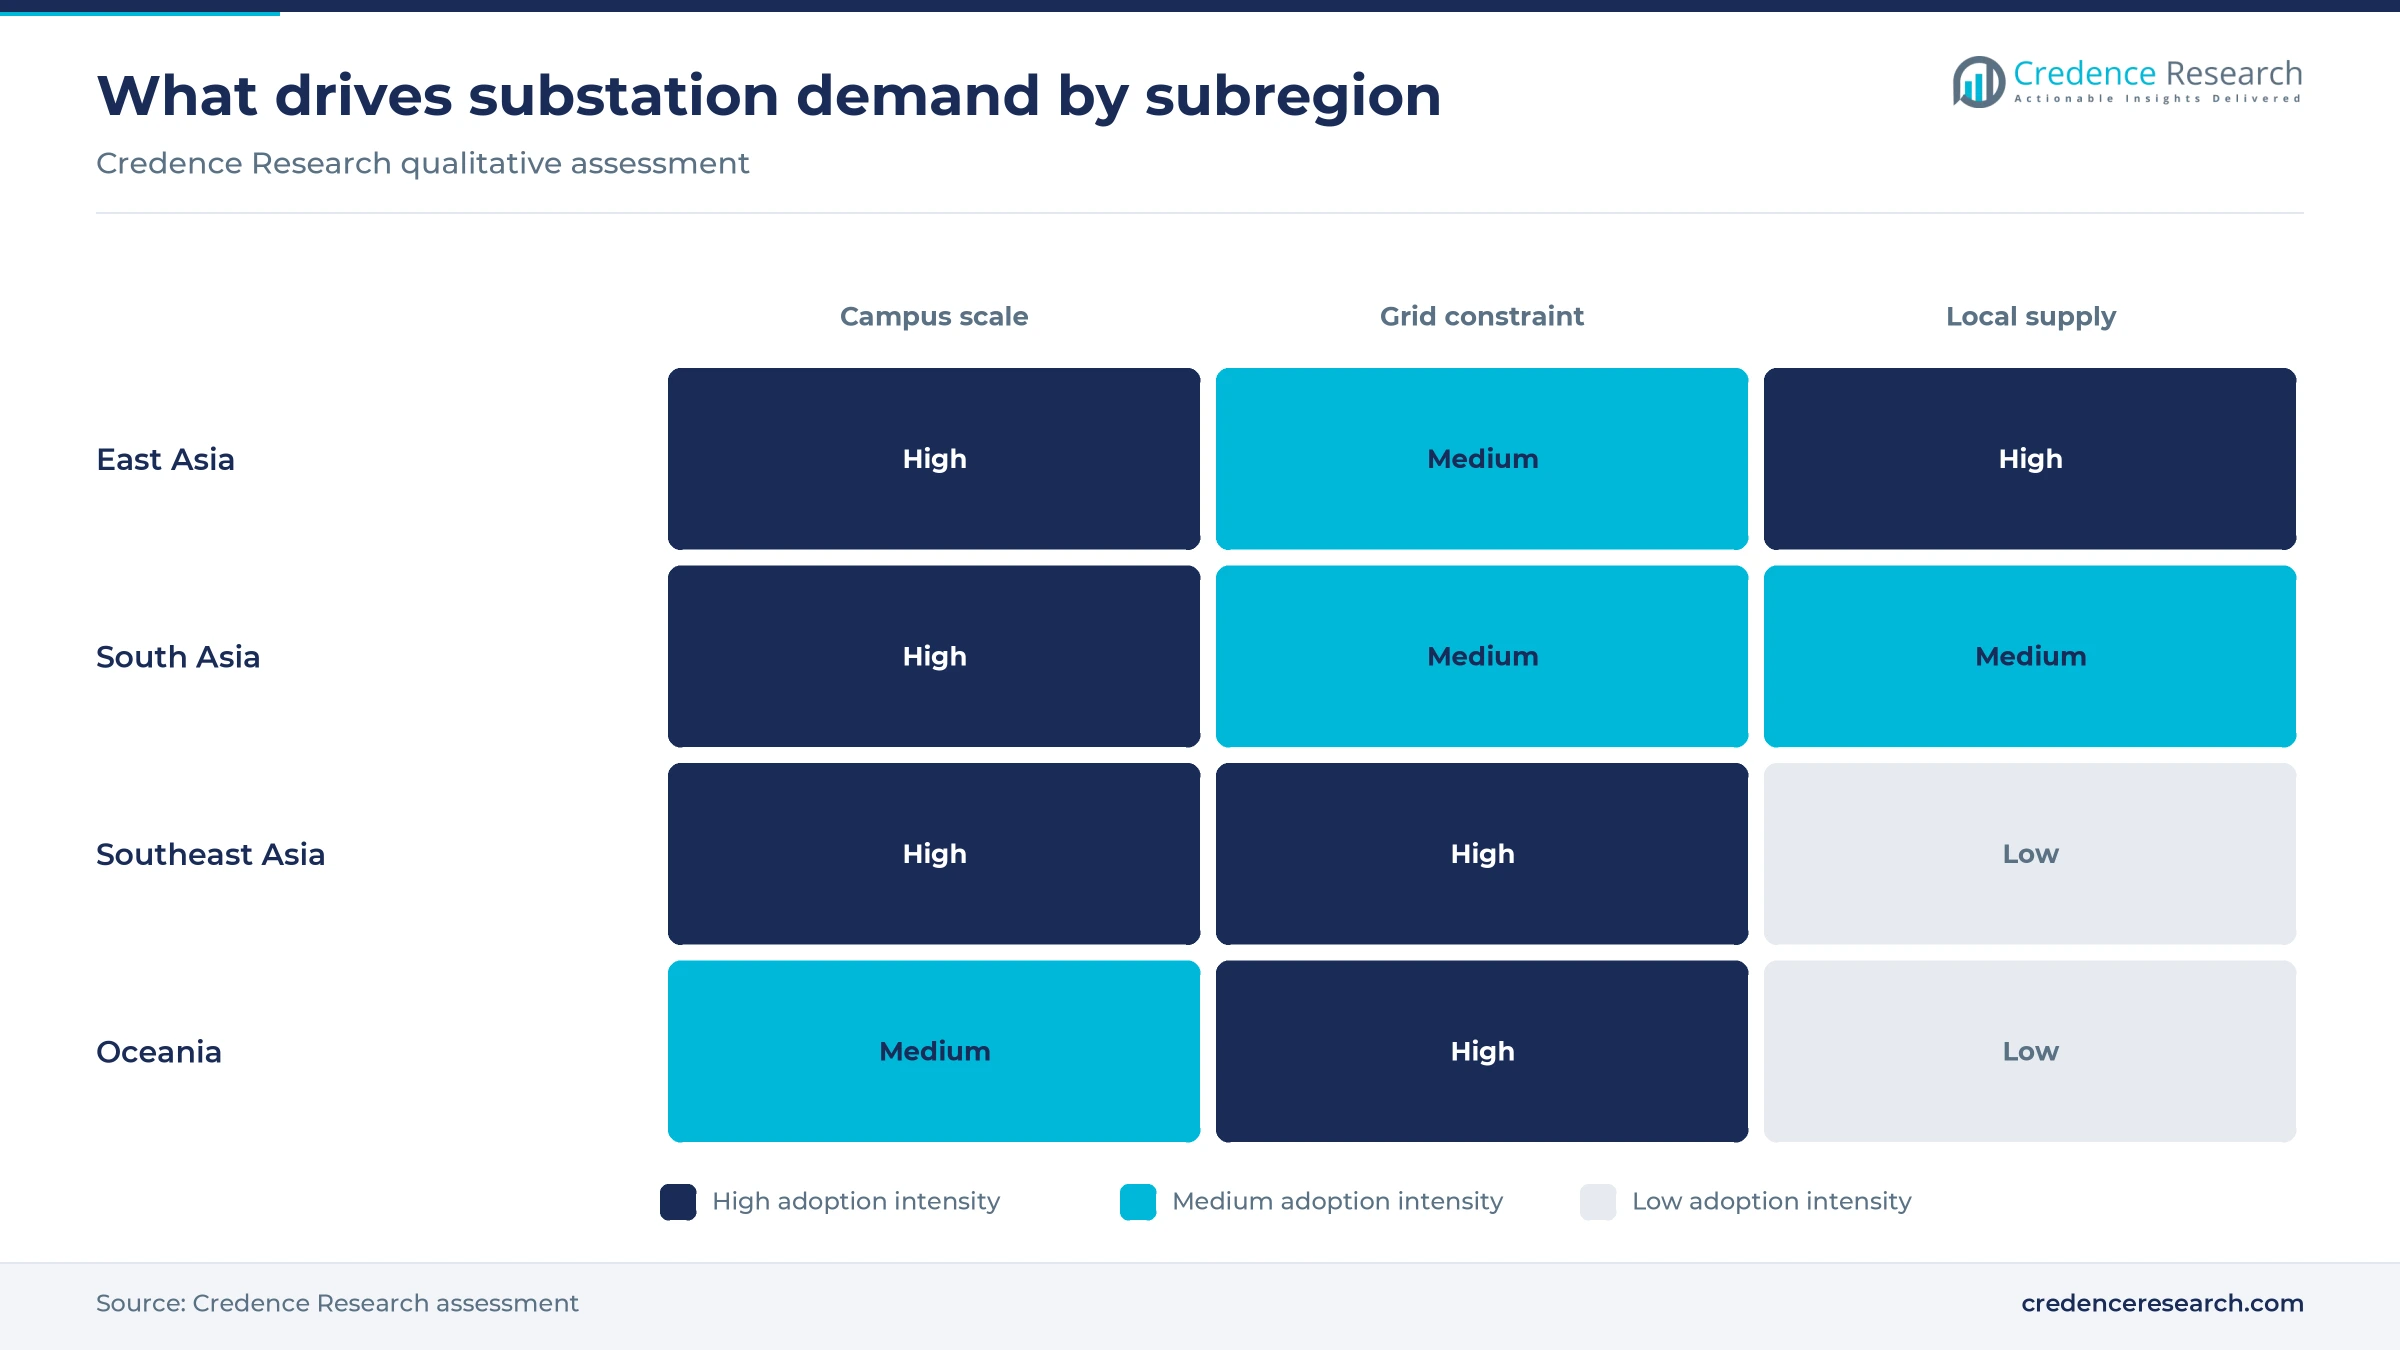
AI campuses concentrate very large loads at one grid node, which pushes buyers from shared feeders toward dedicated high-voltage substations. Computer Weekly reported that AI servers draw 100 kW per rack, about five times a traditional rack, in its coverage of the Singapore testbed run by ST Telemedia Global Data Centres. In April 2026, Google laid the foundation stone for a USD 15 billion, gigawatt-scale campus at Visakhapatnam with AdaniConneX and Nxtra by Airtel as partners. In May 2026, Thailand's Board of Investment approved six projects worth 958 billion baht, including an 842 billion baht TikTok expansion, according to CRN Asia. As a result, hyperscale campuses now shape substation scope, and hyperscale customers hold 54.0% of 2025 value.
Regional pipeline conversion turns queues into orders
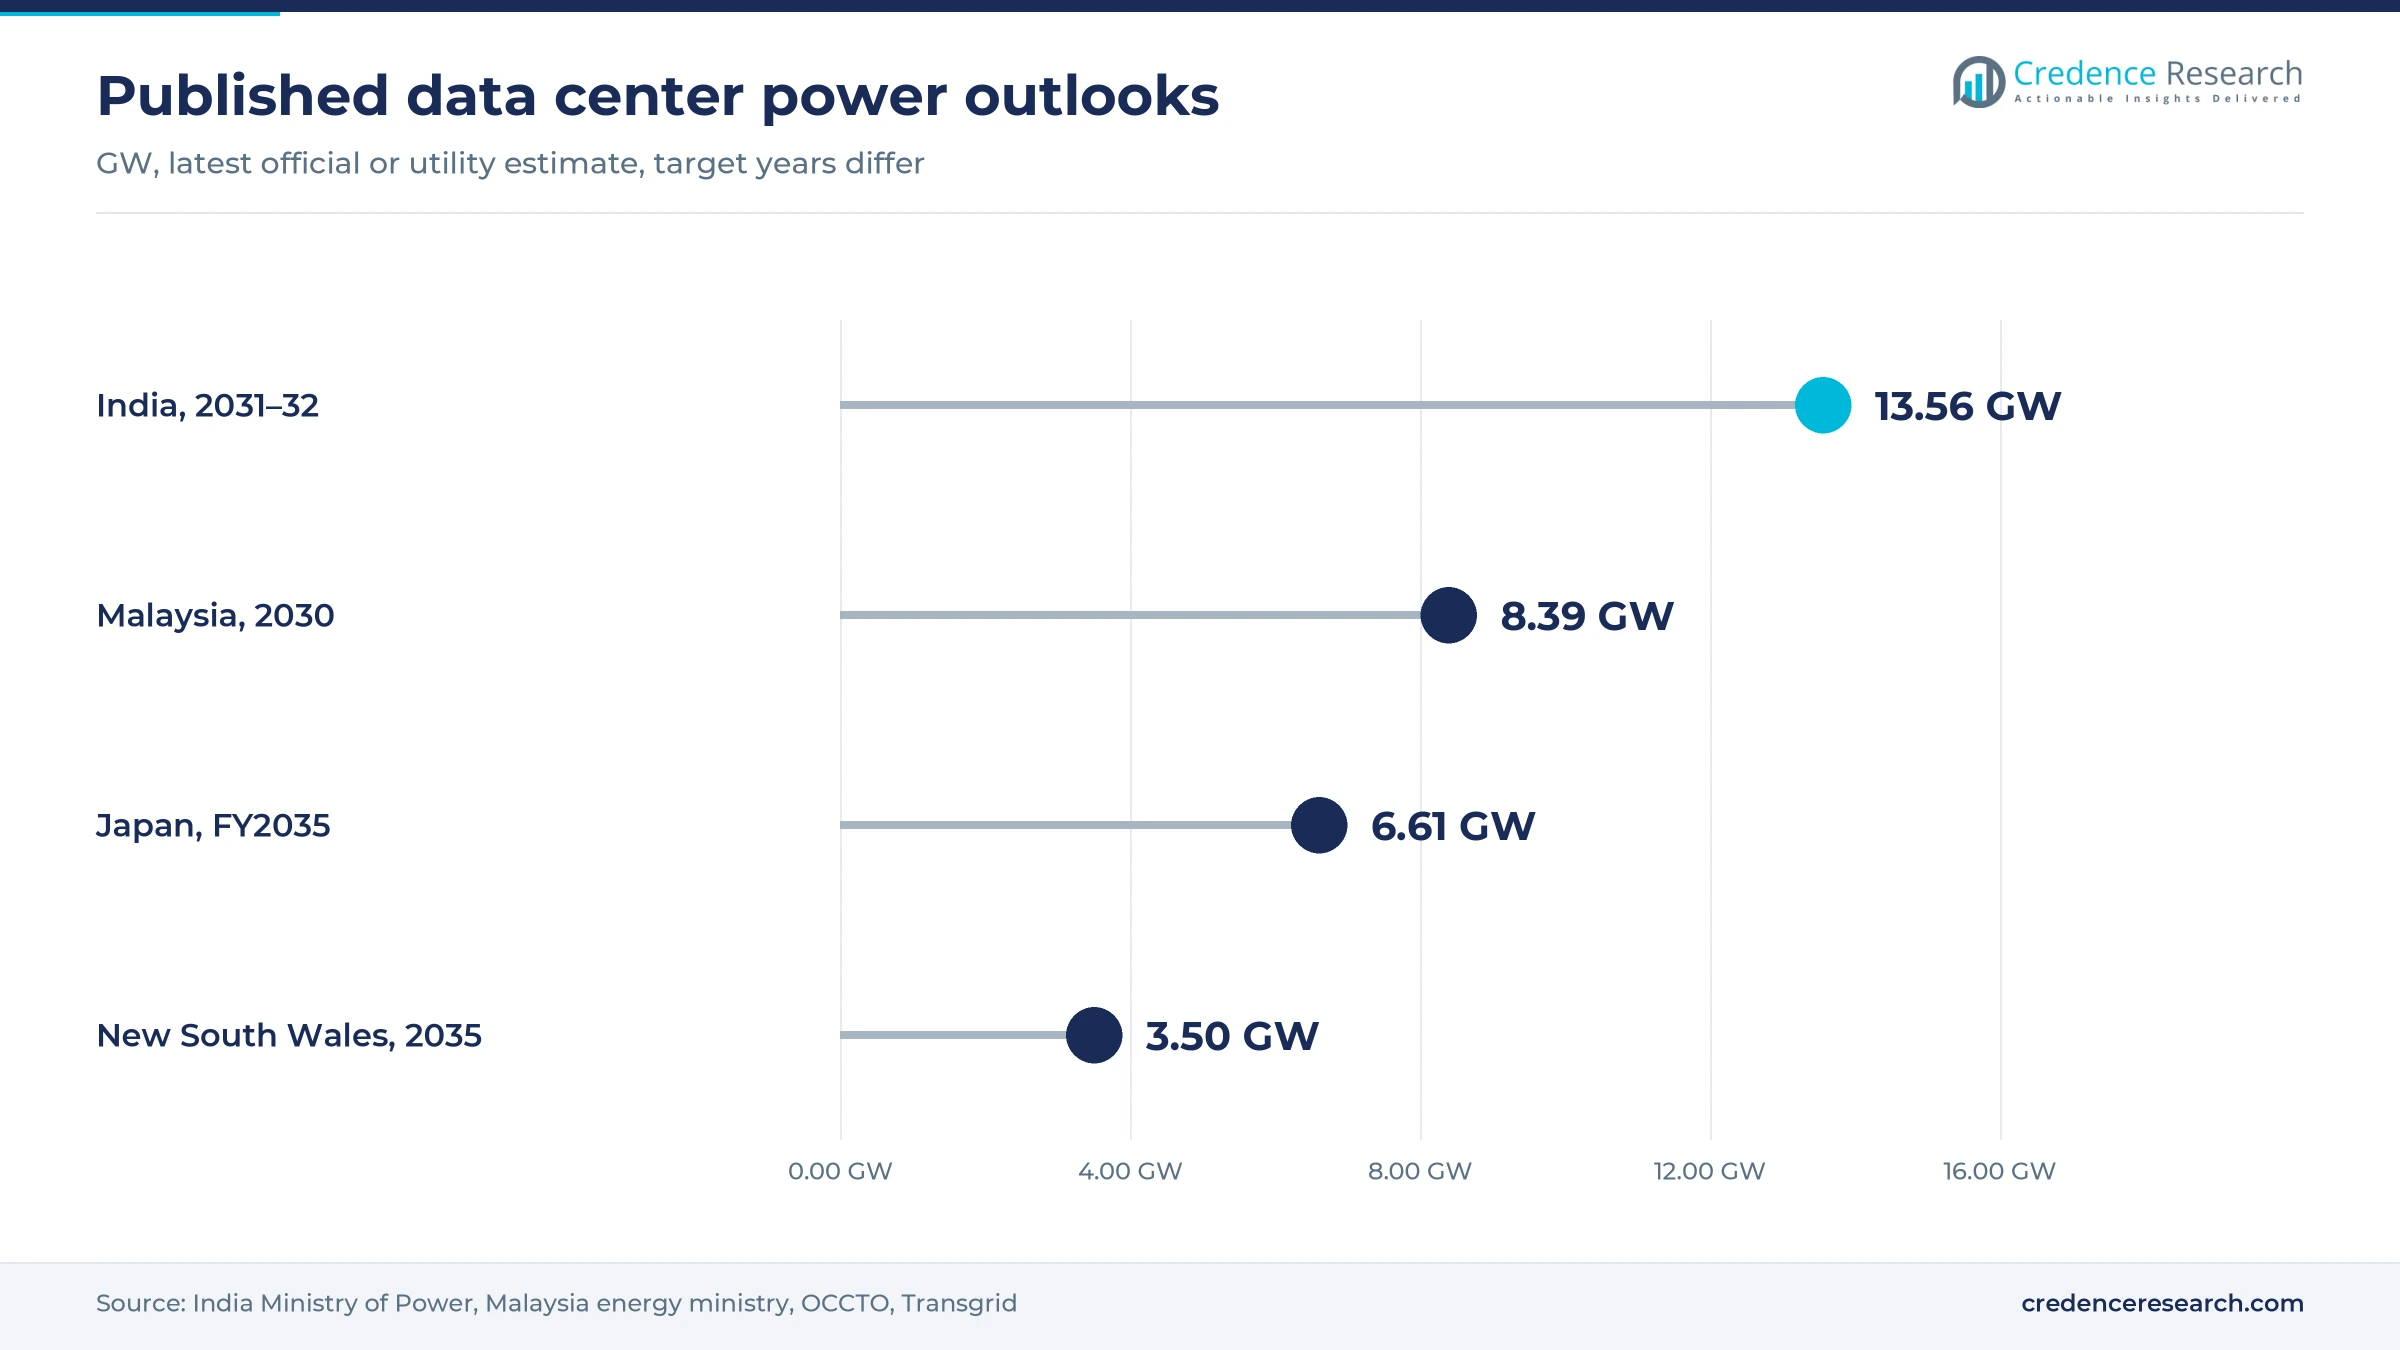
Signed connections across the region are now converting into firm substation work, and that conversion sets near-term equipment orders. Malaysia's energy ministry said in a July 6, 2026, parliamentary answer that 36 operating data centers have about 4.5 GW of planned supply, while 23 more are under construction at 3.8 GW. In Australia, AEMO counted 11 large projects totaling 5.4 GW in the transmission connection process at the end of March 2026. Japan's OCCTO forecasts data center demand rising from 0.64 GW in fiscal 2026 to 6.61 GW in fiscal 2035. Together, these official counts support the 12.28% regional growth rate during 2026–2035.
Efficiency-led infrastructure renewal reopens older sites
Efficiency rules are forcing owners to rework electrical infrastructure, because cleaner and denser sites need different supply arrangements. China's target requires new data centers in its main computing hubs to use at least 80% green power, The Star reported in August 2026. At Zhongwei in Ningxia, China Datang began direct green supply in February 2026 through four dedicated 110 kV lines, according to The Next Web. China had also set a 1.25 power usage effectiveness goal for large data centers by 2025, according to Eco-Business. In Singapore, BW Engineering records a colocation upgrade that replaced 22 kV supply with 66 kV and a new substation. This renewal work explains why modernization and lifecycle support grows at 13.37% a year.
Utility capital plans widen the room for dedicated supply
Utility investment plans decide how quickly dedicated substations can connect, and those plans have grown across the largest markets. According to the International Energy Agency policy record, State Grid plans up to 4 trillion yuan of fixed assets during 2026 to 2030, a 40% rise on the previous plan. China Daily reported in February 2026 that China Southern Power Grid budgeted 180 billion yuan for 2026 alone. In Japan, eight major utilities including TEPCO plan to build or expand substations at 30 locations, adding about 15 GW by the early 2030s. Because these programs concentrate in the largest economies, East Asia keeps the largest budget in the Credence Research regional model.
Higher-voltage bulk supply and process bus reshape designs
Why is higher-voltage bulk supply emerging as the Johor norm?
A shift toward 275 kV bulk supply is visible in Johor, where campus loads have outgrown lower-voltage connections. Malaysian contractor Jati Tinggi won an RM79.86 million job in March 2026 for 275 kV bulk supply at a Pasir Gudang data center, The Star reported. Two further July 2026 contracts worth RM22.6 million cover 275 kV cable circuits from PMU Nusa Cemerlang and a bulk connection fed through a 132 kV interim supply. The Malaysian Investment Development Authority also recorded a March 2024 Bridge Data Centres supply agreement with Tenaga Nasional. Interim feeds therefore let campuses open before the final connection, which adds staged work to each package.
How is the rise of process bus changing protection design?
The rise of process bus technology is moving protection and control from copper wiring to fiber, which changes both cost and commissioning. Adani Electricity reported in May 2025 that its 220 kV Bandra Kurla Complex substation in Mumbai cut copper cabling by 92% and reduced control room space. T&D World described how POWERGRID retrofitted its 400/220 kV Malerkotla substation with IEC 61850 process bus, allowing protection schemes to be tested online without a shutdown. In September 2025, Odisha Power Transmission commissioned a 132/33 kV digital substation at Agalpur, showing the design is moving to lower voltages. As operators adopt these designs, digital substations expand at 14.11% a year.
What opening does local transformer capacity create?
Long delivery times create an opening for suppliers that add regional factories for high-voltage power transformers, since buyers will pay for dependable slots. Hitachi Energy India announced about INR 2,000 crore on June 12, 2026, for a large power transformer factory at Karjan in Gujarat, due in fiscal 2028 and naming AI data centers among its uses. Siemens Energy India approved about INR 2,060 crore in February 2026 for 30,000 MVA of added capacity. GE Vernova T&D India committed INR 8 billion in November 2025 to lift transformer capacity by more than half. Contractors that reserve this output early should gain schedule advantages.
Where do low-carbon computing parks open new work?
Low-carbon computing parks offer an opening for suppliers because they bundle new load, new land and clean supply at one location. Singapore's Economic Development Board and JTC set aside about 20 hectares on Jurong Island on Oct. 27, 2025, for a park of up to 700 MW, according to law firm Reed Smith. The board then provisionally allocated 200 MW of colocation capacity there on Aug. 21, 2026. Japan plans JPY 210 billion of operator support over five years, with subsidies of up to 50% for decarbonized projects outside Tokyo and Osaka. At Zhongwei, the first phase pairs 2 GW of renewables with a computing base. Such parks therefore favor substation designs that are planned for phased additions.
Lead times and queue discipline test project schedules
How do equipment lead times delay energization?
Equipment delivery remains the most direct schedule risk for new campuses. DigitalToday reported in July 2026 that transformer orders taking 6 to 12 months before 2020 now take 24 to 48 months, while large units above 100 MVA can exceed 36 months. Prices have also risen 50 to 80% from pre-2020 levels, according to the same report. Developers face budget overruns and late openings as a result, so many now reserve factory slots before final site approval.
Why does speculative capacity complicate substation planning?
Speculative requests make it hard for utilities to size new substations correctly. TEPCO confirmed that about 30% of the capacity requested in Inzai would not be used as of early 2025, while W.Media reports AEMO's finding that about 36% of projects on its 2025 list have since been cancelled. Utilities risk stranded assets or overbuilt nodes when such requests persist. In response, Transgrid plans market-led allocation under readiness criteria, and Malaysia has raised its Connected Load Charge for oversized applications.
Who pays for connection costs as loads grow?
Cost allocation is becoming a harder negotiation, because governments do not want household bills to fund computing loads. Malaysia's Deputy Prime Minister said in October 2026 that data centers should bear the extra costs they create, and the ultra-high-voltage tariff has applied since July 1, 2025. Transgrid also says new Sydney developments will need to fund network upgrades. Operators therefore carry higher upfront connection spending, which favors well-financed campuses and encourages shared funding arrangements.
What do tighter approval and grid rules add to projects?
Tighter screening adds time and engineering scope before any equipment is ordered. Baker McKenzie reported on July 30, 2026, that Thailand now requires new sub-committee approval for data center applicants and promoted projects raising IT load by more than 30%, without published timelines yet. In Australia, the AEMC issued draft access standards in March 2026 after a July 2024 Virginia fault disconnected about 1,500 MW of data center load. Developers must therefore model fault behavior and plan for approvals much earlier.
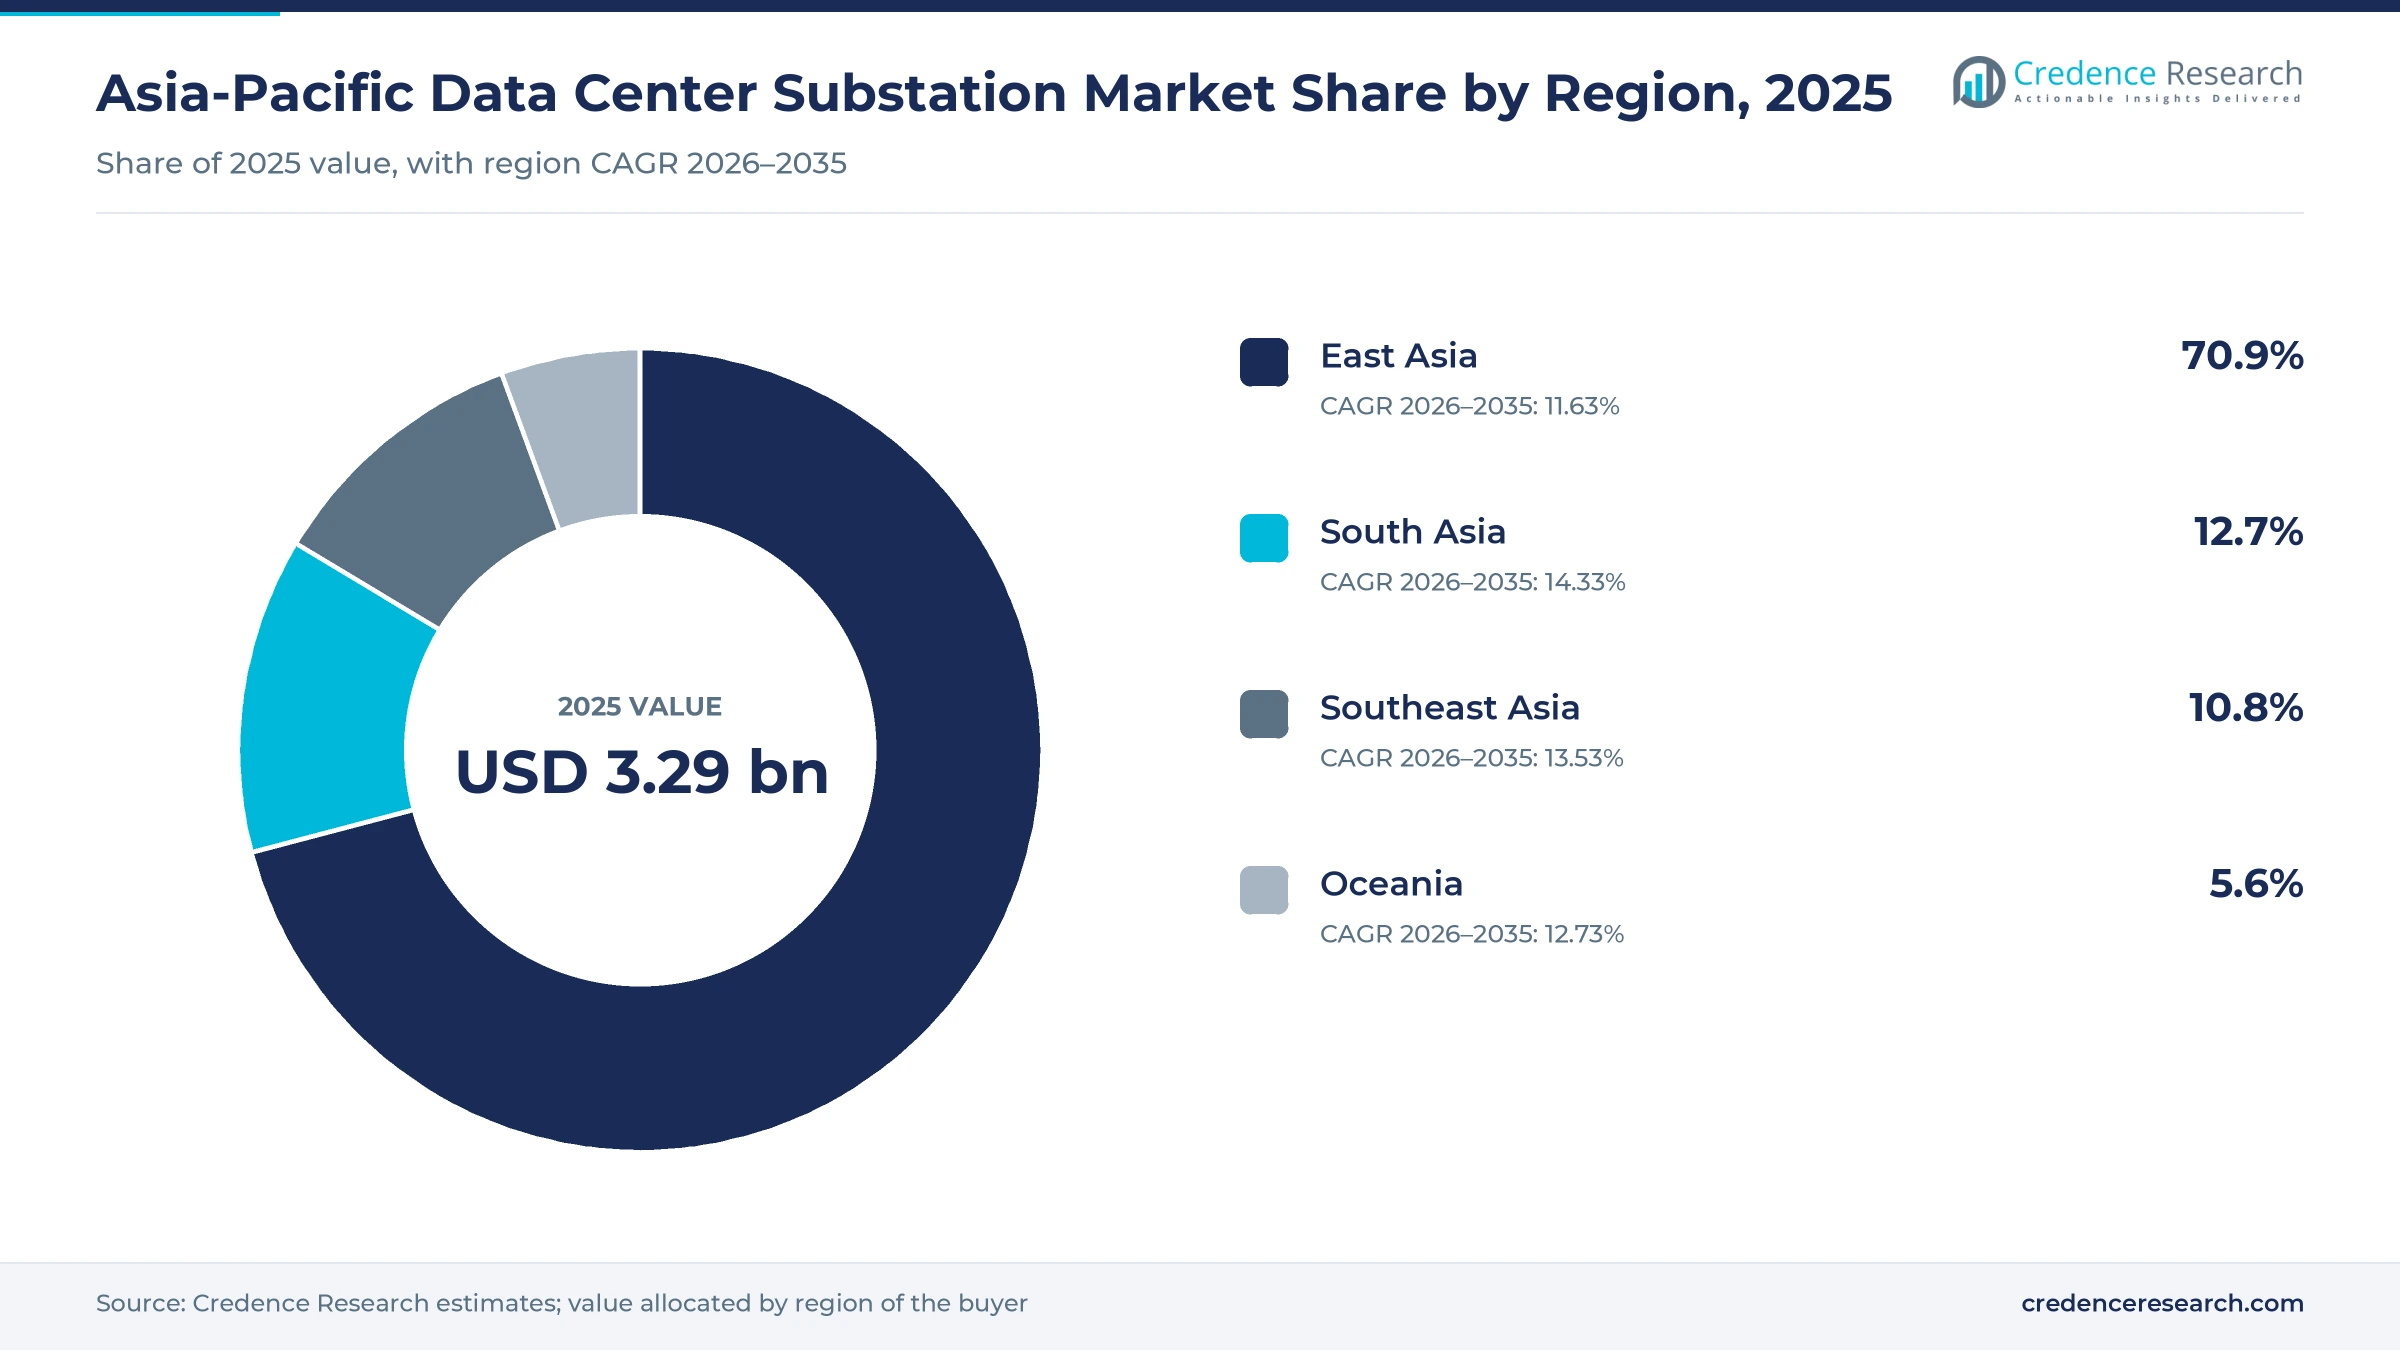
East Asia dominates while South Asia gains fastest
| Region | Value, 2025 (USD billion) | Share, 2025 | CAGR, 2026–2035 |
|---|---|---|---|
| East Asia | 2.34 | 70.9% | 11.63% |
| South Asia | 0.42 | 12.7% | 14.33% |
| Southeast Asia | 0.36 | 10.8% | 13.53% |
| Oceania | 0.18 | 5.6% | 12.73% |
East Asia holds the largest budget through China and Japan
East Asia held 70.9% of 2025 value and grows at 11.63% a year. CAICT figures show China's data center electricity use rising from 82.4 TWh in 2019 to 166 TWh in 2024, while State Grid's plan for 2026 to 2030 raises fixed-asset spending by 40%. In Japan, TEPCO highlighted its shortened Chiba Inzai Substation schedule in May 2025 and published a map of areas with quick supply. The IEA expects Japan and Korea to keep about 5% of global data center demand through 2030.
South Asia grows fastest on Indian campus approvals
South Asia held 12.7% of 2025 value and is the fastest-growing subregion at 14.33% a year. India's electronics ministry said in March 2026 that capacity had reached almost 1.5 GW in 2025, up from about 375 MW in 2020, and the power ministry estimates demand of 13.56 GW by 2031–32. Maharashtra approved the 400/220 kV Ambernath substation in June 2026, while Google began its Visakhapatnam campus in April 2026. Local transformer factories planned by global makers should shorten supply over time.
Southeast Asia converts Johor and Thai approvals into work
Southeast Asia held 10.8% of 2025 value and grows at 13.53% a year. Malaysia's energy ministry expects data centers to reach up to 31% of electricity demand by 2035, compared with 7% in 2026, and approved supply capacity reached 12.3 GW in August 2026. Thailand approved Skyline's 200 MW and Bridge Data Centres' 134 MW sites in May 2026. Singapore adds 200 MW on Jurong Island, so its demand centers on compact, high-specification designs rather than large open sites.
Oceania faces a Sydney capacity limit and regional upgrades
Oceania held 5.6% of 2025 value and grows at 12.73% a year. Transgrid reported more than 20 GW of enquiries in New South Wales in September 2026, with about 1.5 GW signed in Greater Sydney and none connected yet. Its proposed South Creek substation could unlock up to 2 GW of transmission capacity. AEMO's 2026 outlook puts national market data center use near 34 TWh by 2035–36, compared with about 5 TWh now, according to W.Media.
Dated approvals and factory moves since 2025
| Development | Status and market relevance |
|---|---|
| In August 2026, Singapore provisionally allocated 200 MW on Jurong Island to Digital Realty, Equinix, Keppel Data Centres and ST Telemedia Global Data Centres. | Provisional award, 50 MW each |
| In July 2026, Eaton appointed Kose Engineering in Okayama as an authorized xEnergy panel builder for Japan. | Local low-voltage switchgear assembly, three-year expansion aim |
| In June 2026, Hitachi Energy India announced a large power transformer factory at Karjan in Gujarat for about INR 2,000 crore. | Completion scheduled for fiscal 2028 |
| In June 2026, the Maharashtra regulator approved a 400/220 kV gas-insulated Ambernath substation for a data center load. | To be built by 2027 |
| In February 2026, Siemens Energy India approved about INR 2,060 crore for a new power transformer factory adding about 30,000 MVA. | Operations expected between 2030 and 2032 |
Process bus, compact switchgear and DC distribution
- Process bus replaces copper signal wiring with fiber links, and POWERGRID used it at Malerkotla to test protection online without a shutdown.
- Gas-insulated switchgear saves about 35% of the space of air-insulated designs, according to Power Line magazine, which helps dense urban campuses.
- Vertical gas-insulated layouts stack equipment on several floors, and Sterlite Power achieved 75% land savings at its Gurgaon-Palwal project in India.
- DC distribution is under test at the Singapore testbed of ST Telemedia Global Data Centres, where partners evaluate savings of up to 30% in energy.
Need a Custom Version of This Report?
Tailor the scope, geography, or segments to your exact requirements.
- Custom geography or segment scope
- Direct access to our analyst team
Local factories separate the leading equipment makers
Competition centers on factory slots, local assembly and proven high-voltage references rather than on list prices alone. Hitachi Energy, Siemens Energy and GE Vernova are adding Indian capacity for transformers and switchgear, which positions them for South Asian campus orders. Mitsubishi Electric is improving switchgear productivity at its Japanese Transmission and Distribution Systems Center, and it links that program to data center expansion. Eaton has taken a licensing route in Japan through Kose Engineering, while Schneider Electric manufactures transformers and switchgear in India through Schneider Electric Infrastructure. Hyosung Heavy Industries is developing solid-state transformers, including a 22.9 kV unit, according to Asia Economy. ABB supplied an early IEC 61850 digital substation to Technopark in Kerala. Local contractors such as Jati Tinggi handle installation and connection scope, so international makers usually pair equipment supply with regional engineering partners.
Companies profiled and their roles in this market
| Company | Type | Role in the market |
|---|---|---|
| Hitachi Energy | Transformer and grid maker | Building a large power transformer factory at Karjan, Gujarat, that names AI data centers among its uses |
| Siemens Energy | Transformer maker | Indian unit approved about 30,000 MVA of added power transformer capacity in February 2026 |
| GE Vernova | Transformer and switchgear maker | Indian unit expanding transformer, reactor and switchgear output at Vadodara, Hosur and Padappai |
| Schneider Electric | Power equipment maker | Makes transformers and switchgear in India and sells data center systems locally |
| Eaton | Low-voltage switchgear supplier | Licensed Kose Engineering to assemble xEnergy switchgear in Japan from July 2026 |
| Mitsubishi Electric | Switchgear maker | Improving switchgear productivity at its Japanese Transmission and Distribution Systems Center |
| Hyosung Heavy Industries | Transformer maker | Developed a 22.9 kV, 1.05 MVA solid-state transformer in Korea through a national project |
| ABB | Digital substation supplier | Supplied a 110 kV IEC 61850 digital substation for Technopark in Kerala |
Secured grid capacity is the scarce asset to 2035
Credence Research's view is that secured grid capacity, not land or capital, now decides which Asia-Pacific campuses open on time. Sydney shows the pattern, with about 1.5 GW signed and none connected, while Johor shows the workaround, with 132 kV interim feeds preceding 275 kV bulk supply. Buyers should therefore treat substation design as a phased program and reserve transformer slots before final approvals. Suppliers with local factories in India and local assembly in Japan appear best placed, because schedule certainty is worth more to these buyers than a modest price advantage.
How Credence Research built these estimates
The report uses 2025 as the base year and 2035 as the forecast year. Market values come from the Credence Research model, and segment and subregional splits are Credence Research estimates informed by public project and grid data. Sources used include energy regulators, ministries, transmission operators, company press releases, law firm notes and trade or general press reports opened during research. No interviews or surveys were conducted for this edition of the report.
South Asia and renewal work lift the 2035 outlook
The market is expected to reach USD 10.51 billion by 2035, with growth shifting gradually from Chinese volume toward South Asian campuses and renewal work on older sites. Malaysia's 33.5 GW peak demand projection for 2035 shows how large the connection task remains. Data center substation buyers should also benefit as factories now planned in Gujarat ease transformer supply near the end of this decade. However, stricter screening in Thailand and cost-causation rules in Malaysia suggest that approvals will favor projects that can prove real load and fund their own connections.
Frequently Asked Questions
How big is the Asia-Pacific data center substation market?
Which subregion leads the market?
Which subregion grows fastest?
Which asset type holds the largest share?
Which customers spend the most on substations?
Why are digital substations gaining ground?
What is the main challenge for buyers?
Which companies are active in the market?
Table of Content
Chapter 1 Market Segmentation
- 1.1 Segmentation Framework
- 1.1.1 Product and Service Classification
- 1.1.2 Application and End-Use Classification
- 1.1.3 Technology and Solution Classification
- 1.1.4 Customer and Distribution Channel Classification
- 1.1.5 Geographic Segmentation
- 1.1.6 Market Segment Definitions and Boundaries
- 1.2 By Project Type
- 1.2.1 Greenfield Substations
- 1.2.2 Capacity Expansion
- 1.2.3 Modernization and Lifecycle Support
- 1.3 By Asset Type
- 1.3.1 Power Transformers
- 1.3.2 Switchgear
- 1.3.3 Protection and Ancillary Systems
- 1.4 By Customer Type
- 1.4.1 Hyperscale Customers
- 1.4.2 Colocation Operators
- 1.4.3 Enterprise Operators
- 1.4.4 Edge and Carrier Operators
- 1.5 By Technology
- 1.5.1 Conventional Substations
- 1.5.2 Digital Substations
- 1.5.3 Hybrid Substations
Chapter 2 Introduction
- 2.1 Report Objectives and Scope
- 2.2 Product Definition and Industry Terminology
- 2.3 Market Inclusions and Exclusions
- 2.4 Research Process
- 2.4.1 Primary Research and Expert Interviews
- 2.4.2 Secondary Research and Source Review
- 2.4.3 Top-Down and Bottom-Up Estimation
- 2.4.4 Data Triangulation and Verification
- 2.5 Market Size Measurement Basis
- 2.5.1 2025: USD 3.29 billion → 2035: USD 10.51 billion
- 2.6 Historical and Forecast Reference Periods
- 2.6.1 Historical Period: 2018-2025
- 2.6.2 Base Year: 2025
- 2.6.3 Forecast Period: 2025-2035
- 2.7 Research Assumptions and Limitations
Chapter 3 Executive Summary
- 3.1 Market Snapshot and Key Findings
- 3.2 Base-Year Market Size, 2025
- 3.3 Forecast Market Size, 2035
- 3.4 Revenue and Volume Growth Outlook
- 3.5 Key Demand and Supply Indicators
- 3.6 Leading Market Segments
- 3.7 Fastest-Growing Market Opportunities
- 3.8 Regional Performance Highlights
- 3.9 Technology and Industry Transformation
- 3.10 Competitive Landscape Summary
- 3.11 Analyst View and Strategic Implications
Chapter 4 Asia-Pacific Data Center Substation Market Trends and Developments
- 4.1 Historical Industry Development, 2018-2025
- 4.2 Recent Market Trends and Developments
- 4.3 Demand and Customer Behavior Trends
- 4.4 Technology and Product Innovation
- 4.5 Artificial Intelligence, Automation and Digitalization
- 4.6 Local Manufacturing and Supply Chain Realignment
- 4.7 Industry Partnerships, Mergers and Acquisitions
- 4.8 Sustainability and Circular Economy Developments
- 4.9 Government and Private Sector Investment Trends
- 4.10 Emerging Business Models and Commercialization
- 4.11 Industry Developments and Announcements
Chapter 5 Asia-Pacific Data Center Substation Market Production, Supply and Demand Analysis
- 5.1 Demand Trend and Consumption Analysis, 2018-2025
- 5.2 Demand Forecast, 2025-2035
- 5.3 Production and Output Trend, 2018-2025
- 5.4 Production and Output Forecast, 2025-2035
- 5.5 Installed Capacity and Capacity Utilization
- 5.6 Company-Wise Production Plants and Statistics
- 5.6.1 Installed Production Capacity
- 5.6.2 Actual Production
- 5.6.3 Planned Capacity and Expansion Targets
- 5.7 Supply Chain Structure and Procurement Trends
- 5.8 Supply-Demand Gap and Bottlenecks
- 5.9 Import Dependence and Sourcing Structure
- 5.10 Contract Manufacturing and Outsourcing
- 5.11 Regional Supply and Demand Concentration
Chapter 6 Asia-Pacific Data Center Substation Market Pricing Analysis
- 6.1 Pricing Structure and Measurement
- 6.2 Historical Pricing Trends, 2018-2025
- 6.3 Pricing Outlook, 2025-2035
- 6.4 Average Selling Price and Unit Economics
- 6.5 Pricing by Product and Market Segment
- 6.6 Geographic Pricing Differences
- 6.7 Key Input, Energy, Labor and Logistics Costs
- 6.8 Contract Pricing and Purchasing Models
- 6.9 Pricing Sensitivity and Competitive Positioning
- 6.10 Price, Margin and Profitability Implications
Chapter 7 Asia-Pacific Data Center Substation Market Dynamics
- 7.1 Market Growth Drivers
- 7.1.1 Demand-Side Drivers
- 7.1.2 Technology and Innovation Drivers
- 7.1.3 Infrastructure and Investment Drivers
- 7.1.4 Regulatory and Policy Drivers
- 7.2 Market Restraints
- 7.2.1 Cost and Affordability Constraints
- 7.2.2 Technology and Adoption Barriers
- 7.2.3 Supply Chain and Operational Constraints
- 7.3 Market Challenges
- 7.3.1 Competitive Pressure and Margin Erosion
- 7.3.2 Skills, Infrastructure and Implementation Gaps
- 7.4 Emerging Market Opportunities
- 7.5 Market Dynamics Impact and Time-Horizon Assessment
Chapter 8 Asia-Pacific Data Center Substation Value Chain Analysis
- 8.1 Industry Value Chain Overview
- 8.2 Upstream Suppliers and Critical Inputs
- 8.3 Technology and Component Providers
- 8.4 Manufacturing or Service Delivery
- 8.5 Distribution, Channel Partners and Integrators
- 8.6 Downstream Applications and End Users
- 8.7 Value Addition and Profit Pools
- 8.8 Vertical Integration and Outsourcing
- 8.9 Supplier Concentration and Risk
- 8.10 Supply Chain Localization and Resilience
Chapter 9 Asia-Pacific Data Center Substation Market Regulations and Policies
- 9.1 Relevant Laws, Standards and Compliance Frameworks
- 9.2 Product, Service, Safety and Quality Requirements
- 9.3 Government Policies, Incentives and Subsidies
- 9.4 Imports, Exports and Trade Barriers
- 9.5 Public Procurement and Local Content Requirements
- 9.6 Environmental and Sustainability Compliance
- 9.7 Data Protection, AI and Cybersecurity Compliance
- 9.8 Upcoming Policy Changes and Market Implications
Chapter 10 Asia-Pacific Data Center Substation Market Hotspots and Opportunities
- 10.1 Market Opportunity Mapping and Growth Hotspots
- 10.2 High-Growth Applications and Customer Groups
- 10.3 Underserved Markets and White-Space Opportunities
- 10.4 Emerging Technology and Product Opportunities
- 10.5 New Capacity and Investment Hotspots
- 10.6 Market Entry and Expansion Opportunities
- 10.7 Distribution and Partnership Opportunities
- 10.8 Near-Term and Long-Term Commercial Potential
- 10.9 Opportunity Attractiveness and Execution Risks
Chapter 11 Asia-Pacific Data Center Substation Market Outlook, 2025-2035
- 11.1 Market Size and Analysis
- 11.1.1 Revenue (Market Measurement: 2025: USD 3.29 billion → 2035: USD 10.51 billion)
- 11.1.2 Market Volume and Quantity Sold
- 11.1.3 Historical Market Size, 2018-2025
- 11.1.4 Base-Year Market Size, 2025
- 11.2 Market Forecast, 2025-2035
- 11.2.1 Revenue Forecast to 2035
- 11.2.2 Volume Forecast to 2035
- 11.2.3 CAGR and Year-on-Year Growth
- 11.2.4 Incremental Revenue Opportunity
- 11.3 Forecast Assumptions and Scenario Analysis
- 11.3.1 Base-Case Forecast
- 11.3.2 Optimistic and Conservative Scenarios
- 11.3.3 Technology, Pricing and Policy Sensitivities
- 11.4 Market Attractiveness and Growth Outlook
Chapter 12 Asia-Pacific Data Center Substation Market Segmentation and Outlook
- 12.1 Segmentation Summary and Market Shares, 2025
- 12.2 Largest and Fastest-Growing Segments
- 12.3 By Project Type - Market Size and Forecast, 2025-2035
- 12.3.1 Segment Definition and Scope
- 12.3.2 Historical Market Size, 2018-2025
- 12.3.3 Revenue Forecast, 2025-2035
- 12.3.4 Volume Forecast, 2025-2035
- 12.3.5 Base-Year Market Share, 2025
- 12.3.6 Segment CAGR and Growth Drivers
- 12.3.7 Subsegment Market Size and Forecast
- 12.3.7.1 Greenfield Substations
- 12.3.7.2 Capacity Expansion
- 12.3.7.3 Modernization and Lifecycle Support
- 12.3.8 Subsegment Pricing and Adoption Trends
- 12.3.9 Leading Suppliers and Competition
- 12.3.10 Regional Demand and Opportunities
- 12.4 By Asset Type - Market Size and Forecast, 2025-2035
- 12.4.1 Segment Definition and Scope
- 12.4.2 Historical Market Size, 2018-2025
- 12.4.3 Revenue Forecast, 2025-2035
- 12.4.4 Volume Forecast, 2025-2035
- 12.4.5 Base-Year Market Share, 2025
- 12.4.6 Segment CAGR and Growth Drivers
- 12.4.7 Subsegment Market Size and Forecast
- 12.4.7.1 Power Transformers
- 12.4.7.2 Switchgear
- 12.4.7.3 Protection and Ancillary Systems
- 12.4.8 Subsegment Pricing and Adoption Trends
- 12.4.9 Leading Suppliers and Competition
- 12.4.10 Regional Demand and Opportunities
- 12.5 By Customer Type - Market Size and Forecast, 2025-2035
- 12.5.1 Segment Definition and Scope
- 12.5.2 Historical Market Size, 2018-2025
- 12.5.3 Revenue Forecast, 2025-2035
- 12.5.4 Volume Forecast, 2025-2035
- 12.5.5 Base-Year Market Share, 2025
- 12.5.6 Segment CAGR and Growth Drivers
- 12.5.7 Subsegment Market Size and Forecast
- 12.5.7.1 Hyperscale Customers
- 12.5.7.2 Colocation Operators
- 12.5.7.3 Enterprise Operators
- 12.5.7.4 Edge and Carrier Operators
- 12.5.8 Subsegment Pricing and Adoption Trends
- 12.5.9 Leading Suppliers and Competition
- 12.5.10 Regional Demand and Opportunities
- 12.6 By Technology - Market Size and Forecast, 2025-2035
- 12.6.1 Segment Definition and Scope
- 12.6.2 Historical Market Size, 2018-2025
- 12.6.3 Revenue Forecast, 2025-2035
- 12.6.4 Volume Forecast, 2025-2035
- 12.6.5 Base-Year Market Share, 2025
- 12.6.6 Segment CAGR and Growth Drivers
- 12.6.7 Subsegment Market Size and Forecast
- 12.6.7.1 Conventional Substations
- 12.6.7.2 Digital Substations
- 12.6.7.3 Hybrid Substations
- 12.6.8 Subsegment Pricing and Adoption Trends
- 12.6.9 Leading Suppliers and Competition
- 12.6.10 Regional Demand and Opportunities
- 12.7 Segment Growth Comparison
- 12.8 Segment Attractiveness and Priority Matrix
Chapter 13 Asia-Pacific Data Center Substation End-Use and Application Market Outlook
- 13.1 End-Use Industry and Customer Demand Structure
- 13.2 Leading Applications and Customer Groups
- 13.3 End-Use Market Size, Share and Forecast
- 13.4 Major End-Use Industry Deep Dives
- 13.4.1 Customer Requirements and Use Cases
- 13.4.2 Demand and Replacement Cycles
- 13.4.3 Technical and Regulatory Considerations
- 13.4.4 Purchasing and Procurement Models
- 13.4.5 Leading Vendors and Distribution Channels
- 13.4.6 Forecast and Commercial Opportunities
- 13.5 Emerging Applications and Cross-Segment Demand
- 13.6 End-Use Industry Investment Priorities
Chapter 14 Asia-Pacific Data Center Substation Geographic Market Outlook, 2025-2035
- 14.1 Regional Market Size and Country-Level Shares, 2025
- 14.2 Country Market Size Comparison, 2025
- 14.3 Country Market Forecasts, 2025-2035
- 14.4 Subregional Industrial and Demand Clusters
- 14.5 Intra-Regional Pricing and Cost Differences
- 14.6 Cross-Border Trade and Supply Networks
- 14.7 Regional Supply and Demand Balances
- 14.8 Country Opportunity Comparison and Prioritization
Note: Every listed country is covered on the structure shown under the first country.
Chapter 15 Asia-Pacific Data Center Substation Technology, Innovation and Sustainability Outlook
- 15.1 Technology Landscape and Maturity
- 15.2 Product, Process and Service Innovation
- 15.3 AI, Automation and Digital Tools in the Industry
- 15.4 Technology Adoption and Performance Benchmarking
- 15.5 Innovation Pipeline and R&D Investment
- 15.6 Patent and Intellectual Property Trends
- 15.7 Energy Efficiency and Resource Management
- 15.8 Sustainability, Recycling and Circularity
- 15.9 Technology Roadmap, 2025-2035
- 15.10 Risks of Obsolescence and Technology Substitution
Chapter 16 Asia-Pacific Data Center Substation Market Key Strategic Imperatives
- 16.1 Growth and Market Entry Priorities
- 16.2 High-Return Products and Segments
- 16.3 Pricing, Profitability and Cost Optimization
- 16.4 Technology Investment and Product Differentiation
- 16.5 Supply Chain Localization and Resilience
- 16.6 Distribution and Customer Acquisition
- 16.7 Partnership, Acquisition and Capacity Strategy
- 16.8 Regional Expansion Priorities
- 16.9 Short-, Medium- and Long-Term Actions
Chapter 17 Competition Outlook
- 17.1 Industry Competition Characteristics
- 17.2 Market Structure and Concentration
- 17.3 Market Share and Competitive Positioning, 2025
- 17.4 Company-Wise Revenue and Product Benchmarking
- 17.5 Production and Service Capacity Benchmarking
- 17.6 Technology, Pricing and Differentiation
- 17.7 Regional Footprint and Distribution Strength
- 17.8 Mergers, Acquisitions and Strategic Alliances
- 17.9 New Entrants and Competitive Threats
- 17.10 Porter's Five Forces and Industry Attractiveness
- 17.11 Competitive Outlook, 2025-2035
Chapter 18 Company Profiles
- 18.1 Company Coverage and Selection Criteria
- 18.2 Schneider Electric
- 18.2.1 Business Description
- 18.2.2 Company Ownership and Geographic Presence
- 18.2.3 Product and Service Portfolio
- 18.2.4 Manufacturing and Operating Footprint
- 18.2.5 Production Capacity and Expansion Plans
- 18.2.6 Financial Performance and Investment
- 18.2.7 Market Share and Competitive Position
- 18.2.8 Technology and Innovation Capabilities
- 18.2.9 Strategic Alliances or Partnerships
- 18.2.10 Recent Developments
- 18.2.11 Growth Strategy and Outlook
- 18.3 Hitachi Energy
- 18.4 Siemens Energy
- 18.5 ABB
- 18.6 GE Vernova
- 18.7 Eaton
- 18.8 Mitsubishi Electric
- 18.9 NR Electric
- 18.10 Hyosung Heavy Industries
- 18.11 TBEA
- 18.12 Other Relevant Market Participants
Note: Every listed company is profiled on the structure shown under the first company. The company list is preliminary and may change based on research findings, market developments, data availability and client requirements.
Chapter 19 Disclaimer
- 19.1 Research and Forecast Disclaimer
- 19.2 Data Source and Estimation Limitations
Note: The depth of individual sections depends on data availability for this market. Volume, capacity, trade and other unit-based metrics are included where applicable.

