
Raised-scar care spreads from burn wards to daily home use
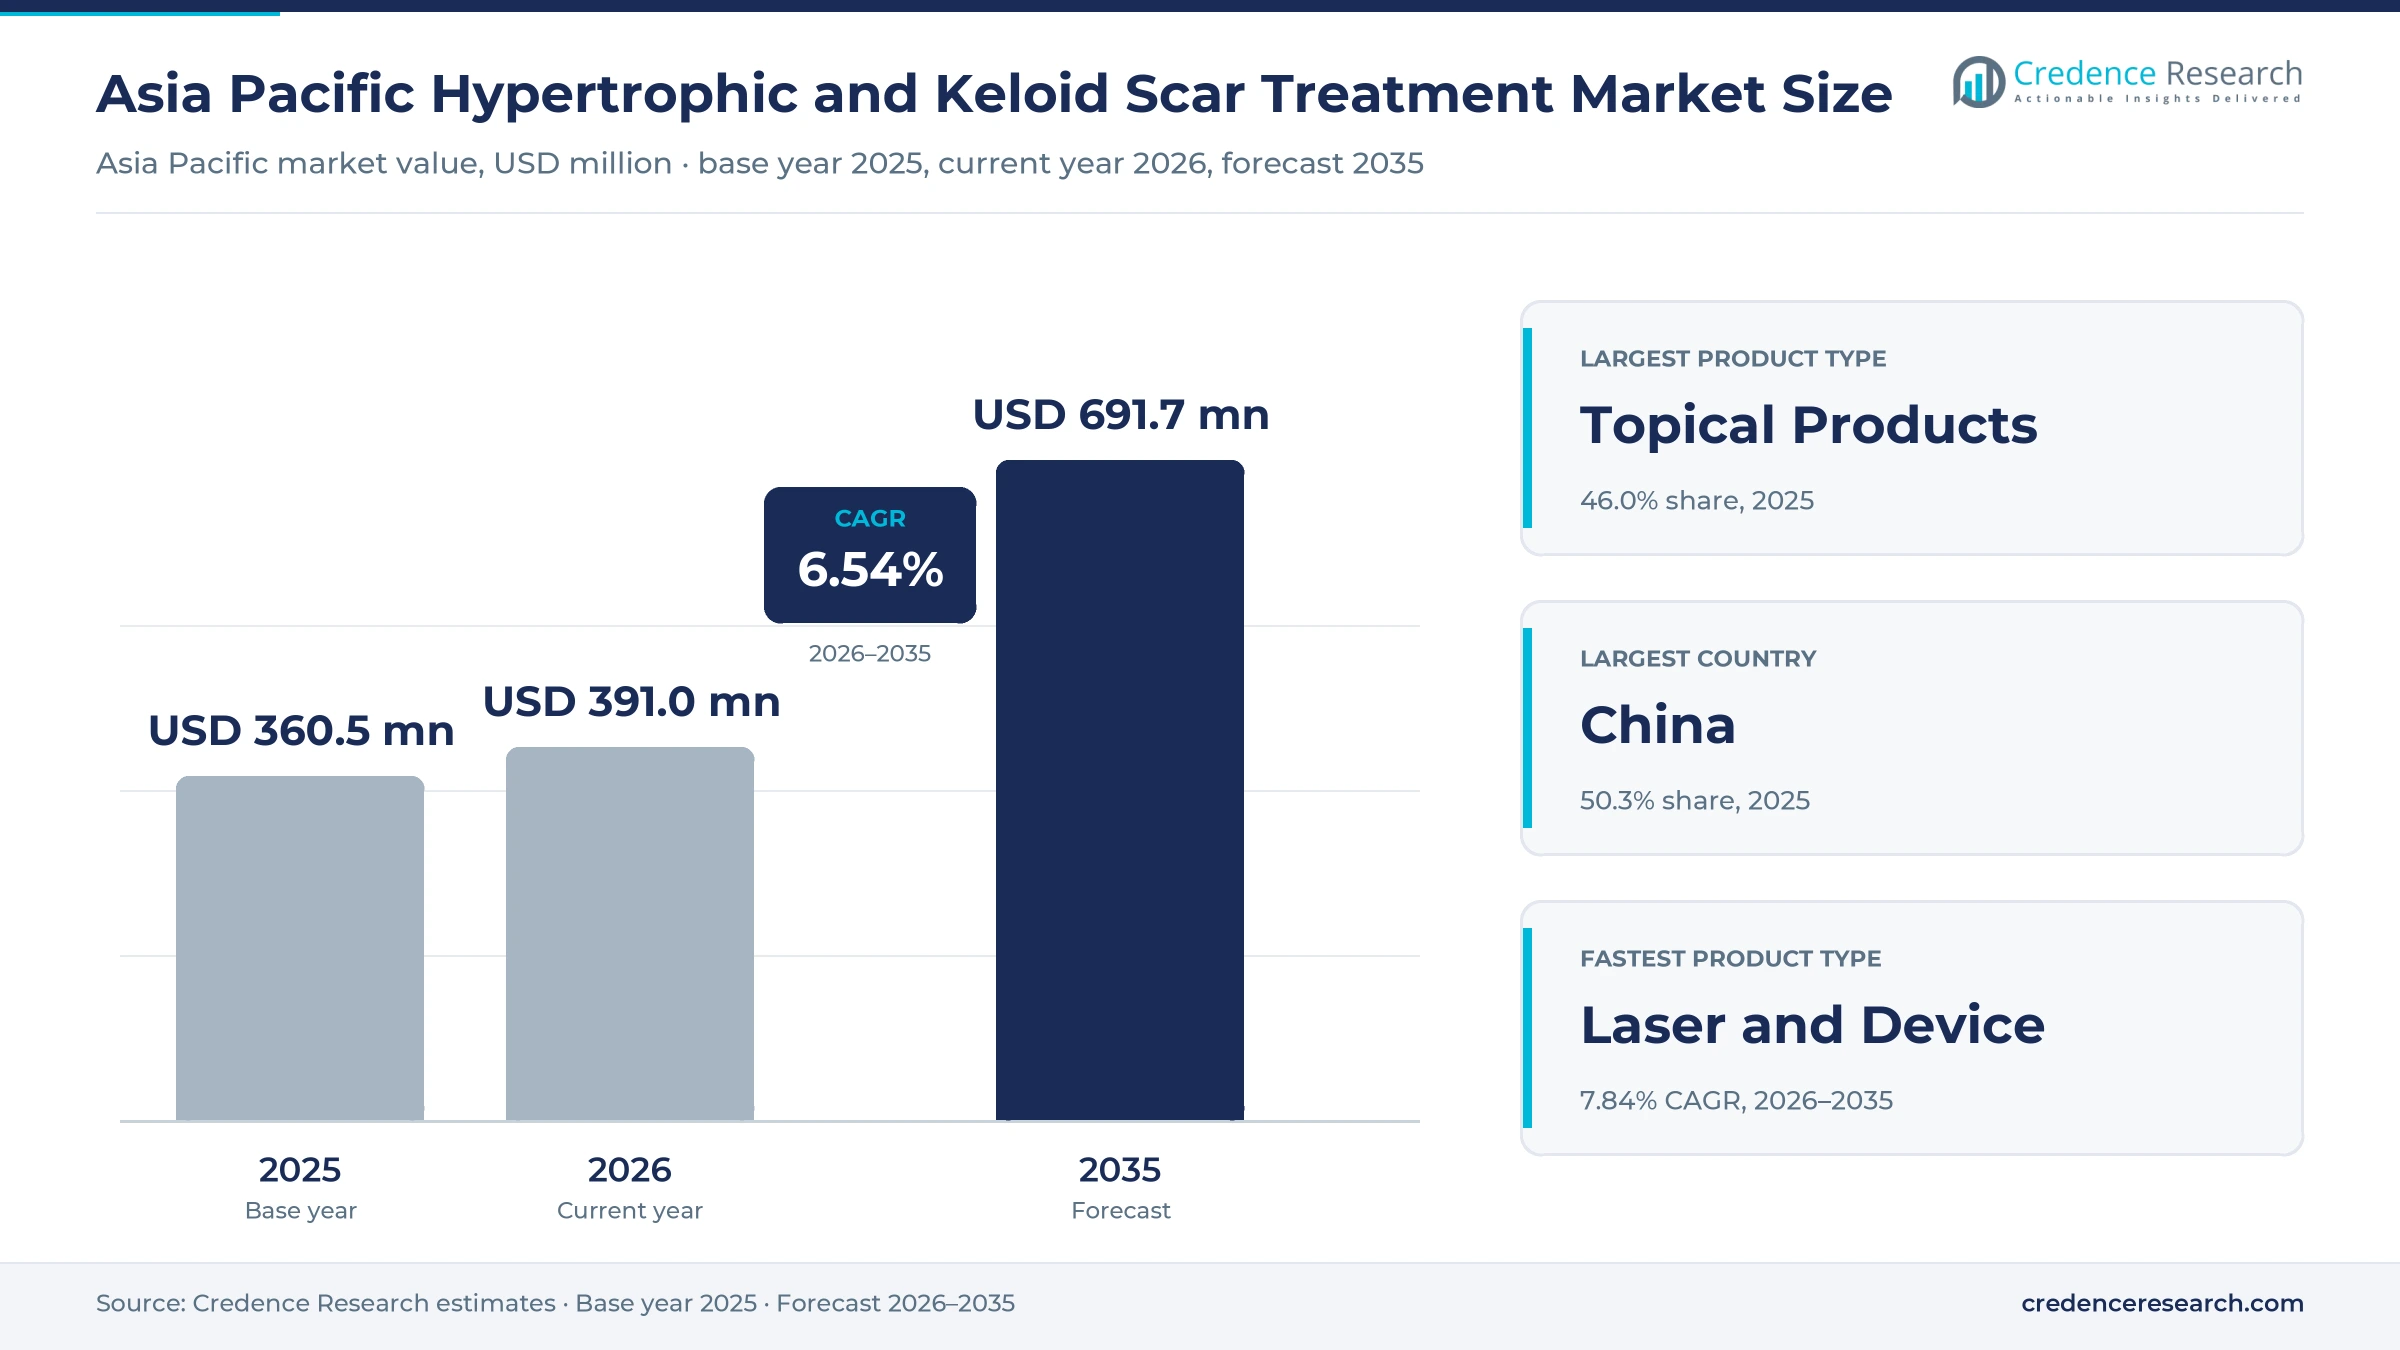
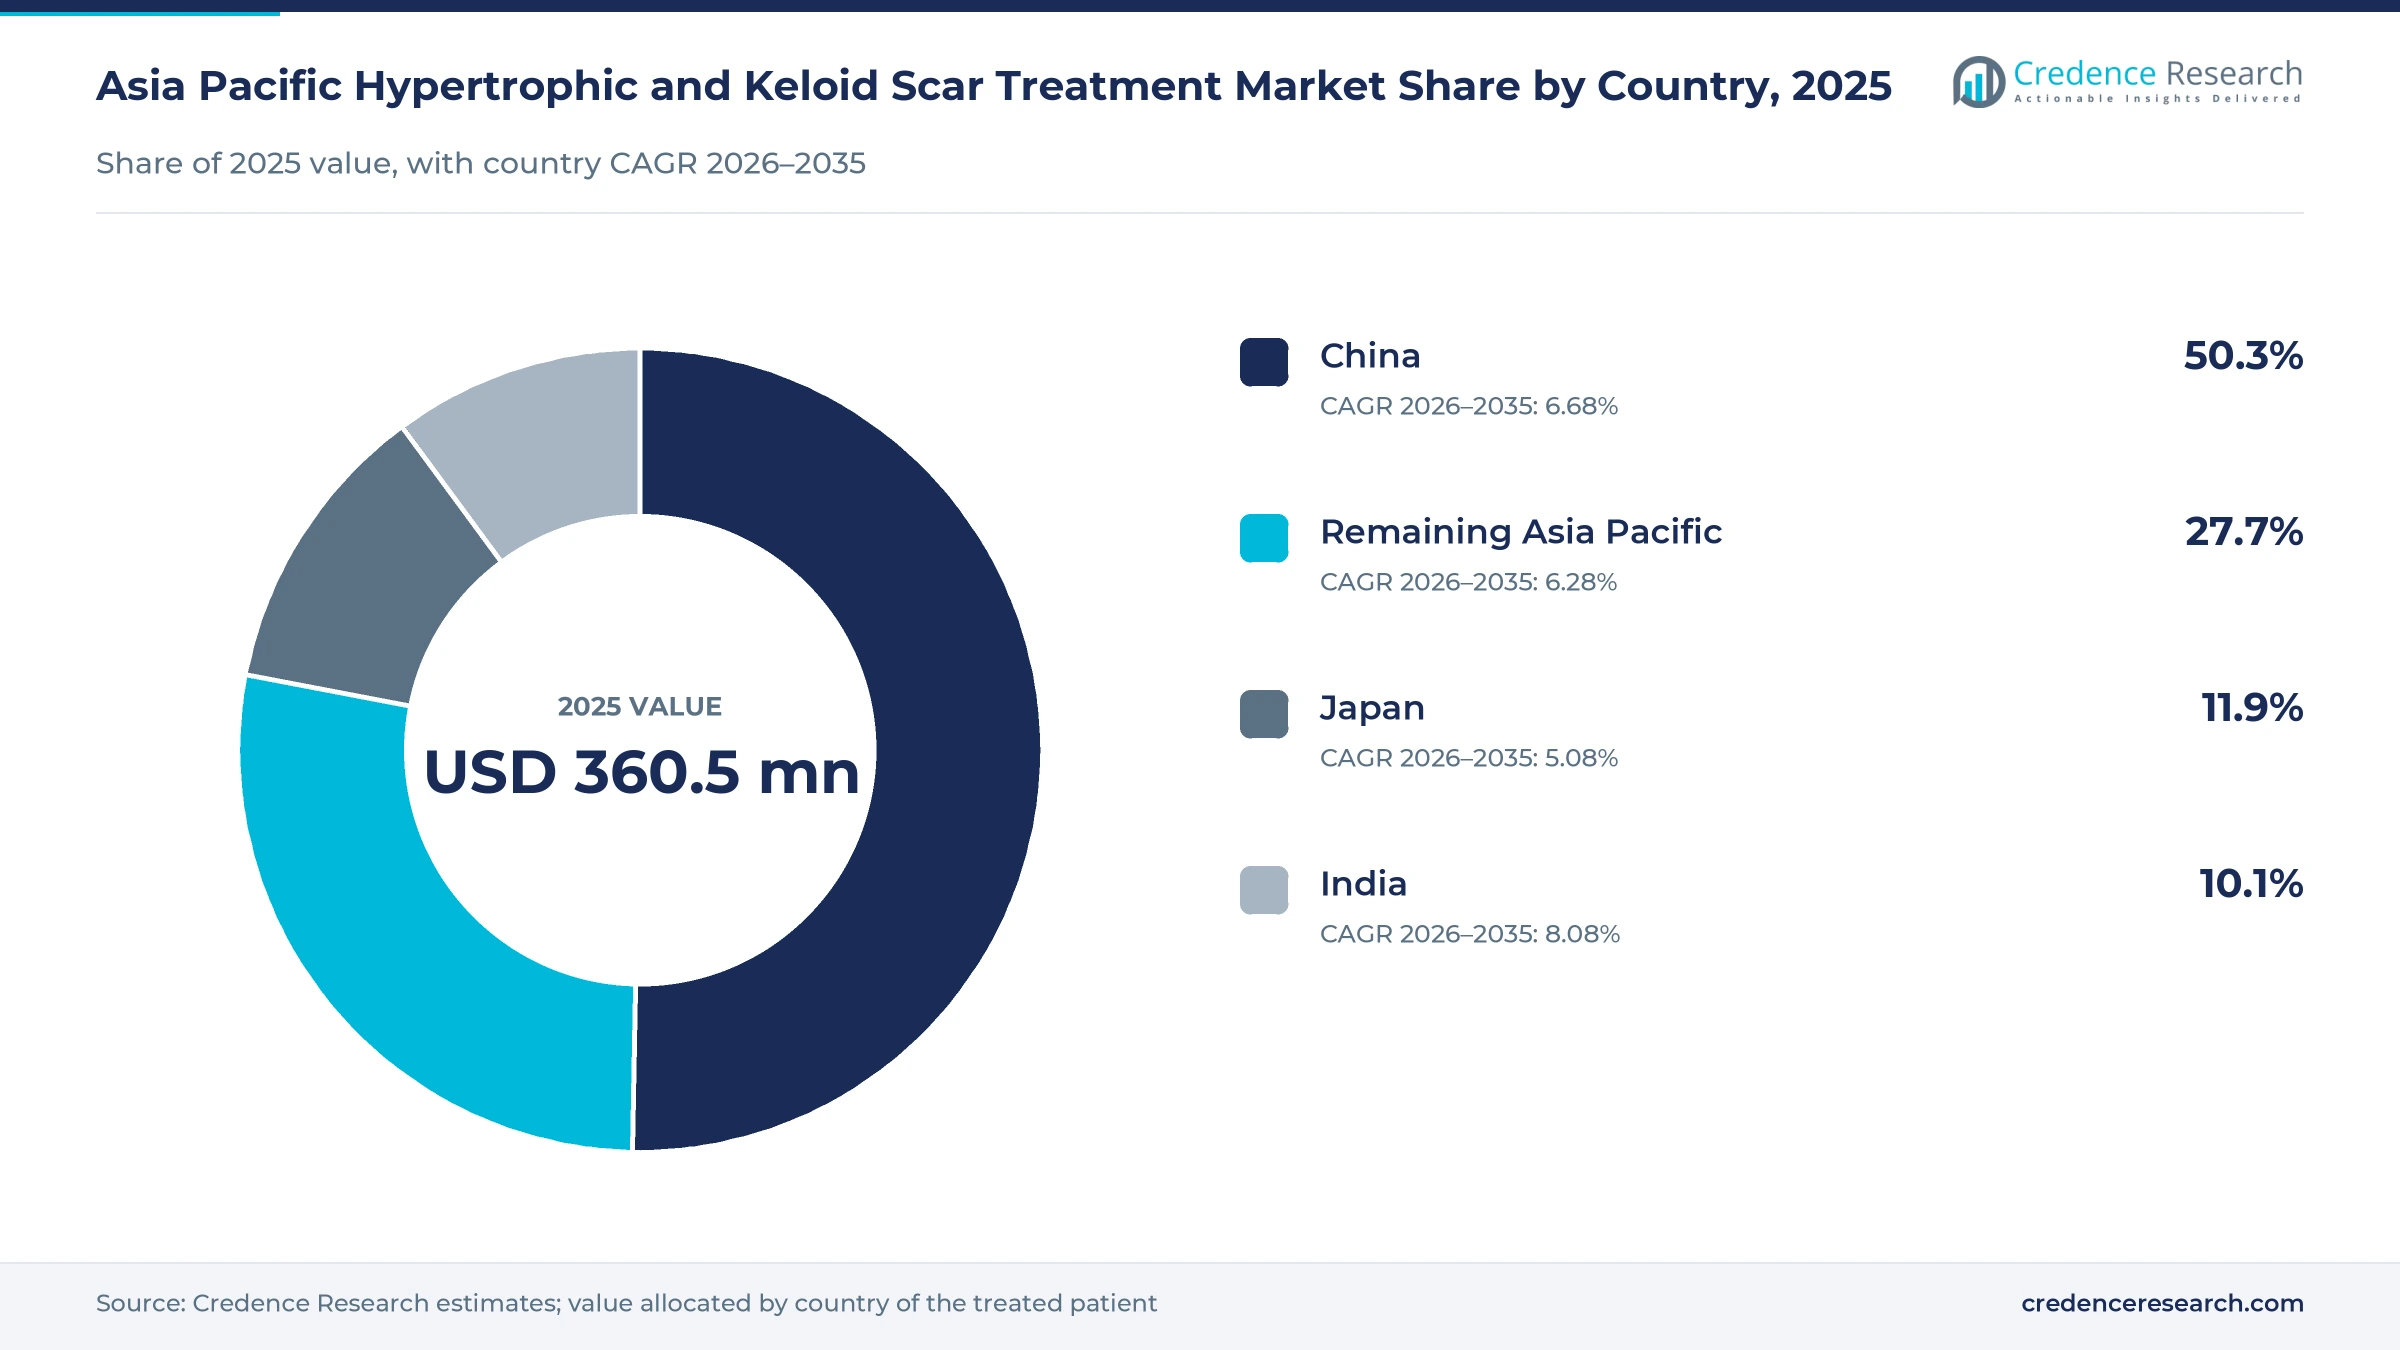
The Asia Pacific hypertrophic and keloid scar treatment market was valued at USD 360.5 million in 2025 and is projected to increase from USD 391.0 million in 2026 to USD 691.7 million by 2035, registering a CAGR of 6.54% during 2026–2035. Demand comes from patients with raised scars after surgery, burns, trauma and acne who need silicone products, steroid tapes or injections, laser sessions or revision surgery. China held the largest country share, 50.3% in 2025, because its burn centers and maternity hospitals treat very large patient volumes. India is the fastest-growing country at 8.08% a year, as government burn units extend specialist referral beyond large cities. Buyers range from hospital procurement offices and dermatology clinics to pharmacies and home users ordering silicone gels online. Mölnlycke Health Care finished building its first Chinese factory in Changshu by July 2026, which moves a major silicone dressing supplier closer to hospital buyers. Clinical practice is also shifting toward combined care, pairing fractional lasers with injections and silicone maintenance.
Which raised-scar therapies and buyers does the estimate cover?
The estimate measures spending on products and procedures used to prevent or treat hypertrophic scars and keloids across Asia Pacific. It covers silicone sheets and gels, onion-extract and steroid topicals, steroid tapes, intralesional injections, laser and energy-based sessions, and surface or surgical revision. Values are measured at the price paid by hospitals, clinics, insurers and households.
The estimate excludes acne pit scars, stretch marks, general wound dressings and purely cosmetic skin resurfacing. The value chain runs from dressing, topical and laser makers through importers, hospital tenders, pharmacy chains and licensed online sellers to burn units, plastic surgery and dermatology departments, private clinics and patients at home in China, Japan, India and the remaining Asia Pacific markets.
Asia Pacific Hypertrophic and Keloid Scar Treatment Market Insights
- The Asia Pacific hypertrophic and keloid scar treatment market was valued at USD 360.5 million in 2025 and is projected to reach USD 691.7 million by 2035, a CAGR of 6.54% during 2026–2035.
- China held a 50.3% share of 2025 value, because burn centers and maternity hospitals there treat very large numbers of patients who later need scar care.
- Topical Products led product demand with a 46.0% share of 2025 value, as Japanese consensus guidance places steroid plasters and tapes at the first treatment step.
- South Korea received about 2.01 million foreign patients in 2025, and 62.9% took dermatology treatment, which keeps laser clinics busy across the region.
- Mölnlycke Health Care began its Changshu wound care site in November 2025 and completed construction by July 2026, its first manufacturing base in China.
Steroid tapes and silicone lead as lasers gain ground
Why do topical products still lead while lasers grow faster?
Based on product type, the market is categorized into Topical Products, Injectables, Laser and Device-Based Treatments, and Surface and Surgical Treatments. Topical Products led with a 46.0% share of 2025 value, because the Japan Scar Workshop consensus of December 2019 starts adults on deprodone propionate plasters and children on fludroxycortide tape. Laser and Device-Based Treatments grows fastest at 7.84% a year, as a 220-patient cohort from Fuzhou, published in Clinical, Cosmetic and Investigational Dermatology in May 2026, linked fractional CO2 laser with better six-month cesarean scar scores than silicone gel. The authors called that finding hypothesis-generating, so hospitals still pair lasers with topicals.
Which scar causes generate the most treatment value?
Based on application, the market is categorized into Post-Surgical Raised Scars, Post-Burn Raised Scars and Trauma and Inflammatory Raised Scars. Post-Surgical Raised Scars led with a 52.0% share of 2025 value, because operating volumes are very large, with a JAMA Network Open study counting 7,635,149 deliveries at 4,359 Chinese hospitals in 2020. Post-Burn Raised Scars grow fastest at 7.23% a year, as India planned burn units at 67 state medical colleges and 19 district hospitals, according to Scroll in November 2019. Those units bring more survivors into follow-up, where contracture and raised scars are first recognized and treated.
Where do patients receive raised-scar care?
Based on care setting, the market is categorized into Hospital-Based Care, Specialist Outpatient Care and Home-Based Care. Hospital-Based Care led with a 46.0% share of 2025 value, because severe cases concentrate in large units, and Tongren Hospital of Wuhan University admitted 33,619 burn patients from 2004 to 2021, according to Archives of Public Health in August 2024. Specialist Outpatient Care grows fastest at 7.31% a year, as private dermatology capacity expands, with 705,044 foreign patients seeking dermatology care in South Korea in 2024 according to the Korea Herald. Laser regimens of two to four visits also suit clinics better than wards.
How do purchasing routes differ across the region?
Based on channel, the market is categorized into Institutional Procurement, Pharmacy Dispensing and Authorized Digital Commerce. Institutional Procurement led with a 54.0% share of 2025 value, because hospitals buy injectables, devices and consumables centrally, and China's sixth national consumables round selected 440 products from 202 manufacturers in January 2026, according to China Daily. Authorized Digital Commerce grows fastest at 8.56% a year, as Alliance Pharma reported 18% value growth for scar treatments in Chinese e-commerce in the three months to October 2022. Menarini also directs Dermatix shoppers to online stores in seven Asian markets.
| Segment Group | Leading Sub-segment | Share, 2025 | Fastest-growing Sub-segment | CAGR, 2026–2035 |
|---|---|---|---|---|
| By Product Type | Topical Products | 46.0% | Laser and Device-Based Treatments | 7.84% |
| By Application | Post-Surgical Raised Scars | 52.0% | Post-Burn Raised Scars | 7.23% |
| By Care Setting | Hospital-Based Care | 46.0% | Specialist Outpatient Care | 7.31% |
| By Channel | Institutional Procurement | 54.0% | Authorized Digital Commerce | 8.56% |
Request a Free Sample
Fill in your details and we'll send you a free sample report.
- Sample data tables & charts
- Research methodology
Burn referral, long regimens and combination care lift use
How does burn-care referral development lift scar treatment?
Survivors who reach specialist units also reach scar follow-up, so referral capacity directly expands the treated population. The World Health Organization counts about 56,300 deaths from fire, heat and hot substances in its South-East Asia Region in 2023, which indicates the scale of severe burn injury in the region. India alone sees an estimated 6 to 7 million burn injuries a year, according to the Indian Journal of Plastic Surgery. The Indian health program approved burn units at 47 of 67 planned medical colleges and identified 17 district hospitals, according to Scroll in November 2019. In turn, Post-Burn Raised Scars grow faster than the regional total, and India records the fastest country rate in the region.
Why does persistent scar-care consumption keep value recurring?
Raised scars need months of daily product use rather than a single purchase, so sales repeat long after discharge. The Japan Scar Workshop starts steroid plasters for three months, changing them every 24 to 48 hours. The Cica-Care listing on Watsons Singapore tells users to build wear time to at least 12 hours a day and replace sheets every 14 to 28 days, with one 12 cm by 3 cm sheet listed at S$58.50 in November 2026. Alliance Pharma launched Kelo-cote Kids Gel in China in 2022, adding a younger user group. As a result, Topical Products remain the largest product group in the region.
How does specialist multimodal treatment raise spending per patient?
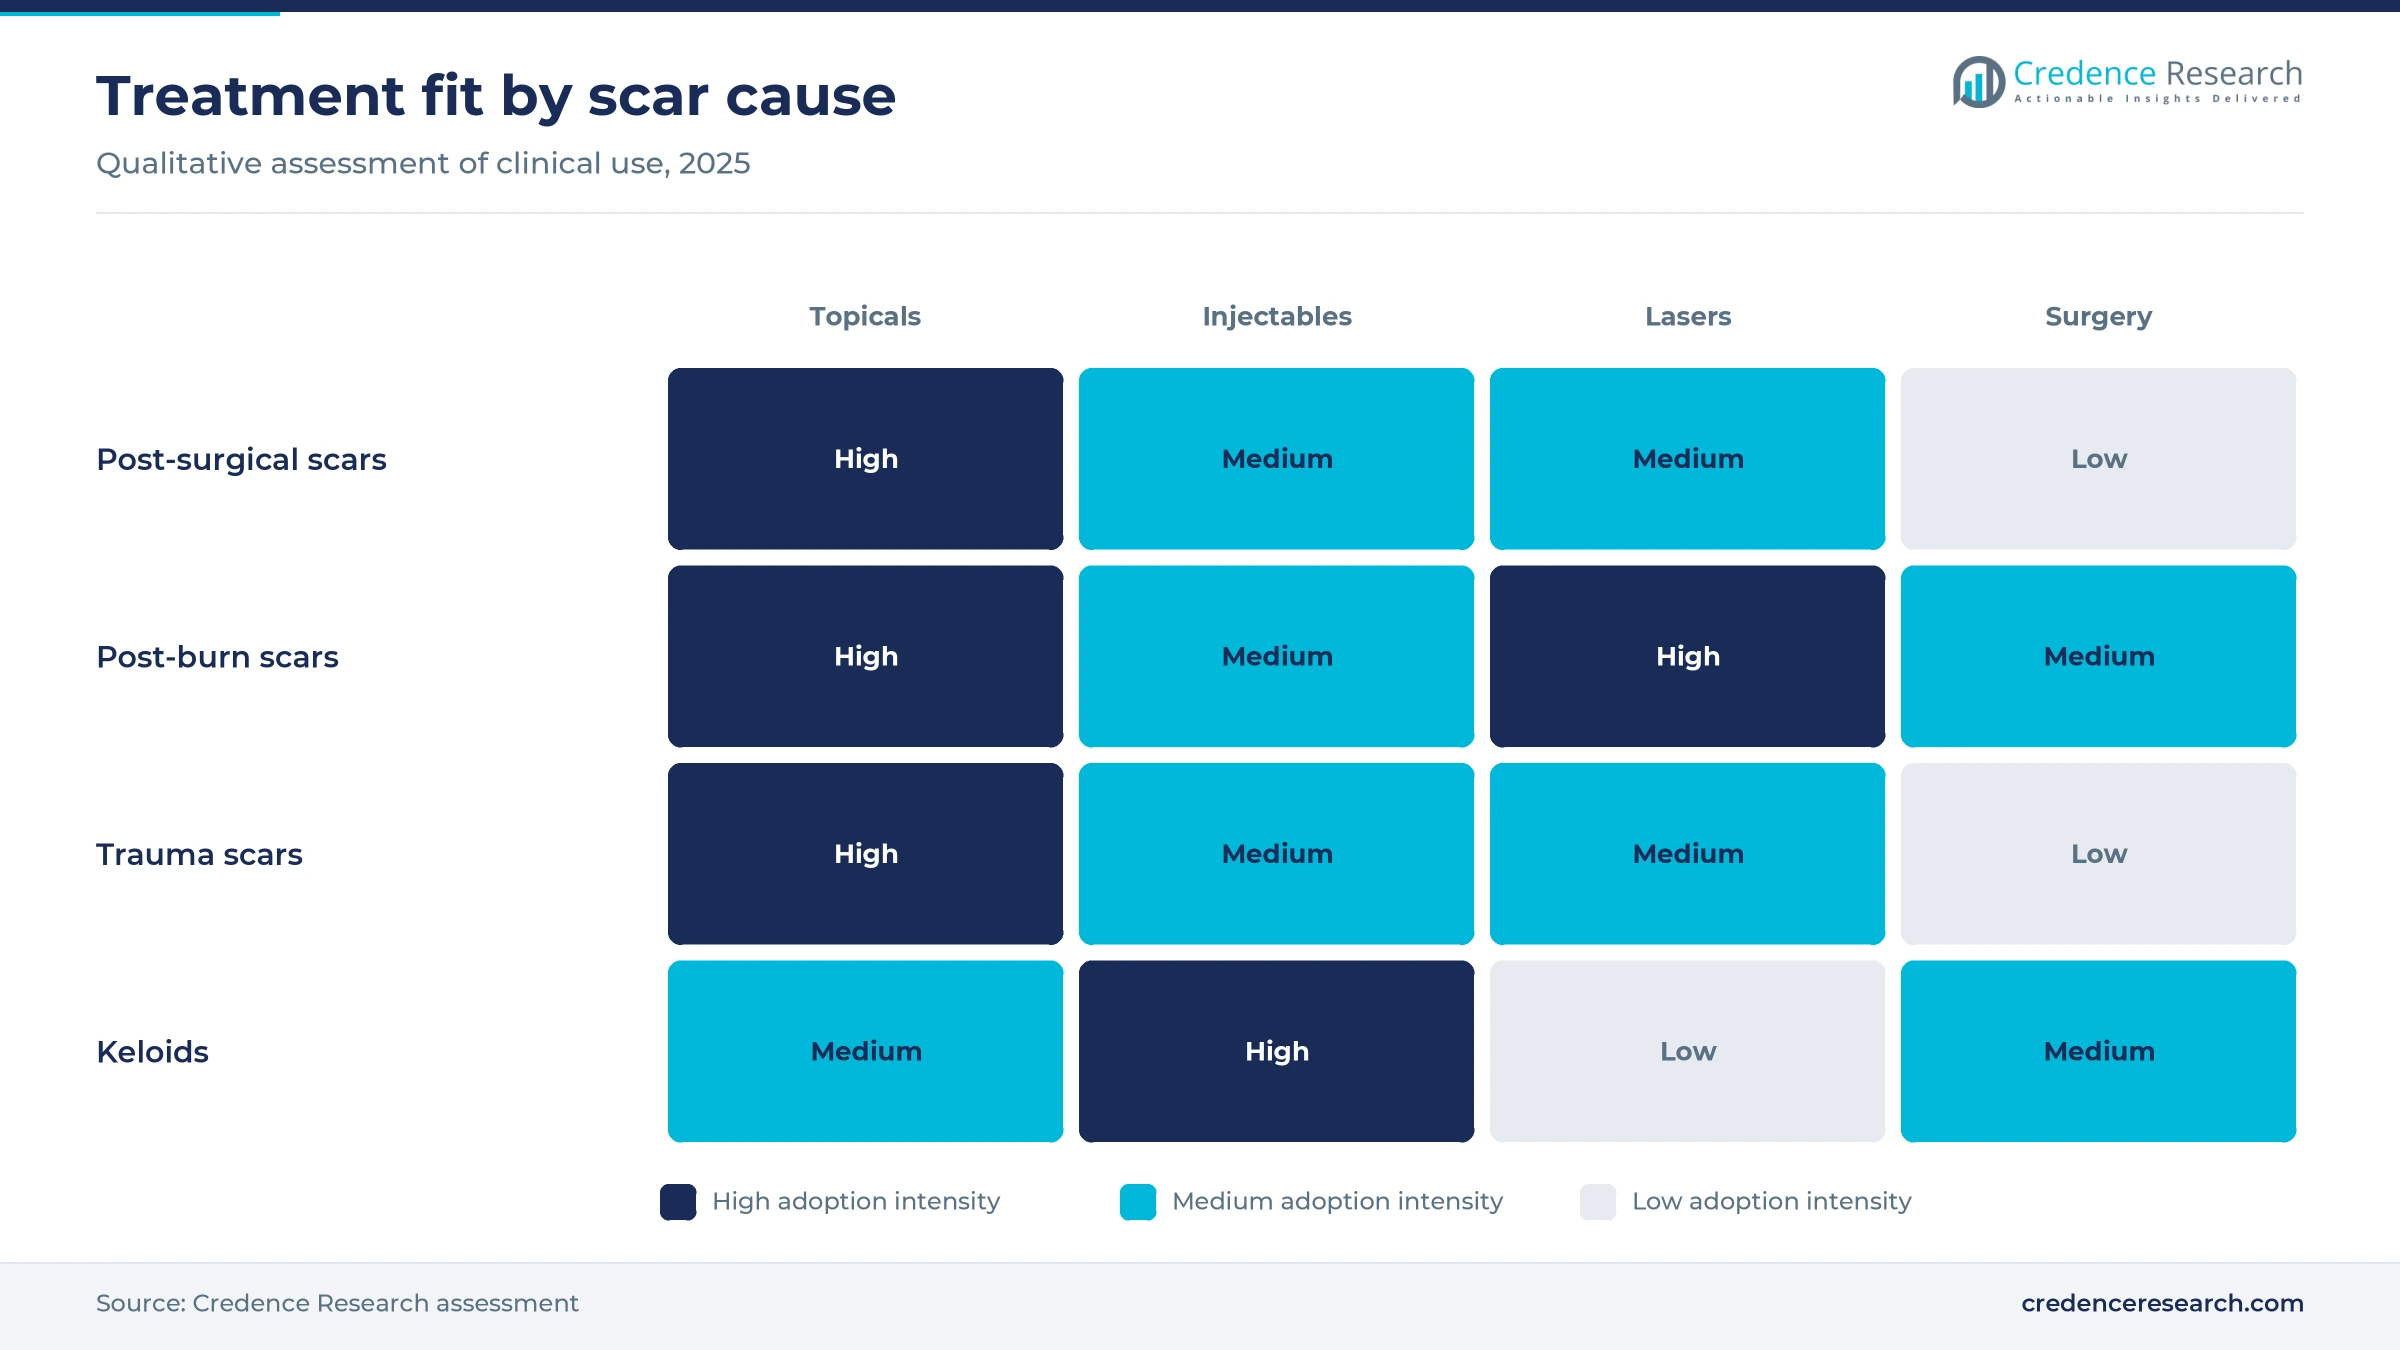
One keloid can need surgery, radiation, injections and maintenance products in sequence, and each step adds cost. The Japan Scar Workshop consensus reports recurrence of 10% or less when excision is followed by radiation reaching a biologically effective dose of 30 Gy, against 50% to 80% with surgery alone. It describes triamcinolone doses of 5 to 10 mg repeated at two-week intervals when plasters fail. Pulsed dye laser adds two to four sessions spaced four to eight weeks apart. Each extra step moves care toward specialists, and this helps explain why Specialist Outpatient Care leads growth at 7.31% a year.
Why do cesarean volumes keep surgical scar demand high?
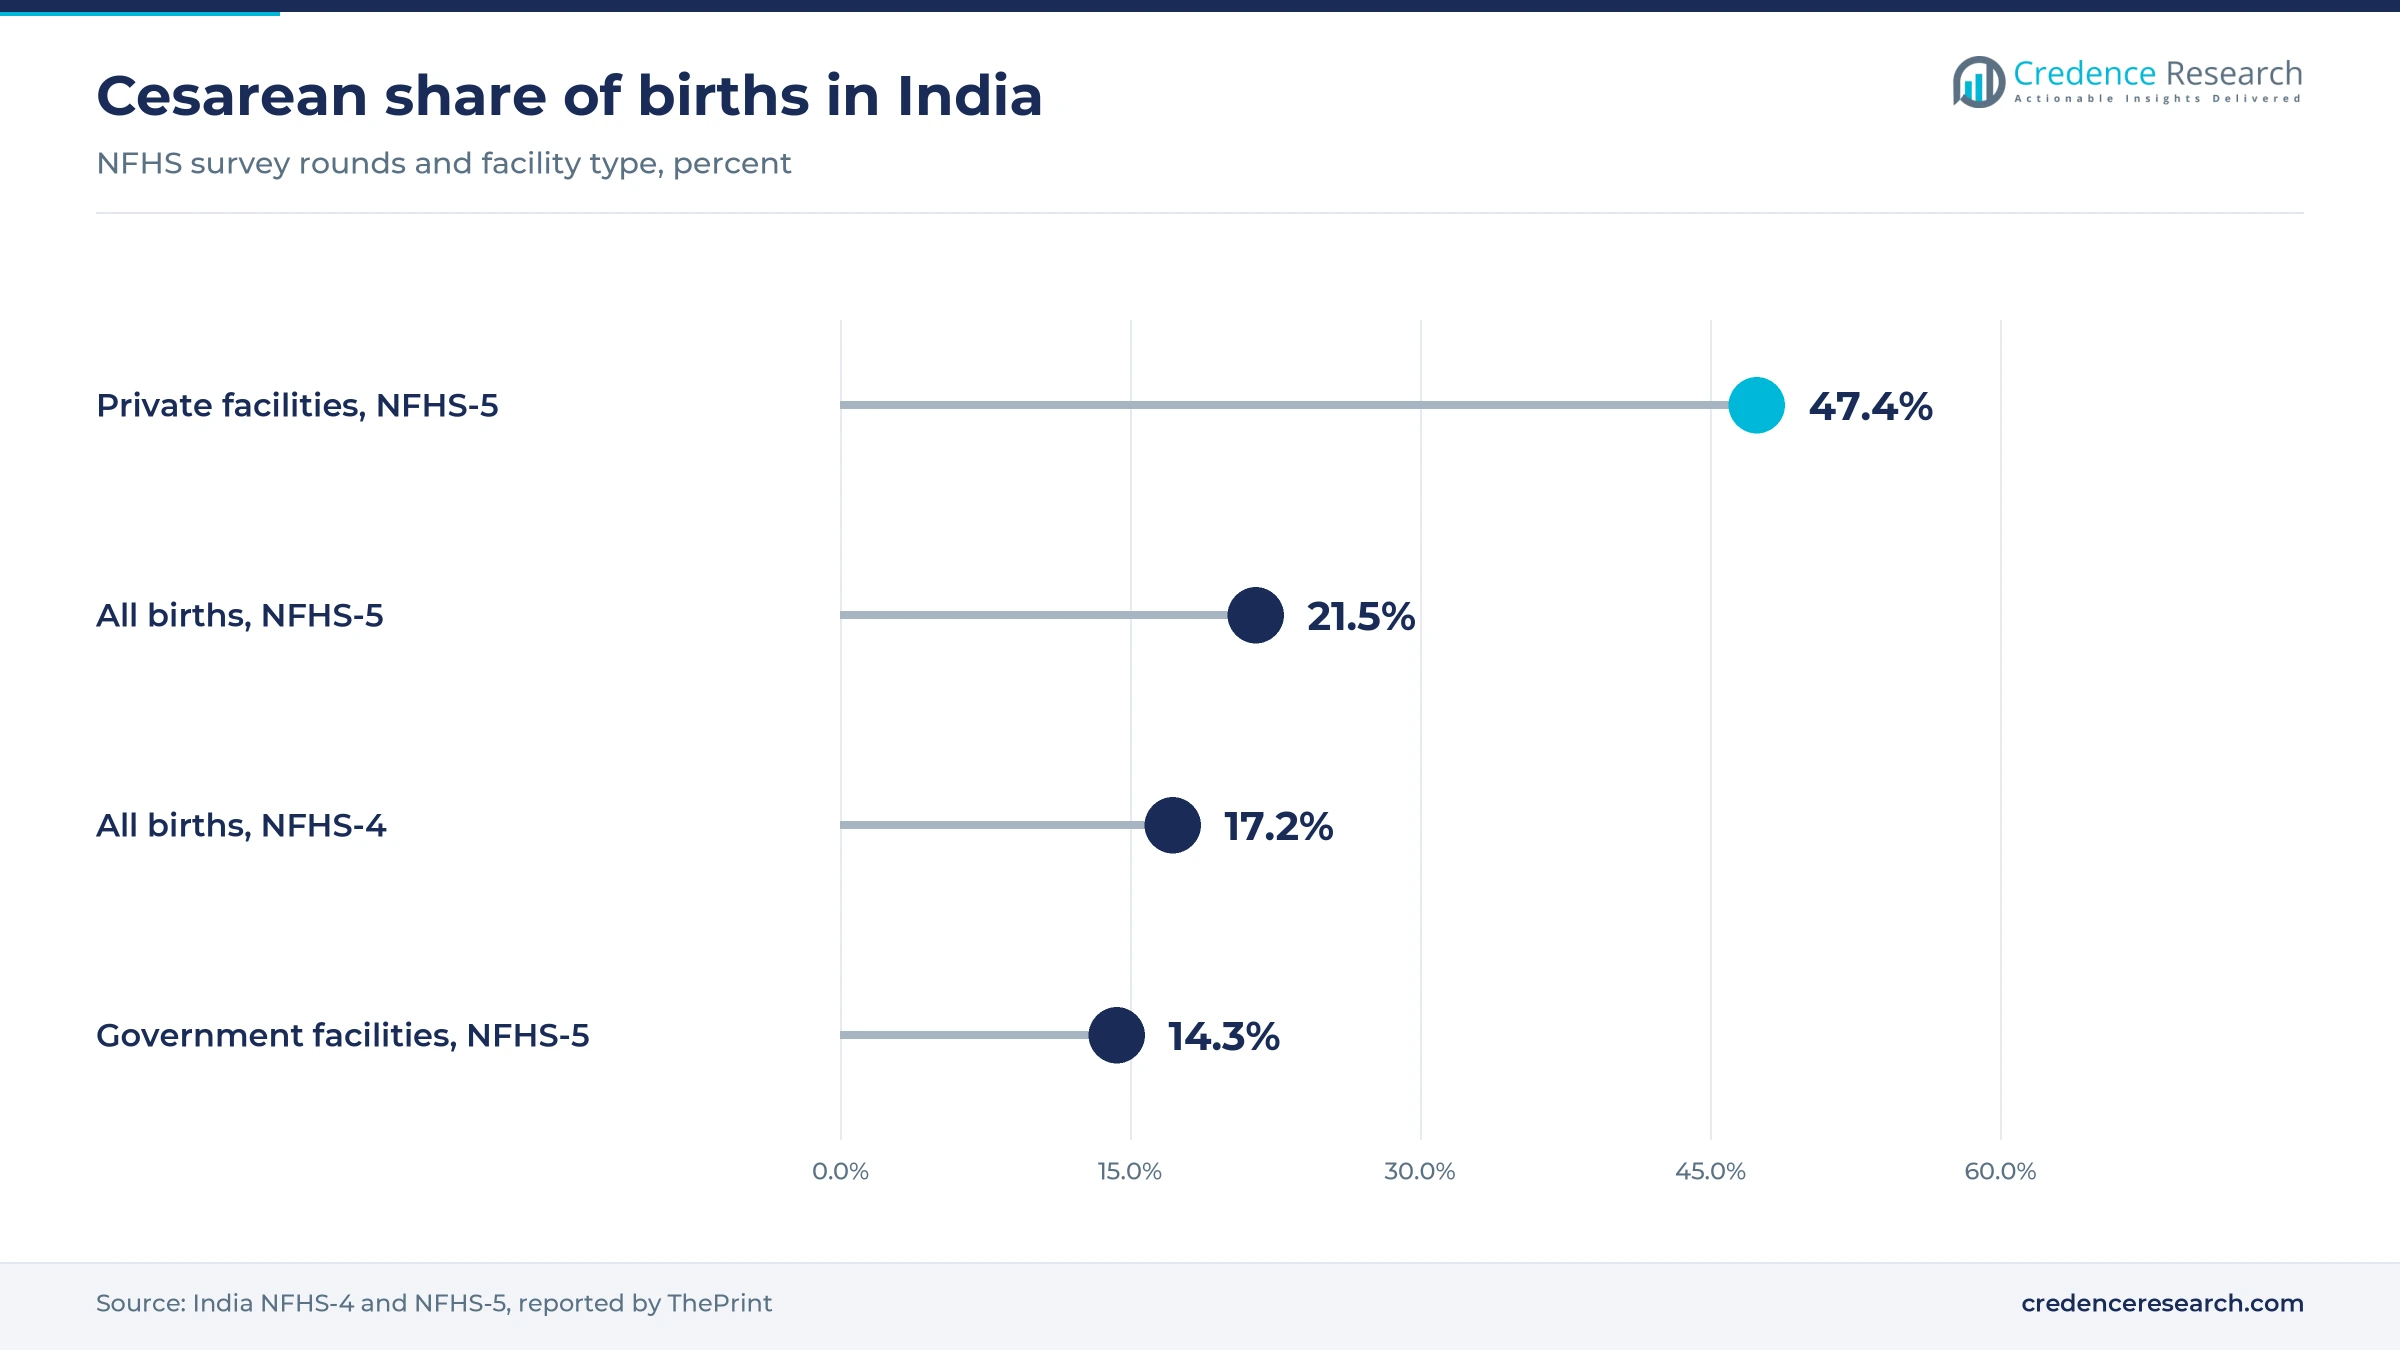
The incision leaves a lasting mark on the lower abdomen, which makes mothers a steady group of scar care users. India's NFHS-5 survey put cesarean births at 21.5%, up from 17.2% in NFHS-4, and at 47.4% in private facilities against 14.3% in government facilities, according to ThePrint in November 2021. In China, a JAMA Network Open study recorded a 53.5-point gap between hospitals at the 5th and 95th percentiles in 2020. The same paper recalled a World Health Organization survey rate of up to 46.2% in 2007 to 2008. Consequently, Post-Surgical Raised Scars lead applications at 52.0% of 2025 value.
Fractional lasers, child protocols and local plants emerge
Shift toward fractional lasers in routine surgical scar care
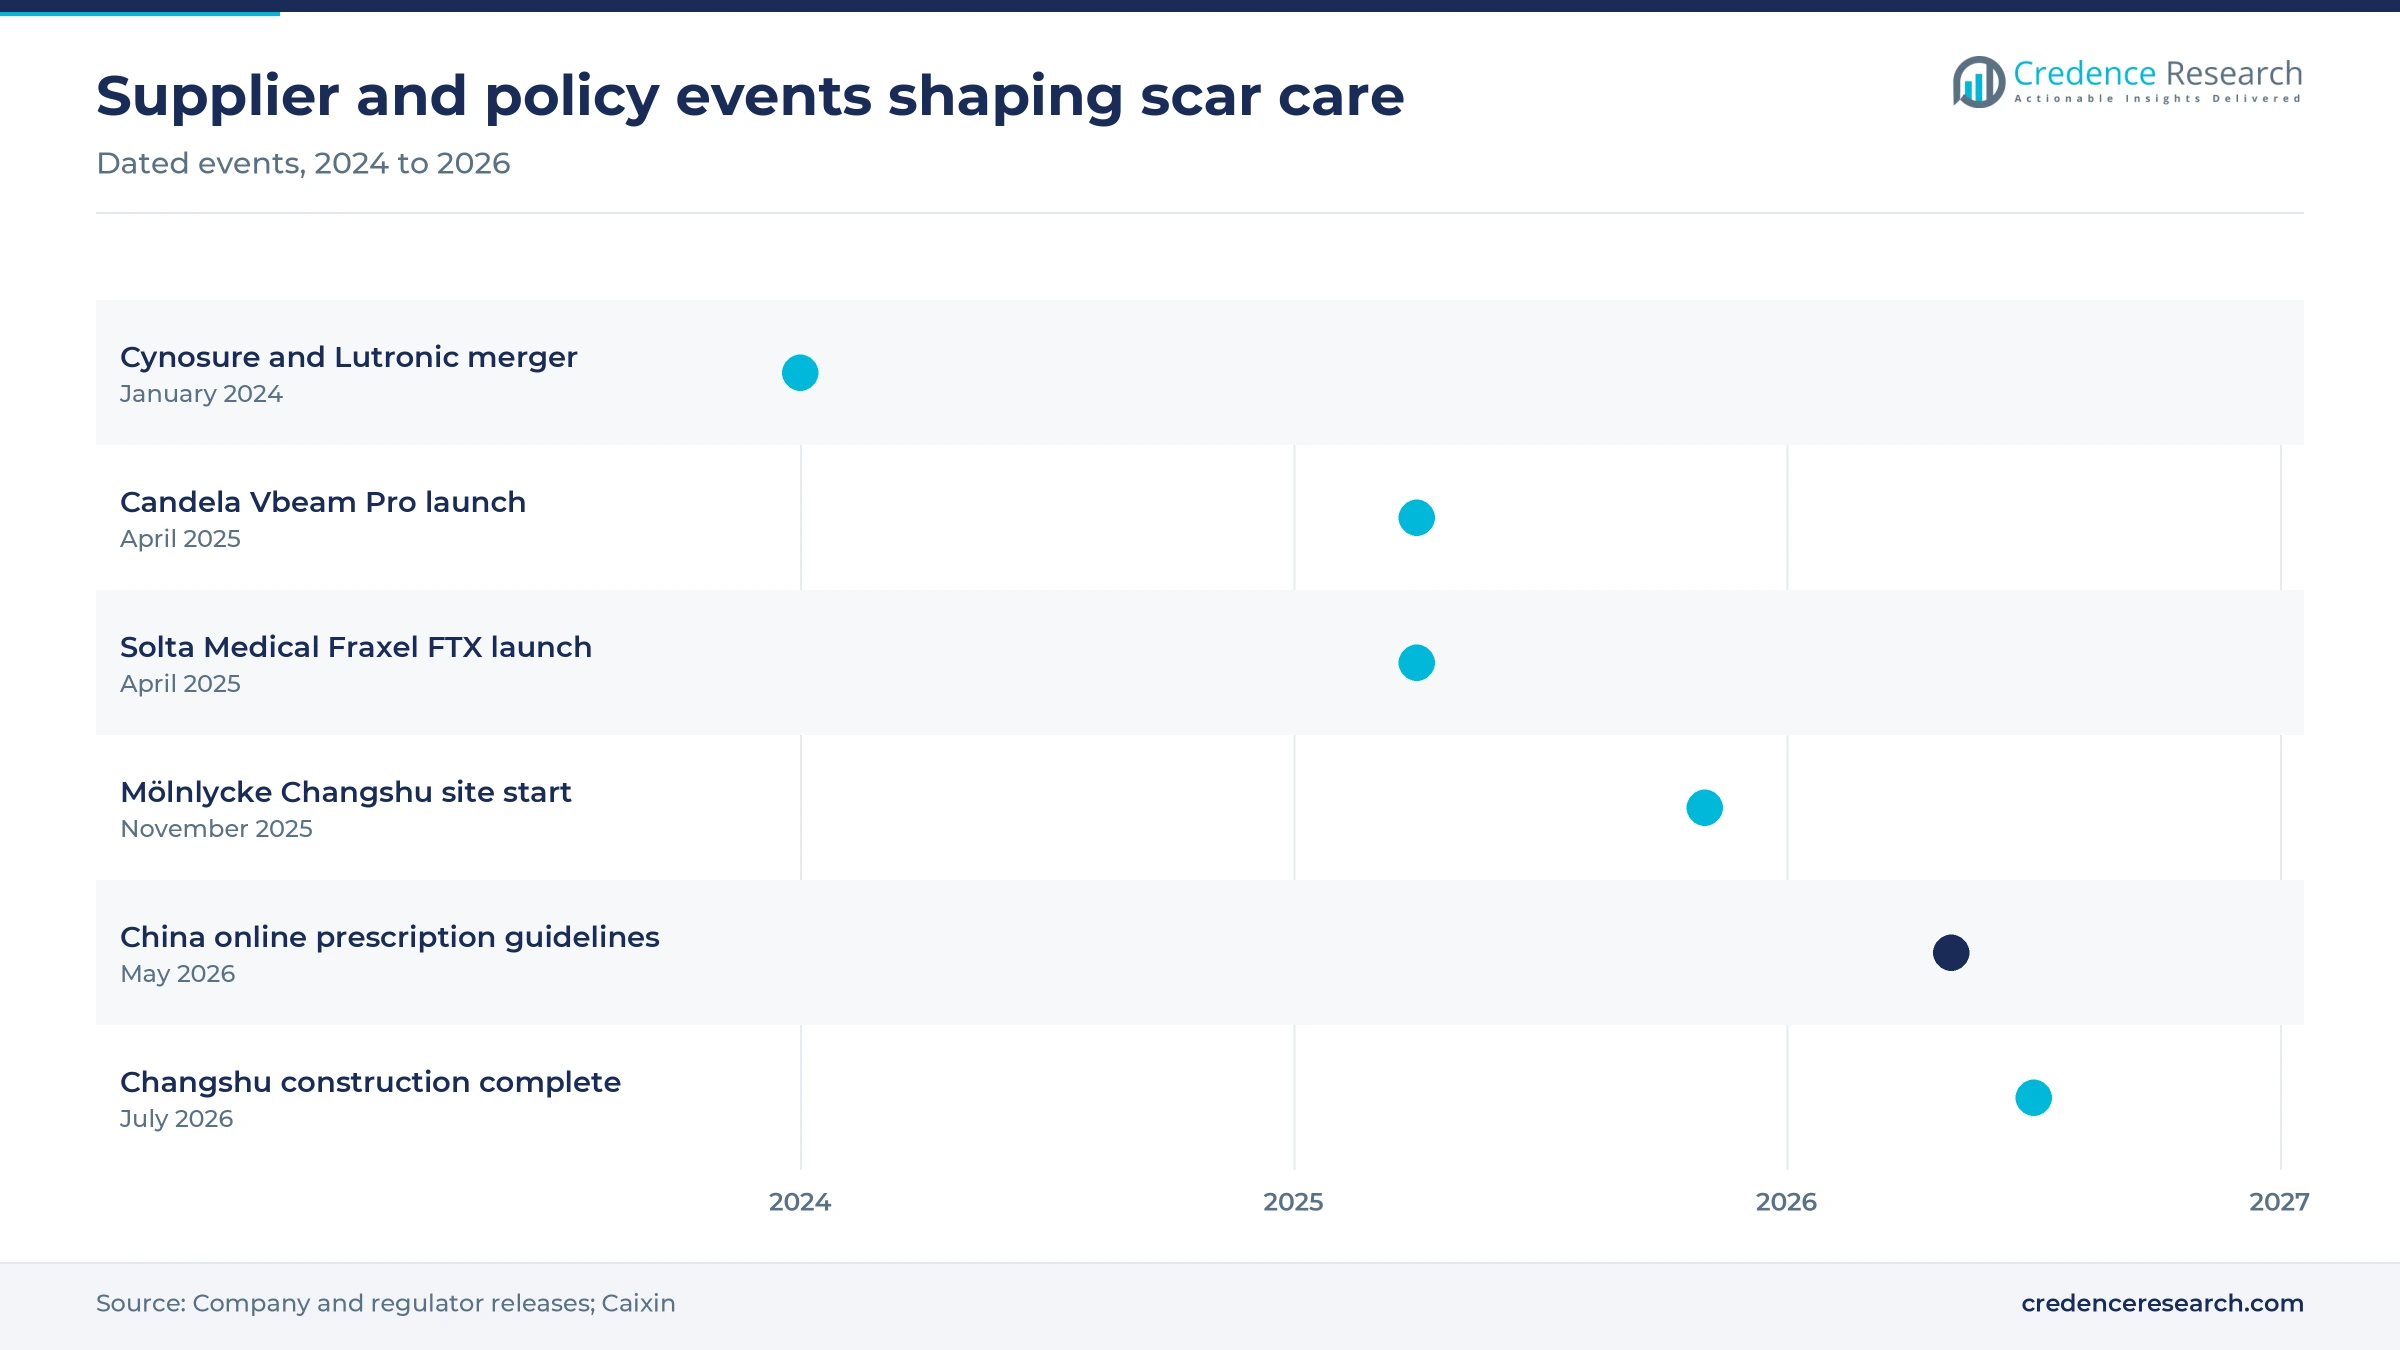
Suppliers are reorganizing around fractional and vascular platforms as evidence builds in everyday surgical cases. A Fujian Maternity and Child Health Hospital cohort of 220 women, published in May 2026, reported an adjusted Vancouver Scar Scale difference of 0.643 points favoring laser over silicone gel. Cynosure and Lutronic announced their merger on Jan. 19, 2024, with Cynosure already selling directly in China, Japan and South Korea. Candela launched Vbeam Pro in April 2025, and Bausch Health announced Solta Medical's Fraxel FTX in the same month. Japanese consensus still advises against fully ablative laser because of high recurrence, so fractional and vascular platforms hold most of the growth.
Rise of pediatric protocols for raised scars
Children form a large share of burn admissions and need gentler regimens, so dedicated guidance is now appearing. Zhengzhou First People's Hospital recorded 5,569 pediatric burn inpatients from 2013 to 2019, or 43.9% of its 12,665 burn patients, with a median age of two years, according to Frontiers in Public Health in March 2022. Chinese specialists then issued a Clinical Practice Guideline for the Prevention and Treatment of Scars in Children (2025 Edition), which the Journal of Shanghai Jiao Tong University describes as filling a worldwide gap. Suppliers are following with Dermatix Ultra Kids, which Menarini markets for children aged three months and above, and this widens the treated age range.
Opportunity in locally made silicone dressings for China
Plants inside China give suppliers a stronger cost position ahead of any wider national consumable rounds. Mölnlycke reported completing construction of its first Chinese factory in Changshu in July 2026, after a commencement ceremony it announced on Nov. 5, 2025, and the company already lists Mepiform silicone scar dressings on its Chinese website. National buying covered 142 consumable types by January 2026, according to China Daily, although scar products have not been named in those rounds. A supplier producing silicone dressings locally could therefore defend pricing if scar lines enter later tenders, and China remains the largest buyer in the region.
Opportunity for scar clinics serving cross-border patients
Cross-border dermatology offers an opening because patients already travel across the region for skin procedures. South Korea hosted about 2.01 million foreign patients in 2025, and 62.9% received dermatology treatment, according to the Ministry of Health and Welfare as reported by Asia News Network in April 2026. The 2024 total was 1.17 million, up from 605,768 a year earlier, and Japan supplied 441,112 patients, according to the Korea Health Industry Development Institute. Clinics with scar protocols can add revision laser and injection packages to this flow. This supports Remaining Asia Pacific, which holds 27.7% of 2025 value.
Weak evidence, relapse and falling births restrain demand
Why does thin clinical evidence slow adoption?
Hospital buyers want proof before funding repeat regimens, and the published record remains modest. The Japan Scar Workshop consensus notes that a meta-analysis of 20 randomized trials suggested silicone may help, but it calls the quality of those trials poor. The May 2026 Fuzhou laser study was also retrospective and nonrandomized. Suppliers therefore face slower formulary decisions, and sponsored comparative trials in Asian skin types would shorten that delay.
How does keloid relapse limit patient confidence?
Many keloids return even after costly care, which makes patients wary of paying again. Japanese consensus authors report recurrence of 50% to 80% after surgery alone and up to 47% with 5-fluorouracil injections. Radiation lowers relapse, yet it is not recommended for children and is generally avoided in young people because of secondary cancer risk. Younger patients therefore have fewer durable options, and clinics must set expectations early and plan long maintenance regimens.
Why do falling births weigh on surgical demand in China?
Cesarean patients are a core user group in China, so the annual birth count matters directly. Births dropped to 7.92 million in 2025 from 9.54 million in 2024, according to China's statistics office as reported by dpa in January 2026. Maternity-linked sales of silicone products will therefore lose volume unless suppliers widen into burn, trauma and older surgical patients, and this holds the post-surgical growth rate below the market average.
How do uneven burn-care capacity and prices limit access?
India's specialist burn capacity looks thin against its injury load. The National Academy of Burns India counted only 1,339 beds at 67 centers in 2016, and 37 of those centers were private, according to Scroll in November 2019. Out-of-pocket prices add a second barrier across the region, with a 50 g Contractubex tube listed at 600,000 dong by Pharmacity in Vietnam in November 2026. Lower-priced local silicone and tele-dermatology follow-up could reduce this gap.
China anchors spending while India builds burn capacity
| Country | Value, 2025 (USD million) | Share, 2025 | CAGR, 2026–2035 |
|---|---|---|---|
| China | 181.3 | 50.3% | 6.68% |
| Remaining Asia Pacific | 99.9 | 27.7% | 6.28% |
| Japan | 42.9 | 11.9% | 5.08% |
| India | 36.4 | 10.1% | 8.08% |
China combines burn volumes with maternity demand
China held 50.3% of 2025 value and grows at 6.68% a year, because large burn units and maternity hospitals feed steady scar referrals. Tongren Hospital in Wuhan alone runs a 120-bed burn center, and about 32.4% of its burn patients needed surgery, according to Archives of Public Health. Burn care capacity therefore shapes hospital demand for silicone products and injections across the country. Online buying also matters, and national online drug sales provisions took effect on Dec. 1, 2022, followed by prescription retail guidelines reported by Caixin in May 2026.
Japan follows structured guidance in an older market
Japan held 11.9% of 2025 value and grows at 5.08% a year, the slowest country rate, because the market is mature and treatment follows established consensus. The Japan Scar Workshop grades scars on a score where 16 or more indicates keloid and refers those cases to specialized facilities. The same guidance lists pulsed dye lasers at 585 or 595 nm, and Candela holds Japanese approval to market Vbeam lasers. Spending also links to Japanese wound dressings, which share hospital buyers with silicone sheets.
India builds burn units and sees private cesarean volume
India held 10.1% of 2025 value and grows at 8.08% a year, the fastest country rate, because referral capacity starts from a low base. The national program planned units at 67 medical colleges, while more than half of the burn centers counted in 2016 were private. Private facilities performed cesareans in 47.4% of births in NFHS-5, which adds a paying surgical group. Hospital buyers also source from suppliers active in wound care in India, so distribution often runs through those existing accounts.
Remaining Asia Pacific mixes clinic hubs and retail buyers
Remaining Asia Pacific held 27.7% of 2025 value and grows at 6.28% a year, with South Korea, Australia and Southeast Asia setting its direction. South Korean clinics draw foreign dermatology patients, while Amcal in Australia sells Cica-Care for new and existing hypertrophic and keloid scars. Pharmacity in Vietnam sells Contractubex for the same two scar types at retail. These clinics also buy aesthetic lasers for wider skin work, which spreads equipment costs.
Mergers, launches and factories from 2024 to 2026
| Development | Status and market relevance |
|---|---|
| In January 2024, Cynosure and Lutronic announced a merger, combining laser and energy-based portfolios with a commercial presence across more than 130 countries. | Announced; Cynosure direct selling in China, Japan and South Korea supports laser access |
| In April 2025, Candela launched its Vbeam Pro laser platform for vascular and dermatologic conditions at the ASLMS conference. | Launched; pulsed dye lasers treat redness and itch in raised scars |
| In April 2025, Bausch Health announced the launch of Solta Medical's Fraxel FTX skin resurfacing system at the ASLMS conference. | Launched in the United States first; fractional platforms support scar remodeling |
| In May 2026, China's National Medical Products Administration released compliance guidelines for online prescription drug retail, as reported by Caixin. | Released; tightens prescription review for online sellers |
| In July 2026, Mölnlycke Health Care reported that construction of its Changshu factory, started in November 2025, was complete and that commercial production was being prepared. | Pre-production; output is intended for the Chinese market |
Silicone, steroids, lasers and radiation form the toolkit
- Silicone sheets and gels reduce skin tension and hold moisture, and they remain the default home product despite the modest trial quality noted by Japanese consensus authors.
- Steroid plasters and injections calm inflammation in active scars, with deprodone propionate plasters for adults, fludroxycortide tape for children and triamcinolone injections when plasters fail.
- Vascular and fractional lasers target redness and collagen remodeling, with pulsed dye systems at 585 or 595 nm and fractional systems used for thicker scars in specialist clinics.
- Postoperative radiation protects excised keloids from relapse, usually with 15 Gy in three fractions and with 20 Gy in four fractions on high-tension sites such as the chest.
Need a Custom Version of This Report?
Tailor the scope, geography, or segments to your exact requirements.
- Custom geography or segment scope
- Direct access to our analyst team
Dressing makers and laser brands compete for the same scar
Competition splits between dressing and topical brands that win long-term use and laser makers that win specialist capital budgets. Mölnlycke Health Care and Smith+Nephew rely on hospital wound care accounts and pharmacy listings for silicone products, while Alliance Pharmaceuticals, Merz and Menarini Asia-Pacific build consumer brands in Kelo-cote, Contractubex and Dermatix through pharmacies and online stores. Stratpharma entered China through Luqa Pharmaceuticals, which launched Strataderm in February 2013. Laser competition is led by Lumenis, which describes Asia Pacific as its largest market, along with Cynosure Lutronic and Candela. Suppliers increasingly compete on evidence, local registration and clinic training rather than on list price, since a single scar may move across three or four product types. Local production in Changshu shows that China is now a manufacturing decision as well as a sales decision.
Dressing, topical and laser suppliers active in the region
| Company | Type | Role in the market |
|---|---|---|
| Mölnlycke Health Care | Dressing maker | Mepiform silicone dressings on its China site; Changshu factory completed by July 2026 |
| Smith+Nephew | Dressing maker | Cica-Care gel sheets listed by Watsons Singapore and Amcal Australia |
| Alliance Pharmaceuticals | Topical brand owner | Kelo-cote sold through Chinese cross-border e-commerce; Kids Gel launched in China in 2022 |
| Merz Therapeutics | Topical brand owner | Contractubex gel from Merz sold through Pharmacity in Vietnam for keloid and hypertrophic scars |
| Menarini Asia-Pacific | Consumer health | Dermatix range with online stores across seven Asian markets |
| Stratpharma | Silicone gel specialist | Strataderm launched in China with Luqa in February 2013 |
| Lumenis | Laser maker | Calls Asia Pacific its largest market; offers CO2 scar treatment platforms |
| Cynosure Lutronic | Laser maker | Direct sales in China, Japan and South Korea from the January 2024 merger |
| Candela | Laser maker | Vbeam approvals in China and Japan; Vbeam Pro launched in April 2025 |
Repeat regimens, not one-off procedures, set the value
Credence Research's view is that value in this market depends on how long a patient stays on a regimen, not on one procedure. A keloid patient can move through four treatment steps, from excision and radiation to injections and silicone, and each step carries a separate market purchase. Suppliers that link hospital discharge to clinic and pharmacy refills should therefore capture more than those selling one product type. China and India together accounted for 60.4% of 2025 regional demand, so their hospital and clinic capacity will largely set the market pace. Better comparative trials in Asian skin would likely do more for growth than new product launches, since current evidence still leaves many buyers cautious.
Clinical literature and public data feed the model
The report uses 2025 as the base year and forecasts to 2035. Market values come from the Credence Research model, and segment and country splits are Credence Research estimates checked against burn, surgical and care capacity data. Source types used include World Health Organization statistics, national surveys and regulator notices, peer-reviewed clinical papers, company announcements and published retail listings. No interviews or surveys were conducted for this edition, so the patient uptake and spending assumptions behind the country split are the most judgment-based inputs.
Specialist clinics and online refills carry growth to 2035
The market is projected to reach USD 691.7 million by 2035, as specialist clinics and licensed online sellers take a larger part of repeat care. China should remain the largest country in market demand through 2035, although its maternity-linked demand will soften if births stay low. India should gain share as burn units mature and private surgery expands. Japan's 11.9% share of regional demand should slip, because its mature market grows more slowly than the other countries. Laser and Device-Based Treatments should remain the fastest product group at 7.84% a year, while silicone stays the everyday maintenance product. Any entry of scar products into Chinese consumable rounds would be the main pricing risk to watch.
Frequently Asked Questions
How big is the Asia Pacific hypertrophic and keloid scar treatment market?
Which country leads raised-scar treatment in Asia Pacific?
Which country grows fastest?
Which product type holds the largest share?
Which product type is growing fastest?
What causes most treated raised scars?
What is the main challenge for suppliers?
Which companies are active in the regional market?
Table of Content
Chapter 1 Market Segmentation
- 1.1 Segmentation Framework
- 1.1.1 Product and Service Classification
- 1.1.2 Application and End-Use Classification
- 1.1.3 Technology and Solution Classification
- 1.1.4 Customer and Distribution Channel Classification
- 1.1.5 Geographic Segmentation
- 1.1.6 Market Segment Definitions and Boundaries
- 1.2 By Product Type
- 1.2.1 Topical Products
- 1.2.2 Injectables
- 1.2.3 Laser and Device-Based Treatments
- 1.2.4 Surface and Surgical Treatments
- 1.3 By Application
- 1.3.1 Post-Surgical Raised Scars
- 1.3.2 Post-Burn Raised Scars
- 1.3.3 Trauma and Inflammatory Raised Scars
- 1.4 By Care Setting
- 1.4.1 Hospital-Based Care
- 1.4.2 Specialist Outpatient Care
- 1.4.3 Home-Based Care
- 1.5 By Channel
- 1.5.1 Institutional Procurement
- 1.5.2 Pharmacy Dispensing
- 1.5.3 Authorized Digital Commerce
- 1.6 By Country
- 1.6.1 China
- 1.6.2 Japan
- 1.6.3 India
- 1.6.4 Remaining Asia Pacific
Chapter 2 Introduction
- 2.1 Report Objectives and Scope
- 2.2 Product Definition and Industry Terminology
- 2.3 Market Inclusions and Exclusions
- 2.4 Research Process
- 2.4.1 Primary Research and Expert Interviews
- 2.4.2 Secondary Research and Source Review
- 2.4.3 Top-Down and Bottom-Up Estimation
- 2.4.4 Data Triangulation and Verification
- 2.5 Market Size Measurement Basis
- 2.5.1 2025: USD 360.5 million → 2035: USD 691.7 million
- 2.6 Historical and Forecast Reference Periods
- 2.6.1 Historical Period: 2018-2025
- 2.6.2 Base Year: 2025
- 2.6.3 Forecast Period: 2025-2035
- 2.7 Research Assumptions and Limitations
Chapter 3 Executive Summary
- 3.1 Market Snapshot and Key Findings
- 3.2 Base-Year Market Size, 2025
- 3.3 Forecast Market Size, 2035
- 3.4 Revenue and Volume Growth Outlook
- 3.5 Key Demand and Supply Indicators
- 3.6 Leading Market Segments
- 3.7 Fastest-Growing Market Opportunities
- 3.8 Regional Performance Highlights
- 3.9 Technology and Industry Transformation
- 3.10 Competitive Landscape Summary
- 3.11 Analyst View and Strategic Implications
Chapter 4 Asia Pacific Hypertrophic and Keloid Scar Treatment Market Trends and Developments
- 4.1 Historical Industry Development, 2018-2025
- 4.2 Recent Market Trends and Developments
- 4.3 Demand and Customer Behavior Trends
- 4.4 Technology and Product Innovation
- 4.5 Artificial Intelligence, Automation and Digitalization
- 4.6 Local Manufacturing and Supply Chain Realignment
- 4.7 Industry Partnerships, Mergers and Acquisitions
- 4.8 Sustainability and Circular Economy Developments
- 4.9 Government and Private Sector Investment Trends
- 4.10 Emerging Business Models and Commercialization
- 4.11 Industry Developments and Announcements
Chapter 5 Asia Pacific Hypertrophic and Keloid Scar Treatment Market Production, Supply and Demand Analysis
- 5.1 Demand Trend and Consumption Analysis, 2018-2025
- 5.2 Demand Forecast, 2025-2035
- 5.3 Production and Output Trend, 2018-2025
- 5.4 Production and Output Forecast, 2025-2035
- 5.5 Installed Capacity and Capacity Utilization
- 5.6 Company-Wise Production Plants and Statistics
- 5.6.1 Installed Production Capacity
- 5.6.2 Actual Production
- 5.6.3 Planned Capacity and Expansion Targets
- 5.7 Supply Chain Structure and Procurement Trends
- 5.8 Supply-Demand Gap and Bottlenecks
- 5.9 Import Dependence and Sourcing Structure
- 5.10 Contract Manufacturing and Outsourcing
- 5.11 Regional Supply and Demand Concentration
Chapter 6 Asia Pacific Hypertrophic and Keloid Scar Treatment Market Pricing Analysis
- 6.1 Pricing Structure and Measurement
- 6.2 Historical Pricing Trends, 2018-2025
- 6.3 Pricing Outlook, 2025-2035
- 6.4 Average Selling Price and Unit Economics
- 6.5 Pricing by Product and Market Segment
- 6.6 Geographic Pricing Differences
- 6.7 Key Input, Energy, Labor and Logistics Costs
- 6.8 Contract Pricing and Purchasing Models
- 6.9 Pricing Sensitivity and Competitive Positioning
- 6.10 Price, Margin and Profitability Implications
Chapter 7 Asia Pacific Hypertrophic and Keloid Scar Treatment Market Dynamics
- 7.1 Market Growth Drivers
- 7.1.1 Demand-Side Drivers
- 7.1.2 Technology and Innovation Drivers
- 7.1.3 Infrastructure and Investment Drivers
- 7.1.4 Regulatory and Policy Drivers
- 7.2 Market Restraints
- 7.2.1 Cost and Affordability Constraints
- 7.2.2 Technology and Adoption Barriers
- 7.2.3 Supply Chain and Operational Constraints
- 7.3 Market Challenges
- 7.3.1 Competitive Pressure and Margin Erosion
- 7.3.2 Skills, Infrastructure and Implementation Gaps
- 7.4 Emerging Market Opportunities
- 7.5 Market Dynamics Impact and Time-Horizon Assessment
Chapter 8 Asia Pacific Hypertrophic and Keloid Scar Treatment Value Chain Analysis
- 8.1 Industry Value Chain Overview
- 8.2 Upstream Suppliers and Critical Inputs
- 8.3 Technology and Component Providers
- 8.4 Manufacturing or Service Delivery
- 8.5 Distribution, Channel Partners and Integrators
- 8.6 Downstream Applications and End Users
- 8.7 Value Addition and Profit Pools
- 8.8 Vertical Integration and Outsourcing
- 8.9 Supplier Concentration and Risk
- 8.10 Supply Chain Localization and Resilience
Chapter 9 Asia Pacific Hypertrophic and Keloid Scar Treatment Market Regulations and Policies
- 9.1 Relevant Laws, Standards and Compliance Frameworks
- 9.2 Product, Service, Safety and Quality Requirements
- 9.3 Government Policies, Incentives and Subsidies
- 9.4 Imports, Exports and Trade Barriers
- 9.5 Public Procurement and Local Content Requirements
- 9.6 Environmental and Sustainability Compliance
- 9.7 Upcoming Policy Changes and Market Implications
Chapter 10 Asia Pacific Hypertrophic and Keloid Scar Treatment Market Hotspots and Opportunities
- 10.1 Market Opportunity Mapping and Growth Hotspots
- 10.2 High-Growth Applications and Customer Groups
- 10.3 Underserved Markets and White-Space Opportunities
- 10.4 Emerging Technology and Product Opportunities
- 10.5 New Capacity and Investment Hotspots
- 10.6 Market Entry and Expansion Opportunities
- 10.7 Distribution and Partnership Opportunities
- 10.8 Near-Term and Long-Term Commercial Potential
- 10.9 Opportunity Attractiveness and Execution Risks
Chapter 11 Asia Pacific Hypertrophic and Keloid Scar Treatment Market Outlook, 2025-2035
- 11.1 Market Size and Analysis
- 11.1.1 Revenue (Market Measurement: 2025: USD 360.5 million → 2035: USD 691.7 million)
- 11.1.2 Market Volume and Quantity Sold
- 11.1.3 Historical Market Size, 2018-2025
- 11.1.4 Base-Year Market Size, 2025
- 11.2 Market Forecast, 2025-2035
- 11.2.1 Revenue Forecast to 2035
- 11.2.2 Volume Forecast to 2035
- 11.2.3 CAGR and Year-on-Year Growth
- 11.2.4 Incremental Revenue Opportunity
- 11.3 Forecast Assumptions and Scenario Analysis
- 11.3.1 Base-Case Forecast
- 11.3.2 Optimistic and Conservative Scenarios
- 11.3.3 Technology, Pricing and Policy Sensitivities
- 11.4 Market Attractiveness and Growth Outlook
Chapter 12 Asia Pacific Hypertrophic and Keloid Scar Treatment Market Segmentation and Outlook
- 12.1 Segmentation Summary and Market Shares, 2025
- 12.2 Largest and Fastest-Growing Segments
- 12.3 By Product Type - Market Size and Forecast, 2025-2035
- 12.3.1 Segment Definition and Scope
- 12.3.2 Historical Market Size, 2018-2025
- 12.3.3 Revenue Forecast, 2025-2035
- 12.3.4 Volume Forecast, 2025-2035
- 12.3.5 Base-Year Market Share, 2025
- 12.3.6 Segment CAGR and Growth Drivers
- 12.3.7 Subsegment Market Size and Forecast
- 12.3.7.1 Topical Products
- 12.3.7.2 Injectables
- 12.3.7.3 Laser and Device-Based Treatments
- 12.3.7.4 Surface and Surgical Treatments
- 12.3.8 Subsegment Pricing and Adoption Trends
- 12.3.9 Leading Suppliers and Competition
- 12.3.10 Regional Demand and Opportunities
- 12.4 By Application - Market Size and Forecast, 2025-2035
- 12.4.1 Segment Definition and Scope
- 12.4.2 Historical Market Size, 2018-2025
- 12.4.3 Revenue Forecast, 2025-2035
- 12.4.4 Volume Forecast, 2025-2035
- 12.4.5 Base-Year Market Share, 2025
- 12.4.6 Segment CAGR and Growth Drivers
- 12.4.7 Subsegment Market Size and Forecast
- 12.4.7.1 Post-Surgical Raised Scars
- 12.4.7.2 Post-Burn Raised Scars
- 12.4.7.3 Trauma and Inflammatory Raised Scars
- 12.4.8 Subsegment Pricing and Adoption Trends
- 12.4.9 Leading Suppliers and Competition
- 12.4.10 Regional Demand and Opportunities
- 12.5 By Care Setting - Market Size and Forecast, 2025-2035
- 12.5.1 Segment Definition and Scope
- 12.5.2 Historical Market Size, 2018-2025
- 12.5.3 Revenue Forecast, 2025-2035
- 12.5.4 Volume Forecast, 2025-2035
- 12.5.5 Base-Year Market Share, 2025
- 12.5.6 Segment CAGR and Growth Drivers
- 12.5.7 Subsegment Market Size and Forecast
- 12.5.7.1 Hospital-Based Care
- 12.5.7.2 Specialist Outpatient Care
- 12.5.7.3 Home-Based Care
- 12.5.8 Subsegment Pricing and Adoption Trends
- 12.5.9 Leading Suppliers and Competition
- 12.5.10 Regional Demand and Opportunities
- 12.6 By Channel - Market Size and Forecast, 2025-2035
- 12.6.1 Segment Definition and Scope
- 12.6.2 Historical Market Size, 2018-2025
- 12.6.3 Revenue Forecast, 2025-2035
- 12.6.4 Volume Forecast, 2025-2035
- 12.6.5 Base-Year Market Share, 2025
- 12.6.6 Segment CAGR and Growth Drivers
- 12.6.7 Subsegment Market Size and Forecast
- 12.6.7.1 Institutional Procurement
- 12.6.7.2 Pharmacy Dispensing
- 12.6.7.3 Authorized Digital Commerce
- 12.6.8 Subsegment Pricing and Adoption Trends
- 12.6.9 Leading Suppliers and Competition
- 12.6.10 Regional Demand and Opportunities
- 12.7 By Country - Market Size and Forecast, 2025-2035
- 12.7.1 Segment Definition and Scope
- 12.7.2 Historical Market Size, 2018-2025
- 12.7.3 Revenue Forecast, 2025-2035
- 12.7.4 Volume Forecast, 2025-2035
- 12.7.5 Base-Year Market Share, 2025
- 12.7.6 Segment CAGR and Growth Drivers
- 12.7.7 Subsegment Market Size and Forecast
- 12.7.7.1 China
- 12.7.7.2 Japan
- 12.7.7.3 India
- 12.7.7.4 Remaining Asia Pacific
- 12.7.8 Subsegment Pricing and Adoption Trends
- 12.7.9 Leading Suppliers and Competition
- 12.7.10 Regional Demand and Opportunities
- 12.8 Segment Growth Comparison
- 12.9 Segment Attractiveness and Priority Matrix
Chapter 13 Asia Pacific Hypertrophic and Keloid Scar Treatment End-Use and Application Market Outlook
- 13.1 End-Use Industry and Customer Demand Structure
- 13.2 Leading Applications and Customer Groups
- 13.3 End-Use Market Size, Share and Forecast
- 13.4 Major End-Use Industry Deep Dives
- 13.4.1 Customer Requirements and Use Cases
- 13.4.2 Demand and Replacement Cycles
- 13.4.3 Technical and Regulatory Considerations
- 13.4.4 Purchasing and Procurement Models
- 13.4.5 Leading Vendors and Distribution Channels
- 13.4.6 Forecast and Commercial Opportunities
- 13.5 Emerging Applications and Cross-Segment Demand
- 13.6 End-Use Industry Investment Priorities
Chapter 14 Asia Pacific Hypertrophic and Keloid Scar Treatment Geographic Market Outlook, 2025-2035
- 14.1 Regional Market Size and Country-Level Shares, 2025
- 14.2 Country Market Size Comparison, 2025
- 14.3 Country Market Forecasts, 2025-2035
- 14.4 Subregional Industrial and Demand Clusters
- 14.5 Intra-Regional Pricing and Cost Differences
- 14.6 Cross-Border Trade and Supply Networks
- 14.7 Regional Supply and Demand Balances
- 14.8 Country Opportunity Comparison and Prioritization
Note: Every listed country is covered on the structure shown under the first country.
Chapter 15 Asia Pacific Hypertrophic and Keloid Scar Treatment Technology, Innovation and Sustainability Outlook
- 15.1 Technology Landscape and Maturity
- 15.2 Product, Process and Service Innovation
- 15.3 AI, Automation and Digital Tools in the Industry
- 15.4 Technology Adoption and Performance Benchmarking
- 15.5 Innovation Pipeline and R&D Investment
- 15.6 Patent and Intellectual Property Trends
- 15.7 Energy Efficiency and Resource Management
- 15.8 Sustainability, Recycling and Circularity
- 15.9 Technology Roadmap, 2025-2035
- 15.10 Risks of Obsolescence and Technology Substitution
Chapter 16 Asia Pacific Hypertrophic and Keloid Scar Treatment Market Key Strategic Imperatives
- 16.1 Growth and Market Entry Priorities
- 16.2 High-Return Products and Segments
- 16.3 Pricing, Profitability and Cost Optimization
- 16.4 Technology Investment and Product Differentiation
- 16.5 Supply Chain Localization and Resilience
- 16.6 Distribution and Customer Acquisition
- 16.7 Partnership, Acquisition and Capacity Strategy
- 16.8 Regional Expansion Priorities
- 16.9 Short-, Medium- and Long-Term Actions
Chapter 17 Competition Outlook
- 17.1 Industry Competition Characteristics
- 17.2 Market Structure and Concentration
- 17.3 Market Share and Competitive Positioning, 2025
- 17.4 Company-Wise Revenue and Product Benchmarking
- 17.5 Production and Service Capacity Benchmarking
- 17.6 Technology, Pricing and Differentiation
- 17.7 Regional Footprint and Distribution Strength
- 17.8 Mergers, Acquisitions and Strategic Alliances
- 17.9 New Entrants and Competitive Threats
- 17.10 Porter's Five Forces and Industry Attractiveness
- 17.11 Competitive Outlook, 2025-2035
Chapter 18 Company Profiles
- 18.1 Company Coverage and Selection Criteria
- 18.2 Mölnlycke Health Care
- 18.2.1 Business Description
- 18.2.2 Company Ownership and Geographic Presence
- 18.2.3 Product and Service Portfolio
- 18.2.4 Manufacturing and Operating Footprint
- 18.2.5 Production Capacity and Expansion Plans
- 18.2.6 Financial Performance and Investment
- 18.2.7 Market Share and Competitive Position
- 18.2.8 Technology and Innovation Capabilities
- 18.2.9 Strategic Alliances or Partnerships
- 18.2.10 Recent Developments
- 18.2.11 Growth Strategy and Outlook
- 18.3 Alliance Pharmaceuticals
- 18.4 Merz Therapeutics
- 18.5 Smith+Nephew
- 18.6 Lumenis
- 18.7 Solta Medical
- 18.8 Cynosure Lutronic
- 18.9 Menarini Asia-Pacific
- 18.10 Stratpharma
- 18.11 Candela
- 18.12 Other Relevant Market Participants
Note: Every listed company is profiled on the structure shown under the first company. The company list is preliminary and may change based on research findings, market developments, data availability and client requirements.
Chapter 19 Disclaimer
- 19.1 Research and Forecast Disclaimer
- 19.2 Data Source and Estimation Limitations
Note: The depth of individual sections depends on data availability for this market. Volume, capacity, trade and other unit-based metrics are included where applicable.

