
Funded enzyme therapy shapes care for an ultra-rare disease
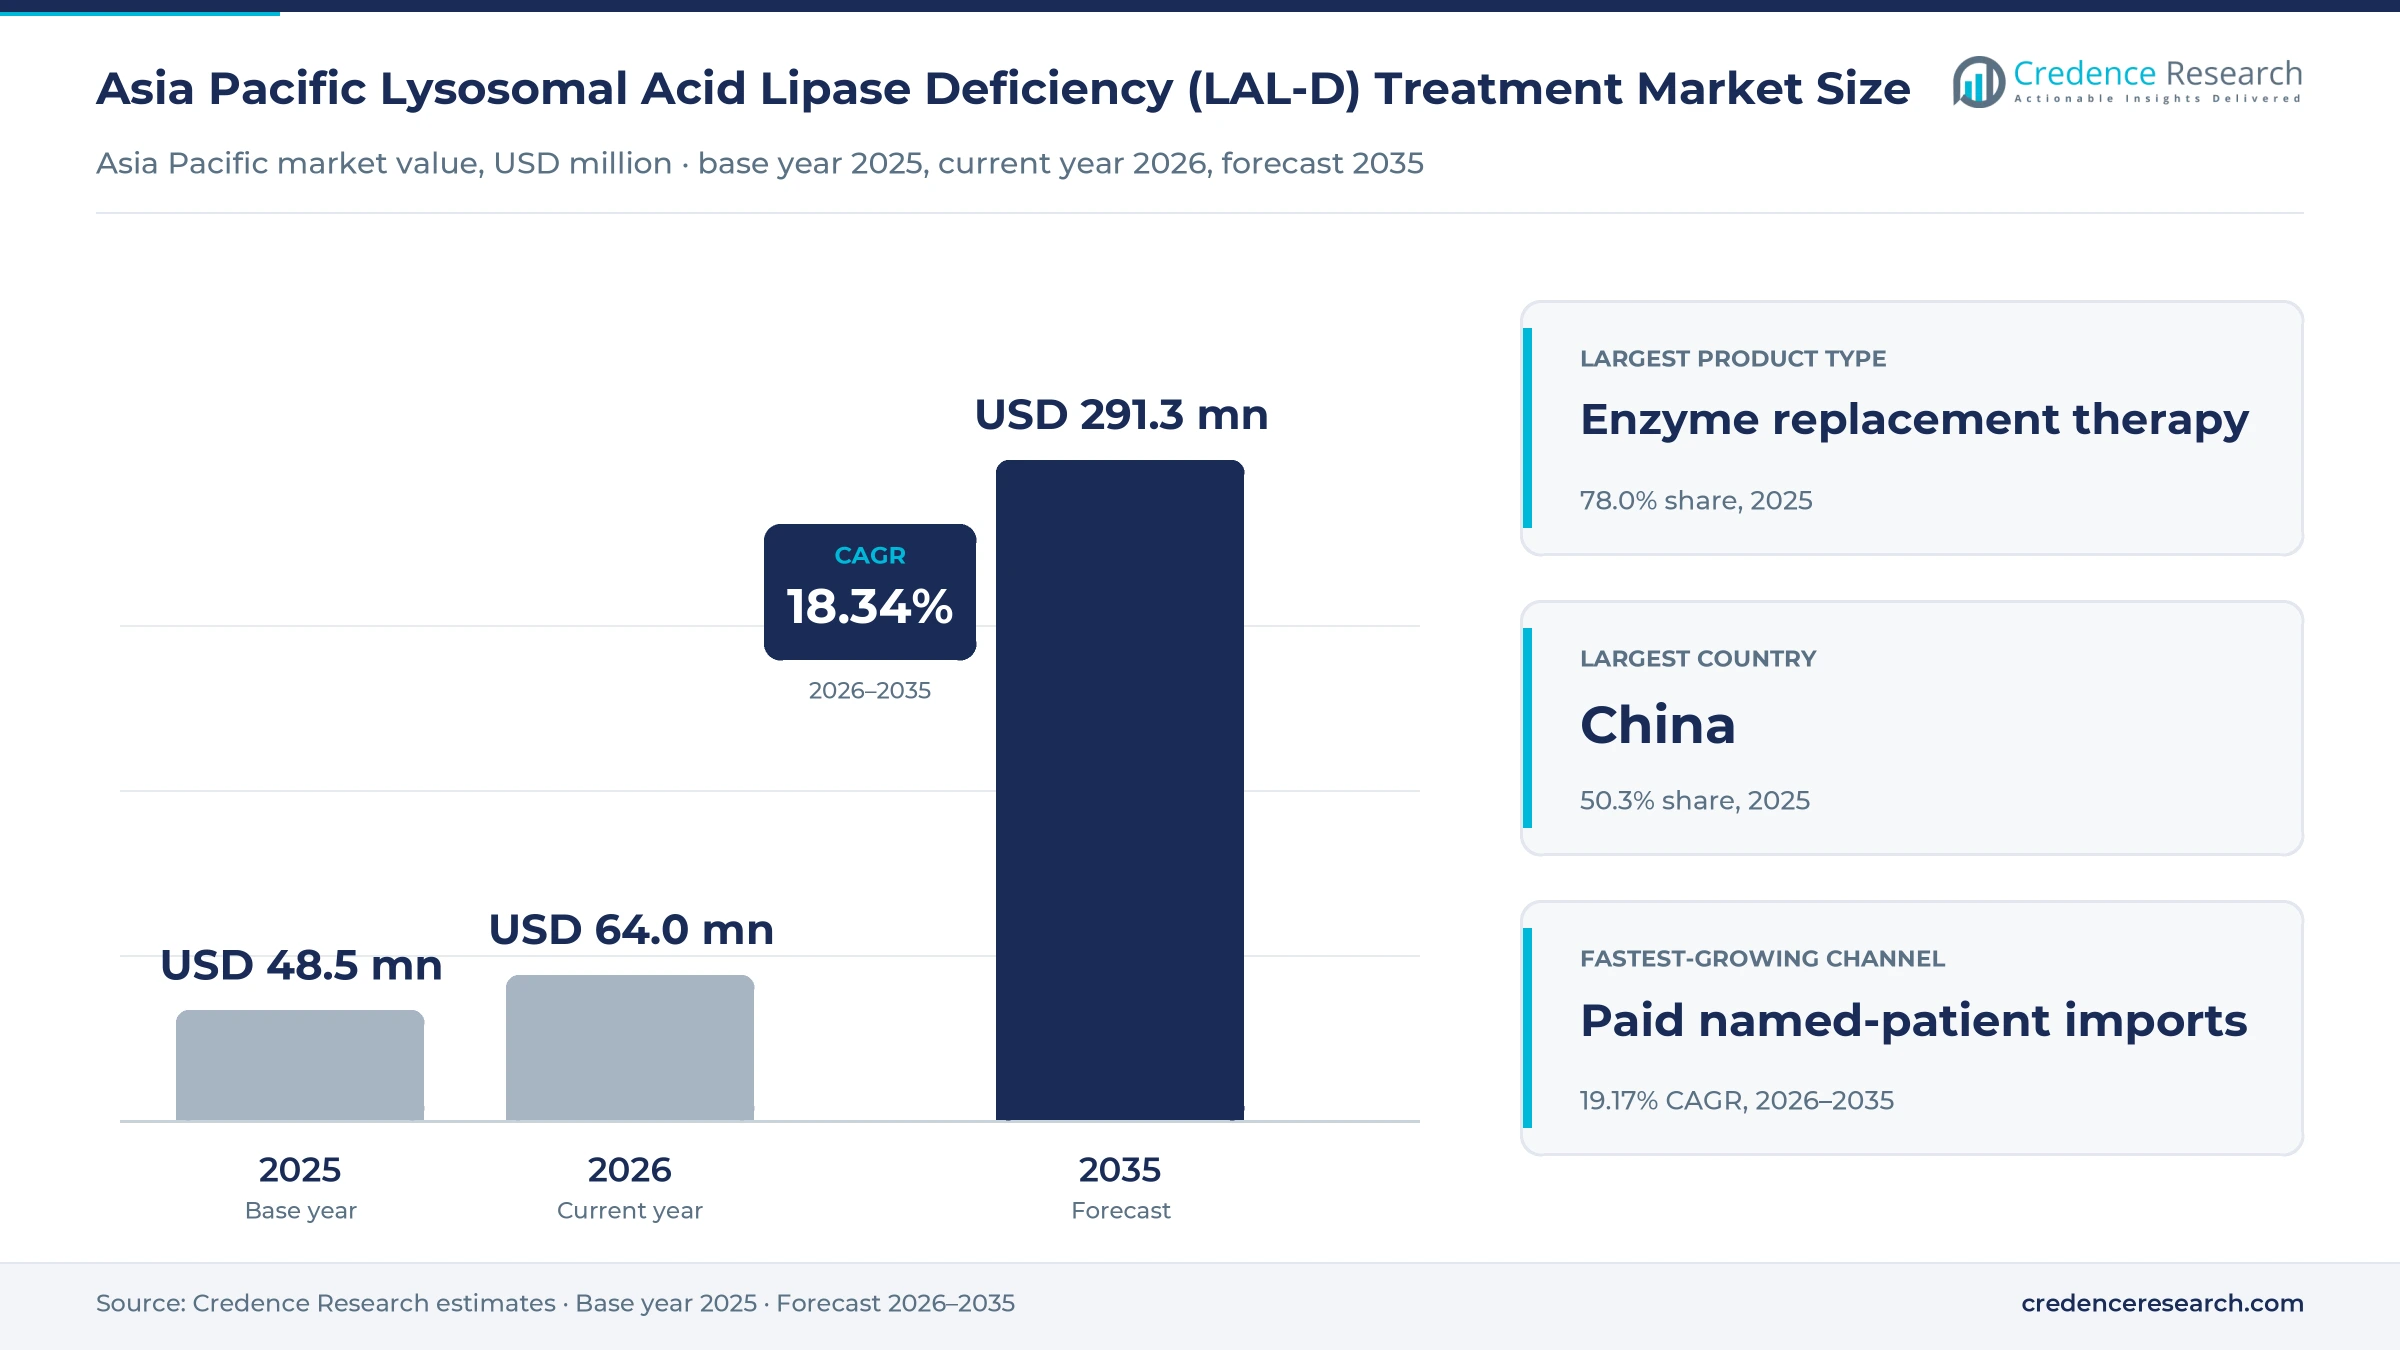
The Asia Pacific lysosomal acid lipase deficiency (LAL-D) treatment market was valued at USD 48.5 million in 2025 and is projected to increase from USD 64.0 million in 2026 to USD 291.3 million by 2035, registering a CAGR of 18.34% during 2026–2035. Demand comes from specialist hospitals that treat infants with rapidly progressive disease, from liver clinics that manage children and adults with later-onset forms, and from families who pay for imported therapy where public funding is limited. China held the largest country share, 50.3% in 2025, because its large population yields the most diagnosed patients even at very low disease frequency. China is also the fastest-growing country at 18.89% a year, as rare disease catalogs and reimbursement reform widen access to high-cost medicines. Enzyme replacement therapy accounts for most spending, while lipid-modifying medicines and liver support form smaller shares of care. Australia also funds enzyme therapy for infants through a federal program that opened in April 2023.
Which therapies and patient groups does the estimate count?
The estimate measures spending on medicines and supportive care for lysosomal acid lipase deficiency in China, Japan and the other covered Asia Pacific markets. It counts enzyme replacement therapy, lipid-modifying medicines used to control cholesterol, and hepatic and nutritional support prescribed for the disease. Values are stated at the prices paid by public programs, hospitals, insurers and families, including imports supplied on a named-patient basis.
The estimate excludes diagnostic testing, liver transplant surgery and general hospital stays when billed separately. The value chain runs from the enzyme originator and generic lipid drug makers through importers and specialty distributors to metabolic and liver centers, where specialists confirm the diagnosis and manage long-term infusion schedules.
Asia Pacific Lysosomal Acid Lipase Deficiency (LAL-D) Treatment Market Insights
- Asia Pacific LAL-D treatment spending was valued at USD 48.5 million in 2025 and is projected to reach USD 291.3 million by 2035, at an 18.34% CAGR during 2026–2035.
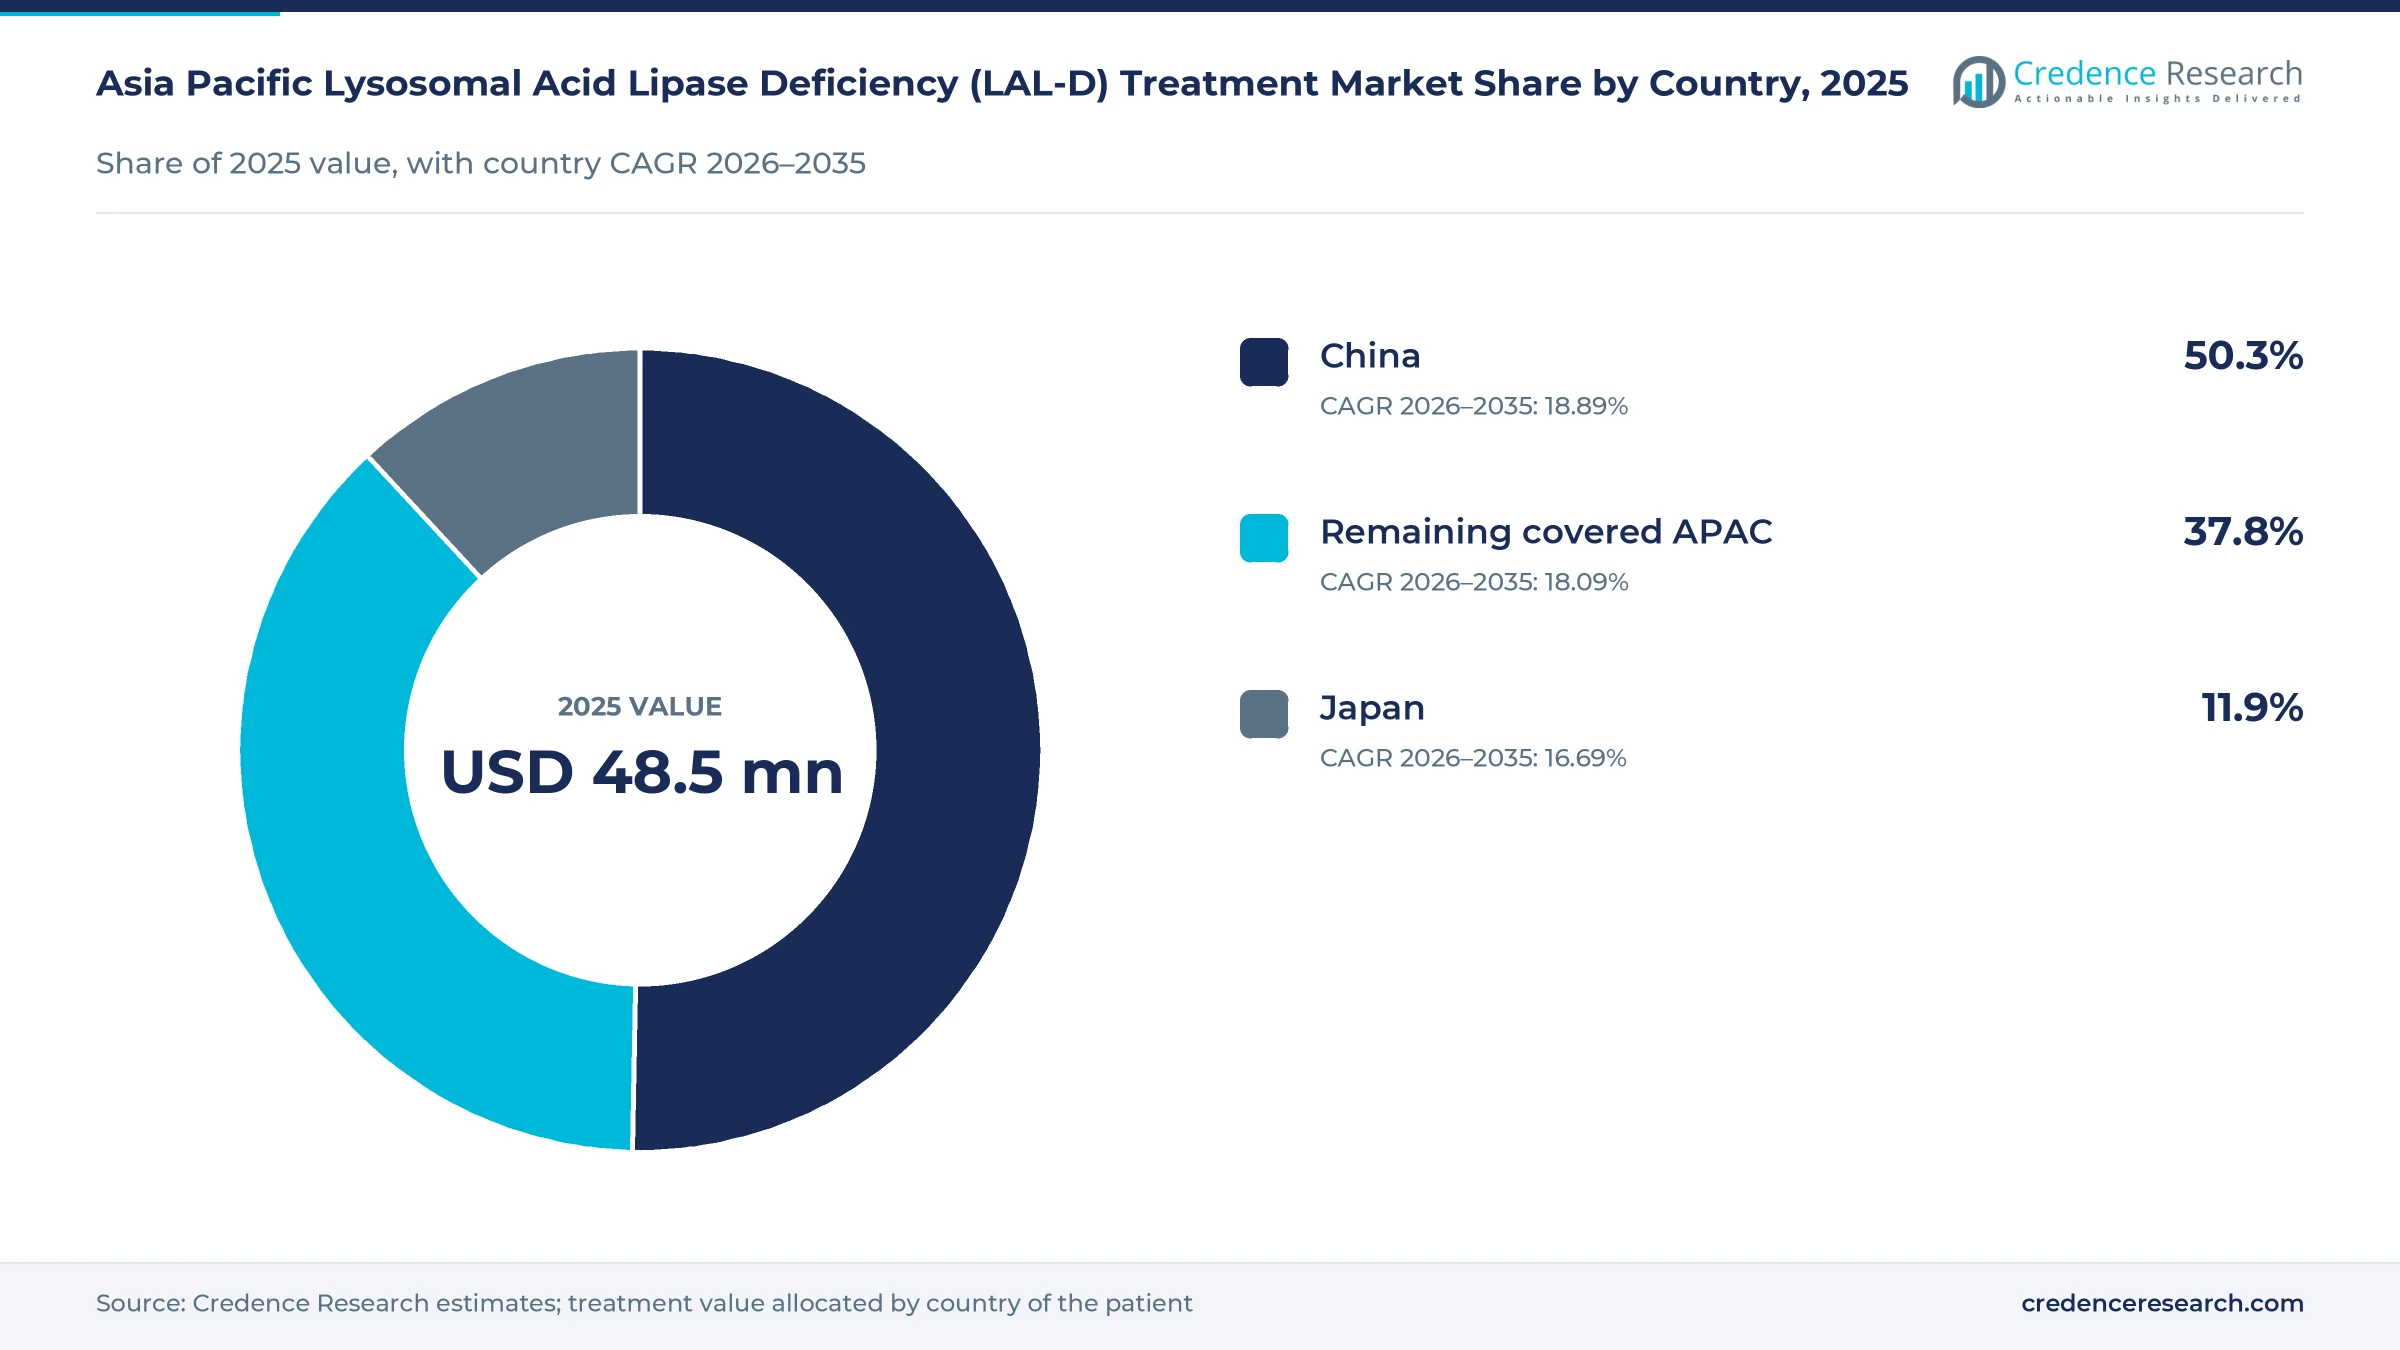
- China held a 50.3% share of 2025 value, because its large population yields the most diagnosed patients even though the disease is ultra-rare.
- Enzyme replacement therapy led with a 78.0% share of 2025 value, because weekly or fortnightly weight-based infusions continue for many years.
- China released its second rare disease catalog on Sept. 20, 2023, adding 86 conditions and taking the national total to 207 diseases.
- Australia made sebelipase alfa free for eligible infants through its Life Saving Drugs Program from April 1, 2023.
Enzyme therapy leads as mixed later-onset cases grow fastest
Why does enzyme replacement dominate spending?
Based on product type, the market is categorized into enzyme replacement therapy, lipid-modifying medicines and hepatic and nutritional support. Enzyme replacement therapy led with a 78.0% share of 2025 value, because it is the only therapy that replaces the missing enzyme and carries a high price per dose. Enzyme replacement therapy grows fastest at 18.61% a year, as more later-onset patients start regular infusions.
Why do children and adolescents hold the largest share?
Based on end user, the market is categorized into infants, children and adolescents, and adults. Children and adolescents led with a 43.0% share of 2025 value, because many later-onset cases are found during school-age liver checks. Adults grow fastest at 18.79% a year, as liver clinics test more patients with unexplained fatty liver and high cholesterol.
How does later-onset disease shape demand?
Based on disease area, the market is categorized into infantile-onset LAL-D, later-onset hepatic-predominant LAL-D and later-onset mixed hepatic-lipid LAL-D. Later-onset hepatic-predominant LAL-D led with a 46.0% share of 2025 value, because liver enlargement and raised liver enzymes prompt most referrals. Later-onset mixed hepatic-lipid LAL-D grows fastest at 18.90% a year, as lipid clinics recognize the disease behind early high cholesterol.
Why are named-patient imports growing fastest?
Based on channel, the market is categorized into public funded procurement, private paid procurement and paid named-patient imports. Public funded procurement led with a 52.0% share of 2025 value, because programs in Japan and Australia pay for most enzyme therapy. Paid named-patient imports grow fastest at 19.17% a year, as families in markets without local supply seek therapy through approved import routes.
| Segment Group | Leading Sub-segment | Share, 2025 | Fastest-growing Sub-segment | CAGR, 2026–2035 |
|---|---|---|---|---|
| By Product Type | Enzyme replacement therapy | 78.0% | Enzyme replacement therapy | 18.61% |
| By End User | Children and adolescents | 43.0% | Adults | 18.79% |
| By Disease Area | Later-onset hepatic-predominant LAL-D | 46.0% | Later-onset mixed hepatic-lipid LAL-D | 18.90% |
| By Channel | Public funded procurement | 52.0% | Paid named-patient imports | 19.17% |
Request a Free Sample
Fill in your details and we'll send you a free sample report.
- Sample data tables & charts
- Research methodology
Case finding and funding programs lift patient counts
How does targeted case finding lift treated patient numbers?
Targeted case finding lifts treated patient numbers, because many later-onset cases are first labeled as fatty liver or high cholesterol. Lysosomal acid lipase deficiency is estimated to occur in 1 in 40,000 to 300,000 people, according to MedlinePlus, which leaves many undiagnosed patients across large Asian populations. The median age of onset is 5.8 years, and the disease can be confirmed with a simple blood test of enzyme activity. In Australia, program rules require enzyme testing at the National Referral Laboratory, with genetic results due within eight weeks of starting therapy. As a result, children and adolescents hold a 43.0% share of 2025 value, as liver clinics refer patients with unexplained enzyme rises for genetic testing for rare conditions.
Why do formal funding pathways widen access?
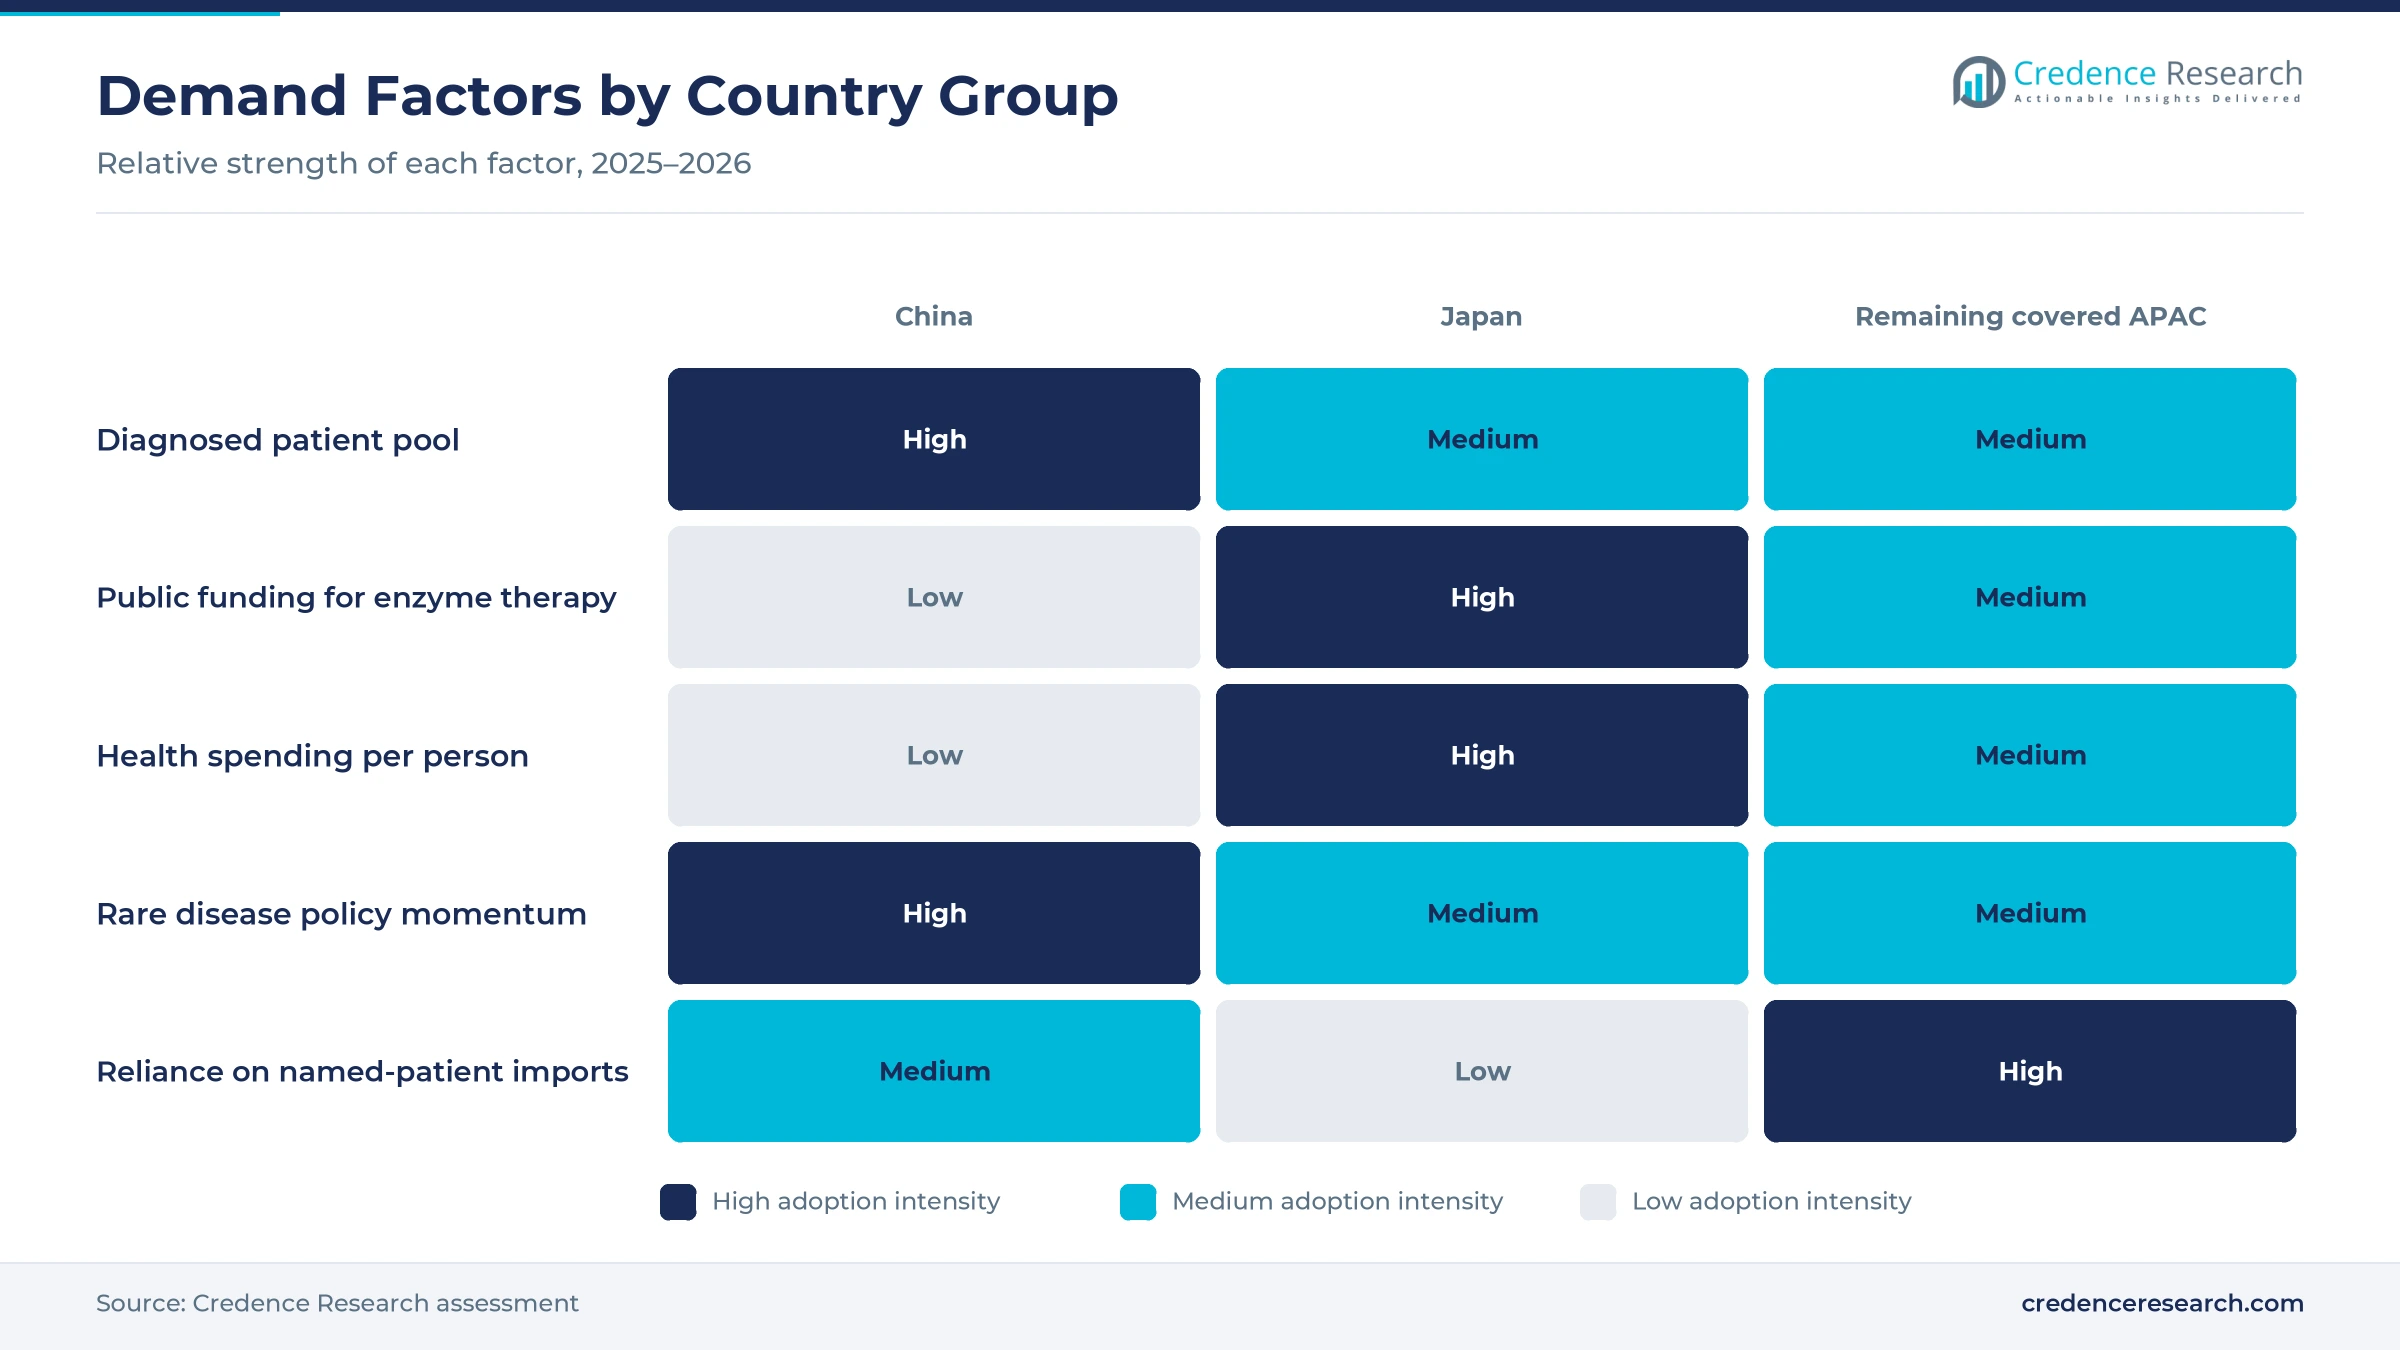
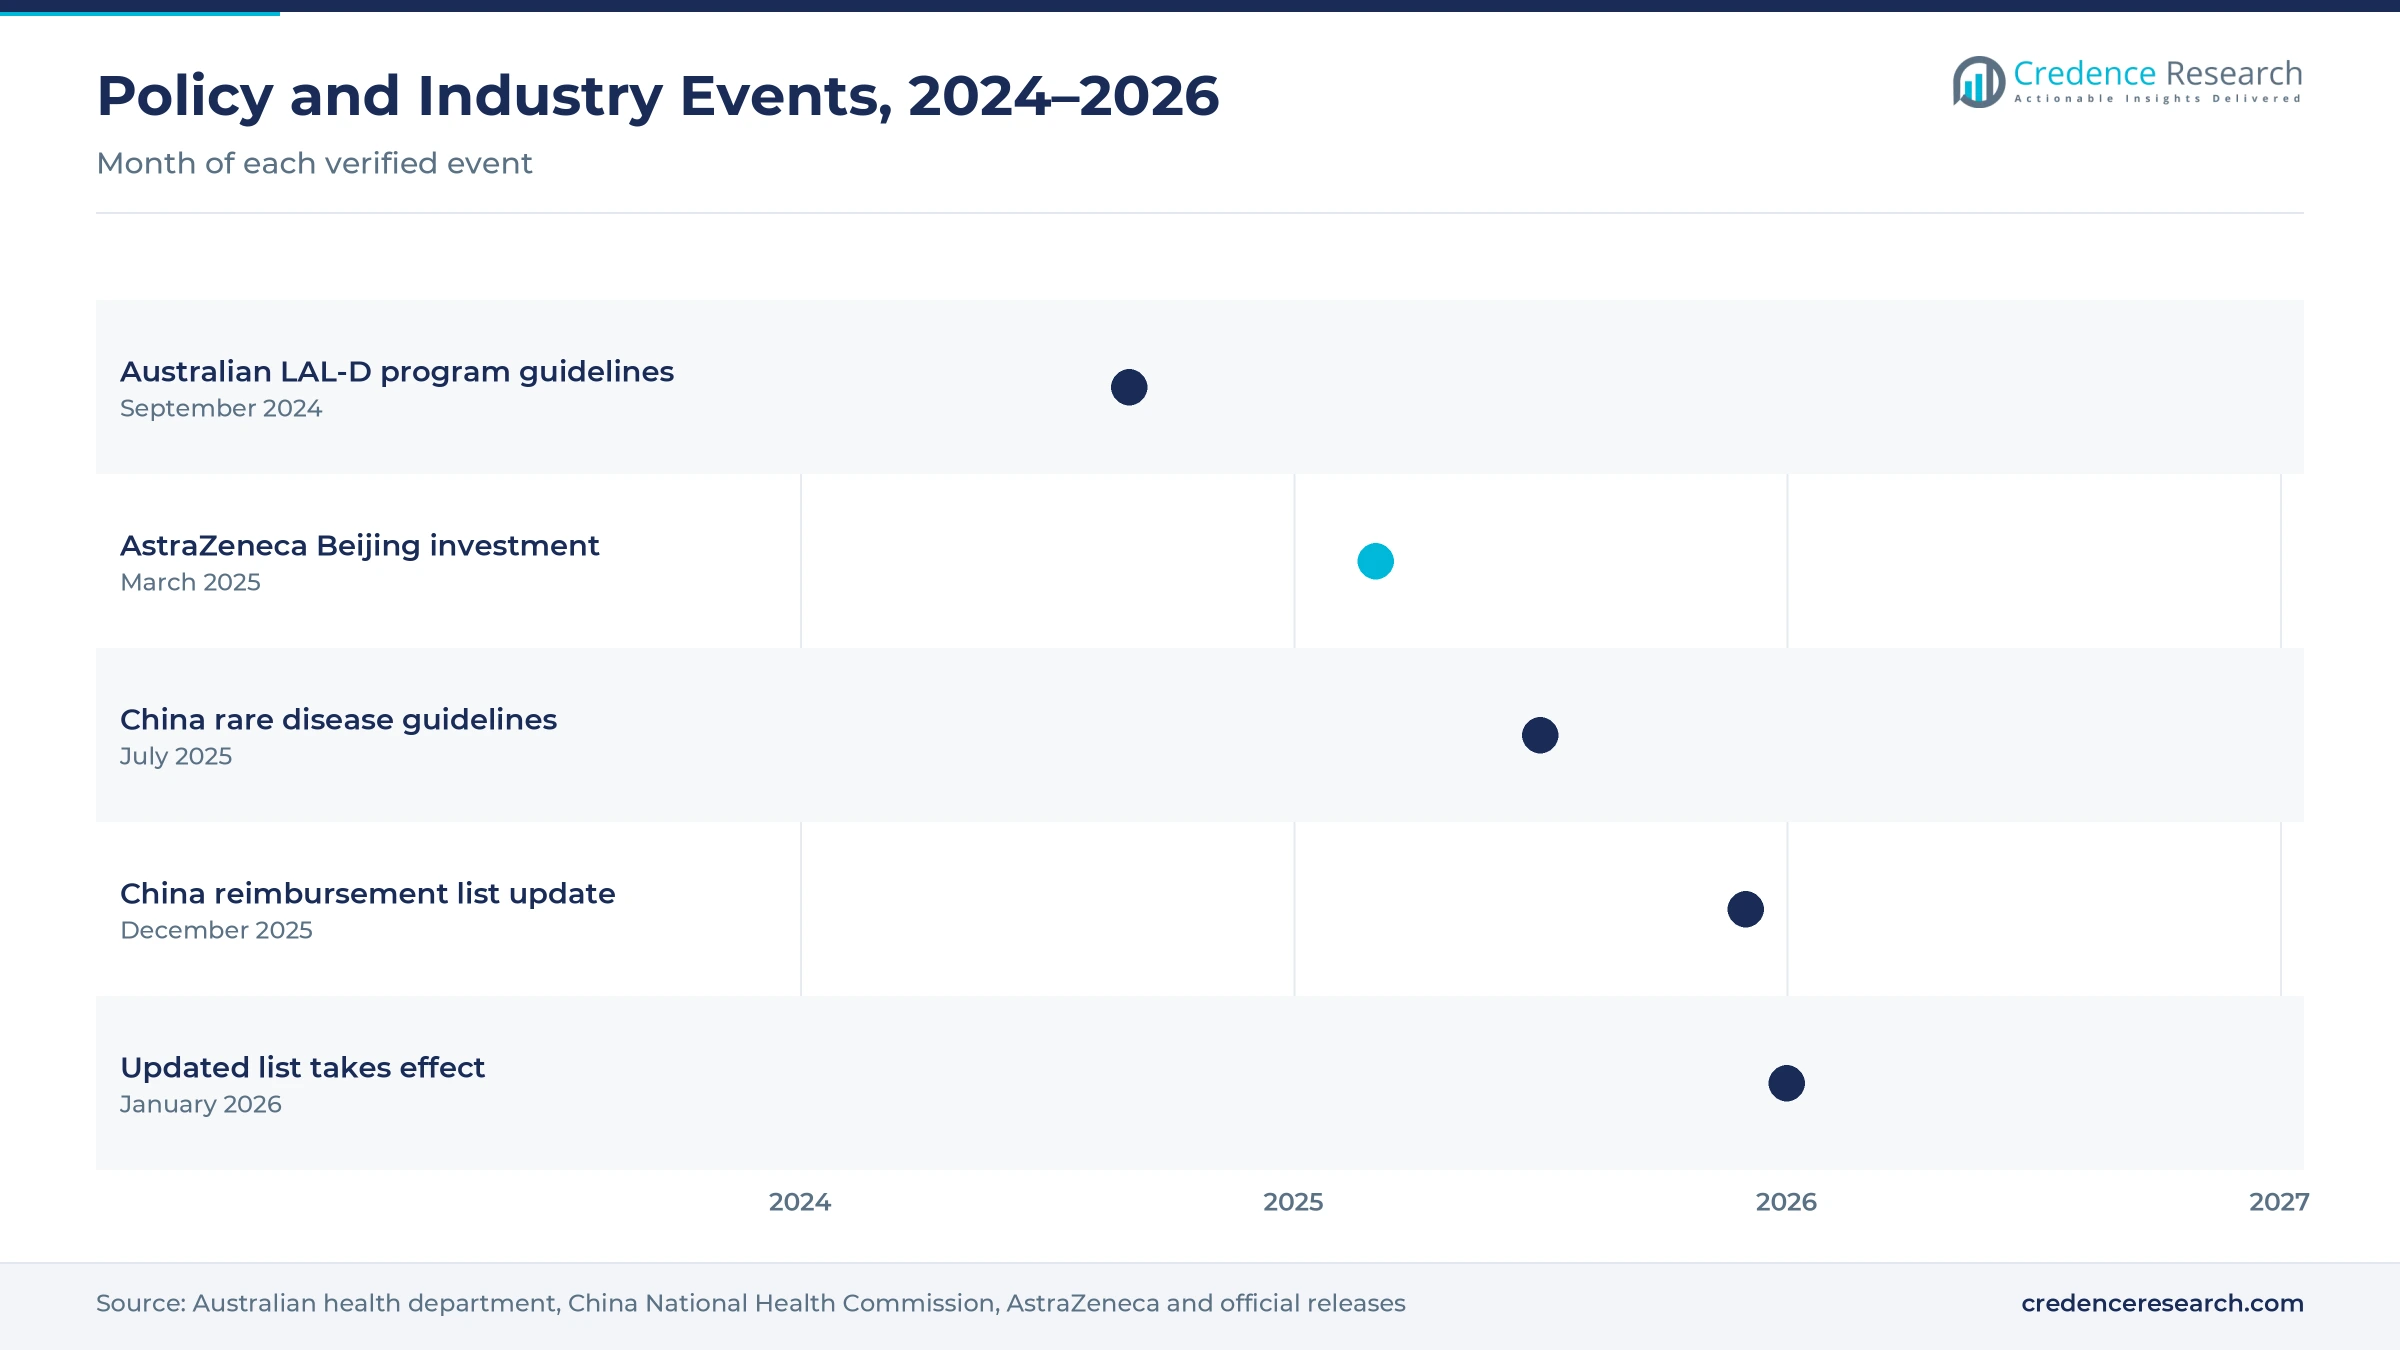
Formal funding pathways widen access, because enzyme therapy costs are too high for most families to pay privately over many years. Australia gave eligible infants free access to sebelipase alfa from April 1, 2023, and its program guidelines require diagnosis before 12 months of age. China released its second rare disease catalog on Sept. 20, 2023, adding 86 conditions and taking the national total to 207 diseases. China's insurance agency also added 114 medicines to its national reimbursement list for 2025, and the updated list took effect on Jan. 1, 2026. In turn, public funded procurement holds a 52.0% share of 2025 value, as hospitals buy enzyme therapy through approved programs rather than direct patient payment.
How does recurring treatment demand support steady value?
Recurring treatment demand supports steady value, because enzyme replacement is given as regular long-term infusions rather than a single course. Australian program rules allow a maximum subsidized dose of 5 mg/kg each week, and patients must reapply by May 1 each year with fresh clinical results. Infants with rapidly progressive disease die at a median age of 3.7 months without therapy, while 6 of 9 treated infants in trials survived beyond 12 months, according to Alexion. Treatment breaks of up to three months are allowed without a new application, which shows therapy is expected to continue for years. As a result, enzyme replacement therapy holds a 78.0% share of 2025 value, because weight-based doses rise as children grow.
Why does health spending capacity split demand by country?
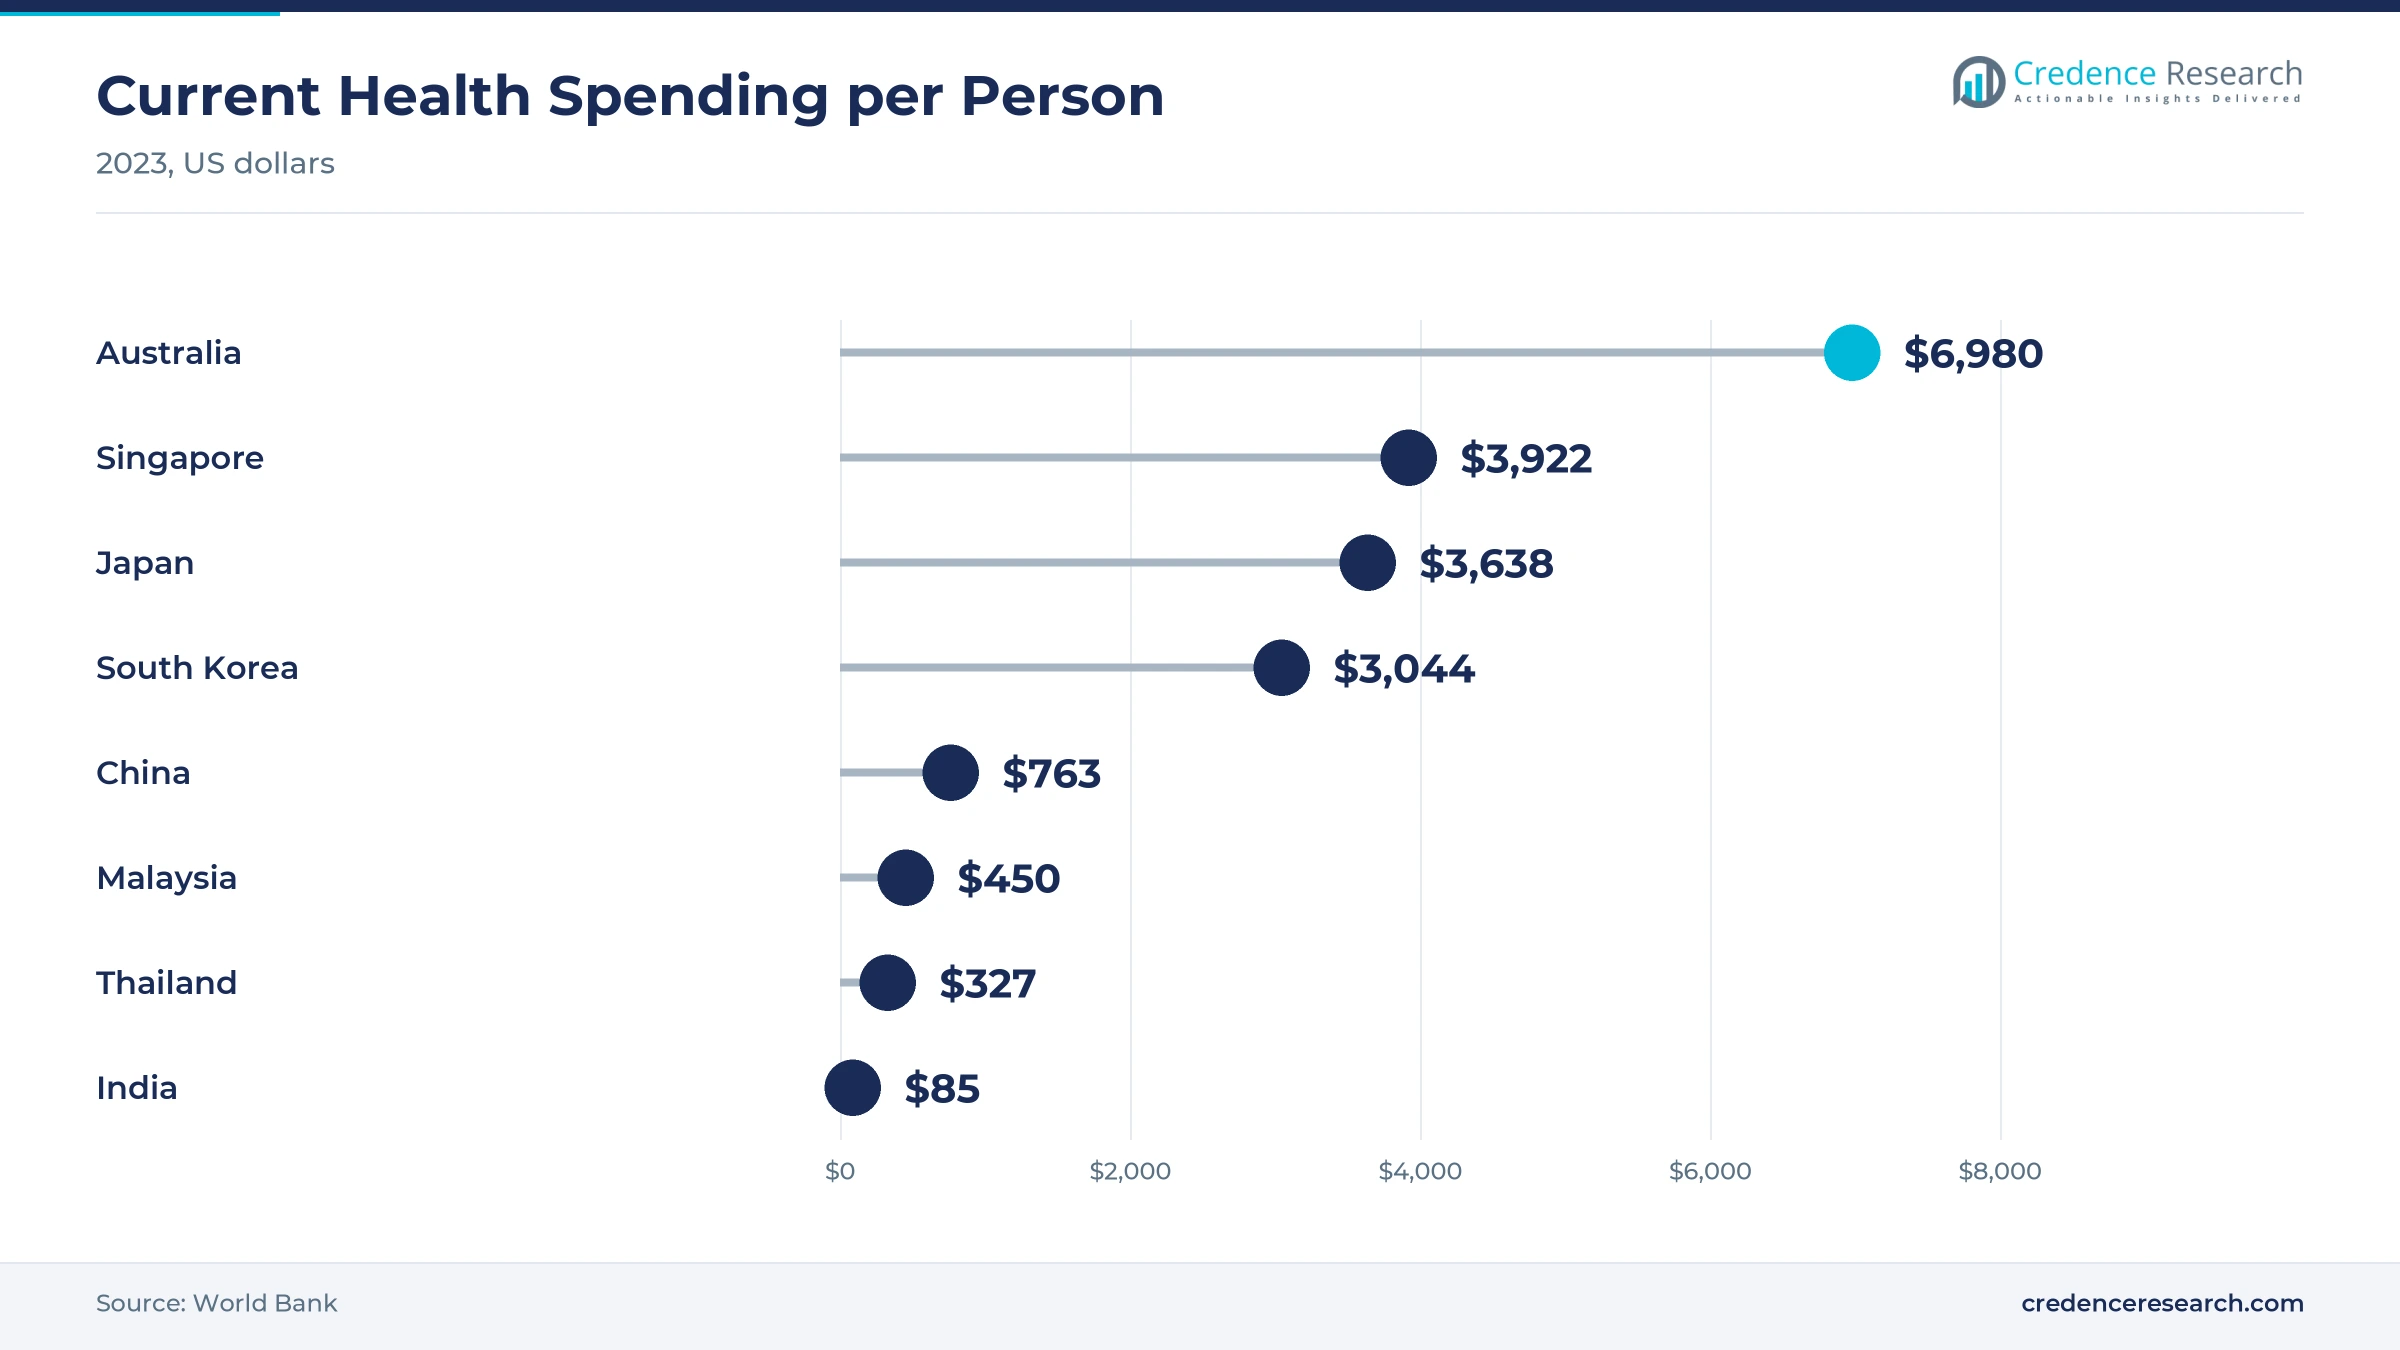
Health spending capacity splits demand by country, because funded access to ultra-rare therapies tracks how much each health system spends per person. Current health spending reached US$3,638 per person in Japan and US$6,980 in Australia in 2023, against US$763 in China and US$85 in India, according to World Bank data. Singapore spent US$3,922 and South Korea US$3,044 per person in the same year, which supports paid access in smaller markets. Japan also approved sebelipase alfa for patients of all ages in March 2016, the first approved therapy for the disease in the country. In turn, Japan holds 11.9% of 2025 value, while China gains share as public coverage expands from a low base.
National guidelines and drug investment reshape access
How is the shift to national rare disease guidelines changing care?
The shift to national rare disease guidelines is changing care, because shared diagnostic standards help general hospitals recognize patients sooner. China's National Health Commission released a second batch of diagnosis and treatment guidelines for 86 rare diseases in July 2025, according to the commission. The first batch, published in 2019, covered 121 diseases, and Peking Union Medical College Hospital helped compile the new set. The commission also counts about 20 million rare disease patients in China, with more than 200,000 new cases each year. As a result, later-onset hepatic-predominant LAL-D holds a 46.0% share of 2025 value, as liver specialists follow clearer referral steps for unexplained liver enlargement.
Why is the rise of multinational investment in China important?
The rise of multinational investment in China matters, because companies that build local research and supply capacity can bring rare disease medicines to patients faster. On March 21, 2025, AstraZeneca announced a US$2.5 billion investment in Beijing to set up its sixth global strategic research center, its second in China. The company expects its Beijing workforce to grow to 1,700 employees under the five-year plan. The investment also includes agreements with Harbour BioMed, Syneron Bio and BioKangtai. In turn, China stays the largest country market, and local presence supports wider supply of rare disease medicines across the country.
Can earlier treatment of later-onset liver disease open demand?
Earlier treatment of later-onset liver disease opens demand, because damage builds silently for years before symptoms appear. About 50% of children and adults in an observational study progressed to fibrosis, cirrhosis or liver transplant within three years. In a trial of patients aged 4 to 58, liver enzyme levels returned to normal in 31% on enzyme therapy versus 7% on placebo. Sun Pharma also launched the oral cholesterol drug Brillo in India in May 2022, which widens options for lowering LDL cholesterol alongside hyperlipidemia drugs. As a result, later-onset mixed hepatic-lipid LAL-D grows at 18.90% a year, the fastest disease area through 2035.
Is there room for paid access outside public programs?
Paid access outside public programs creates room for suppliers, because many patients fall outside current funding rules. Australia funds enzyme therapy only for infantile-onset disease confirmed before 12 months, which leaves later-onset patients to other routes. The program also does not fund diagnostic testing, so families and hospitals pay for some tests directly. China launched a commercial insurance directory of 19 high-value treatments in December 2025, covering drugs for rare diseases such as neuroblastoma and Gaucher disease. In turn, paid named-patient imports grow at 19.17% a year, the fastest channel, as private insurers and families fund therapy where public lists do not.
Late diagnosis, cost and small cohorts slow wider uptake
How does late diagnosis limit treated patient numbers?
Late diagnosis limits treated patient numbers, because symptoms resemble common fatty liver disease and familial high cholesterol. Many hospitals in the region lack enzyme assays, so samples travel to distant reference laboratories. As a result, some patients reach cirrhosis before therapy begins, which lowers the benefit of treatment. Specialists respond with dried blood spot testing, referral networks and education for liver and lipid clinics. These steps shorten the path to lysosomal acid lipase deficiency treatment for patients outside major cities.
Why does therapy cost strain public budgets?
Therapy cost strains public budgets, because enzyme replacement is priced for very small patient groups and continues for life. Payers in lower-income markets cannot fund it for every eligible patient. In turn, coverage often starts with infants, while older patients wait for wider listing. Suppliers respond with managed access programs, patient registries and evidence packages that track liver outcomes over time. Payers can then judge lysosomal acid lipase deficiency treatment on measured benefit.
How do small patient cohorts weaken evidence?
Small patient cohorts weaken evidence, because ultra-rare diseases produce few local trial participants in each country. Regulators and payers then rely on global data with limited Asian representation. As a result, reviews take longer and may attach strict conditions to funding. Companies respond with regional registries, real-world studies and data sharing between metabolic centers that treat the same rare conditions. Shared data also helps smaller countries review new listings faster.
Why do infusion logistics affect continuity?
Infusion logistics affect continuity, because biologic enzyme products need cold storage and regular hospital visits. Families in rural areas may travel long distances every one or two weeks for each dose. In turn, missed infusions can reduce benefit and raise the risk of complications. Providers respond with home infusion where allowed, shared care with local hospitals and planned supply through specialty distributors. These steps keep patients on schedule for lysosomal acid lipase deficiency treatment over many years.
China leads demand while Japan keeps a stable funded base
| Country | Value, 2025 (USD million) | Share, 2025 | CAGR, 2026–2035 |
|---|---|---|---|
| China | 24.4 | 50.3% | 18.89% |
| Remaining covered APAC | 18.3 | 37.8% | 18.09% |
| Japan | 5.8 | 11.9% | 16.69% |
Why does China hold the largest share of demand?
China held a 50.3% share of 2025 value and grows fastest at 18.89% a year, because its large population produces the most patients even at very low disease frequency. The country now lists 207 conditions across two rare disease catalogs, and its reimbursement list added 114 medicines for 2025. However, spending per patient remains lower than in Japan, because current health spending was US$763 per person in 2023. Wider guidelines and commercial insurance should lift treated patient numbers through 2035.
How do the remaining covered markets add funded and paid demand?
The remaining covered Asia Pacific markets held a 37.8% share of 2025 value and grow at 18.09% a year, because the group mixes high-spending systems with fast-growing ones. Australia funds therapy for infants through its Life Saving Drugs Program, while Singapore and South Korea spend more than US$3,000 per person on health. In turn, India and Southeast Asia rely more on paid named-patient imports and charity access. Wider testing in these markets should add later-onset patients through 2035.
Why does Japan keep a stable funded base?
Japan held 11.9% of 2025 value and grows at 16.69% a year, because enzyme therapy has been approved there for patients of all ages since March 2016. Universal insurance covers most treatment costs, which keeps diagnosed patients on long-term infusions. However, growth is slower than in China because the population is shrinking and many known patients already receive therapy. Better recognition of later-onset cases in adult liver clinics should still add a small number of new patients each year.
Funding rules and rare disease policy marked 2024 to 2026
| Development | Status and market relevance |
|---|---|
| In September 2024, the Australian health department issued updated guidelines for infantile-onset LAL-D under its Life Saving Drugs Program. | Set diagnosis before 12 months and a 5 mg/kg weekly dose cap |
| In March 2025, AstraZeneca announced a US$2.5 billion investment in Beijing research and manufacturing. | Created its sixth global strategic research center and second in China |
| In July 2025, China's National Health Commission released diagnosis and treatment guidelines for 86 more rare diseases. | Gave hospitals shared standards for diagnosis and long-term management |
| In December 2025, China's insurance agency added 114 medicines to its reimbursement list and set up a commercial directory. | Opened a second payment route for 19 high-value treatments from January 2026 |
Enzyme assays and recombinant enzyme define current care
- Recombinant enzyme replacement supplies the missing lysosomal acid lipase by intravenous infusion, which clears stored fats from the liver and other organs.
- Dried blood spot enzyme assays measure enzyme activity from a small blood sample, which lets clinics send tests to distant reference laboratories.
- LIPA gene sequencing confirms the diagnosis and supports family testing, which program rules in Australia require within eight weeks of starting therapy.
- Oral lipid-lowering therapy reduces LDL cholesterol in later-onset patients, which complements enzyme replacement therapies but does not correct the enzyme defect.
Need a Custom Version of This Report?
Tailor the scope, geography, or segments to your exact requirements.
- Custom geography or segment scope
- Direct access to our analyst team
One enzyme originator faces generic lipid drug suppliers
Competition is shaped by a single enzyme originator and a wider group of lipid drug makers. AstraZeneca, through its Alexion rare disease unit, markets sebelipase alfa, the only enzyme replacement therapy for the disease, which was approved in Japan in March 2016 for patients of all ages. The company also announced a US$2.5 billion Beijing investment in March 2025. Takeda, based in Tokyo, works on other lysosomal storage disorders and, with Teva, set up Teva Takeda Yakuhin in April 2016 to sell generic medicines in Japan. Sun Pharma launched the oral cholesterol drug Brillo in India in May 2022, while Lupin makes atorvastatin tablets at its Nagpur plant in India. Suppliers compete on access programs, diagnostic support, reliable cold storage and evidence that convinces payers.
Companies profiled and their roles in this market
| Company | Type | Role in the market |
|---|---|---|
| AstraZeneca PLC / Alexion | Originator | Markets sebelipase alfa, approved in Japan since March 2016 |
| Takeda Pharmaceutical Company | Rare disease and generics partner | Co-owns Teva Takeda Yakuhin in Japan |
| Teva Pharmaceutical Industries | Generic supplier | Sells generics in Japan through Teva Takeda Yakuhin |
| Sun Pharmaceutical Industries | Lipid drug supplier | Launched oral lipid-lowering drug Brillo in India |
| Lupin Limited | Generic lipid drug maker | Makes atorvastatin tablets at Nagpur in India |
Credence Research view on regional rare liver disease care
Credence Research's view is that Asia Pacific demand for lysosomal acid lipase deficiency treatment will grow quickly from a small base, because diagnosis is improving and funding programs are slowly widening. Enzyme replacement therapy will remain the core of spending, while later-onset liver and lipid cases supply most new patients. China should add the most value as rare disease policy and commercial insurance mature. However, high prices, late diagnosis and small patient cohorts will keep uptake uneven. Suppliers that invest in testing networks and access programs should gain the most.
Health program rules and public data anchor the sizing
The report uses 2025 as the base year on a calendar basis, and market values come from the Credence Research model. That model combines disease frequency data from MedlinePlus, Australian Life Saving Drugs Program rules, Chinese rare disease catalogs and reimbursement notices, World Bank health spending data and company announcements. Country shares follow the client split for 2025, while segment splits and growth rates are Credence Research estimates. Sources used are public reports, official statistics, regulatory documents and company releases, and no interviews or surveys were used.
Earlier diagnosis and funded access carry growth to 2035
LAL-D treatment spending in the Asia Pacific is expected to reach USD 291.3 million by 2035, an 18.34% CAGR during 2026–2035, as earlier diagnosis, wider funding and long-term infusions lift demand. Growth should be strongest in China, where rare disease catalogs, national guidelines and commercial insurance open new payment routes. After that, later-onset patients found in liver and lipid clinics should carry more growth. Tighter public budgets would lower this outlook, while new listings for older patients would raise it. Suppliers with strong diagnostic support are expected to gain the most.
Frequently Asked Questions
How big is the Asia Pacific LAL-D treatment market?
Which product type leads LAL-D treatment spending?
Which country leads the Asia Pacific LAL-D treatment market?
How common is lysosomal acid lipase deficiency?
How does Australia fund enzyme therapy for LAL-D?
Which channel is growing fastest?
Who are the leading suppliers in the region?
What are the main challenges for LAL-D treatment?
Table of Content
Chapter 1 Market Segmentation
- 1.1 Segmentation Framework
- 1.1.1 Product and Service Classification
- 1.1.2 Application and End-Use Classification
- 1.1.3 Technology and Solution Classification
- 1.1.4 Customer and Distribution Channel Classification
- 1.1.5 Geographic Segmentation
- 1.1.6 Market Segment Definitions and Boundaries
- 1.2 By Product Type
- 1.2.1 Enzyme replacement therapy
- 1.2.2 Lipid-modifying medicines
- 1.2.3 Hepatic and nutritional support
- 1.3 By End User
- 1.3.1 Infants
- 1.3.2 Children and adolescents
- 1.3.3 Adults
- 1.4 By Disease Area
- 1.4.1 Infantile-onset LAL-D
- 1.4.2 Later-onset hepatic-predominant LAL-D
- 1.4.3 Later-onset mixed hepatic-lipid LAL-D
- 1.5 By Channel
- 1.5.1 Public funded procurement
- 1.5.2 Private paid procurement
- 1.5.3 Paid named-patient imports
- 1.6 By Country
- 1.6.1 China
- 1.6.2 Remaining covered APAC
- 1.6.3 Japan
Chapter 2 Introduction
- 2.1 Report Objectives and Scope
- 2.2 Product Definition and Industry Terminology
- 2.3 Market Inclusions and Exclusions
- 2.4 Research Process
- 2.4.1 Primary Research and Expert Interviews
- 2.4.2 Secondary Research and Source Review
- 2.4.3 Top-Down and Bottom-Up Estimation
- 2.4.4 Data Triangulation and Verification
- 2.5 Market Size Measurement Basis
- 2.5.1 2025: USD 48.5 million → 2035: USD 291.3 million
- 2.6 Historical and Forecast Reference Periods
- 2.6.1 Historical Period: 2018-2025
- 2.6.2 Base Year: 2025
- 2.6.3 Forecast Period: 2025-2035
- 2.7 Research Assumptions and Limitations
Chapter 3 Executive Summary
- 3.1 Market Snapshot and Key Findings
- 3.2 Base-Year Market Size, 2025
- 3.3 Forecast Market Size, 2035
- 3.4 Revenue and Volume Growth Outlook
- 3.5 Key Demand and Supply Indicators
- 3.6 Leading Market Segments
- 3.7 Fastest-Growing Market Opportunities
- 3.8 Regional Performance Highlights
- 3.9 Technology and Industry Transformation
- 3.10 Competitive Landscape Summary
- 3.11 Analyst View and Strategic Implications
Chapter 4 Asia Pacific Lysosomal Acid Lipase Deficiency (LAL-D) Treatment Market Trends and Developments
- 4.1 Historical Industry Development, 2018-2025
- 4.2 Recent Market Trends and Developments
- 4.3 Demand and Customer Behavior Trends
- 4.4 Technology and Product Innovation
- 4.5 Artificial Intelligence, Automation and Digitalization
- 4.6 Local Manufacturing and Supply Chain Realignment
- 4.7 Industry Partnerships, Mergers and Acquisitions
- 4.8 Sustainability and Circular Economy Developments
- 4.9 Government and Private Sector Investment Trends
- 4.10 Emerging Business Models and Commercialization
- 4.11 Industry Developments and Announcements
Chapter 5 Asia Pacific Lysosomal Acid Lipase Deficiency (LAL-D) Treatment Market Production, Supply and Demand Analysis
- 5.1 Demand Trend and Consumption Analysis, 2018-2025
- 5.2 Demand Forecast, 2025-2035
- 5.3 Production and Output Trend, 2018-2025
- 5.4 Production and Output Forecast, 2025-2035
- 5.5 Installed Capacity and Capacity Utilization
- 5.6 Company-Wise Production Plants and Statistics
- 5.6.1 Installed Production Capacity
- 5.6.2 Actual Production
- 5.6.3 Planned Capacity and Expansion Targets
- 5.7 Supply Chain Structure and Procurement Trends
- 5.8 Supply-Demand Gap and Bottlenecks
- 5.9 Import Dependence and Sourcing Structure
- 5.10 Contract Manufacturing and Outsourcing
- 5.11 Regional Supply and Demand Concentration
Chapter 6 Asia Pacific Lysosomal Acid Lipase Deficiency (LAL-D) Treatment Market Pricing Analysis
- 6.1 Pricing Structure and Measurement
- 6.2 Historical Pricing Trends, 2018-2025
- 6.3 Pricing Outlook, 2025-2035
- 6.4 Average Selling Price and Unit Economics
- 6.5 Pricing by Product and Market Segment
- 6.6 Geographic Pricing Differences
- 6.7 Key Input, Energy, Labor and Logistics Costs
- 6.8 Contract Pricing and Purchasing Models
- 6.9 Pricing Sensitivity and Competitive Positioning
- 6.10 Price, Margin and Profitability Implications
Chapter 7 Asia Pacific Lysosomal Acid Lipase Deficiency (LAL-D) Treatment Market Dynamics
- 7.1 Market Growth Drivers
- 7.1.1 Demand-Side Drivers
- 7.1.2 Technology and Innovation Drivers
- 7.1.3 Infrastructure and Investment Drivers
- 7.1.4 Regulatory and Policy Drivers
- 7.2 Market Restraints
- 7.2.1 Cost and Affordability Constraints
- 7.2.2 Technology and Adoption Barriers
- 7.2.3 Supply Chain and Operational Constraints
- 7.3 Market Challenges
- 7.3.1 Competitive Pressure and Margin Erosion
- 7.3.2 Skills, Infrastructure and Implementation Gaps
- 7.4 Emerging Market Opportunities
- 7.5 Market Dynamics Impact and Time-Horizon Assessment
Chapter 8 Asia Pacific Lysosomal Acid Lipase Deficiency (LAL-D) Treatment Value Chain Analysis
- 8.1 Industry Value Chain Overview
- 8.2 Upstream Suppliers and Critical Inputs
- 8.3 Technology and Component Providers
- 8.4 Manufacturing or Service Delivery
- 8.5 Distribution, Channel Partners and Integrators
- 8.6 Downstream Applications and End Users
- 8.7 Value Addition and Profit Pools
- 8.8 Vertical Integration and Outsourcing
- 8.9 Supplier Concentration and Risk
- 8.10 Supply Chain Localization and Resilience
Chapter 9 Asia Pacific Lysosomal Acid Lipase Deficiency (LAL-D) Treatment Market Regulations and Policies
- 9.1 Relevant Laws, Standards and Compliance Frameworks
- 9.2 Product, Service, Safety and Quality Requirements
- 9.3 Government Policies, Incentives and Subsidies
- 9.4 Imports, Exports and Trade Barriers
- 9.5 Public Procurement and Local Content Requirements
- 9.6 Environmental and Sustainability Compliance
- 9.7 Upcoming Policy Changes and Market Implications
Chapter 10 Asia Pacific Lysosomal Acid Lipase Deficiency (LAL-D) Treatment Market Hotspots and Opportunities
- 10.1 Market Opportunity Mapping and Growth Hotspots
- 10.2 High-Growth Applications and Customer Groups
- 10.3 Underserved Markets and White-Space Opportunities
- 10.4 Emerging Technology and Product Opportunities
- 10.5 New Capacity and Investment Hotspots
- 10.6 Market Entry and Expansion Opportunities
- 10.7 Distribution and Partnership Opportunities
- 10.8 Near-Term and Long-Term Commercial Potential
- 10.9 Opportunity Attractiveness and Execution Risks
Chapter 11 Asia Pacific Lysosomal Acid Lipase Deficiency (LAL-D) Treatment Market Outlook, 2025-2035
- 11.1 Market Size and Analysis
- 11.1.1 Revenue (Market Measurement: 2025: USD 48.5 million → 2035: USD 291.3 million)
- 11.1.2 Market Volume and Quantity Sold
- 11.1.3 Historical Market Size, 2018-2025
- 11.1.4 Base-Year Market Size, 2025
- 11.2 Market Forecast, 2025-2035
- 11.2.1 Revenue Forecast to 2035
- 11.2.2 Volume Forecast to 2035
- 11.2.3 CAGR and Year-on-Year Growth
- 11.2.4 Incremental Revenue Opportunity
- 11.3 Forecast Assumptions and Scenario Analysis
- 11.3.1 Base-Case Forecast
- 11.3.2 Optimistic and Conservative Scenarios
- 11.3.3 Technology, Pricing and Policy Sensitivities
- 11.4 Market Attractiveness and Growth Outlook
Chapter 12 Asia Pacific Lysosomal Acid Lipase Deficiency (LAL-D) Treatment Market Segmentation and Outlook
- 12.1 Segmentation Summary and Market Shares, 2025
- 12.2 Largest and Fastest-Growing Segments
- 12.3 By Product Type - Market Size and Forecast, 2025-2035
- 12.3.1 Segment Definition and Scope
- 12.3.2 Historical Market Size, 2018-2025
- 12.3.3 Revenue Forecast, 2025-2035
- 12.3.4 Volume Forecast, 2025-2035
- 12.3.5 Base-Year Market Share, 2025
- 12.3.6 Segment CAGR and Growth Drivers
- 12.3.7 Subsegment Market Size and Forecast
- 12.3.7.1 Enzyme replacement therapy
- 12.3.7.2 Lipid-modifying medicines
- 12.3.7.3 Hepatic and nutritional support
- 12.3.8 Subsegment Pricing and Adoption Trends
- 12.3.9 Leading Suppliers and Competition
- 12.3.10 Regional Demand and Opportunities
- 12.4 By End User - Market Size and Forecast, 2025-2035
- 12.4.1 Segment Definition and Scope
- 12.4.2 Historical Market Size, 2018-2025
- 12.4.3 Revenue Forecast, 2025-2035
- 12.4.4 Volume Forecast, 2025-2035
- 12.4.5 Base-Year Market Share, 2025
- 12.4.6 Segment CAGR and Growth Drivers
- 12.4.7 Subsegment Market Size and Forecast
- 12.4.7.1 Infants
- 12.4.7.2 Children and adolescents
- 12.4.7.3 Adults
- 12.4.8 Subsegment Pricing and Adoption Trends
- 12.4.9 Leading Suppliers and Competition
- 12.4.10 Regional Demand and Opportunities
- 12.5 By Disease Area - Market Size and Forecast, 2025-2035
- 12.5.1 Segment Definition and Scope
- 12.5.2 Historical Market Size, 2018-2025
- 12.5.3 Revenue Forecast, 2025-2035
- 12.5.4 Volume Forecast, 2025-2035
- 12.5.5 Base-Year Market Share, 2025
- 12.5.6 Segment CAGR and Growth Drivers
- 12.5.7 Subsegment Market Size and Forecast
- 12.5.7.1 Infantile-onset LAL-D
- 12.5.7.2 Later-onset hepatic-predominant LAL-D
- 12.5.7.3 Later-onset mixed hepatic-lipid LAL-D
- 12.5.8 Subsegment Pricing and Adoption Trends
- 12.5.9 Leading Suppliers and Competition
- 12.5.10 Regional Demand and Opportunities
- 12.6 By Channel - Market Size and Forecast, 2025-2035
- 12.6.1 Segment Definition and Scope
- 12.6.2 Historical Market Size, 2018-2025
- 12.6.3 Revenue Forecast, 2025-2035
- 12.6.4 Volume Forecast, 2025-2035
- 12.6.5 Base-Year Market Share, 2025
- 12.6.6 Segment CAGR and Growth Drivers
- 12.6.7 Subsegment Market Size and Forecast
- 12.6.7.1 Public funded procurement
- 12.6.7.2 Private paid procurement
- 12.6.7.3 Paid named-patient imports
- 12.6.8 Subsegment Pricing and Adoption Trends
- 12.6.9 Leading Suppliers and Competition
- 12.6.10 Regional Demand and Opportunities
- 12.7 By Country - Market Size and Forecast, 2025-2035
- 12.7.1 Segment Definition and Scope
- 12.7.2 Historical Market Size, 2018-2025
- 12.7.3 Revenue Forecast, 2025-2035
- 12.7.4 Volume Forecast, 2025-2035
- 12.7.5 Base-Year Market Share, 2025
- 12.7.6 Segment CAGR and Growth Drivers
- 12.7.7 Subsegment Market Size and Forecast
- 12.7.7.1 China
- 12.7.7.2 Remaining covered APAC
- 12.7.7.3 Japan
- 12.7.8 Subsegment Pricing and Adoption Trends
- 12.7.9 Leading Suppliers and Competition
- 12.7.10 Regional Demand and Opportunities
- 12.8 Segment Growth Comparison
- 12.9 Segment Attractiveness and Priority Matrix
Chapter 13 Asia Pacific Lysosomal Acid Lipase Deficiency (LAL-D) Treatment End-Use and Application Market Outlook
- 13.1 End-Use Industry and Customer Demand Structure
- 13.2 Leading Applications and Customer Groups
- 13.3 End-Use Market Size, Share and Forecast
- 13.4 Major End-Use Industry Deep Dives
- 13.4.1 Customer Requirements and Use Cases
- 13.4.2 Demand and Replacement Cycles
- 13.4.3 Technical and Regulatory Considerations
- 13.4.4 Purchasing and Procurement Models
- 13.4.5 Leading Vendors and Distribution Channels
- 13.4.6 Forecast and Commercial Opportunities
- 13.5 Emerging Applications and Cross-Segment Demand
- 13.6 End-Use Industry Investment Priorities
Chapter 14 Asia Pacific Lysosomal Acid Lipase Deficiency (LAL-D) Treatment Geographic Market Outlook, 2025-2035
- 14.1 Regional Market Size and Country-Level Shares, 2025
- 14.2 Country Market Size Comparison, 2025
- 14.3 Country Market Forecasts, 2025-2035
- 14.4 Subregional Industrial and Demand Clusters
- 14.5 Intra-Regional Pricing and Cost Differences
- 14.6 Cross-Border Trade and Supply Networks
- 14.7 Regional Supply and Demand Balances
- 14.8 Country Opportunity Comparison and Prioritization
Note: Every listed country is covered on the structure shown under the first country.
Chapter 15 Asia Pacific Lysosomal Acid Lipase Deficiency (LAL-D) Treatment Technology, Innovation and Sustainability Outlook
- 15.1 Technology Landscape and Maturity
- 15.2 Product, Process and Service Innovation
- 15.3 AI, Automation and Digital Tools in the Industry
- 15.4 Technology Adoption and Performance Benchmarking
- 15.5 Innovation Pipeline and R&D Investment
- 15.6 Patent and Intellectual Property Trends
- 15.7 Energy Efficiency and Resource Management
- 15.8 Sustainability, Recycling and Circularity
- 15.9 Technology Roadmap, 2025-2035
- 15.10 Risks of Obsolescence and Technology Substitution
Chapter 16 Asia Pacific Lysosomal Acid Lipase Deficiency (LAL-D) Treatment Market Key Strategic Imperatives
- 16.1 Growth and Market Entry Priorities
- 16.2 High-Return Products and Segments
- 16.3 Pricing, Profitability and Cost Optimization
- 16.4 Technology Investment and Product Differentiation
- 16.5 Supply Chain Localization and Resilience
- 16.6 Distribution and Customer Acquisition
- 16.7 Partnership, Acquisition and Capacity Strategy
- 16.8 Regional Expansion Priorities
- 16.9 Short-, Medium- and Long-Term Actions
Chapter 17 Competition Outlook
- 17.1 Industry Competition Characteristics
- 17.2 Market Structure and Concentration
- 17.3 Market Share and Competitive Positioning, 2025
- 17.4 Company-Wise Revenue and Product Benchmarking
- 17.5 Production and Service Capacity Benchmarking
- 17.6 Technology, Pricing and Differentiation
- 17.7 Regional Footprint and Distribution Strength
- 17.8 Mergers, Acquisitions and Strategic Alliances
- 17.9 New Entrants and Competitive Threats
- 17.10 Porter's Five Forces and Industry Attractiveness
- 17.11 Competitive Outlook, 2025-2035
Chapter 18 Company Profiles
- 18.1 Company Coverage and Selection Criteria
- 18.2 AstraZeneca PLC / Alexion
- 18.2.1 Business Description
- 18.2.2 Company Ownership and Geographic Presence
- 18.2.3 Product and Service Portfolio
- 18.2.4 Manufacturing and Operating Footprint
- 18.2.5 Production Capacity and Expansion Plans
- 18.2.6 Financial Performance and Investment
- 18.2.7 Market Share and Competitive Position
- 18.2.8 Technology and Innovation Capabilities
- 18.2.9 Strategic Alliances or Partnerships
- 18.2.10 Recent Developments
- 18.2.11 Growth Strategy and Outlook
- 18.3 Teva Pharmaceutical Industries
- 18.4 Takeda Pharmaceutical Company
- 18.5 Sun Pharmaceutical Industries
- 18.6 Lupin Limited
- 18.7 Other Relevant Market Participants
Note: Every listed company is profiled on the structure shown under the first company. The company list is preliminary and may change based on research findings, market developments, data availability and client requirements.
Chapter 19 Disclaimer
- 19.1 Research and Forecast Disclaimer
- 19.2 Data Source and Estimation Limitations
Note: The depth of individual sections depends on data availability for this market. Volume, capacity, trade and other unit-based metrics are included where applicable.

