
Market Overview
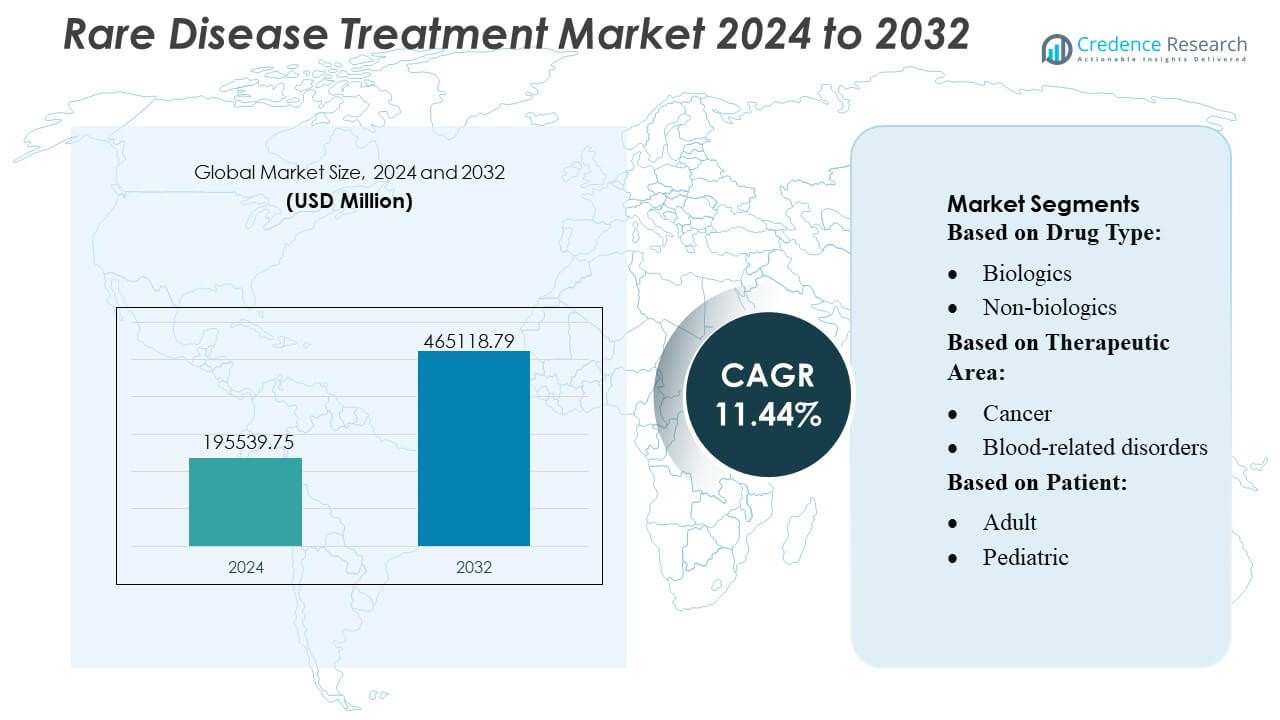
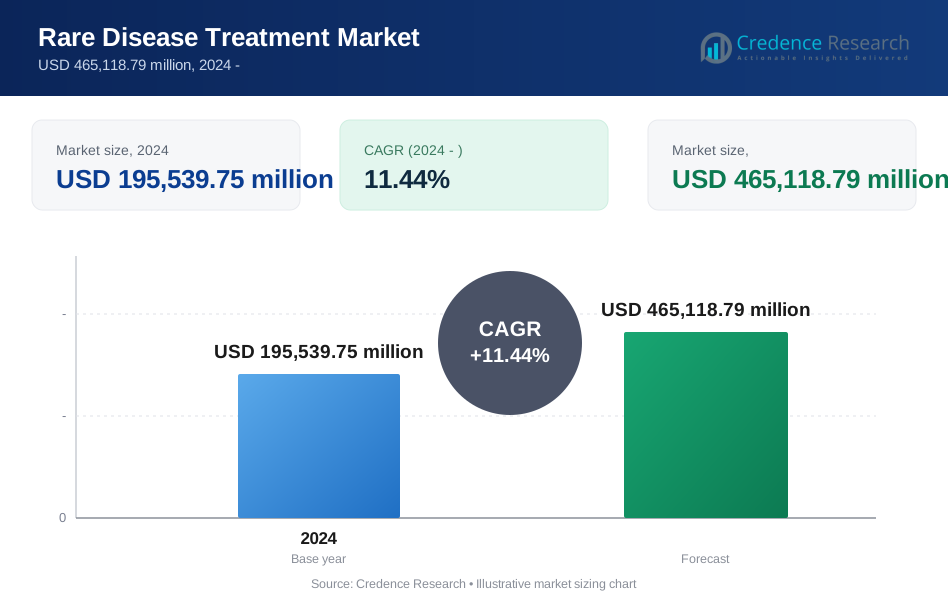
Rare Disease Treatment Market size was valued USD 195539.75 million in 2024 and is anticipated to reach USD 465118.79 million by 2032, at a CAGR of 11.44% during the forecast period.
| REPORT ATTRIBUTE | DETAILS |
|---|---|
| Historical Period | 2020-2023 |
| Base Year | 2024 |
| Forecast Period | 2025-2032 |
| Rare Disease Treatment Market Size 2024 | USD 195539.75 Million |
| Rare Disease Treatment Market, CAGR | 11.44% |
| Rare Disease Treatment Market Size 2032 | USD 465118.79 Million |
The Rare Disease Treatment Market is driven by strong innovation pipelines and specialized therapeutic capabilities from major players such as Takeda Pharmaceutical Company Ltd, AstraZeneca, Bristol Myers Squibb Company, AbbVie Inc., PTC Therapeutics Inc., F. Hoffmann-La Roche Ltd., Merck & Co. Inc., Novartis AG, Pfizer, Inc., and Bayer AG. These companies strengthen competitiveness through targeted biologics, gene therapies, and strategic collaborations that accelerate clinical development. North America leads the global market with an exact 40% share, supported by advanced genomic infrastructure, favorable regulatory incentives, and high adoption of precision medicine across specialty treatment centers.
Market Insights
- The Rare Disease Treatment Market reached USD 195,539.75 million in 2024 and is projected to exceed USD 465,118.79 million by 2032 at a CAGR of 11.44%, reflecting strong long-term growth potential.
- Strong drivers include expanding genomic diagnostics, accelerated regulatory pathways, and rising adoption of advanced biologics and gene therapies across oncology, metabolic, and neurological segments.
- Key trends highlight increased investment in precision medicine, AI-enabled diagnostic tools, and collaborative research models that enhance early identification and targeted intervention.
- Competitive momentum strengthens as leading companies expand orphan drug pipelines and pursue partnerships that support specialized therapeutics while navigating high development costs and reimbursement constraints.
- Regional performance is led by North America with a 40% share, followed by Europe and Asia-Pacific, while biologics dominate the drug type segment with the highest share due to superior clinical efficacy in complex rare disorders.
 Market Segmentation Analysis:
By Drug Type
Biologics hold the dominant market share in rare disease treatment due to their precision targeting, strong efficacy, and suitability for complex genetic and metabolic disorders. Their leadership is reinforced by rising approvals of monoclonal antibodies, gene therapies, and enzyme replacement therapies that address limited-treatment-option conditions. Manufacturers expand R&D investments and leverage advanced platforms such as recombinant DNA and viral vector technologies to accelerate innovation. Increasing prevalence of rare autoimmune and neuromuscular conditions, coupled with favorable orphan drug policies, strengthens biologics’ adoption across specialty care centers and hospital networks.
- For instance, Takeda’s enzyme replacement therapy ELAPRASE demonstrated sustained improvement in urinary glycosaminoglycan reduction validated over a 53-week clinical study, while its hereditary angioedema biologic TAKHZYRO maintained a dosing interval as long as 8 weeks supported by pharmacokinetic measurements exceeding 2000 ng/mL at trough levels.
By Therapeutic Area
Cancer accounts for the largest share in the therapeutic area segmentation, supported by rapid advancements in targeted oncology drugs, immunotherapies, and precision medicine for rare malignancies. High unmet clinical needs in conditions such as rare sarcomas, hematologic cancers, and metastatic mutations boost investment in novel therapies. Strong regulatory support for accelerated pathways and rising biomarker-driven trials enable faster commercialization. Broader genomic testing adoption and expanded access to oncology centers enhance diagnosis rates, driving treatment uptake. This momentum positions cancer therapeutics as the primary revenue contributor in the rare disease treatment landscape.
- For instance, AstraZeneca’s RET-targeted therapy selpercatinib achieved a confirmed objective response in patients with RET-mutated advanced thyroid cancer, with a median duration of response reaching 31.5 months as reported in the LIBRETTO-001 trial, while its rare lung cancer therapy osimertinib demonstrated central nervous system penetration levels of 16.6 ng/g in preclinical xenograft models, supporting its effectiveness in mutation-driven metastatic disease.
By Patient
Adult patients represent the leading segment, accounting for the majority of treatment demand as diagnostic rates improve and awareness of late-onset rare disorders increases. Conditions such as rare cancers, hereditary metabolic syndromes, and autoimmune disorders typically manifest or are detected in adulthood, driving consistent therapy adoption. Broader access to specialty drugs through hospital pharmacies, reimbursement support, and increased clinical research focused on adult cohorts strengthens segment dominance. Although pediatric demand grows with gene therapies and newborn screening programs, adult patients remain the principal contributors to market revenue and treatment volume.
Key Growth Drivers
1. Rising Prevalence and Improved Diagnostic Capabilities
The market gains momentum as advancements in genomic sequencing, biomarker testing, and AI-enabled diagnostic platforms improve early detection of rare disorders. Higher testing affordability and wider adoption of next-generation sequencing help identify conditions previously misdiagnosed or undiagnosed. Clinical guidelines increasingly recommend genetic screening for high-risk populations, strengthening diagnosis rates across oncology, hematology, and neurological categories. Expanded newborn screening programs and integration of digital diagnostic tools in hospitals further drive patient identification, thereby increasing treatment initiation and fueling sustained market growth.
- For instance, Bristol Myers Squibb’s Onureg development program relied on measurable residual disease (MRD) assays capable of detecting leukemic mutations down to a sensitivity threshold of 0.01 variant copies per genome, while its CAR-T therapy Breyanzi demonstrated precise identification of CD19-expressing malignant cells using flow cytometry panels validated at detection limits of 50 cells per microliter, reflecting the company’s commitment to high-resolution diagnostic integration.
2. Strong Regulatory Incentives and Orphan Drug Designations
The regulatory environment fosters accelerated development through orphan drug designations, priority review, and breakthrough therapy pathways. These incentives reduce clinical development timelines, offer extended market exclusivity, and support favorable pricing strategies, encouraging investment from large pharmaceutical companies and emerging biotech firms. Grants, tax credits, and fee waivers further reduce financial risk, making rare disease pipelines commercially attractive. Streamlined approval frameworks across the U.S., Europe, and Japan help expedite launches of advanced biologics and gene therapies, enhancing treatment availability and strengthening market expansion.
- For instance, AbbVie’s therapy IMBRUVICA, developed in collaboration with Janssen, received orphan drug designation for several rare hematologic cancers based on clinical datasets that included over 1,500 patients across global trials, and its neurological pipeline asset elezanumab advanced to clinical evaluation after demonstrating a 63-ng/mL mean cerebrospinal fluid concentration in Phase 1 studies, confirming targeted CNS penetration required for regulatory advancement.
3. Advancements in Biologics, Cell, and Gene Therapies
Rapid technological progress in biologics and gene-based treatments significantly accelerates market development. Platforms such as CAR-T therapies, viral vector delivery systems, and CRISPR-based editing offer curative potential for previously intractable disorders. Improved manufacturing scalability, higher therapeutic durability, and strong clinical success rates attract investment in new modalities. Gene replacement, RNA-based therapies, and enzyme replacement therapies broaden therapeutic scope across metabolic, hematologic, and neuromuscular diseases. These innovations shift the market toward highly personalized, high-value treatments, strengthening long-term growth.
Key Trends & Opportunities
1. Expansion of Precision Medicine and Genomic-Guided Therapies
A major trend centers on integrating precision medicine frameworks into rare disease care. Increasing availability of genomic databases, real-world evidence, and molecular profiling supports patient-specific therapy decisions. Pharmaceutical companies design highly targeted therapies based on mutation subtype, disease mechanism, and predicted response. This trend expands treatment personalization and improves outcomes in oncology, CNS disorders, and hereditary metabolic diseases. Growing collaborations between diagnostics companies, research institutes, and biotech firms open new opportunities to develop mutation-specific therapeutics and companion diagnostics.
- For instance, PTC Therapeutics’ splicing modulator Translarna was developed specifically for nonsense mutation Duchenne muscular dystrophy after identifying more than 2,000 pathogenic nonsense mutations across patient genomes, while its gene therapy program achieved vector manufacturability at a titer of 1.2×10¹³ viral genomes per milliliter using its proprietary scalable AAV production platform.
2. Growing Integration of Digital Health and Remote Monitoring
Digital health technologies create new opportunities to optimize rare disease management by enabling remote monitoring, adherence tracking, and real-time symptom reporting. Wearable sensors, mobile health platforms, and AI-driven analytics help clinicians personalize dosing, track progression, and improve long-term therapy effectiveness. Digital patient registries expand access to longitudinal data, which accelerates research and improves clinical trial design. These tools enhance patient engagement, particularly for those with mobility limitations or those residing far from specialized treatment centers, strengthening continuity of care and expanding digital treatment ecosystems.
- For instance, Roche’s Floodlight MS digital monitoring tool captured more than 40,000 active-test data points during its validation program, and its Phonak hearing-health division deployed remote-fitting technology capable of transmitting high-resolution audiology adjustments at 16 kHz sampling rates, demonstrating the company’s measurable advancements in digital health integration.
3. Increasing Investment in Global Research Collaborations
Collaborative research frameworks continue to expand as governments, academic institutions, and pharmaceutical companies unite to accelerate drug discovery. Cross-border data sharing, centralized patient registries, and multi-center clinical trials help overcome challenges associated with low patient populations. Public–private partnerships support translational research for ultra-rare diseases and strengthen innovation speed. Emerging markets invest in research infrastructure and clinical capacity, creating new opportunities for development. These global networks enhance scientific understanding, reduce duplication of research efforts, and increase the pipeline of targeted therapies entering the regulatory pathways.
Key Challenges
1. High Treatment Costs and Limited Reimbursement Coverage
Rare disease therapies often involve complex biologics, gene therapies, or long-term specialty treatments that generate significant cost burdens for healthcare systems. Variability in reimbursement policies across regions affects patient access, especially for ultra-rare diseases with limited evidence bases. Payers increasingly require rigorous health-economic justification, which slows adoption. Rising pricing scrutiny and budget impact assessments challenge manufacturers to balance innovation investment with affordability. These financial constraints remain a critical barrier to widespread access despite strong clinical value propositions.
2. Limited Patient Populations and Clinical Trial Constraints
Small patient pools present substantial barriers to robust clinical trial design, recruitment, and statistical validation. Geographic dispersion of eligible patients complicates enrollment and increases trial costs. Many rare diseases lack standardized endpoints or natural history data, making outcome measurement difficult. Regulatory agencies encourage adaptive and decentralized trial models, but operational complexity remains high. Limited clinical datasets slow evidence generation, delay approvals, and restrict post-marketing insights. These challenges impede development efficiency and complicate commercialization strategies, especially for emerging biotechs with constrained resources.
Regional Analysis
North America
North America holds the largest market share at approximately 40%, driven by strong regulatory support, high adoption of advanced biologics, and a robust ecosystem for rare disease research. Extensive genomic testing availability, well-established reimbursement frameworks, and active patient advocacy networks improve diagnosis and treatment access. The region benefits from significant R&D funding, large clinical trial activity, and leading biopharmaceutical companies with dedicated orphan drug pipelines. Expanded access to specialty clinics and rising approvals of gene and cell therapies reinforce regional dominance while increasing patient uptake across oncology, metabolic disorders, and neuromuscular conditions.
Europe
Europe accounts for an estimated 30% market share, supported by coordinated rare disease strategies across the EU, strong emphasis on orphan drug development, and widespread adoption of precision medicine initiatives. Countries such as Germany, France, and the U.K. invest heavily in genomics and clinical research networks, improving treatment availability for complex hereditary and autoimmune conditions. Centralized regulatory pathways, including EMA’s orphan designation program, expedite approvals and enhance market entry for innovative therapies. Growing rare disease registries and cross-border healthcare collaborations strengthen diagnosis rates and improve access to specialized care across regional healthcare systems.
Asia-Pacific
Asia-Pacific holds roughly 20% of the market, with growth driven by increasing healthcare investment, expanding genomic testing infrastructure, and rising awareness of rare disorders. Countries such as Japan, China, South Korea, and Australia advance rare disease policies that improve early diagnosis and treatment availability. Japan remains a key innovation hub due to strong regulatory support and rapid adoption of advanced biologics. China accelerates progress through national rare disease catalogs, expanded insurance coverage, and increasing participation in multinational clinical trials. Improved international collaborations and a growing biotechnology sector further strengthen regional market expansion.
Latin America
Latin America represents around 5% of the market, shaped by improving diagnostic frameworks, expanding specialty care centers, and gradual policy development supporting rare disease management. Brazil, Mexico, and Argentina drive regional growth through national registries, newborn screening expansion, and improved access to essential orphan drugs. Challenges persist in reimbursement variability and treatment affordability, but governmental initiatives increasingly support inclusion of rare disease therapies in public healthcare programs. Partnerships with international research groups and rising clinical trial activity help accelerate regional capability building, enabling broader adoption of biologics and advanced therapeutic options.
Middle East & Africa
The Middle East & Africa region holds an estimated 5% share, characterized by growing government commitment to rare disease programs, improving healthcare spending, and rising access to genetic testing. Gulf countries, including the UAE and Saudi Arabia, invest in precision medicine centers and genomic initiatives that enhance diagnostic accuracy. However, access gaps persist across several African nations due to limited infrastructure and specialist availability. International collaborations, charitable foundations, and expanding private healthcare networks help improve treatment access. Increasing awareness of hereditary and metabolic disorders supports long-term growth opportunities for innovative orphan therapies.
Market Segmentations:
By Drug Type:
- Biologics
- Non-biologics
By Therapeutic Area:
- Cancer
- Blood-related disorders
By Patient:
- Adult
- Pediatric
By Geography
- North America
- U.S.
- Canada
- Mexico
- Europe
- Germany
- France
- U.K.
- Italy
- Spain
- Rest of Europe
- Asia Pacific
- China
- Japan
- India
- South Korea
- South-east Asia
- Rest of Asia Pacific
- Latin America
- Brazil
- Argentina
- Rest of Latin America
- Middle East & Africa
- GCC Countries
- South Africa
- Rest of the Middle East and Africa
Competitive Landscape
The competitive landscape of the Rare Disease Treatment Market players such as Takeda Pharmaceutical Company Ltd, AstraZeneca, Bristol Myers Squibb Company, AbbVie Inc., PTC Therapeutics Inc., F. Hoffmann-La Roche Ltd., Merck & Co. Inc., Novartis AG, Pfizer, Inc., Bayer AG. the Rare Disease Treatment Market is shaped by rapid innovation, strong R&D pipelines, and increasing investment in advanced therapeutic modalities. Leading manufacturers focus on expanding portfolios in gene therapy, enzyme replacement therapy, and targeted biologics to address complex and underserved conditions. Companies strengthen competitiveness through strategic collaborations with research institutes and biotech firms, enabling faster clinical validation and broader scientific capability. Regulatory incentives, including orphan drug designations and priority review pathways, support accelerated market entry and encourage continued innovation. Expanding real-world evidence generation, digital health integration, and precision medicine initiatives further differentiate market players and enhance treatment outcomes.
Key Player Analysis
- Takeda Pharmaceutical Company Ltd
- AstraZeneca
- Bristol Myers Squibb Company
- AbbVie Inc.
- PTC Therapeutics Inc.
- Hoffmann-La Roche Ltd.
- Merck & Co. Inc.
- Novartis AG
- Pfizer, Inc.
- Bayer AG
Recent Developments
- In September 2024, the U.S. FDA approved arimoclomol (Miplyffa) drug developed by Zevra Therapeutics for treatment of patient with Niemann-Pick disease type C. This drug is used in combination with Johsnon & Johnson’s Zavesca drug.
- In June 2024, ANI Pharmaceuticals, Inc. signed an agreement to acquire Alimera Sciences, Inc. to foster their rare disease infrastructure and expand business. ILUVIEN and YUTIQ are two commercial products that have significant growth potential in the market.
- In May 2024, Palatin Technologies received FDA clearance to begin a phase 2 clinical study of bremelanotide, a Melanocortin Receptor 4 (MCR4) agonist, combined with tirzepatide (GLP-1/GIP) for obesity treatment.
- In January 2024, Sanofi planned to acquire Inhibrx, Inc. to enhance Sanofi’s rare disease portfolio by addition of best-in-class Alpha-1 Antitrypsin Deficiency to pipeline. INBRX-101 is used in the treatment of rare lung infection which will further strengthen company’s position in the market.
Report Coverage
The research report offers an in-depth analysis based on Drug Type, Therapeutic Area, Patient and Geography. It details leading market players, providing an overview of their business, product offerings, investments, revenue streams, and key applications. Additionally, the report includes insights into the competitive environment, SWOT analysis, current market trends, as well as the primary drivers and constraints. Furthermore, it discusses various factors that have driven market expansion in recent years. The report also explores market dynamics, regulatory scenarios, and technological advancements that are shaping the industry. It assesses the impact of external factors and global economic changes on market growth. Lastly, it provides strategic recommendations for new entrants and established companies to navigate the complexities of the market.
Future Outlook
- The market will advance rapidly as gene therapy, RNA-based therapy, and genome-editing platforms achieve wider clinical adoption.
- Precision medicine will expand, enabling treatment strategies tailored to mutation-specific and patient-specific disease profiles.
- Diagnostic rates will improve as genomic sequencing, AI-enabled tools, and newborn screening programs become more accessible.
- Regulatory frameworks will continue to incentivize innovation through orphan drug designations and accelerated approval pathways.
- Pharmaceutical and biotech collaborations will increase, accelerating pipeline development for ultra-rare and complex disorders.
- Digital health integration will strengthen long-term monitoring, treatment adherence, and patient data collection.
- Manufacturing scalability for biologics and gene therapies will improve, reducing development bottlenecks.
- Global research networks will expand, improving clinical trial execution in regions with limited patient pools.
- Reimbursement models will evolve to accommodate high-cost, high-value rare disease therapies.
- Emerging markets will increase investment in rare disease infrastructure, improving access to specialized care and advanced treatments.
Request a Free Sample
Fill in your details and we'll send you a free sample report.
- Sample data tables & charts
- Research methodology
Need a Custom Version of This Report?
Tailor the scope, geography, or segments to your exact requirements.
- Custom geography or segment scope
- Direct access to our analyst team
Frequently Asked Questions
What is the current market size for the Rare Disease Treatment Market, and what is its projected size in 2032?
At what Compound Annual Growth Rate is the Rare Disease Treatment Market projected to grow between 2024 and 2032?
Which Rare Disease Treatment Market segment held the largest share in 2024?
What are the primary factors fueling the growth of the Rare Disease Treatment Market?
Who are the leading companies in the Rare Disease Treatment Market?
Which region commanded the largest share of the Rare Disease Treatment Market in 2024?
Table of Content
Chapter 1. Report Introduction
- 1.1 Report Description & Purpose
- 1.1.1 Report Title & Market Definition
- 1.1.2 Unique Selling Propositions (USP) & Key Differentiators
- 1.1.3 Value Proposition for Stakeholders
- 1.2 Research Objectives
- 1.2.1 Market Sizing Objectives (Volume & Revenue) (Volume Where Applicable)
- 1.2.2 Segmentation Objectives
- 1.2.3 Competitive Intelligence Objectives
- 1.2.4 Forecast & Scenario Objectives
- 1.3 Report Scope
- 1.3.1 Rare Disease Treatment Scope – Segments & Subsegments Covered
- 1.3.2 Geographic Scope – Regions & Countries Covered
- 1.3.3 Historical Period, Base Year & Forecast Period (2024; forecast to 2032)
- 1.3.4 Inclusions & Exclusions
- 1.4 Industry Classification & Applicable Codes
- 1.5 Currency, Measurement Units & Valuation Basis
- 1.6 Target Stakeholders
- 1.7 Limitations & Assumptions
Chapter 2. Executive Summary
- 2.1 Global Rare Disease Treatment Market Snapshot
- 2.1.1 Market Size – Historical (2024) & Forecast (2024-2032) (2024: USD 195,539.75 million → 2032: USD 465,118.79 million)
- 2.1.2 Volume & Revenue – Global Totals (Volume Where Applicable)
- 2.1.3 Key Market Highlights – Top Five Facts
- 2.2 Rare Disease Treatment Market Segmentation Snapshot
- 2.2.1 Market Split by Region – 2024 vs. 2032
- 2.3 Competitive Snapshot
- 2.3.1 Top 10 Players by Revenue Share – 2024
- 2.3.2 Top 10 Players by Volume Share – 2024 (Volume Where Applicable)
- 2.3.3 Recent Strategic Developments (18-Month Summary)
- 2.4 Key Investment Highlights & Strategic Conclusions
Chapter 3. Rare Disease Treatment Market Dynamics & Industry Analysis
- 3.1 Market Overview & Context
- 3.1.1 Rare Disease Treatment Market Position in the Broader Industry Value Chain
- 3.1.2 Demand Structure & Purchasing Dynamics
- 3.1.3 Market Maturity & Development Stage by Region
- 3.2 Rare Disease Treatment Market Drivers
- 3.3 Rare Disease Treatment Market Restraints & Challenges
- 3.4 Rare Disease Treatment Market Opportunities
- 3.5 Porter's Five Forces Analysis
- 3.5.1 Threat of New Entrants
- 3.5.2 Bargaining Power of Suppliers
- 3.5.3 Bargaining Power of Buyers
- 3.5.4 Threat of Substitutes
- 3.5.5 Competitive Rivalry – Intensity Assessment
- 3.6 Rare Disease Treatment Value Chain Analysis
- 3.6.1 Upstream – Key Inputs, Resources & Suppliers
- 3.6.1.1 Key Input/Resource 1
- 3.6.1.2 Key Input/Resource 2
- 3.6.1.3 Key Input/Resource 3
- 3.6.2 Midstream – Core Operations & Value Creation
- 3.6.2.1 Operating Model & Process Overview
- 3.6.2.2 Key Operating Locations & Capabilities by Company
- 3.6.3 Downstream – Market Channels & End Users
- 3.6.3.1 Direct Sales & Customer Engagement Channels
- 3.6.3.2 Indirect Sales, Intermediaries & Partner Channels
- 3.6.4 Value Chain Profitability Analysis
- 3.6.1 Upstream – Key Inputs, Resources & Suppliers
- 3.7 PESTEL Analysis
- 3.7.1 Political Factors
- 3.7.2 Economic Factors
- 3.7.3 Social Factors
- 3.7.4 Technological Factors
- 3.7.5 Environmental Factors
- 3.7.6 Legal Factors
- 3.8 Rare Disease Treatment Supply Chain Analysis
- 3.8.1 Critical Input & Resource Availability Risk Assessment
- 3.8.2 Supplier & Operational Concentration Risk (Geographic Exposure)
- 3.8.3 Supply & Service Disruption Impact Analysis
- 3.9 Regulatory & Policy Landscape
Note: The regulatory and policy landscape section covers regulations based on their applicability to the market, Rare Disease Treatment category, geography, and scope of the study. Only regulatory frameworks with a material impact on operations, compliance, trade, sustainability, or market access are analyzed in detail.
Chapter 4. Key Investment Pockets & Opportunity Analysis
- 4.1 Rare Disease Treatment Market Attractiveness Analysis
- 4.1.1 By Region – Investment Attractiveness Matrix (Market Size × CAGR)
- 4.2 Absolute Revenue Growth Opportunity
- 4.2.1 By Region – Absolute Revenue Growth Through 2032
- 4.3 Incremental Demand Opportunity
- 4.3.1 By Region – Incremental Demand Through 2032
- 4.3.2 Segment – Incremental Demand
- 4.4 Emerging Submarket Opportunity Deep Dive (Subject to Applicability)
- 4.5 Priority Market Opportunity Scorecards
- 4.5.1 United States
- 4.5.2 Europe
- 4.5.3 Asia
- 4.5.4 Middle East & Africa
Note: Priority market opportunity scorecards reflect the geographic scope and strategic relevance of the study. Listed markets are indicative and may be adapted to the industry.
Chapter 5. Rare Disease Treatment Cross-Border Trade & Market Access Analysis
- 5.1 International Trade & Cross-Border Activity Overview
- 5.1.1 Global Export Value by Country (2024)
- 5.1.2 Global Export Volume by Country (2024) (Volume Where Applicable)
- 5.1.3 Global Import Value by Country (2024)
- 5.1.4 Global Import Volume by Country (2024) (Volume Where Applicable)
- 5.1.5 Net Trade Balance by Country (2024)
- 5.2 Export Analysis – Segment
- 5.2.1 Category 1 (Applicable Classification Code)
- 5.2.2 Category 2 (Applicable Classification Code)
- 5.2.3 Category 3 (Applicable Classification Code)
- 5.2.4 Category 4 (Applicable Classification Code)
- 5.2.5 Category 5 (Applicable Classification Code)
- 5.3 Import Analysis – Segment
- 5.3.1 Category 1 (Applicable Classification Code)
- 5.3.2 Category 2 (Applicable Classification Code)
- 5.3.3 Category 3 (Applicable Classification Code)
- 5.3.4 Category 4 (Applicable Classification Code)
- 5.3.5 Category 5 (Applicable Classification Code)
- 5.4 Cross-Border Pricing & Transaction Benchmarks
- 5.4.1 Export Pricing – Segment & Country
- 5.4.2 Import Pricing – Segment & Source Country
- 5.4.3 Price Trends (2024)
- 5.5 Key Cross-Border Trade & Delivery Routes
- 5.5.1 Cross-Border Trade/Delivery Route 1
- 5.5.2 Cross-Border Trade/Delivery Route 2
- 5.5.3 Cross-Border Trade/Delivery Route 3
- 5.5.4 Cross-Border Trade/Delivery Route 4
- 5.5.5 Cross-Border Trade/Delivery Route 5
- 5.6 Trade Policy & Market Access Impact Assessment
- 5.6.1 Tariff & Non-Tariff Barriers
- 5.6.2 Regional Trade & Economic Integration Frameworks
- 5.6.3 Bilateral & Multilateral Trade Agreements
- 5.6.4 Cross-Border Operating, Licensing & Localization Requirements
Note: This chapter applies where cross-border trade or delivery is relevant to Rare Disease Treatment. Goods, services, and digital offerings are assessed using applicable classifications and transaction measures. Import-export volumes, trade balances, and route analyses are included only where meaningful to the market.
Chapter 6. Competitive Landscape & Company Benchmarking
- 6.1 Rare Disease Treatment Market Concentration & Structure
- 6.1.1 Herfindahl-Hirschman Index (HHI) – vs. 2024
- 6.1.2 Leading, Mid-Sized & Emerging Player Structure
- 6.1.3 Global, Regional & Local Player Dynamics
- 6.2 Rare Disease Treatment Market Share Analysis – 2024
- 6.2.1 Global Revenue Share by Company
- 6.2.2 Global Volume Share by Company (Volume Where Applicable)
- 6.2.3 Regional Revenue Share
- 6.2.4 Market Share Evolution ( vs. 2024)
- 6.2.5 Company Market Share by Key Segment
- 6.2.6 Company Market Share by Customer Group
- 6.3 Operating Scale, Capacity & Infrastructure Analysis
- 6.3.1 Global Operating Scale & Supply Capacity
- 6.3.2 Resource Utilization & Operating Efficiency
- 6.3.3 Output, Service Delivery & Activity Metrics
- 6.3.4 Operating Footprint & Infrastructure Map
- 6.3.5 Planned Operational & Capacity Expansion
- 6.4 Rare Disease Treatment Competitive Benchmarking Matrix
- 6.4.1 Revenue, Growth, Profitability & Operating Metric Comparison
- 6.4.2 Channel Revenue Mix
- 6.4.3 Geographic Revenue Exposure
- 6.4.4 R&D Intensity
- 6.4.5 Sustainability Maturity
- 6.5 Strategic Developments in Rare Disease Treatment (Last 24 Months)
- 6.5.1 Mergers, Acquisitions & Divestments
- 6.5.2 New Products, Services & Solutions in Rare Disease Treatment
- 6.5.3 Operational & Infrastructure Expansions
- 6.5.4 Strategic Alliances, Joint Ventures & Partnerships
- 6.5.5 Distribution Expansion & Market Entry
- 6.5.6 Sustainability & ESG Initiatives
- 6.6 Competitive Strategy Mapping
- 6.6.1 Leader, Challenger, Follower & Niche Classification
- 6.6.2 Pricing Strategy Comparison
- 6.6.3 Channel Strategy Matrix
Note: Strategic developments are included based on their materiality and the availability of reliable information.
Chapter 7. Global Rare Disease Treatment Market – By Sales & Delivery Channel
- 7.1 Segment Overview
- 7.1.1 Volume & Revenue Split by Channel (2024 & 2032) (Volume Where Applicable)
- 7.1.2 Channel Mix Evolution (2024-2032)
Chapter 8. Regional Market Analysis – Global Overview
- 8.1 Global Regional Overview
- 8.1.1 Regional Volume Share (Volume Where Applicable)
- 8.1.2 Regional Revenue Share
- 8.1.3 Regional Volume by Region (Volume Where Applicable)
- 8.1.4 Regional Revenue by Region
- 8.1.5 Regional Forecast Through 2032
- 8.2 Cross-Regional Segment Analysis
- 8.2.1 By Sales & Delivery Channel
- 8.2.2 By Competitive Positioning & Price Tier
Chapter 9. North America Rare Disease Treatment Market
- 9.1 United States
- 9.2 Canada
- 9.3 Mexico
Chapter 10. Europe Rare Disease Treatment Market
- 10.1 Germany
- 10.2 France
- 10.3 Italy
- 10.4 United Kingdom
- 10.5 Spain
- 10.6 Poland
- 10.7 Russia
- 10.8 Netherlands
- 10.9 Belgium
- 10.10 Sweden
- 10.11 Denmark
- 10.12 Norway
- 10.13 Rest of Europe
Chapter 11. Asia Pacific Rare Disease Treatment Market
- 11.1 China
- 11.2 India
- 11.3 Japan
- 11.4 South Korea
- 11.5 Thailand
- 11.6 Indonesia
- 11.7 Vietnam
- 11.8 Malaysia
- 11.9 Australia
- 11.10 Rest of Asia Pacific
Chapter 12. Latin America Rare Disease Treatment Market
- 12.1 Brazil
- 12.2 Argentina
- 12.3 Colombia
- 12.4 Chile
- 12.5 Rest of Latin America
Chapter 13. Middle East Rare Disease Treatment Market
- 13.1 Saudi Arabia
- 13.2 United Arab Emirates
- 13.3 Turkey
- 13.4 Israel
- 13.5 Iran
- 13.6 Rest of the Middle East
Chapter 14. Africa Rare Disease Treatment Market
- 14.1 South Africa
- 14.2 Egypt
- 14.3 Nigeria
- 14.4 Morocco
- 14.5 Rest of Africa
Chapter 15. Rare Disease Treatment Company Profiles
- 15.1 [Company 01]
- 15.1.1 Company Overview
- 15.1.2 Key Management Personnel
- 15.1.3 Products & Services Portfolio
- 15.1.4 Financial Performance
- 15.1.5 Key Market Focus & Geographic Presence
- 15.1.6 Recent Developments & Strategic Initiatives
Note: The company profile list is preliminary and may change based on research findings, market developments, data availability, and client requirements.
Chapter 16. Appendices
- Appendix A – List of Abbreviations & Acronyms
- Appendix B – Industry Classification Code Reference – Full Series
- Appendix C – Supply, Output & Operating Capacity Data Tables
- Appendix D – End-Use & Demand Base Tables
- Appendix E – Demand, Adoption & Usage Assumptions
- Appendix F – Pricing & Revenue Metric Reference Tables
- Appendix G – Company Operations & Infrastructure Database
- Appendix H – Cross-Border Trade & Activity Data Tables (Where Applicable)
- Appendix I – Regulatory Summary Tables
- Appendix J – Primary Research Participant List (Anonymized)
- Appendix K – Primary Research Questionnaire Framework
- Appendix L – Data Sources & Bibliography
- Appendix M – Market Size Divergence & Source Comparison
Chapter 17. Research Methodology
- 17.1 Research Framework & Philosophy
- 17.2 Secondary Research – Sources, Hierarchy & Data Extraction
- 17.3 Data Modeling – Bottom-Up & Top-Down Market Sizing
- 17.4 Primary Research – Stakeholder Framework, LOI & Sample Sizes
- 17.5 Forecast Methodology – Regression, Scenario & Sensitivity Analysis
- 17.6 Quality Control – Four-Layer Validation Framework
- 17.7 Limitations & Standard Assumptions
- 17.8 Disclaimer
